

Translate this page into:
The efficacy of sono-electro-Fenton process for removal of Cefixime antibiotic from aqueous solutions by response surface methodology (RSM) and evaluation of toxicity of effluent by microorganisms
⁎Corresponding authors at: Department of Environmental Health Engineering, School of Public Health, Ardabil University of Medical Sciences, Ardabil, Iran. mvn_20@yahoo.com (Mehdi Vosoughi), a.dargahi29@yahoo.com (Abdollah Dargahi)
-
Received: ,
Accepted: ,
This article was originally published by Elsevier and was migrated to Scientific Scholar after the change of Publisher.
Peer review under responsibility of King Saud University.
Abstract
The increasing use of antibiotics by humans and their persistence in the environment leads to the development of drug resistance, which is nowadays considered as an environmental problem. The aim of this study was to determine the efficacy of sono-electro-Fenton process for removal of Cefixime antibiotic from aqueous solutions by Response Surface Methodology (RSM) and to evaluate the toxicity of effluent by microorganisms. In the present study, the degradation of synthetic wastewater containing Cefixime was investigated in a reactor (with a useful volume of 1 L) located in the chamber of the ultrasonic device. The effects of pH, hydrogen peroxide concentration, voltage, initial antibiotic concentration, and electrolysis time were investigated using the Box-Behnken model, and the optimal conditions for elimination were obtained by analyzing the variance. The performance of the electro-Fenton and ultrasonic process was evaluated separately and in combination under optimal conditions. Toxicity of inlet and outlet was tested by Escherichia coli and Staphylococcus aureus, and growth inhibition percentage was calculated. The intermediates were determined by LC-MS with the lowest molecular mass. The results showed that the sono-electro-Fenton process under optimum conditions, including pH of 3.07, hydrogen peroxide concentration of 0.85 mL/L, voltage 15 V, initial antibiotic concentration 10.4 mg/L and electrolysis time of 81.5 min has a percentage of removal of 97.5%. Under optimum conditions, the percentage of removal by electro-Fenton and ultrasonic separately were 81.7% and 9%, respectively, and in the hybrid process of sono-electro-Fenton, the percentage of removal increased to 97.5%. The results also showed that the biological toxicity of the outlet effluent from the sono-electro-Fenton process, compared to the inlet solution, was significantly reduced. So, we conclude that the Sono-electro-Fenton process has a significant effect on the removal of Cefixime from aqueous solutions and can also significantly reduce the biological toxicity of the effluent.
Keywords
Electro-Fenton
Sono-electro-Fenton
Cefixime
Antibiotic
Toxicity
RSM

1 Introduction
Today, medicinal compounds are commonly used to treat many diseases in humans, animals, and other organisms. These compounds have been recognized as emerging pollutants in the water for the last three decades (Shokoohi et al., 2017). Antibiotics are widely used in medicine, veterinary medicine, and animal feed as growth promoters so that 15% of all medicines used worldwide are dedicated to antibiotic (Yola et al., 2014). Hospitals are one of the main sites for the production of pharmaceutical effluents due to the high consumption of antibiotics (Seifrtova et al., 2009). One of these antibiotics is Cefixime, which is a class of cephalosporins and is used to treat infections such as the upper and lower respiratory tract, nasal ear, paranasal sinuses, and urinary tract (AHmadi et al., 2011; Fakhri and Adami, 2014). In addition, Cefixime can be used effectively against various bacterial organisms and infections, including staphylococci, haemophilus influenzae, Escherichia coli, etc. (Jain et al., 2010). Therefore, due to its high use in society, it plays an important role in environmental pollution and, even at low concentrations, may lead to bacterial resistance to treatment and drugs (Elmolla and Chaudhuri, 2010). Antibiotics, due to inadequate treatment in wastewater treatment plants, contaminate the receiving waters, including rivers and lakes, and ultimately create hazards to the aquatic ecosystem (Yazdanbakhsh et al., 2012). The persistence and non-degradability of antibiotics in the environment (surface and groundwater, drinking water, municipal sewage, and soil) lead to the bioaccumulation of these drug compounds and, ultimately, to bacterial resistance. This is a major concern worldwide and poses a serious threat to human health and the environment (Seifrtova et al., 2009; Yazdanbakhsh et al., 2012). Therefore, it is necessary to remove these pollutants from aqueous solutions to protect the environment and public health.
So far, many lab-scale physical, chemical and biological methods such as adsorption by activated carbon (Rivera-Utrilla et al., 2009), membrane and ozonation processes (Garoma et al., 2010), ultraviolet radiation in the presence of sulfate peroxide (Rasoulifard et al., 2015), bionanocomposite method (Zavareh and Eghbalazar, 2017), ultrasonic/photo-oxidation (Almasi et al., 2016b) and electrochemical methods (Hincapié-Mejía et al., 2020) have been utilized for removal of antibiotics from aqueous solution and their effects. Each of these methods has its limitations and disadvantages. In the adsorption by activated carbon, the pollutant is transferred from one phase to the other after concentration, but it is not practically eliminated (Shemer et al., 2006). Also, the membrane process is associated with issues such as operation and maintenance problems, clogging of filters, and high maintenance and investment costs (Garoma et al., 2010). In the meantime, advanced oxidation processes (AOPs) have attracted much attention in the last decade. Advanced oxidation processes are processes based on the production of hydroxyl free radicals and are highly efficient in the removal of organic matter due to their high oxidation potential and the non-selectivity of the type of contaminant (Kestioğlu et al., 2005; Yazdanbakhsh et al., 2012). One of the most common methods, among advanced oxidation processes, is the electro-Fenton method.
In the electro-Fenton process, through the coupling of electrochemistry and Fenton’s reaction, one of the EAOPs is employed to react with the pollutants (Aboudalle et al., 2018; Akyol et al., 2013; Brillas et al., 2019; Colades et al., 2020; Kamagate et al., 2018; Rezgui et al., 2018). Ting et al. classified the electro-Fenton process into four categories as follows: Type 1) sacrificial iron anode is used as a ferrous ion source, while hydrogen peroxide is externally added; Type 2) ferrous ion is externally applied, and hydrogen peroxide is generated by an oxygen-sparging cathode; Type 3) hydrogen peroxide and ferrous ion are electro-generated using an oxygen-sparging cathode and a sacrificial anode, and Type 4) Fenton’s reagent (Fe2+, H2O2) is added to produce hydroxyl radicals in the electrolytic cell, and ferrous ion is regenerated via the reduction of ferric ion on the cathode (Ting et al., 2008). In the present study, Fe2+ was in situ generated at the iron anodes, and hydrogen peroxide was added externally. The advantages of the electro-Fenton process include low cost (Stirling et al., 2020), high efficiency, simple technology, easy operation, and low toxicity of reactants (Homem et al., 2010). The main function of the electro-Fenton process with iron electrodes in the presence of H2O2 is summarized in the following reactions)Eqs. (1)–(4)) (Al-Musawi et al., 2019; Oturan et al., 2008):
On the other hand, the combined use of the electro-Fenton process with other advanced oxidation methods has led to better results in the removal of contaminants. One of these processes is ultrasonic (US); the mechanism of US is the physical decomposition of pollutants based on the creation of cavities or microbubbles that are the result of acoustic cavitation in water. These cavities give rise to hydroxyl radicals and hydrogen radicals, and eventually, the reaction of hydrogen radicals with oxygen creates hydroperoxide radicals (Eqs.)5(and)6() (Li et al., 2013).
In addition, the combination of the electro-Fenton with the ultrasonic process, called sono-electro-Fenton, will lead to an increase in the clean the electrode surface, adaptability to the environment and ultimately increase the percentage of removal due to the chemical and physical reaction created (Ranjit et al., 2008).
Toxicity assessment is used to determine the reaction of aquatic organisms for measurement of the impact of one or more toxins, wastewater, or environmental factors alone and together. The lower toxicity of an aqueous solution is led to achieving the better the growth conditions for aquatic organisms. Since the use of microorganisms for bioassay, in addition to its simplicity of operation and high practical value, requires fewer laboratory facilities and costs, this method has been used in this research (Ashrafi et al., 2013; Catterall et al., 2010).
Recently, the statistical models have been found to be useful for the optimization of different processes in removing pollutants. One of these statistical models for experimental design is the response surface methodology (RSM). Determination of optimal theoretical conditions, lower number of trials, interactions of variables, and determination of the final elimination formula have been advantageous (Wu et al., 2012). Various studies have been performed to remove contaminants from aqueous solutions by surface-response methodology (Almasi et al., 2019; Eslami et al., 2016). Thus, since there has been no report for removal of Cefixime antibiotic by the sono-electro-Fenton process, this study aimed to evaluate the efficiency of the sono-electro-Fenton process for removal of Cefixime antibiotic using Box-Behnken Design (BBD) under different conditions. Cefixime degradation studies performed to determine the biological toxicity changes to the microorganisms. Liquid chromatography-mass spectrometry (LC-MS) analysis was also used to determine the intermediates of Cefixime degradation.
2 Material and methods
2.1 Material
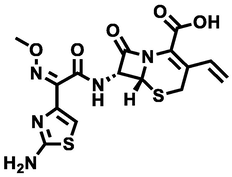
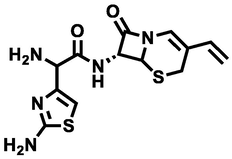
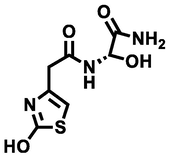
Cefixime antibiotic powder (the purity of > 98%) was provided by Sigma Company. The chemical properties of the Cefixime are shown in Fig. 1 (Rasoulifard et al., 2015). Hydrogen peroxide (30%, w/v) was purchased from Merck Company. Also, for the regulation of pH of the solution containing Cefixime antibiotic, H2SO4 and NaOH, with a purity of 98%, were purchased from Merck Company, Germany. Standard strains of Escherichia coli and Staphylococcus aureus were prepared from the Microbiology Laboratory of Ardabil University of Medical Sciences. The lactose broth culture medium for bioassay with microorganisms was provided by Pronadisa Company, Spain.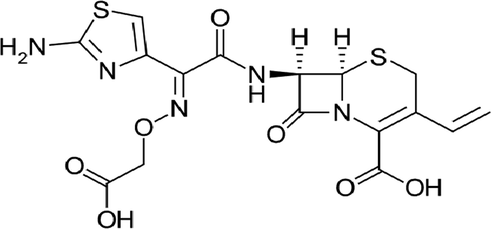
Molecular structure of cefixime antibiotic.
2.2 Description of the sono-electro-Fenton experiments:
The present work was an experimental-lab scale study. In this study, a 1-liter cylindrical reactor with two iron electrodes (one as a cathode and the other as an anode) with dimensions of 180 × 20 × 2 mm was used to perform the process. The distance between these electrodes was 2 cm, and they were connected to the DC supply (Dazheng-PS-302D model). The sample volume in the reactor was 1 L. The reactor was placed in the ultrasonic chamber with a fixed frequency of 37 kHz, and an appropriate volume of water was poured into the ultrasonic chamber. The schematic of the reactor used is shown in Fig. 2. Independent variables of this study included pH (3–11), hydrogen peroxide (0.05–0.85 mL/L), voltage (5–15 V), initial concentration of Cefixime (10–50 mg/L), and time (15–90 min). In order to conduct the experiments, the pH of the solution was adjusted, and a certain amount of hydrogen peroxide was added to the solution. After completion of the reaction time, the sample was centrifuged by a centrifuge for 4 min at 30,000 rpm and was prepared to measure residual antibiotic concentration after passing through a 0.45-µm filter. Then, the residual concentration of Cefixime was determined by the spectrophotometer (DR-5000 model, manufactured by HACH, Germany) at 288 nm. The estimation of accuracy and validity of the observed data was evaluated using the high-performance liquid chromatography (HPLC) Agilent 1260 infinity (Agilent Technologies Co. Ltd., USA). HPLC was employed under following conditions: the mobile phase = a mixture of tetrabutylammonium hydroxide and acetonitrile (25:75 v/v, HPLC grade, Merck), flow rate = 1 mL/min, and temperature = 25 °C. Chemical oxygen demand (COD) was determined according to the dichromate standard method (Aboudalle et al., 2018; Federation and Association, 2005). Finally, the efficiency of Cefixime antibiotic removal was obtained from Eq. (7) (Takdastan et al., 2016).
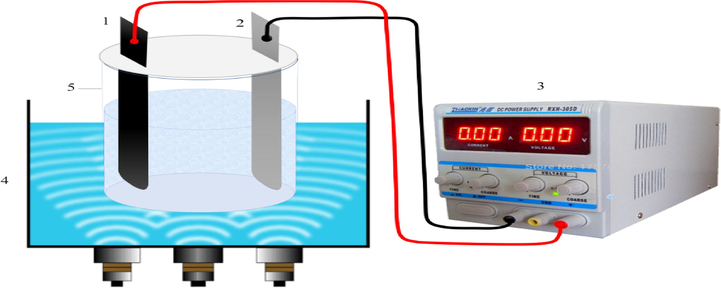
Schematic of the Sono-electro-Fenton Reactor. 1) Anode, 2) Cathode, 3) DC power, 4) Ultrasonic chamber and 5) Sample tank.
In this equation C0 and Ct are the initial and final concentration of cefexime antibiotic in solution (in mg/L), respectively.
2.3 Experimental design
In this study, RSM with the Box-Behnken model using Design-Expert 7.0.0 software was used to determine the optimal conditions and effects of independent variables and the interaction between these variables on response performance (Cefixime antibiotic removal efficiency). This study was designed in three levels (-1, 0, +1) with five factors, including pH (A), H2O2 (B), voltage (C), initial antibiotic concentration (D), and electrolysis time (E), according to Table 1. The number of experiments in this study was obtained using Equation (8); thus, one central composite design with six repetitions at the central point and a total of 46 experiments were obtained in this study. The performance of the quadratic polynomial model was expressed by the correlation coefficient (R2) and adjusted correlation coefficient (R2 adjusted); the significance of each sentence was expressed by the regression equation, and significant expressions were identified for each response by ANOVA.
Independent variables
signs
Unit
−1
0
+1
pH
A
–
3
7
11
H2O2
B
mL/L
0.05
0.45
0.85
Voltage
C
V
5
10
15
Initial concentration of Cefixime
D
mg/L
10
30
50
Reaction time
E
min
15
52.5
90
In this equation, N is the number of experiments, K is the number of independent variables, and C is the number of central points.
To better understanding the Box-Behnken (BBD) results, the calculation of the percentage effect of each independent variable (Pi) on the removal of Cefixime was carried out by Pareto analysis (Eq. (9)):
2.4 Toxicity assessment
For toxicity assessment, the bioassay using microorganisms was applied. Escherichia coli standard strain (ATCC25922) and Staphylococcus aureus standard strain (ATCC 6538) were used for toxicity assessment. The these strains were employed because they are common in sewage and aquatic environments (Federation and Association, 2005). The test procedure was as follows: the broth lactose medium was first prepared according to the standard method instructions (Droste and Gehr, 2018). Then, 40 test tubes were prepared for each bacterium (10 mL lactose broth culture in each tube) which, by considering 3 repetitions, a total of 120 test tubes containing lactose broth was prepared, and then were sterilized in the autoclave (121 °C, 15 PSI, 15 min). In the next step, Escherichia coli were cultured on EMB agar medium and Staphylococcus aureus on nutrient agar medium, and they were then incubated (37° C for 24 h). For each microbe, 5 tubes were employed to test the toxicity of the inlet solution at optimal conditions (containing 10 mL of culture medium + 1 mL of reactor inlet + 1 microbe loop); 5 tubes were used to test reactor outlet toxicity under optimal conditions (containing 10 mL of culture medium + 1 mL reactor outlet + one loop of microbe), and 5 tubes were considered as controls (containing 10 mL culture medium + one loop of microbe). Also, 5 control tubes (broth lactose culture medium only) were used to zero out the spectrophotometer at 600 nm. The test tubes were incubated at 37 °C. After every 2 h and after zeroing out the spectrophotometer with sterile lactose broth, absorbance of three samples, i.e., tube containing inlet, outlet, and control solution, was read by the device. The absorbance reading continued in 5 steps for 10 h.
Finally, the growth inhibition percentage of inlet and outlet solution for each bacterium was obtained by Eq. (10):
In this equation, GI% is the growth inhibition percentage. OD600S and OD600B in the optical density of sample and control at 600 nm, respectively.
2.5 Examination of intermediate compounds under optimum conditions:
The LC/MS (Liquid chromatography-mass spectrometry, Shimadzu LC-MS 2010 A) system equipped with a C18 column (100 mm × 2.1 mm) and an electron spray ionization source were employed to determine and analyze the intermediates. The mobile phase for the analysis was 60/40% acetonitrile/ ultra-pure water + 0.1% formic acid. Mass spectra (MS) was accomplished under following conditions: Mode, ESI+; Detection gain,1.8 kV; Prob Volt, 4 kV; CDL Volt, 25 V; Gas nebulizer, N2 (grade 5); Flow gas, 1.2 L/min; CDL temperature, 250 °C and Block temperature, 250 °C.
3 Results and discussion
3.1 Statistical analysis of the Box-Behnken design
A Box-Behnken design (BBD) was used to optimize the Cefixime removal in the sono-electro-Fenton process. Five major independent variables used in this study based on preliminary experiments include pH, electrolysis time, H2O2 concentration, and voltage. The experimental range and levels of independent variables studied for Cefixime removal at three levels are shown in Table 1. The values of the variables and their variation limits were selected based on preliminary experiments. During these experiments, the Cefixime removal was used to evaluate the effectiveness of the process. Table 2 shows the experimental conditions, according to the factorial design. The results of ANOVA for Cefixime removal by the sono-electro-Fenton process and the significance of the quadratic model were presented in Table 3. If the value is (P < 0.05), the model is significant. According to Table 3, P-Value (P < 0.0001) indicates the significance of the model and the interaction of variables on response performance (Cefixime removal). On the other hand, the F-Value of 49.99 indicates the significance of the variance of each variable against the error variance. The pH factor with the highest F-value of 294.99 plays an important role compared to other variables. Also, the correlation coefficient (R2 = 0.97) is in accordance with the adjusted correlation coefficient (R2adjusted = 0.95) and is reasonable and desirable for the proposed model. On the other hand, the proximity of the value to 1 indicates the greater obedience of data from the quadratic model. Therefore, the modified quadratic model fits the data well (Myers et al., 2016). Lack of Fit describes the difference between the predicted values with the observed values and the repetition of actual values errors, and the model is meaningful when it is not well fitted. In other words, the meaning of lack of fit is a good predictor of the model. In this study, Lack of Fit was not significant (Almasi et al., 2016a). The coefficient of variation (CV) is a criterion for describing the range of data variations, and the maximum acceptable value for the proposed model to be satisfactory is 10%. The coefficient of variation in this study is 8.80%, according to Table 3 (Wu et al., 2012; Zhu et al., 2011). Finally, after eliminating non-meaningful expressions by the proposed model, Equation 11 was obtained by the quadratic polynomial model for the removal of cefixime.
Run
A: pH
B: H2O2 (mL/L)
C: voltage (V)
D: Concentration (mg/L)
E: Time (min)
Removal (%)
Actual Value
Predicted Value
1
7
0.85
10
10
52.5
85.40
86.09
2
7
0.05
10
50
52.5
48.90
49.76
3
3
0.45
10
30
15
62.70
64.53
4
7
0.45
10
30
52.5
65.50
66.85
5
7
0.45
15
30
15
53.10
54.88
6
7
0.45
15
10
52.5
76.00
76.54
7
3
0.05
10
30
52.5
58.50
59.69
8
7
0.05
10
30
15
35.40
35.98
9
7
0.45
10
30
52.5
65.50
66.85
10
7
0.05
10
10
52.5
37.80
38.41
11
11
0.45
5
30
52.5
19.80
18.23
12
7
0.45
5
30
15
13.60
14.31
13
3
0.45
5
30
52.5
82.10
82.79
14
7
0.85
10
50
52.5
74.20
75.14
15
7
0.45
10
30
52.5
65.50
66.85
16
7
0.45
5
30
90
64.90
66.72
17
11
0.45
10
50
52.5
50.20
51.27
18
7
0.05
10
30
90
38.10
39.19
19
11
0.45
10
30
15
27.70
28.66
20
11
0.45
10
30
90
63.60
61.88
21
7
0.45
15
50
52.5
90.10
88.84
22
3
0.45
15
30
52.5
91.40
92.07
23
7
0.45
10
10
15
17.40
18.52
24
7
0.05
15
30
52.5
42.70
43.13
25
7
0.85
5
30
52.5
68.60
69.98
26
3
0.45
10
50
52.5
90.10
89.63
27
7
0.45
10
30
52.5
65.50
65.85
28
3
0.45
10
30
90
89.20
88.34
29
7
0.45
10
30
52.5
65.50
66.85
30
11
0.05
10
30
52.5
12.70
14.48
31
3
0.45
10
10
52.5
86.50
88.23
32
11
0.45
15
30
52.5
59.90
60.31
33
7
0.45
15
30
90
88.60
89.49
34
7
0.85
15
30
52.5
95.90
97.25
35
7
0.85
10
30
90
90.40
91.02
36
7
0.45
10
50
15
48.80
55.67
37
7
0.45
5
10
52.5
1.40
1.96
38
7
0.45
10
50
90
89.30
88.23
39
7
0.05
5
30
52.5
54.60
55.05
40
7
0.45
10
30
52.5
65.50
66.85
41
7
0.45
10
10
90
79.80
78.98
42
11
0.45
10
10
52.5
17.00
18.27
43
3
0.85
10
30
52.5
94.50
96.17
44
7
0.45
5
50
52.5
63.30
65.06
45
7
0.85
10
30
15
37.10
38.21
46
11
0.85
10
30
52.5
58.80
58.06
Source
Sum of squares
Df
Mean square
F-value
p-value
status
Other statistical indicators
Model
26634.38
20
1331.72
49.99
< 0.0001
significant
R2 = 0.97
R2 Adj = 0.95
R2 pred 0.90
Mean = 58.66
SD = 5.16
CV = 8.80%
AP = 27.9
A-pH
7858.38
1
7858.38
294.99
< 0.0001
B-H202
5761.57
1
5761.57
216.28
< 0.0001
C-VOLT
2848.36
1
2848.36
106.92
< 0.0001
D-CONC
726.30
1
726.30
27.26
< 0.0001
E-Time
6331.78
1
6331.78
237.69
< 0.0001
AB
25.50
1
25.50
0.9573
0.3372
AC
237.16
1
237.16
8.90
0.0063
AD
182.25
1
182.25
6.84
0.0149
AE
113.32
1
113.32
4.25
0.0497
BC
213.16
1
213.16
8.00
0.0091
BD
228.46
1
228.46
8.58
0.0072
BE
902.70
1
902.70
33.89
< 0.0001
CD
467.86
1
467.86
17.56
0.0003
CE
62.41
1
62.41
2.34
0.1384
DE
273.74
1
273.74
10.28
0.0037
A2
0.2131
1
0.2131
0.0080
0.9295
B2
129.05
1
129.05
4.84
0.0372
C2
7.02
1
7.02
0.2636
0.6121
D2
10.35
1
10.35
0.3883
0.5388
E2
307.02
1
307.02
11.53
0.0023
Residual
665.98
25
26.64
Lack of Fit
631.20
20
31.56
4.54
0.0505
Not significant
Pure Error
34.78
5
6.96
Core Total
27300.36
45
In equation (11), the positive effect reveals the fact that increasing the factor level directly affects the Cefixime removal and results in its increase. Nonetheless, the negative effect of the factor indicates that enhancing the factor level increases does not affect efficiency. The coefficients of the factors in the above equation (11) disclose the importance of each parameter; based this, the pH had the highest importance in the removal of Cefixime. Fig. 3 shows the Pareto graphic analysis and proposes that the pH (A) variable is the most important factor in Cefixime with 14.17.
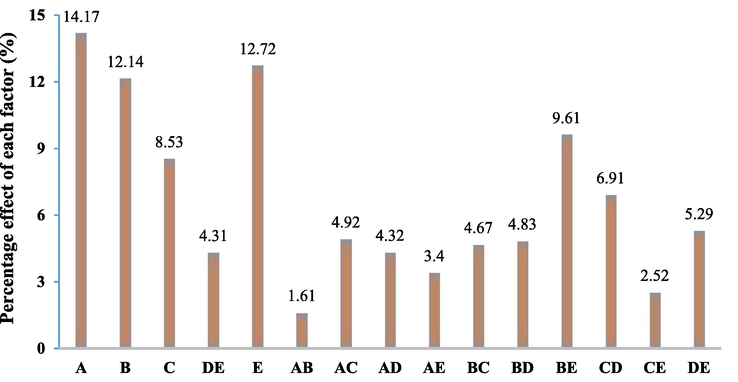
Pareto chart of the main effects obtained from the screening experiments for removal of Cefexime antibiotic.
In Eq. (11), A represents pH; B is hydrogen peroxide; C represents voltage; D is initial Cefixime concentration, and E is electrolysis time.
3.2 The effect of independent variables
3.2.1 Effect of pH
In advanced oxidation processes such as electrochemical methods, pH plays an important role in the removal of pollutants. As shown in Fig. 4a, the percentage of Cefixime removal was decreased by increasing pH, so that a higher removal percentage was achieved at acidic pH. At pH = 3, the optimum percentage of Cefixime removal reached 94.5% after 52.5 min (Table 2). At acidic pH, the soluble fraction of the ferrous ion is higher, which results in the decomposition of hydrogen peroxide, and consequently, in the production of hydroxyl radicals. It finally leads to increasing the oxidizing power of hydroxyl radical at the acidic condition and more degradation percent in Cefixime molecules in aqueous solution. The maximum percentage removal of sono electro-Fenton process in the removal of Cefixime attained at pH = 3; this event can be explained by the continuous release of Fe2+ through anodic scarification/oxidation (Eq. (12)) (Eiroa et al., 2005):
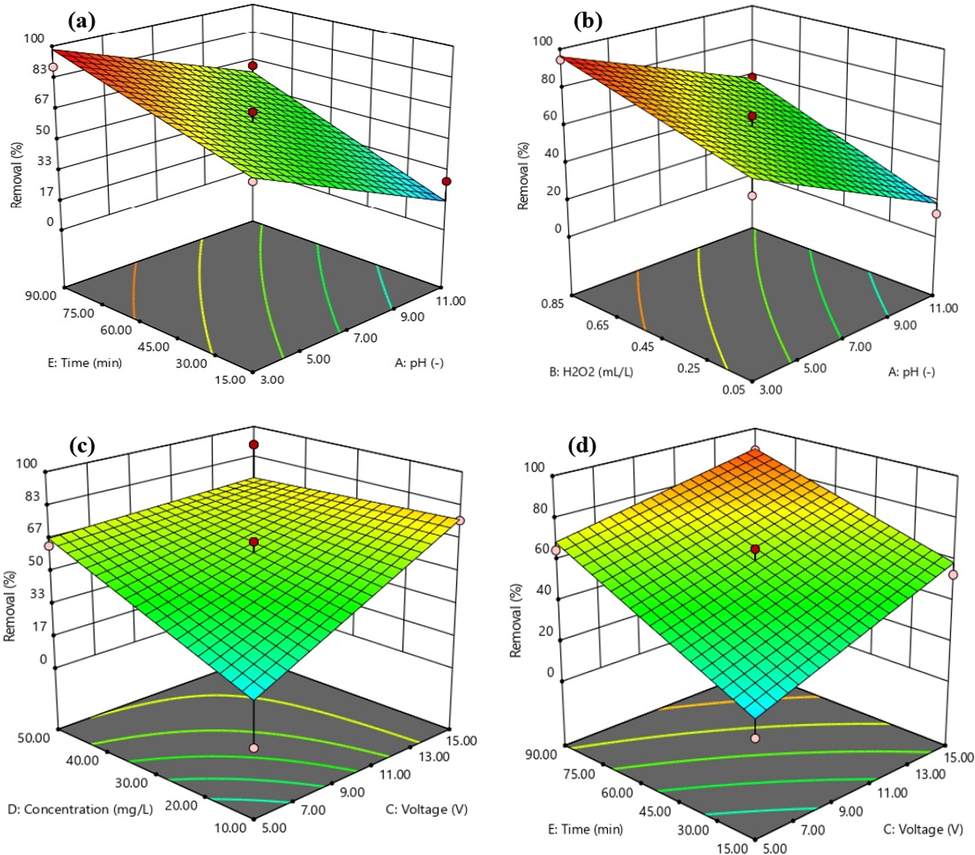
Response surface plot for of Sono-electro-Fenton process in cefixime removal.
Since the production of H° and OH° radicals is enhanced under ultrasonic effects, the percentage of Cefixime removal is remarkably increased (Zhai et al., 2018). Increasing the pH to values higher than 3 affects the degradation, which may be due to the formation of sludge (Fe3+). However, due to the addition of ultrasonic waves, it is possible to reduce Fe3+ to Fe2+ and generation of hydroxyl radicals, as shown in Eq. (13). Hydroxyl radicals produced in these reactions are employed for Cefixime removal at higher pH values. Hence, the sono-electro-Fenton process can be operated at pH values near the neutral range; this may lead to relieve the problems associated with the treatment of acidic effluent. Similar results were observed in studies that employed the ultrasonic for the degradation of various organic pollutants (Babuponnusami and Muthukumar, 2012; Ranjit et al., 2008). Ninomiya et al. also found similar results (Ninomiya et al., 2013). Achieving optimal pH (pH = 3) in this study was consistent with (Belghadr et al., 2015). The high percentage of pollutant removal in acidic pH was also demonstrated in the Sono-Electro-Fenton process in the study of (Babuponnusami and Muthukumar, 2012).
3.2.2 The effect of hydrogen peroxide concentration
The performance of the sono-electro-Fenton system was increased by the discontinuous addition of hydrogen peroxide, followed by the continuous production of hydroxyl radicals. Changes in hydrogen peroxide concentration on Cefixime removal efficiency are shown in Fig. 4b. By increasing the hydrogen peroxide concentration from 0.05 to 0.85 mL/L, the removal efficiency was enhanced. The results showed that maximum removal efficiency was 95.9% at a concentration of 0.85 mL/L (Table 2). The normal increase in hydrogen peroxide concentration, due to the reaction with ferrous ions, results in the production of hydroxyl radical and enhancement of oxidizing power. The radicals produced have greater access to pollutants over time and cause more pollutant degradation (Homem and Santos, 2011; Pratap and Lemley, 1998). According to the results of the present study, with increasing the concentration of hydrogen peroxide, the efficacy of removing Cefixime increased, which was consistent with the results of the study by Ahmadzadeh and Dolatabadi (Ahmadzadeh and Dolatabadi, 2018). Moreover, it has been emphasized that hydrogen peroxide plays an important role in the advanced oxidation of antibiotics, so that increasing hydrogen peroxide increases the percentage of removal, as stated in the study of Homem and Santos (Homem and Santos, 2011).
3.2.3 Effect of voltage
As shown in Fig. 4c, an increase in voltage has led to developing the efficiency of the sono-electro-Fenton process in the removal of cefixime. The removal efficiency was 1.4% at 5 V and electrolysis time of 52.5 min, while the removal efficiency increased to 76% at 15 V with the same exposure time. Voltage variations at the surface of the iron anode are critical factors in the generation of ferrous ion (Fe2+) in the sono-electro-Fenton process, and by increasing ferrous ion solubility, the oxidation potential increases, and the removal efficiency of pollutant develops (Seid Mohammadi et al., 2013; Zhou et al., 2007). The results of this study were consistent with the results of dye removal by the electro-Fenton process studied by Wang et al. (2008) and removal of herbicide by Martínez and Bahena (2009).
The presence of appropriate ferrous ion concentration is considered as a vital prerequisite in the electro-Fenton process, which has an important role in estimating the amount of electrically dissolved iron. For electro-Fenton experiments, the dissolution of iron from anode was calculated using the following form of Faraday’s law (Eq. (13)) (Gümüş et al., 2016).
Increasing the current density leads to enhance the amount of oxidized iron generated from the electrode and results in increasing the removal percentage. On the other hand, the applied voltage increase with increasing current density. The higher current densities, according to Faraday’s law, seems to accelerate anodic scarification and the generation of Fe2+ ions; this is the main element needed to run the Fenton reaction (Teymori et al., 2020). Determination of the ratio of the H2O2 added to the reaction cell to Fe released to the solution (H2O2/Fe(II)) verifies this deduction. According to the results, an increase in intensity of the current leads to decline the ratio of H2O2/ Fe2+. This ratio for voltages of 5, 10 and 15 V (equivalent to 0.03, 0.06 and 0.1 amps) was obtained to be 0.21, 0.11 and 0.062, respectively. The amount of H2O2 added to the reactor at all current densities was constant at 0.85 mL/L.
3.2.4 Effect of initial concentration of antibiotics
The initial concentration of antibiotics provides an important driving force to overcome all solute mass transfer resistance between aqueous and solid phases. The effect of initial Cefixime concentration on removal efficiency is shown in Fig. 4c. As the initial concentration of antibiotics increased, the removal efficiency was partially reduced, but at lower concentrations, the removal efficiency was at its maximum level. Rahmani et al. (2014) studied the Tinidazole removal from aqueous solution by sonolysis in the presence of hydrogen peroxide. Their results showed that the highest removal efficiency was observed for lower concentrations, which is consistent with the results of the present study. The reduction in Cefixime removal efficiency by increasing its concentration can also be due to two following reasons: 1) Due to the same conditions for all samples, the amount of hydroxyl radicals produced at each initial concentration of Cefixime was also equal, and thus, the percentage of Cefixime removal will be more for the samples with a lower concentration and 2) The production of intermediates at higher concentrations of Cefixime may also lead to competition between Cefixime molecules and intermediates for hydroxyl radicals, which results in reduce the percentage of removal (Xu et al., 2009).
3.2.5 Effect of electrolysis time
Electrolysis time is one of the factors influencing the performance of advanced oxidation processes. As shown in Fig. 4d, the process percentage of removal increased dramatically with increasing electrolysis time. The percentage of removal increased from 37.1% at 15 min to 90.4% at 90 min (Table 2). It can be stated that with increasing electrolysis time, the percentage of pollutant removal increases, which has been noted by Özcan et al. (2009). On the other hand, as the electrolysis time of the electrodes increases, more opportunities for ferrous ion production are provided, and as the ferrous ion solubility and reaction with hydrogen peroxide increase, the removal efficiency is increased (Babuponnusami and Muthukumar, 2012; Garcia-Segura et al., 2016).
3.3 The validation of the model
To check the quality of the proposed models, the graphs related to predicted response values versus actual values and the graphs of the normal distribution of data shown in Fig. 5 were used. As observed in Fig. 5a, the points are aligned in a straight line, and no deviation is observed in the data distribution, which is indicative of a high correlation and normal distribution between the residual values. Fig. 5b shows the scattering of the residuals against the given values, and since there is no particular trend associated with variance changes (increase or decrease), the variance is constant. Fig. 5c shows the independent scattering of the residuals. Since the sinusoidal trend is not observed in the independence of the residuals, it can be concluded that the selected model is suitable for data analysis. The results of Fig. 5d indicates that the proposed model for eliminating Cefixime with empirical data is reasonable (Ponnusami et al., 2007; Zazouli et al., 2013).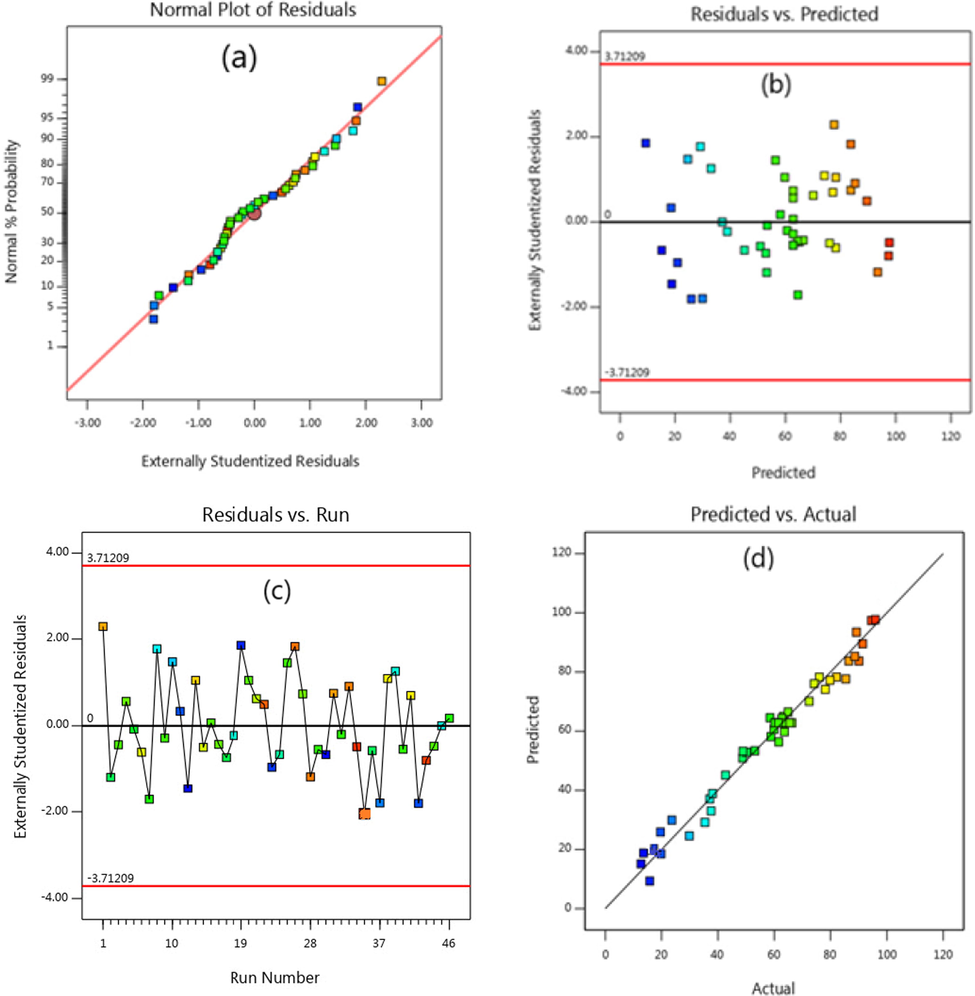
Distribution diagrams of predicted data versus actual values versus the proposed model.
3.4 Optimization of process
In this study, the optimization of independent variables, including pH, hydrogen peroxide concentration, voltage, initial antibiotic concentration, and electrolysis time, were investigated to determine the maximum Cefixime removal value. Different modes of fit to the experiments were evaluated to achieve optimal conditions by Box-Behnken model analysis, and finally, optimal conditions were presented based on Table 4. The Cefixime removal output is expected to be 97.5% under such optimum conditions, which is confirmed in empirical experiments under the same conditions. In various studies, the use of RSM for optimization of the proposed model and determination of the optimal factors has been efficient and effective (Azzaz et al., 2017; Karoui et al., 2020).
Factor
Low
High
Optimum
pH
3
11
3.07
H2O2 (mL/L)
0.5
0.85
0.85
Voltage (Volt)
5
15
15
Cefixime Concentration (m10g/L)
10
50
10.4
Time (min)
15
90
81.5
Optimum Value %
97.5%
3.5 Comparison of the effects of processes on Cefixime removal efficiency
As shown in Fig. 6, at this stage, the performance of ultrasonic, electro-Fenton processes and sono-electro-Fenton was studied under optimum conditions (pH = 3.07, H2O2 = 0.85 mL/L, voltage = 15 V, initial antibiotic concentration = 10.4 mg/L, and electrolysis time 81.5 min). As observed in the sono-electro-Fenton process, the maximum removal efficiency was 97.5%, while the maximum removal efficiency of the electro-Fenton and ultrasonic processes was 81.7% and 9%, respectively. Therefore, the process of sono-electro-Fenton has the greatest effect on the removal of Cefixime from aqueous solutions. In another study, Al‑Musawi et al. reported that the efficacy of antibiotic removal with the Sono-Fenton process reached 90%, which was consistent with the results of the present study (Al-Musawi et al., 2019). In another study, a high percentage of pollutant removal was also obtained in the sono-electro-Fenton process (Babuponnusami and Muthukumar, 2012).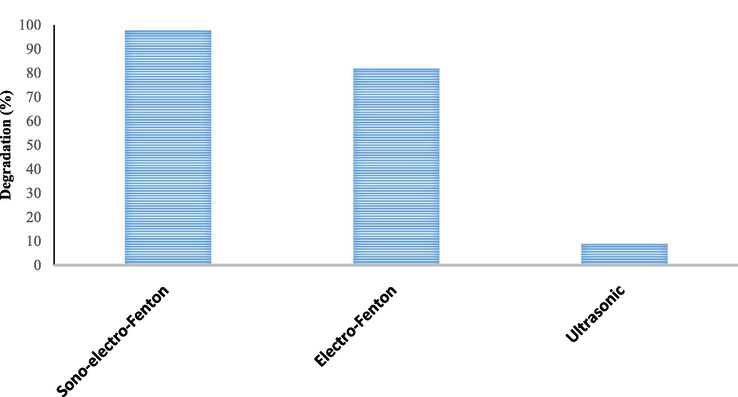
Investigation of electro-Fenton and ultrasonic processes and Sono-electro-Fenton under optimum conditions (pH = 3.07, H2O2 = 0.85 mL/L, voltage = 15 V, initial antibiotic concentration = 10.4 mg/L, and electrolysis time = 81.5 min).
Under optimal conditions, Eq. (14) was used to calculate the value of energy consumption (EC) as a function of treated solution volume for the Sono-Fenton process (Dargahi et al., 2019; Lanzarini-Lopes et al., 2017). The results showed that the EC for the three voltage (5, 10, and 15 V) was 0.2, 0.8, and 2.0 kwh/m3, respectively. According to the results, with increasing voltage, the percentage of cefixime removal increased, but the amount of energy consumed increased.
3.6 Results of toxicity assessment
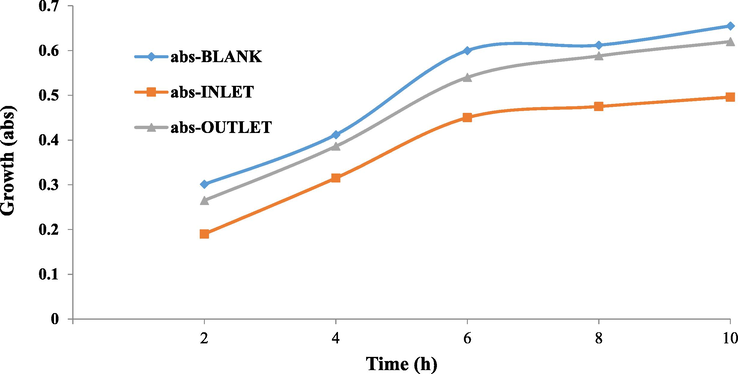
To determine the toxicity of the inlet and outlet effluent of the process, the toxicity bioassay was carried out by the microbial culture with selective Escherichia coli (Gram-negative) and Staphylococcus aureus (Gram-positive) microorganisms on the lactose broth medium, and the results were shown in Figs. 7 and 8. In Figs. 7 and 8, the growth rate of both bacteria in the control sample (blank) and the outlet effluent increased over 10 h, and the higher growth showed less toxicity, whereas the growth of bacteria in the inlet solution was low. Results of growth inhibitory effect of inlet solution and outlet effluent under optimum conditions in sono-electro-Fenton process (pH = 3.07, H2O2 = 0.85 ML/L, Voltage = 15, Initial Antibiotic Concentration = 10.4 mg/L, and Electrolysis time = 81.5 min) for Escherichia coli and Staphylococcus aureus bacteria were as shown in Table 5. As can be seen, the toxicity of the inlet solution decreased after treatment with the sono-electro-Fenton process. The average 10-h growth inhibition rate for Escherichia coli decreased from 70% toxicity for inlet solution to 9.3% toxicity for outlet solution (86.7% toxicity reduction). Moreover, for Staphylococcus aureus, the toxicity for inlet solution decreased from 25.3% to 7% for outlet solution (72.3% toxicity reduction). The findings of the study are consistent with the study conducted by Rahmani et al. (2015). In another study, the detoxification of industrial dye materials was investigated using a variety of gram-negative and gram-positive microorganisms, and its results were consistent with this study. Their results showed that the toxicity of the outlet effluent from the process was significantly reduced (Ashrafi et al., 2013). The higher inhibition growth percentage is led to the higher toxicity of the solution; this means that the outlet solution (effluent) released from the sono-electro-Fenton process is less toxic due to the lower growth inhibition percentage. Therefore, the sono-electro-Fenton process has led to a decrease in the biological toxicity of cefixime.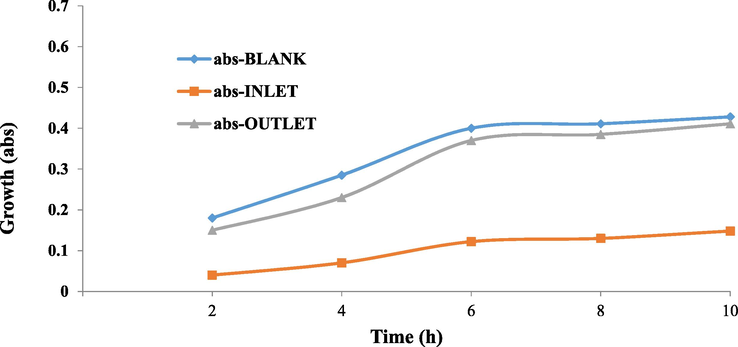
Growth trend of Escherichia coli (Gram-negative) in toxicity bioassay.
Growth trend of Staphylococcus aureus (Gram positive) in toxicity bioassay.
Growth inhibition percentage of Staphylococcus aureus
Growth inhibition percentage of Escherichia
Outlet effluent
Outlet effluent
Outlet effluent
Inlet solution
Time (h)
12
36.8
16.6
77.7
2
6.3
23.5
19.3
75.4
4
10
25
7.5
69.5
6
3.9
22.3
6.3
68.3
8
5.3
24.2
3.9
65.4
10
7
25.3
9.3
70
Average 10 h
Fenton’s technologies play an important role in effluent degradability and have been considered not only feasible water treatment technologies able to remove recalcitrant organic pollutants in low concentration but also promising pre-treatments of biological water treatment processes (Oller et al., 2011). Moreover, in Fenton-based processes, an increase in the H2O2 dose leads to the enhancement of effluent biodegradability indicator; this indicates that biodegradability is improved due to increasing in the proportion of biodegradable organic matter (González et al., 2007).
3.7 Chromatogram results of intermediates compounds obtained by LC-MS
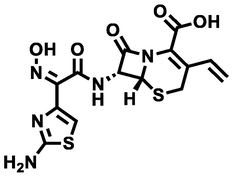
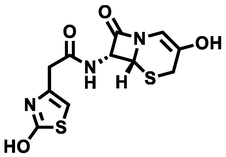
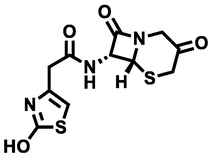
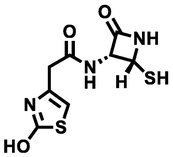
The intermediates resulted from the degradation of cefixime were identified by LC-MS (Fig. 9). Table 6 shows the structure and chemical names of the identified intermediates. Considering the results in Table 6 and Scheme 1, the first compound, after the loss of the carbon dioxide functional group, was converted to a compound with a molar mass of 409. Then, another carbon dioxide group is separated and the compound of 2-amino-2- (2-aminothiazol-4-yl) -N- ((7R) −8-oxo-3-vinyl-5-thia-1-azabicyclo [4.2.0] oct-2-en-7-yl) acetamide with molar mass of 307 is produced. By attacking the radical hydroxide species, this compound loses its ethylene group, and this ethylene group is replaced by an OH group. In the next step, the enol form is converted to ketone and is led to produce the N - ((6R, 7R) −3,8-dioxo-5-thia-1-azabicyclo [4.2.0] octan-7-yl) −2- (2- Hydroxythiazol-4-yl) with a molar mass of 313. After that, by attacking several radical groups, one of the rings break downs and results in the 2-(2-hydroxythiazol-4-yl) acetamide compound with a molar mass of 158. This compound is converted to thiazol-2-ol with a molar mass of 101 by loss of branching of the Thiozole ring (Table 6 and Scheme 1). Eventually, the ring-opening occurs and leads to producing carbon dioxide and water products.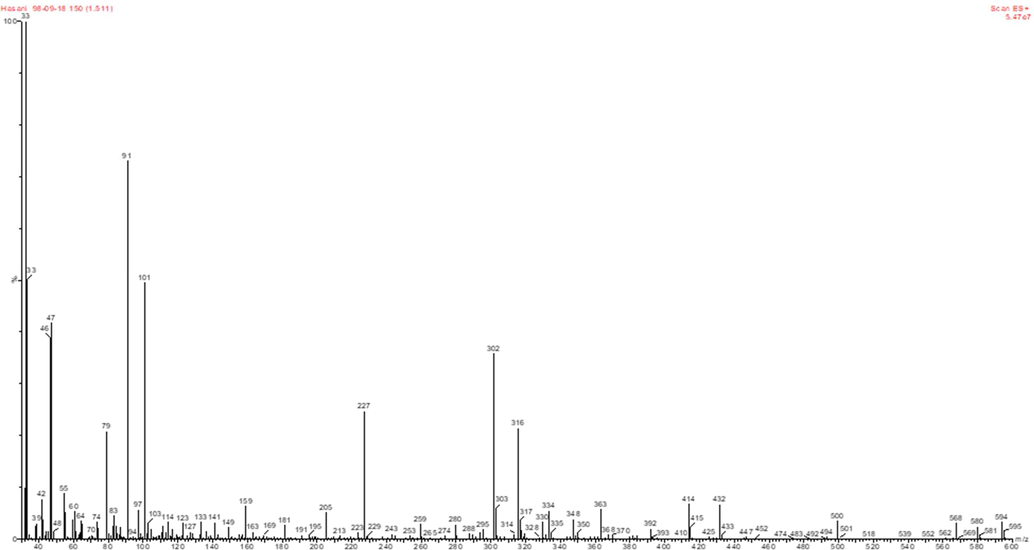
LC/MS chromatographs after degradation of Cefixime antibiotic at the optimum conditions.
Structure name
Structure
Molecular wieght
(6R,7R)-7-((Z)-2-(2-aminothiazol-4-yl)-2-(methoxyimino)acetamido)-8-oxo-3-vinyl-5-thia-1-azabicyclo[4.2.0]oct-2-ene-2-carboxylic acid
409
(6R,7R)-7-((Z)-2-(2-aminothiazol-4-yl)-2-(hydroxyimino)acetamido)-8-oxo-3-vinyl-5-thia-1-azabicyclo[4.2.0]oct-2-ene-2-carboxylic acid
395
2-amino-2-(2-aminothiazol-4-yl)-N-((7R)-8-oxo-3-vinyl-5-thia-1-azabicyclo[4.2.0]oct-2-en-7-yl)acetamide
337
N-((6R,7R)-3-hydroxy-8-oxo-5-thia-1-azabicyclo[4.2.0]oct-2-en-7-yl)-2-(2-hydroxythiazol-4-yl)acetamide
313
N-((6R,7R)-3,8-dioxo-5-thia-1-azabicyclo[4.2.0]octan-7-yl)-2-(2-hydroxythiazol-4-yl)acetamide
313
2-(2-hydroxythiazol-4-yl)-N-((2R,3R)-2-mercapto-4-oxoazetidin-3-yl)acetamide
295
(S)-N-(2-amino-1-hydroxy-2-oxoethyl)-2-(2-hydroxythiazol-4-yl)acetamide
231
N-(dihydroxymethyl)-2-(2-hydroxythiazol-4-yl)acetamide
204
2-(2-hydroxythiazol-4-yl)acetamide
158
4-(hydroxymethyl)thiazol-2-ol

131
thiazol-2-ol

101
(Z)-N-(hydroxymethyl)methanimidothioic acid

91
(Z)-N-methylmethanimidothioic acid

75
formimidic acid

45
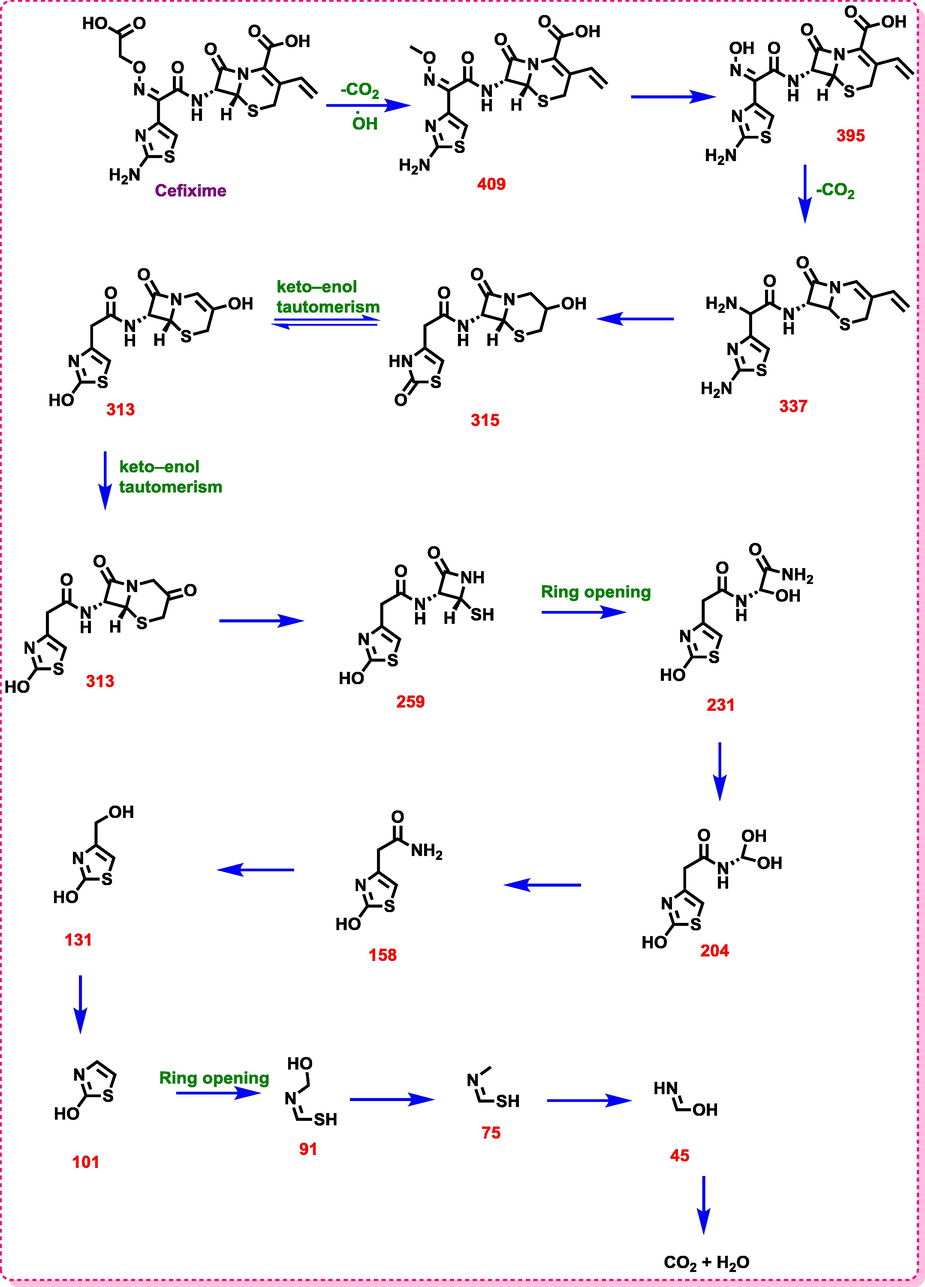
Proposed pathway for degradation of Cefixime antibiotic by the sono-electro-Fenton process.
The cefixime mineralization was studied by the degradation of this pollutant in terms of chemical oxygen demand test (COD) removal by the sono-electro-Fenton process under the optimum conditions (initial cefixime concentration of 10.4 mg/L, initial pH of 3, H2O2 concentration of 0.85 mL/L, and electrolysis time = 80 min) using iron anode. The COD shows the total quantity of oxygen required for the oxidation of organic matter to CO2 and water (Nasuhoglu et al., 2011). It was observed that 75.8% of COD was removed after 80 min reaction, while the degradation efficiency was as high as 91.5%. This is indicative of the high mineralization of cefixime in the sono-electro-Fenton process.
3.8 Kinetics studies
The kinetic models are used to study and to assess the speed of chemical reactions. The determination of the reaction rate for liquids and gases is performed in terms of concentration in unit time. The basis for explaining the reaction rate is the decrease in the concentration of the reactant in the unit of time or the increase in the concentration of a product in the unit of time (Samarghandi et al., 2018). In the present study, the pseudo-first-order kinetic model at the optimum condition achieved in previous stages was utilized to estimate the kinetics of the process. The following equation (Eq (15)) was used to calculate the pseudo-first-order model for cefixime removal:
In the above equation, [CEX]0 and [CEX]e are the initial and final concentrations of cefixime, respectively, and k indicates the constant of the removal value. The rate constant (k) is calculated by plotting Ln([CEX]0/[ CEX]t) versus electrolysis time (t). In addition, Eq (16) is employed to determine half-life (t1/2).
Fig. 10 and Table 7 show the results related to the evaluation of the CEX antibiotic degradation in optimum conditions by the first-order kinetic model. As observed, the regression coefficients (R2) of the first-order kinetic models were determined to be 0.9992. It indicates the suitability of the pseudo-first-order model (with a higher coefficient of correlation (R2)) in explanation of the data of cefixime degradation; this is consistent with the results of the Babuponnusami and Muthukumar (2012).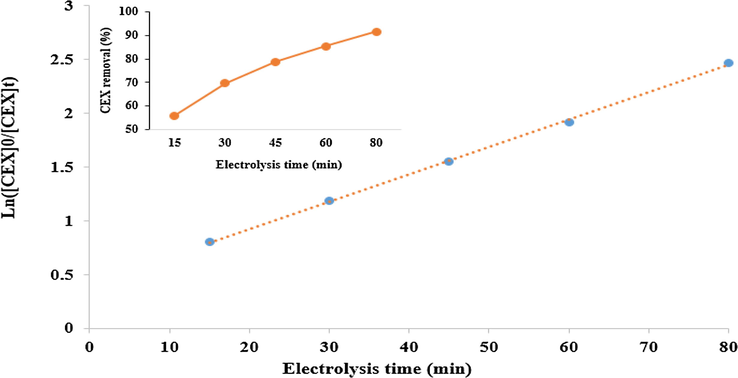
Kinetics of cefixime removal at the optimum conditions (antibiotic initial concentration = 10.4 mg/L, Voltage = 15 V, pH = 3, H2O2 concentration = 0.85 mM/L).
kinetics
k (min−1)
R2
t1/2 (min)
pseudo-first-order model
0.0253
0.9992
11.10
The parameters of the kinetics (Table 7) indicate the presence of a good linear relationship. Moreover, it is observed that the degradation of cefixime by sono-electro-Fenton process follows pseudo-first-order kinetic; this shows that the studied system has excellent potential for the degradation of cefixime. The rate constant (k) of the pseudo-first-order model for cefixime degradation using the sono-electro-Fenton process was 0.0253 min−1. In addition, the half-life (t1/2) of cefixime removal in the studied system was 27.4 min (Table 7).
4 Conclusion
According to the findings of this study, pH was the most effective variable in the sono-electro-Fenton process. The optimum pH value in this study was 3.07. In the studied process for removal of cefixime, the optimum conditions for pH, hydrogen peroxide concentration, voltage, initial cefixime concentration, and electrolysis time were 3.07, 0.85 mL/L, 15 V, 10.4 mg/L, and 81.5 min, respectively. In optimum conditions, the percentage of cefixime removal by the sono-electro-Fenton process was 97.5%. Since the removal efficiency of sono-electro-Fenton was higher than that of electro-Fenton and ultrasonic, it was selected as the most appropriate process. In addition, the toxicity of the outlet effluent treated by the sono-electro-Fenton process is reduced, compared to the inlet solution, and is led to better conditions for the growth of aquatic organisms. Moreover, experimental design methods such as response surface methodology are also effective tools to reduce the number of experiments and to reduce the cost of consumables. As well, since it determines the interaction between variables, it helps us to gain more knowledge about the effect of independent variables on dependent variables.
Acknowledgments
This article is the result of a research project approved by the Student Research Committee of Ardabil University of Medical Sciences. The authors would like to express their gratitude and appreciation to the Research deputy of the University for the Financial Support of the project and the respected officials of the Chemistry and Microbiology Laboratory of the School of Public Health for their cooperation.
References
- Reactive oxygen and iron species monitoring to investigate the electro-Fenton performances. Impact of the electrochemical process on the biodegradability of metronidazole and its by-products. Chemosphere. 2018;199:486-494.
- [Google Scholar]
- Effects of Cefixime on the Testis Structure and Pituitary-Gonadal Hormones in Adult Balb/C Mice. J Adv Med Biomed Res. 2011;19:54-62.
- [Google Scholar]
- Removal of acetaminophen from hospital wastewater using electro-Fenton process. Environ. Earth Sci.. 2018;77:53.
- [Google Scholar]
- A comparative study of electrocoagulation and electro-Fenton for treatment of wastewater from liquid organic fertilizer plant. Sep. Purif. Technol.. 2013;112:11-19.
- [Google Scholar]
- Optimization the effects of physicochemical parameters on the degradation of cephalexin in sono-Fenton reactor by using box-Behnken response surface methodology. Catal. Lett.. 2019;149:1186-1196.
- [Google Scholar]
- Removal of Penicillin G by combination of sonolysis and Photocatalytic (sonophotocatalytic) process from aqueous solution: process optimization using RSM (Response Surface Methodology) Electron. Physician. 2016;8:2878.
- [Google Scholar]
- Application of response surface methodology on cefixime removal from aqueous solution by ultrasonic/photooxidation. IJPT. 2016;8:16728-16736.
- [Google Scholar]
- Modeling of antibiotic degradation in sonophotocatalytic process, increasing biodegradability and process optimization by response surface methodology (RSM) Int. J. Environ. Sci. TE 2019:1-12.
- [Google Scholar]
- The enzymatic decolorization and detoxification of synthetic dyes by the laccase from a soil-isolated ascomycete, Paraconiothyrium variabile. Int. Biodeter. Biodegr.. 2013;85:173-181.
- [Google Scholar]
- Optimization of a cationic dye removal by a chemically modified agriculture by-product using response surface methodology: biomasses characterization and adsorption properties. Environ. Sci. Pollut.. 2017;24:9831-9846.
- [Google Scholar]
- Advanced oxidation of phenol: a comparison between Fenton, electro-Fenton, sono-electro-Fenton and photo-electro-Fenton processes. Chem. Eng. J.. 2012;183:1-9.
- [Google Scholar]
- The removal of the cefixime antibiotic from aqueous solution using an advanced oxidation process (UV/H2O2) Desalin. Water Treat.. 2015;55:1068-1075.
- [Google Scholar]
- Benchmarking recent advances and innovative technology approaches of Fenton, photo-Fenton, electro-Fenton, and related processes: A review on the relevance of phenol as model molecule. Sep. Purif. Technol.. 2019;237:116337
- [Google Scholar]
- A sensitive, rapid ferricyanide-mediated toxicity bioassay developed using Escherichia coli. Talanta. 2010;82:751-757.
- [Google Scholar]
- Electrochemically-driven dosing of iron (II) for autonomous electro-Fenton processes with in situ generation of H2O2. J. Electroanal. Chem.. 2020;856:113639
- [Google Scholar]
- Parameter optimization and degradation mechanism for electrocatalytic degradation of 2, 4-diclorophenoxyacetic acid (2, 4-D) herbicide by lead dioxide electrodes. RSC Adv.. 2019;9:5064-5075.
- [Google Scholar]
- Theory and practice of water and wastewater treatment. John Wiley & Sons; 2018.
- Simultaneous nitrification and formaldehyde biodegradation in an activated sludge unit. Bioresour. Technol.. 2005;96:1914-1918.
- [Google Scholar]
- Comparison of different advanced oxidation processes for treatment of antibiotic aqueous solution. Desalination. 2010;256:43-47.
- [Google Scholar]
- Optimization of sonochemical degradation of amoxicillin by sulfate radicals in aqueous solution using response surface methodology (RSM) J. Mol. Liq.. 2016;222:739-744.
- [Google Scholar]
- Adsorption and thermodynamic study of Cephalosporins antibiotics from aqueous solution onto MgO nanoparticles. J. Taiwan Inst. Chem. Eng.. 2014;45:1001-1006.
- [Google Scholar]
- Standard methods for the examination of water and wastewater. Washington, DC, USA: American Public Health Association (APHA); 2005.
- Garcia-Segura, S., Bellotindos, L.M., Huang, Y.-H., Brillas, E., Lu, M.-C.J.J.O.T.T.I.O.C.E., 2016. Fluidized-bed Fenton process as alternative wastewater treatment technology—A review. J. Taiwan Inst. Chem. Eng. 67, 211–225.
- Removal of sulfadiazine, sulfamethizole, sulfamethoxazole, and sulfathiazole from aqueous solution by ozonation. Chemosphere. 2010;79:814-820.
- [Google Scholar]
- Sulfamethoxazole abatement by photo-Fenton: toxicity, inhibition and biodegradability assessment of intermediates. J. Hazard. Mater.. 2007;146:459-464.
- [Google Scholar]
- Comparison of Fenton and electro-Fenton processes for oxidation of phenol. Process Saf. Environ. Prot.. 2016;103:252-258.
- [Google Scholar]
- Dataset on application of electrochemical and photochemical processes for sulfacetamide antibiotic elimination in water. Data Brief. 2020;29:105158
- [Google Scholar]
- Amoxicillin degradation at ppb levels by Fenton's oxidation using design of experiments. Sci. Total Environ.. 2010;408:6272-6280.
- [Google Scholar]
- Degradation and removal methods of antibiotics from aqueous matrices–a review. J. Environ. Manage.. 2011;92:2304-2347.
- [Google Scholar]
- Voltammetric determination of cefixime in pharmaceuticals and biological fluids. Anal. Biochem.. 2010;407:79-88.
- [Google Scholar]
- Activation of persulfate by irradiated laterite for removal of fluoroquinolones in multi-component systems. J. Hazard. Mater.. 2018;346:159-166.
- [Google Scholar]
- Synthesis of novel biocomposite powder for simultaneous removal of hazardous ciprofloxacin and methylene blue: Central composite design, kinetic and isotherm studies using Brouers-Sotolongo family models. J. Hazard. Mater.. 2020;387:121675
- [Google Scholar]
- Feasibility of physico-chemical treatment and advanced oxidation processes (AOPs) as a means of pretreatment of olive mill effluent (OME) Process Biochem.. 2005;40:2409-2416.
- [Google Scholar]
- Electrical energy per order and current efficiency for electrochemical oxidation of p-chlorobenzoic acid with boron-doped diamond anode. Chemosphere. 2017;188:304-311.
- [Google Scholar]
- Combined ultrasound and Fenton (US-Fenton) process for the treatment of ammunition wastewater. J. Hazard. Mater.. 2013;244:403-411.
- [Google Scholar]
- Chlorbromuron urea herbicide removal by electro-Fenton reaction in aqueous effluents. Water Res.. 2009;43:33-40.
- [Google Scholar]
- Response surface methodology: process and product optimization using designed experiments. John Wiley & Sons; 2016.
- Photo-removal of sulfamethoxazole (SMX) by photolytic and photocatalytic processes in a batch reactor under UV-C radiation (λmax= 254 nm) J. Hazard. Mater.. 2011;186:67-75.
- [Google Scholar]
- Sonocatalytic-Fenton reaction for enhanced OH radical generation and its application to lignin degradation. Ultrason. Sonochem.. 2013;20:1092-1097.
- [Google Scholar]
- Combination of advanced oxidation processes and biological treatments for wastewater decontamination—a review. Sci. Total Environ.. 2011;409:4141-4166.
- [Google Scholar]
- Study of the toxicity of diuron and its metabolites formed in aqueous medium during application of the electrochemical advanced oxidation process “electro-Fenton”. Chemosphere. 2008;73:1550-1556.
- [Google Scholar]
- A comparative study on the efficiency of electro-Fenton process in the removal of propham from water. Appl. Catal. B-Environ.. 2009;89:620-626.
- [Google Scholar]
- Biosorption of reactive dye using acid-treated rice husk: factorial design analysis. J. Hazard. Mater.. 2007;142:397-403.
- [Google Scholar]
- Fenton electrochemical treatment of aqueous atrazine and metolachlor. J. Agric. Food Chem.. 1998;46:3285-3291.
- [Google Scholar]
- Tinidazole removal from aqueous solution by sonolysis in the presence of hydrogen peroxide. Bull. Environ. Contam. Toxicol.. 2014;92:341-346.
- [Google Scholar]
- Elimination and detoxification of sulfathiazole and sulfamethoxazole assisted by laccase immobilized on porous silica beads. Int. Biodeter. Biodegr.. 2015;97:107-114.
- [Google Scholar]
- Degradation of 2, 4-dichlorophenol in aqueous solution by sono-Fenton method. Korean J. Chem. Eng.. 2008;25:112-117.
- [Google Scholar]
- Application of ultraviolet light-emitting diodes to the removal of cefixime trihydrate from aqueous solution in the presence of peroxydisulfate. J. Appl. Chem.. 2015;9:61-72.
- [Google Scholar]
- Electro-Fenton catalyzed with magnetic chitosan beads for the removal of Chlordimeform insecticide. Appl. Catal. B-Environ.. 2018;226:346-359.
- [Google Scholar]
- Removal of nitroimidazole antibiotics from aqueous solution by adsorption/bioadsorption on activated carbon. J. Hazard. Mater.. 2009;170:298-305.
- [Google Scholar]
- Photocatalytic removal of cefazolin from aqueous solution by ac prepared from mango seed+ zno under uv irradiation. Global Nest. J.. 2018;20:399-407.
- [Google Scholar]
- Comparing the electrocoagulation and electro-Fenton processes for removing nitrate in aqueous solution for Fe electrodes. JMUMS. 2013;23:57-67.
- [Google Scholar]
- An overview of analytical methodologies for the determination of antibiotics in environmental waters. Anal. Chim. Acta. 2009;649:158-179.
- [Google Scholar]
- Degradation of the pharmaceutical metronidazole via UV, Fenton and photo-Fenton processes. Chemosphere. 2006;63:269-276.
- [Google Scholar]
- Common Antibiotics in Wastewater of Sina and Besat Hospitals, Hamadan Iran. Archive Hygiene SCIE. 2017;6:152-159.
- [Google Scholar]
- Techno-economic analysis to identify key innovations required for electrochemical oxidation as point-of-use treatment systems. Electrochim. Acta. 2020;338:135874
- [Google Scholar]
- Preparation, characterization, and application of activated carbon from low-cost material for the adsorption of tetracycline antibiotic from aqueous solutions. Water Sci. Technol.. 2016;74:2349-2363.
- [Google Scholar]
- Electro-Fenton method for the removal of Malachite Green: effect of operational parameters. Appl. Water Sci.. 2020;10:1-14.
- [Google Scholar]
- The reactor design and comparison of Fenton, electro-Fenton and photoelectro-Fenton processes for mineralization of benzene sulfonic acid (BSA) J. Hazard. Mater.. 2008;156:421-427.
- [Google Scholar]
- Removal of color from real dyeing wastewater by Electro-Fenton technology using a three-dimensional graphite cathode. J. Hazard. Mater.. 2008;152:601-606.
- [Google Scholar]
- Application of response surface methodology to the removal of the antibiotic tetracycline by electrochemical process using carbon-felt cathode and DSA (Ti/RuO2–IrO2) anode. Chemosphere. 2012;87:614-620.
- [Google Scholar]
- Degradation of melatonin by UV, UV/H2O2, Fe2+/H2O2 and UV/Fe2+/H2O2 processes. Sep. Purif. Technol.. 2009;68:261-266.
- [Google Scholar]
- Investigation the Efficiency of Combined Coagulation and Advanced Oxidation by Fenton Process in the Removal of Clarithromycin Antibiotic COD. Water Wastewater.. 2012;23:22-29.
- [Google Scholar]
- Bioelectronics, Molecularly imprinted electrochemical biosensor based on Fe@ Au nanoparticles involved in 2-aminoethanethiol functionalized multi-walled carbon nanotubes for sensitive determination of cefexime in human plasma. Biosens. Bioelectron.. 2014;60:277-285.
- [Google Scholar]
- Efficient and selective removal of cefixime form aqueous solution by a modified bionanocomposite. J. Environ. Chem. Eng.. 2017;5:3337-3347.
- [Google Scholar]
- Effect of sunlight and ultraviolet radiation in the titanium dioxide (TiO2) nanoparticles for removal of furfural from water. JMUMS. 2013;23:126-138.
- [Google Scholar]
- Comparison of Fenton, ultraviolet–Fenton and ultrasonic–Fenton processes on organics and colour removal from pre-treated natural gas produced water. Int. J. Environ. Sci. TE. 2018;15:2411-2422.
- [Google Scholar]
- Electro-Fenton method for the removal of methyl red in an efficient electrochemical system. Sep. Purif. Technol.. 2007;57:380-387.
- [Google Scholar]
- Optimization of Fenton and electro-Fenton oxidation of biologically treated coking wastewater using response surface methodology. Sep. Purif. Technol.. 2011;81:444-450.
- [Google Scholar]


