

Translate this page into:
The enhanced photo-stability of defective Ag3PO4 tetrahedron prepared using tripolyphosphate
⁎Corresponding author. sulaeman@unsoed.ac.id (Uyi Sulaeman),
-
Received: ,
Accepted: ,
This article was originally published by Elsevier and was migrated to Scientific Scholar after the change of Publisher.
Peer review under responsibility of King Saud University.
Abstract
Ag3PO4 is an excellent photocatalyst under visible light irradiation. However, the low stability due to photo-corrosion is still an obstacle in its application. It is a big challenge to improve stability using synthesis modification. Here, the photocatalyst stability enhancement was successfully prepared by tripolyphosphate. Photocatalyst was prepared by reacting AgNO3 solution with STPP (sodium tripolyphosphate) solution to form a white suspension. The addition of phosphate solution to the white suspension produces yellow Ag3PO4 with a new type of defective photocatalyst. The XPS measurement showed that the increase of STPP concentration significantly decreased the Ag/P atomic ratio, indicating the silver vacancy formation on the surface of Ag3PO4. The photocatalytic reaction formed a metallic Ag with a lower d-space in the cube structure occurred in the silver vacancy of Ag3PO4. This defect increases the interaction of metallic silver and Ag3PO4. The enhanced photo-stability might be induced by metallic silver that can act as a photogenerated electron acceptor.
Keywords
Ag3PO4
Defect
Metallic silver
Photo-stability
Silver vacancy
Tripolyphosphate

1 Introduction
The finding of photocatalysis in silver phosphate (Ag3PO4) is a breakthrough in the area of photocatalysts due to its strong ability to absorb visible light (Yu et al., 2022). The holes generated in Ag3PO4 under visible light excitation have a strong oxidizing ability. However, photo-corrosion has reduced the efficiency of Ag3PO4 reuse. To overcome this obstacle, researchers have focused on modifying the structure of Ag3PO4 into a core–shell structure (Chen et al., 2015; Ding et al., 2022; Hu et al., 2017), a p-n junction (Teng et al., 2017; Zhang et al., 2020; Zhang et al., 2016), and a Z-scheme mechanism (Zhu et al., 2016; Zhu et al., 2018).
The core–shell structure was designed to inhibit Ag3PO4 dissolution. This approach encourages researchers to find a highly stable shell that does not dissolve in an aqueous solution. The g-C3N4, PANI, and graphene oxide shells were applied in the core–shell structural design on Ag3PO4. The Ag3PO4@g-C3N4 core@shell was successfully synthesized by ultrasonic chemisorption (Liu et al., 2016). The g-C3N4 coated on the surface of Ag3PO4 nanoparticles prevents Ag3PO4 from dissolving in the aqueous solution. This phenomenon greatly improves photo-stability. In addition, the g-C3N4 shell improves charge separation efficiency, which improves photocatalytic activity. Researchers have also developed another shell, PANI (Liu et al., 2017). This shell could effectively prevent Ag3PO4 from dissolving. The advantage of PANI is a π-π conjugation in the structure and a tight bonding in the core–shell interface that produces super-fast conductivity. This interaction can enhance the movement of interfacial carriers and the separation efficiency. The π-π bonds in Ag3PO4@UMOFNs core–shell can also promote charge transfer (Liang et al., 2018). Graphene oxide quantum dots (GOQDs) shells can be decorated on Ag3PO4, forming an Ag3PO4@GOQDs core–shell (Wang et al., 2022). This coating inhibits photo-corrosion and improves stability and photocatalytic activity. Ag3PO4 can also be coated with a subphthalocyanine (SubPc) containing a 14 π-electron aromatic core in a nonplanar conical configuration (Li et al., 2021). The improved stability of SubPc-Br/Ag3PO4 was caused by well-coated SubPc-Br particles, which acted as a protective shield in the photoreduction.
The p-n heterojunction could be applied to improve the stability of Ag3PO4. For example, the ZnWO4/Ag3PO4 heterostructure design improved the stability (Duan, et al., 2022b). This is because the p-n heterojunction mechanism can prevent the photo-corrosion of Ag3PO4 due to the flow of electrons in the electric field at the interface of two semiconductors. This approach was also found in the p-n heterojunction of the Ag3PO4/BiPO4 photocatalyst (Zhu et al., 2022). A spherical/nanorod Ag3PO4/BiPO4 was successfully developed, which showed excellent stability. In this case, when a p-n heterojunction occurs between Ag3PO4 and BiPO4, the electron in the CB of Ag3PO4 is transferred to the CB of BiPO4, while the holes in the VB of BiPO4 can migrate to the VB of Ag3PO4. This phenomenon creates an internal electric field at the interface between BiPO4 and Ag3PO4, which accelerates the flow of electrons and leads to improved stability.
The famous improvement in photo-stability in Ag3PO4 is the Z-scheme mechanism design. For example, the composite of carbon cloth-supported MoS2/Ag2S/Ag3PO4 (Liu et al., 2019), Ag3PO4/C3N5 (Yin et al., 2021), Ag3PO4/ZnIn2S4 (Zhang, et al., 2021b), and Cs3PW12O40/Ag3PO4 (Duan, et al., 2022a) showed an excellent photo-stability. A spherical particle of Cs3PW12O40 was successfully decorated on Ag3PO4 nanocrystals and the metal silver nanoparticles formed through a photoinduced reaction can be used as a bridge to accelerate the charge transfer. The photogenerated electrons in the CB of Ag3PO4 were transferred to the VB of CsPW resulting in high electron accumulation in the CB of CsPW and holes in the VB of Ag3PO4. This mechanism improves both photocatalytic activity and stability.
Based on these literature studies, all stability improvement design is still focused on composites. The properties and structure of Ag3PO4 through a defect and dopant have not much been applied to provide high stability. It is because the metastability of defects greatly worse the photocatalyst stability, although certain limits of defects can effectively control the photogenerated electron and holes (Zhang, et al., 2021a). The silver vacancy sites on the Ag3PO4 lattice can be controlled through synthesis under ethanol–water and improve the photocatalytic (Sulaeman et al., 2018). The silver vacancy enhanced the photocatalytic activity due to trapping the generated holes during irradiation and enhancing the separation efficiency. However, the stability of this photocatalyst is still an obstacle. Incorporating graphene oxide on silver vacancy in Ag3PO4 has also only increased the photocatalytic activity (Liu et al., 2018). Therefore, it is challenging how to create high photo-stability of silver vacancy in Ag3PO4. Researchers have to find new techniques how to make defects caused by starting materials that can improve photo-stability.
In this work, we fabricated the higher stability of defective Ag3PO4 with a co-precipitation method using AgNO3, sodium tripolyphosphate (STPP) and Na2HPO4*12H2O. A mixture of AgNO3 and the STPP solution produces a white suspension. The addition of a Na2HPO4 solution to a white suspension resulted in a yellow defective Ag3PO4. Silver vacancies in the photocatalyst can easily form. The photocatalytic reaction leads to the formation of metallic Ag in defective Ag3PO4, which improves photo-stability.
2 Experimental
2.1 Synthesis
The starting material of silver nitrate (AgNO3) (ACS reagent grade, Merck), sodium tripolyphosphate (STPP) (Analytical grade, Merck), and disodium phosphate dodecahydrate (Na2HPO4*12H2O) (Analytical grade, Merck) were used for the preparation of samples.
Defective Ag3PO4 is prepared by mixing a silver nitrate (AgNO3) and sodium tripolyphosphate (STPP) solution. AgNO3 solution was prepared by mixing 0.85 g of AgNO3 and 20 mL of deionized water. The seven variations of STPP concentration were carried out by dissolving 0.005, 0.01, 0.05, 0.1, 0.2, 0.4 and 0.8 g of STPP into 20 mL of deionized water. These variations are provided for the samples of AP-0005, AP-001, AP-005, AP-01, AP-02, AP-04, and AP-08 samples, respectively. Samples without STPP were also prepared for control and named AP-0. The mixtures of AgNO3 and STPP solutions were stirred using a magnetic stirrer at 500 rpm for 1 h to form a white suspension. A phosphate solution (1.8 g Na2HPO4*12H2O in 20 mL deionized water) was added to the white suspension dropwise and stirred for 5 h. The white suspension disappeared and turned into a yellow one. The mixture was filtered and washed using deionized water three times. The precipitates were then dried in an oven at 60 °C for 5 h.
2.2 Characterization
The samples were characterized using XRD (Rigaku, MiniFlex 300/600), DRS (Perkin Elmer, UV/VIS Lambda 365), PL spectra (MAYAPRO2000, Ocean Optics), SEM (Zeiss/Evo MA10), BET (Micromeritics TriStar II 3020), and XPS (ULVAC PHI 5600). A source of Cu Kα (λ = 1.5406 Å) was used in XRD at the 2θ range of 5–80° with 0.020° steps. The structure of samples was analyzed using the software of HighScore Plus with Rietveld refinement to determine the peak position, d-space, and FWHM (full width at half maximum). The band gap energies were calculated from the DRS data using the Tauc plot (Cao et al., 2022). Photoluminescence (PL) spectrum analysis was performed using a laser at 405 nm (50 mW) as the excitation source. Particle size distribution was estimated using the software of ImageJ from the SEM images. The deconvolutions of XPS peaks were carried out using XPSPEAK 4.1 software.
2.3 Photocatalytic activity evaluation
The synthesized photocatalyst powder (0.2 g) was put into a beaker containing 100 mL of 10 mg/L Rhodamine (RhB) solution. The beaker is placed on a magnetic stirrer. A blue LED lamp (Ranpo, Spot Light Lamp 3 W LED Bulbs, λ = 454 nm, Ranpo) was used as a source of visible light irradiation at a distance of 15 cm from the solution surface. The reaction was first carried out in the dark for 20 min to equilibrate the adsorption/desorption of RhB. The photocatalytic reaction was run and the samples (5 mL) were taken every 2 min. The solution was then centrifuged at 9000 rpm for 15 min to separate from the photocatalyst. The RhB in the filtrate was measured using a spectrophotometer (Sulaeman et al., 2022).
The active species in AP-0, AP-001, and AP-02 in the photocatalytic reactions were evaluated using scavengers. A solution of Rhodamine B (10 mg/L, 100 mL) was added with ammonium oxalate, isopropanol, and benzoquinone scavenger. These scavengers (1 mM of concentration) were utilized to capture hole (h+), hydroxyl radicals (•OH), and superoxide anion radicals (•O2), respectively (Sulaeman et al., 2022).
To evaluate the photo-stability, the precipitate of AP-0, AP-001, and AP-02 was retested again for its degradation activity against the Rhodamine B solution. The test of photocatalytic reaction was carried out up to 3 cycles. The photocatalytic reactions evaluation in both mechanism and photo-stability tests were carried out with a similar procedure.
3 Results and discussion
3.1 Characterization
The samples of AP-0, AP-001 and AP-02 were investigated using the XRD, UV–vis DRS, PL spectra, SEM, BET and XPS. The XRD showed that all structure was cubic, matched with the ICDD 98-020-1361 as shown in Fig. 1. Based on the Rietveld refinement analysis, the (2 1 0) position (2θ) of 33.21925°, 33.27004° and 33.16026° were obtained in AP-0, AP-001 and AP-02 samples, respectively. The calculation of d-space exhibited the value of 2.69477 Å, 2.69078 Å, and 2.69943 Å for AP-0, AP-001 and AP-02, respectively. The shift of 2θ occurred after the modification of synthesis using STPP. The shift to a higher 2θ might be induced by a smaller concentration of STPP (AP-001) whereas the shift to a lower 2θ might be induced by a higher concentration of STPP (AP-02). The broadened peak of 2θ was also observed, and the FWHM of 0.10438, 0.12315, and 0.14625 were calculated in the sample of AP-0, AP-001 and AP-02, respectively. These phenomena suggest that the STPP treatment significantly affected the coprecipitation of Ag3PO4. It might induce defect formation that leads to a shift and a peak broadening of the XRD. These phenomena were also found in the previous results, that alginate induces defect formation in Ag3PO4 leading to a peak broadening (Sulaeman et al., 2022). Based on another report (Ungár, 2004), the defect formation can cause a peak broadening which increases the FWHM value. Small crystallite size, chemical heterogeneity, and microstrain can cause peak broadening.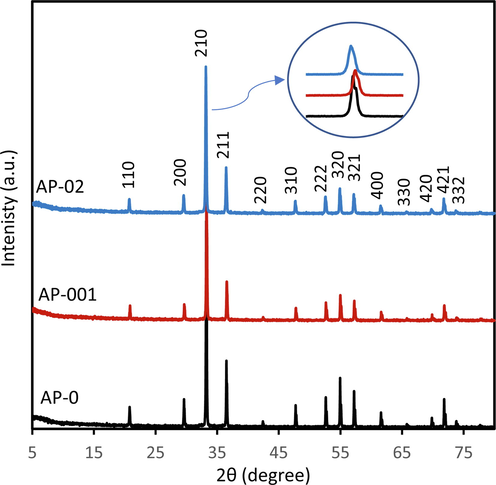
XRD pattern of Ag3PO4 prepared without STPP (AP-0), with 0.01 g of STTP (AP-001), and with 0.2 g of STTP (AP-02).
The crystal size of the sample can be measured using the Scherrer equation, d = kλ/βcosθ, where d (nm) is the crystal size inversely proportional to FWHM, k is the Scherer constant associated with crystal shape (0,9), and λ is the source of the X-ray wavelength (Cu Kα = 0.15406 nm) (Mirsalari and Nezamzadeh-Ejhieh, 2021). With this approach, effective crystal sizes of 74.9 nm, 63.5 nm, and 53.5 nm were obtained for AP-0, AP-001, and AP-02, respectively. The decrease in crystal size ensures that the tripolyphosphate significantly affects crystal growth.
Reacting an AgNO3 solution to an STPP solution forms a white suspension. The addition of Na2HPO4*12H2O solution to the white suspension produces yellow precipitation. The phosphate ion adsorbed on the white suspension might slowly react to Ag+ ions that existed in the white suspension forming a defective Ag3PO4. The white suspension disappeared and a yellow precipitate formed, indicating the formation of a new type of defective Ag3PO4 photocatalyst. The synthetic method, experimental conditions and structural arrangement can induce defect formation (Botelho et al., 2016).
Fig. 2 displays the UV–vis absorption spectra of the AP-0, AP-001, and AP-02 scanned from 250 to 800 nm. STPP treatment decreased the absorption spectrum, especially in the 300–460 nm region as found in AP-001 and AP-02, this indicates that STTP can affect the optical properties of the photocatalyst. Based on Tauc plot (Cao et al., 2022), the bandgap energy of 2.43 eV, 2.45 eV and 2.45 eV can be estimated for AP-0, AP-001, and AP-02 samples, respectively. The slightly increased bandgap energy might be induced by the defect formation in the lattice of Ag3PO4. The changes in absorption phenomenon due to the defect formation were also found in TiO2 (Nakamura et al., 2000) and SrTiO3 (Tan et al., 2014).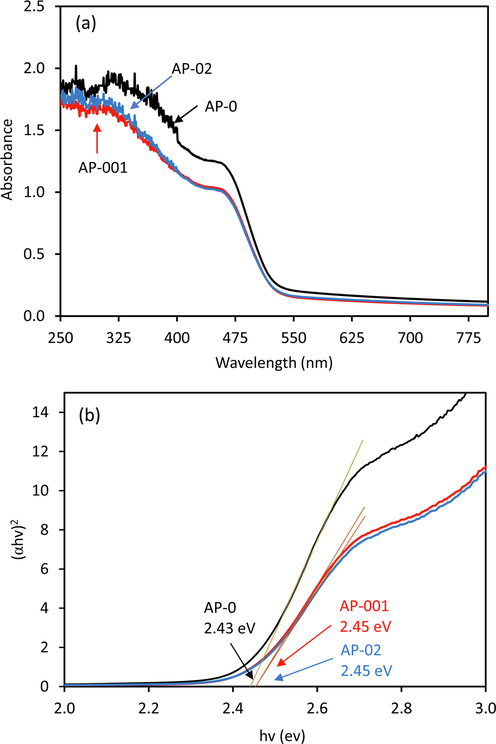
DRS of Ag3PO4 prepared without STPP (AP-0), with 0.01 g of STTP (AP-001), and with 0.2 g of STTP (AP-02) (a), and their Tauc plot (b) for measuring band gap energies.
The PL spectra of AP-0, AP-001 and AP-02 were obtained using a 50 mW laser at 405 nm excitation (Fig. 3). The peak of 541 nm and 679 PL spectra were observed in all samples. The peak of the 541 nm spectrum (2.29 eV) could be the photogenerated electrons and holes recombination of the valence and conduction bands, whereas the 679 nm spectrum (1.82 eV) could be associated with the charge recombination in the defect site. The PL spectra intensity of AP-001 decreases at 541 nm, indicating the smaller STTP treatment decreases charge recombination between two bands of semiconductor, however, the PL spectra intensity increases at 679 nm, suggesting that high charge recombination occurred in defect sites corresponding to an energy of 1.82 eV. The AP-02 exhibits the same PL spectra intensity as AP-0 at 541 nm, showing that charge recombination between two bands of semiconductor is high. Interestingly, the PL spectra intensity decreases at 679 nm implying that the larger defect site in AP-02 might suppress charge recombination.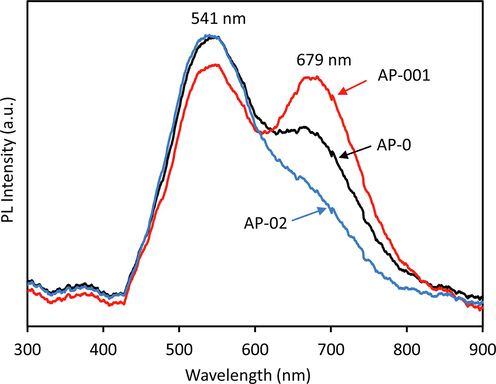
Photoluminescence (PL) spectra of AP-0, AP-001, and AP-02 photocatalysts excited at 405 nm.
The morphology of AP-0, AP-001 and AP-02 were observed using SEM and particle size distribution was determined using ImageJ software (Fig. 4). Irregular particle size of 669 ± 238 was formed in the sample of AP-0 which was prepared without STPP treatment. After STPP treatment, the size was significantly reduced to 338 ± 126 nm and 423 ± 135 nm for AP-001 and AP-02, respectively. The decrease in particle size in AP-001 indicates that the STPP solution has a significant effect on Ag3PO4 coprecipitation. Treatment with a higher concentration of STPP (AP-02) can change the morphology to a tetrahedron. Based on the morphology investigation, it can be concluded that both low concentrations of STPP (AP-001) and high concentrations of STPP treatment (AP-02) exhibited significant effects. The irregular shape was found in AP-001, whereas the tetrahedron shape was found in AP-02. This phenomenon also leads to a different XRD peak as found in Fig. 1.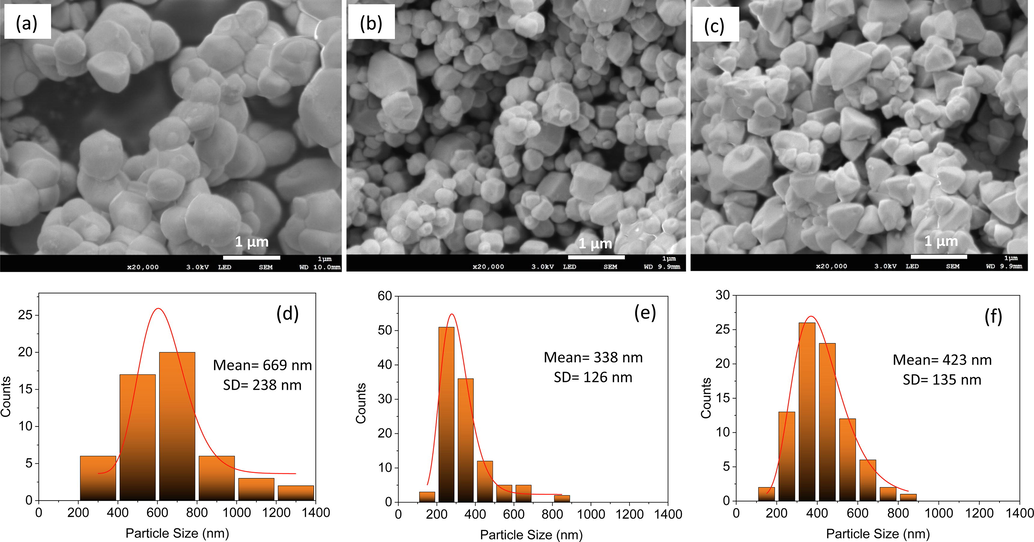
SEM images of AP-0 (a), AP-001 (b), and AP-02 (c) and their particle size distributions of AP-0 (d), AP-001 (e), and AP-02 (f).
The results of the BET analysis are shown in Table 1. All samples have a low BET surface area. Sample preparation with a low STPP concentration (AP-001) increased the specific surface area, whereas the higher STPP concentration (AP-02) decreased the specific surface area. Similar trends were also found in both pore volume and pore size. This indicates that the STPP concentration could affect crystal formation. The nitrogen adsorption–desorption curves indicate that the adsorption isotherm is typical type IV because the hysteresis loop shows the desorption curve lagging behind the adsorption curve (Zvinowanda et al., 2009) (Fig. 5a). Based on the calculation of the average pore width of the adsorption, the photocatalysts are mesoporous. Cumulative pore volumes were successfully calculated using the DFT method (Fig. 5b). Among the samples, AP-02 is the lowest total pore volume. The morphology changes from irregular to tetrahedron may be responsible for the variation in BET parameters.
Samples
BET surface area
(m2/g)a
Average pore width (nm)b
Total pore volume
(cm3/g)c
AP-0
0.81
9.06
0.00169
AP-001
1.20
9.42
0.00269
AP-02
0.59
8.86
0.00120
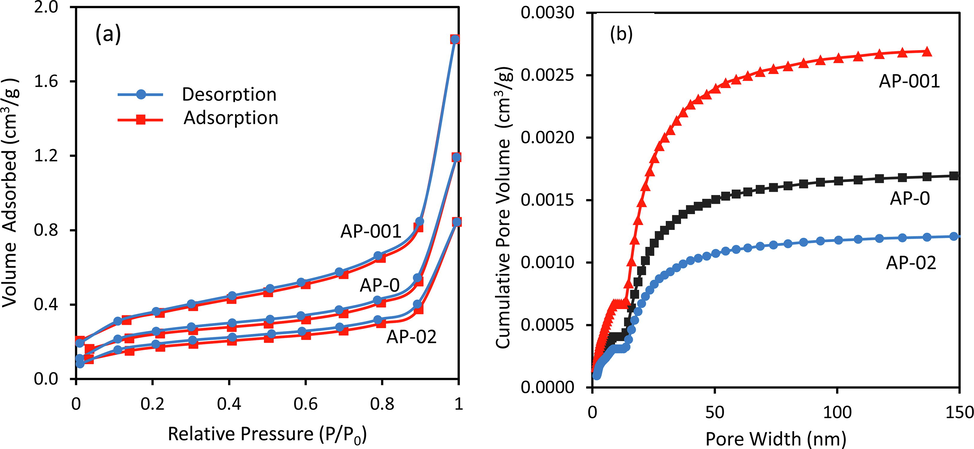
Nitrogen adsorption–desorption isotherms (a) and the cumulative pore volume curves (b) of the AP-0, AP-001, and AP-02 samples.
The XPS analysis was carried out to understand the properties of AP-0, AP-001 and AP-02. Fig. 6 shows a profile of the Ag3d spectrum. The binding energy (BE) of 374.31 eV and 368.30 eV assigned to the Ag3d3/2 and Ag3d5/2 respectively, was found in the sample of AP-0 (Yan et al., 2016). The BE increases after STPP treatment. The BE of 374.34 eV and 368.32 eV were found in AP-001, and the BE of 374.40 eV and 368.38 eV were found in AP-02 for Ag3d3/2 and Ag3d5/2, respectively. Amongst the samples, AP-001 exhibited higher FWHM (1.52 eV) compared the AP-0 (1.40 eV) and AP-02 (1.40 eV). The higher FWHM could be due to the formation of a small defect when the morphology was maintained the same as the control (AP-0). In contrast, at higher defects (AP-02), the FWHM value remained the same as the control (AP-0), but the morphology changed to a tetrahedron, and the peak shifted to the higher binding energy. To investigate in detail these phenomena, the atomic ratio of Ag/P, Ag/O and O/P were carefully calculated from the XPS data (Table 2). The Ag/P atomic ratio of 3.01, 2.73 and 2.42 was found in the sample of AP-0, AP-001 and AP-02, respectively. A significant decrease in Ag/P atomic ratio implied that the deficiency of silver was created on the surface of the photocatalyst. It indicates that the treatment with STPP generates the defect of a silver vacancy on the surface of the photocatalyst. Trends of decreased atomic ratio due to STPP treatment were also found in Ag/O, ensuring that the silver vacancy occurred. The silver vacancy in Ag3PO4 is easier to form during coprecipitation compared to the oxygen vacancy because the Ag-O bond is weaker than the P—O bond (Reunchan and Umezawa, 2013). The P/O atomic ratio of 0.28, 0.27 and 0.28 was found in AP-0, AP-001 and AP-02, respectively. A similar ratio of P/O suggests that the oxygen vacancy might not be created on the surface of Ag3PO4.
The XPS profile of Ag3d in Ag3PO4 prepared without STPP (AP-0), with 0.01 g of STTP (AP-001), and with 0.2 g of STTP (AP-02).
Sample
Ag/P
Ag/O
P/O
AP-0
3.01
0.83
0.28
AP-001
2.73
0.73
0.27
AP-02
2.42
0.68
0.28
Fig. 7 shows the XPS spectra of P2p and O1s in AP-0, AP-001, and AP-02. The BE of 134.34 eV and 133.15 eV assigned to P2p1/2 and P2p3/2, respectively, were found in the sample of AP-0 (Xie et al., 2017). The BE increased after STPP treatment as found in AP-001 and AP-02. The P2p1/2 peaks exhibited at 134.44 eV and 134.64 eV for AP-001 and AP-02, respectively. The significant BE shift of 0.30 eV from AP-0 to AP-02 suggested that the silver vacancy was created due to STPP treatment. This phenomenon also increased the spin–orbit coupling (J) of P2p1/2 and P2p3/2. The spin–orbit coupling of 1.19, 1.24 and 1.29 can be found in AP-0, AP-001, and AP-02, respectively.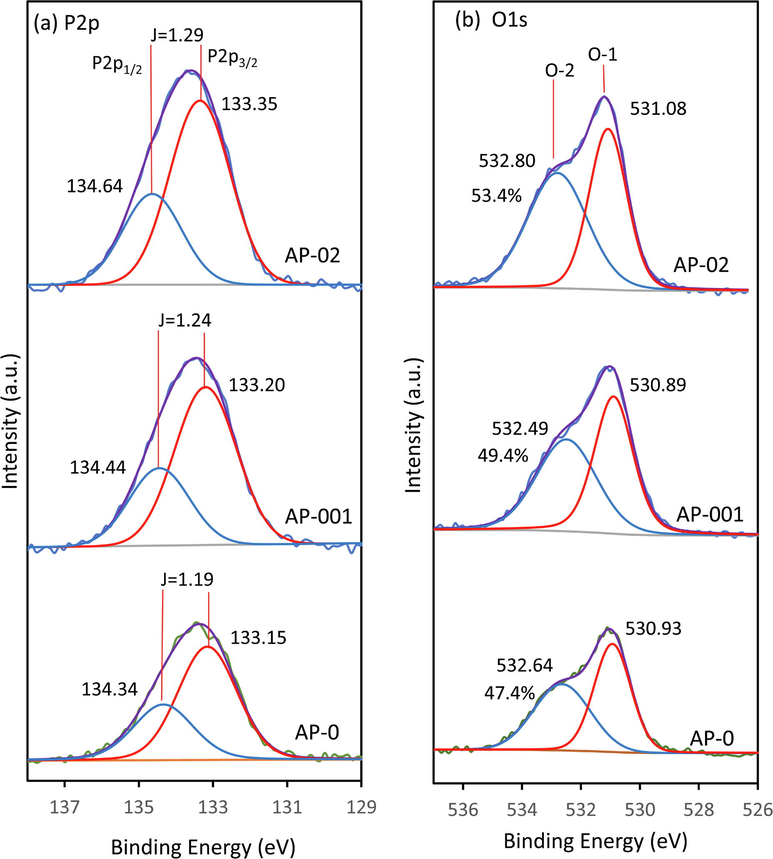
The XPS profile of P2p (a) and O1s (b) in Ag3PO4 prepared without STPP (AP-0), with 0.01 g of STTP (AP-001), and with 0.2 g of STTP (AP-02).
The O1s exhibited two types of oxygen that were observed at 530.93 eV (O-1) and 532.64 eV (O-2) as found in the AP-0 sample. The O-1 and O-2 represent the oxygen in the lattice and oxygen of hydroxyl on Ag3PO4 surface, respectively (Chong et al., 2016; Sulaeman et al., 2022). The BEs of 530.89 eV and 531.08 eV were found as O-1 types in AP-001 and AP-02 samples, respectively. Whereas the BEs of 532.49 and 532.80 were found as O-2 types in the AP-001 and AP-02 samples, respectively. A BE shift of 0.15 eV in the O-1 spectrum from AP-001 to AP-02 was measured, indicating the STPP might induce a different environmental chemical state. The % O-2 (hydroxyl oxygen) of 47.4 %, 49.4 %, and 53.4 % was observed in AP-0, AP-001, and AP-02, respectively. Increasing O-2 might be related to the defect of silver vacancy. The higher defect might easily trap the hydroxyl on the surface.
3.2 Photocatalytic evaluation
The photocatalytic activities of samples were tested using the Rhodamine B (RhB) degradation under the blue light of an LED lamp, the results can be seen in Fig. 8. The % degradation was calculated using the equation of ((C0-Ct)/C0)x100% (Phuruangrat et al., 2019), where C0 is the initial concentration of RhB and Ct is the concentration of RhB after 6 min of irradiation. The % degradation of 74.4, 83.6, 93.6, 85.9, 81.9, 74.6, 57.3, and 48.3 was calculated for the sample of AP-0, AP-0005, AP-001, AP-005, AP-01, AP-02, AP-04 and AP-08, respectively. The kinetics of the photocatalytic reaction was also investigated using the pseudo-first-order model, ln(C0/Ct) = kappt, where: C0 is the initial concentration of RhB solution, Ct is the RhB concentration after t (min) irradiation and kapp (min−1) is the apparent pseudo-first-order rate constant (Wang et al., 2016). All photocatalytic reactions were well fitted to this kinetic model with r2 ranging from 0.95 to 0.99. The rate constant (min−1) of 0.266, 0.336, 0.435, 0.319, 0.338, 0.311, 0.257, and 0.171 were calculated for the samples of AP-0, AP-0005, AP-001, AP-005, AP-01, AP-02, AP-04 and AP-08, respectively. Treatment with STPP increased photocatalytic activity until the highest activity was found in sample AP-001 which was 1.6 times higher than AP-0. The enhanced photocatalytic activity might be caused by decreased photogenerated electron and hole recombination. This was confirmed by the decrease of PL intensity in AP-001 at 541 nm. Due to the very low specific surface area and total pore volume, therefore, these properties do not greatly affect the photocatalytic activity. Further increase of STPP concentration gradually decreases the photocatalytic activity significantly. For example, in the AP-02 sample, the decrease of activity might be caused by high charge recombination which was confirmed by high PL intensity at 541 nm which is similar to AP-0. However, the low intensity at 679 nm in AP-02 might have the potential for further improvement of this photocatalyst. The defect sites on the surface significantly affect the photocatalytic reaction, in which, the defect concentration can have a significant role. A small concentration of the defect might increase the photocatalytic activity, but a large defect might deteriorate the photocatalytic reaction. A small defect might improve the separation of photogenerated electrons and holes, in contrast, a large defect could be a centre of photogenerated electron and hole recombination. Therefore, the defect concentration is very pivotal for paving a highly active photocatalyst.
The photocatalytic activity of Ag3PO4 prepared by the various concentration of STPP.
To study the active species of the photocatalytic reaction, three samples of AP-0, AP-001 and AP-02 were investigated. The scavenger of isopropyl alcohol (IPA), benzoquinone (BQ) and AO (ammonium oxalate) was used to trap the hydroxyl radical (•OH), superoxide ion radical (•O2−) and holes (h+), respectively (Sulaeman et al., 2022). The results of the evaluation can be seen in Fig. 9. The % degradation of AP-0 was suppressed under the addition of IPA, BQ and AO, indicating that all three active species ((•OH, •O2−, h+) involved in the reaction. In contrast, the sample of AP-001 and AP-02 showed that the % degradation was suppressed under the addition of BQ and AO, suggesting only two active species (•O2−, h+) were involved in the reaction, The higher suppression of % degradation was found after AO addition in AP-02, indicating that the hole was dominantly involved in the reaction.
The active species analysis in sample AP-0 (a), AP-001 (b), and AP-02 (c) with % degradation of AP-0 (d), AP-001 (e), and AP-02 (f).
The most important thing in Ag3PO4 photocatalyst is the stability of photocatalytic activity. It is well known that the worse ability of Ag3PO4 was caused by photo-corrosion through photoreduction of Ag+ on the surface forming the metallic Ag particles. Therefore, the photocatalytic recycling ability of AP-0, AP-001 and AP-02, were evaluated, and the results are shown in Fig. 10. The pseudo-first-order rate constants (min−1) of 0.325, 0.096, and 0.047 were obtained in AP-0 for cycle 1, cycle 2 and cycle 3, respectively, indicating the photocatalyst has poor stability. Photostability increased slightly in AP-001 which showed a rate constant (min−1) of 0.385, 0.256, and 0.089 for cycle 1, cycle 2 and cycle 3, respectively. Interestingly, AP-02 photocatalyst showed excellent photostability because the rate constants (min−1) of 0.320, 0.362, and 0.312 were generated in cycle 1, cycle 2 and cycle 3, respectively. The photocatalyst of AP-02 showed high photostability, even at cycle 2, the photocatalytic activity was higher.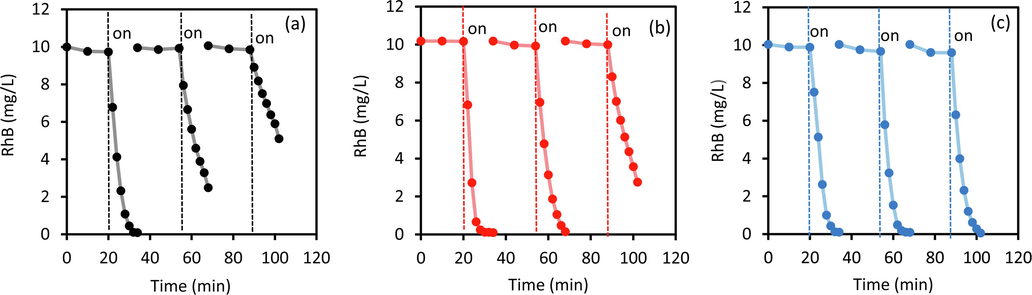
Recyclability test of AP-0 (a), AP-001(b) and AP-02 (c) photocatalysts using RhB degradation up to 3 cycles.
3.3 The characterization after the cyclic reaction
The photocatalyst of AP-0 and AP-02 after three cyclic photocatalytic reactions were characterized using XRD and XPS. It is very important to understand the excellent photo-stability of AP-02. Fig. 11a exhibited the XRD profile of AP-0 and AP-02 which showed a similar structure of Ag3PO4 (ICDD 98-020-1361). The slight shift of 2θ was found in AP-02, it is similar to before the photocatalytic reaction, suggesting that the large defect might be retained on the Ag3PO4 surface. The Scherrer method showed that the Ag3PO4 crystalize size of 77.4 nm and 53.6 nm were calculated in AP-0 ad AP-02, respectively which is relatively similar to before the photocatalytic reaction.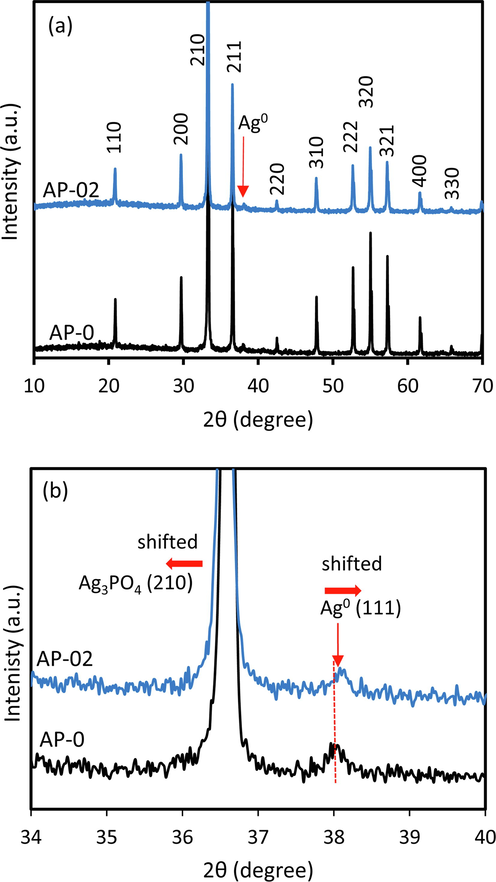
XRD pattern of AP-0 and AP-02 after 3 cycles of the photocatalytic test (a) and an enlarged 2θ peak (b).
Using Rietveld refinement analysis, the interplanar distance (d-space) of the Ag metal incorporated in the photocatalyst was obtained to be 2.36605 and 2.36009 for AP-0 and AP-02, respectively, which corresponds to (1 1 1) plane of the silver cube structure (ICSD 98-018-0878). These values originate from the 2θ position of 37.99935° and 38.09899° for AP-0 and AP-02, respectively. The Ag0 crystallite size of 36.5 nm and 48.7 nm was calculated for AP-0, and AP-02 using the Scherrer equation, respectively. The metallic Ag particles incorporated on AP-0 and AP-02 showed different characteristics (Fig. 11b). The Ag0 in AP-02 exhibited a higher value of 2θ, indicating the lattice constant of Ag0 is smaller than the Ag0 of AP-0. The shift of the peak towards a higher 2θ implies compression and formation of lattice anisotropic contractions (Shanmugan and Mutharasu, 2012). These phenomena might be caused by the different interactions of metallic Ag in AP-0 and AP-02. In the large defect of AP-02, the interaction of Ag0 and Ag3PO4 is stronger than in AP-0. The defect might have a significant role in shaping the different characteristics of Ag0. Therefore, although both samples (AP-0 and AP-02) have the same concentration of Ag metal, they differ in the occupation on the crystal lattice of the Ag3PO4 surface. In addition, the crystallite size might influence the incorporation of Ag0, the similar crystallite size of 48.7 nm (Ag0) and 53.6 nm (Ag3PO4) in AP-02 might increase the interaction, in contrast, the different crystallite size of 36.5 nm (Ag0) and 77.4 nm (Ag3PO4) in AP-0 lead to the weak interaction.
The XPS analysis of AP-0 and AP-02 after 3 cycles of photocatalytic tests was also carried out and shown in Fig. 12. The shrinkage of the Ag3d spectra peak was found in AP-02 implying that the defect could affect the incorporation of metallic Ag. Meanwhile, O1s of AP-02 exhibited shrinkage of spectra peak from the opposite site suggesting that the amount of adsorbed organic oxygen on the AP-02 surface is lower. It means that the mineralization in AP-02 is better than the AP-0. To understand in detail, the XPS peak deconvolution of Ag3d was investigated. The BE energy of Ag+ in AP-0 exhibited at 367.48 and 373.48, whereas in AP-02 exhibited at 367.55 and 373.55 for Ag3d5/2 and Ag3d3/2 respectively (Tang et al., 2020). These BEs in both AP-0 and AP-02 are lower compared to the sample before photocatalytic reaction treatment, indicating that the Ag+ ions on the surface were in a different environment state. This feature might be caused by interaction with intermediate products of RhB degradation such as carboxylate compounds. The most important in the photocatalytic reaction is a metallic Ag as a result of photoreduction. The Ag0 in AP-0 exhibited at 368.89 eV and 374.88 eV whereas in AP-02 found at 368.98 eV and 374.99 eV for Ag3d5/2 and Ag3d3/2 respectively (Sulaeman et al., 2020). There is a BE shift of 0.1 eV. The higher BE of Ag0 in AP-02 might have more metallic properties incorporated on the surface of Ag3PO4. This phenomenon was also supported by XRD data that the lower d-space of Ag0 was found. The metal Ag0 in the large defect of AP-02 may act as a dopants on the surface which has a strong function in the photocatalytic reaction.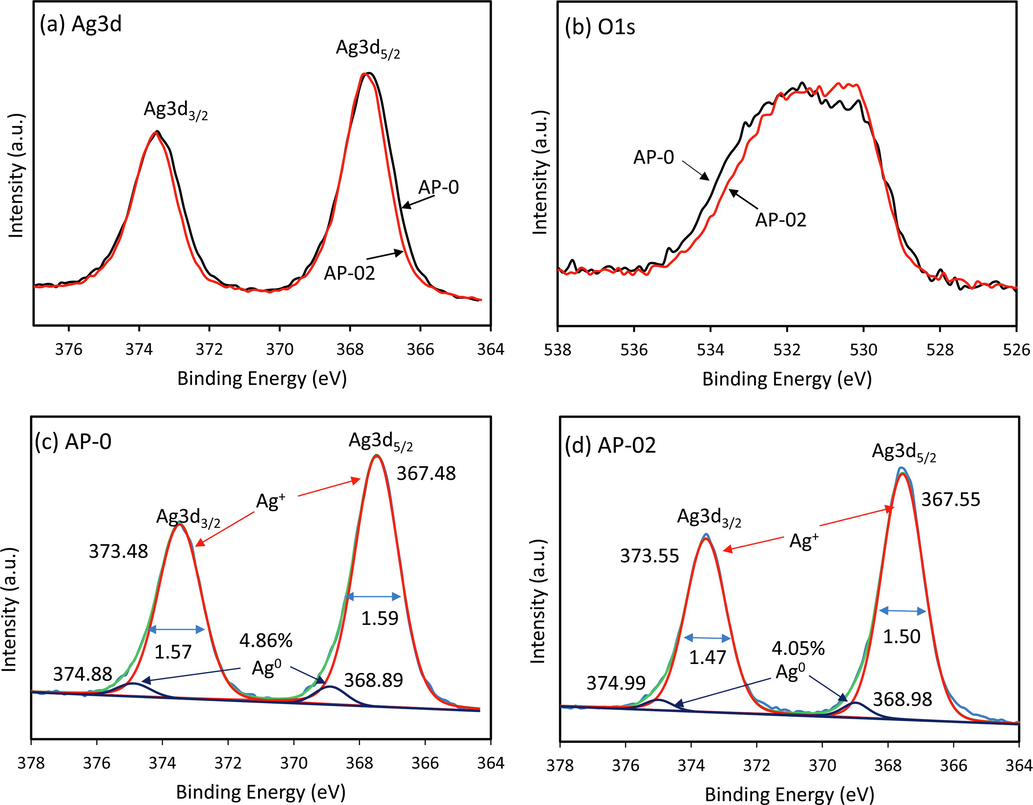
XPS profile of Ag3d (a) and O1s (b) after 3 cycles of photocatalytic test, and their Ag3d deconvolution of AP-0 (c) and AP-02 (d).
3.4 Photocatalytic mechanism
The photocatalytic mechanism of AP-02 sample was demonstrated in Fig. 13. During the photocatalytic reaction, metallic Ag0 is created due to the reduction of Ag+ in the Ag3PO4 semiconductor. In a larger defective Ag3PO4, more metallic Ag was formed and might have closely interacted on the surface of Ag3PO4. This phenomenon can enhance photo-generated electron transfer from Ag3PO4 to metallic Ag, resulting in high photo-stability. Ag3PO4 has a narrow band gap energy of 2.45 eV. When irradiated with visible light, the electron could be excited to the conduction band (CB). The generated electrons in CB can flow directly to metallic Ag, while the generated holes are trapped by the surface Ag vacancies, leading to an improvement in photogenerated separation efficiency. The Ag0 incorporated on the surface of the Ag3PO4 can trap the photo-generated electrons. This metallic Ag nanoparticle can form a Schottky barrier at the Ag-semiconductor interface, therefore, the photogenerated electron can easily diffuse to Ag and enhance the photocatalytic performance (Bunluesak et al., 2021). Once the photogenerated carriers are trapped by metallic Ag and silver vacancies, the electron in CB readily reduces oxygen (O2) on the surface to generate the superoxide radical anions (•O2−), while the holes oxidize the adsorbed pollutant (RhB) to produce degradation product.
The mechanism of photocatalytic reaction in AP-02 photocatalyst.
4 Conclusions
The enhanced photo-stability of defective Ag3PO4 was successfully prepared using a co-precipitation method with starting material of AgNO3, sodium tripolyphosphate (STPP) and Na2HPO4*12H2O. The STPP solution is the key factor in inducing the silver vacancy formation in Ag3PO4. The higher concentration of STPP solution the higher the silver vacancy was formed. Larger silver vacancy in Ag3PO4 (AP-02) exhibits higher photo-stability. This phenomenon was induced by the formation of metallic Ag in silver vacancy during the photocatalytic reaction. The formation of metallic Ag in larger silver vacancy might increase the interaction of generated metallic Ag with Ag3PO4 lattice. In the large defect of AP-02, the interaction of Ag0 and Ag3PO4 is stronger than in AP-0. The metallic silver can act as an accepting photogenerated electron that can maintain the ability of photocatalytic activity.
Acknowledgement
This research was financially supported by the Directorate of Research, Technology, and Community Service, the Republic of Indonesia, in the Scheme of World-Class Research (024/E5/PG.02.00.PT/2022).
Declaration of Competing Interest
The authors declare that they have no known competing financial interests or personal relationships that could have appeared to influence the work reported in this paper.
References
- Photoluminescence and photocatalytic properties of Ag3PO4 microcrystals: an experimental and theoretical investigation. ChemPlusChem. 2016;81:202-212.
- [CrossRef] [Google Scholar]
- Visible-light-driven heterostructure Ag/Bi2WO6 nanocomposites synthesized by photodeposition method and used for photodegradation of rhodamine B dye. Res. Chem. Intermed.. 2021;47:3079-3092.
- [CrossRef] [Google Scholar]
- Synthesis and color tuning of titanium oxide inorganic pigment by phase control and mixed-anion co-doping. Adv. Powder Technol.. 2022;33:103576
- [CrossRef] [Google Scholar]
- Magnetic core-shell carbon microspheres (CMSs)@ZnFe2O4/Ag3PO4 composite with enhanced photocatalytic activity and stability under visible light irradiation. J. Mol. Catal. A Chem.. 2015;409:198-206.
- [CrossRef] [Google Scholar]
- Enhanced photocatalytic activity of Ag3PO4 for oxygen evolution and Methylene blue degeneration: Effect of calcination temperature. Int. J. Hydrogen Energy. 2016;41:2575-2582.
- [CrossRef] [Google Scholar]
- Boosting visible photocatalytic degradation of 2,4-dichlorophenol and phenol efficiency by stable core@shell hybrid Ag3PO4@polypyrrole. Colloids Surfaces A Physicochem. Eng. Asp.. 2022;648:129296
- [CrossRef] [Google Scholar]
- Novel preparation of stable and highly photocatalytic Z-scheme Cs3PW12O40/Ag3PO4 photocatalysts for the photocatalytic degradation of organic contaminants in water. Water Sci. Technol.. 2022;85:887-899.
- [CrossRef] [Google Scholar]
- Synthesis of ZnWO4/Ag3PO4: p–n heterojunction photocatalyst with enhanced visible-light degradation performance of RhB. J. Mater. Sci. Mater. Electron.. 2022;33:7543-7558.
- [CrossRef] [Google Scholar]
- Use of a core-shell composite Ag3PO4@TCNQ to improve photocatalytic activity and stability. Appl. Surf. Sci.. 2017;425:329-339.
- [CrossRef] [Google Scholar]
- Fabrication of SubPc-Br/Ag3PO4 composites with high-efficiency and stable photocatalytic performance. J. Photochem. Photobiol. A Chem.. 2021;405:112929
- [CrossRef] [Google Scholar]
- Ag3PO4@UMOFNs core-shell structure: two-dimensional MOFs promoted photoinduced charge separation and photocatalysis. ACS Appl. Mater. Interfaces. 2018;10:8758-8769.
- [CrossRef] [Google Scholar]
- A stable Ag3PO4@g-C3N4 hybrid core@shell composite with enhanced visible light photocatalytic degradation. Appl. Catal. B Environ.. 2016;183:133-141.
- [CrossRef] [Google Scholar]
- A stable Ag3PO4@PANI core@shell hybrid: Enrichment photocatalytic degradation with π-π conjugation. Appl. Catal. B Environ.. 2017;201:92-104.
- [CrossRef] [Google Scholar]
- The synergistic effect of graphene oxide and silver vacancy in Ag3PO4-based photocatalysts for rhodamine B degradation under visible light. Appl. Surf. Sci.. 2018;462:263-269.
- [CrossRef] [Google Scholar]
- Carbon cloth-supported MoS2/Ag2S/Ag3PO4 composite with high photocatalytic activity and recyclability. ChemCatChem. 2019;11:1017-1025.
- [CrossRef] [Google Scholar]
- CdS-Ag3PO4 nano-catalyst: A brief characterization and kinetic study towards methylene blue photodegradation. Mater. Sci. Semicond. Process.. 2021;122:105455
- [CrossRef] [Google Scholar]
- Role of oxygen vacancy in the plasma-treated TiO2 photocatalyst with visible light activity for NO removal. J. Mol. Catal. A Chem.. 2000;161:205-212.
- [CrossRef] [Google Scholar]
- Synthesis and photocatalysis of Ag3PO4 nanoparticles loaded on ZnO nanostructure flowers. J. Aust. Ceram. Soc.. 2019;55:1147-1152.
- [CrossRef] [Google Scholar]
- Native defects and hydrogen impurities in Ag3PO4. Phys. Rev. B. 2013;87:245205
- [CrossRef] [Google Scholar]
- An effect of N+ ion bombardment on the properties of CdTe thin films. Radiat. Phys. Chem.. 2012;81:201-207.
- [CrossRef] [Google Scholar]
- Native defects in silver orthophosphate and their effects on photocatalytic activity under visible light irradiation. Appl. Surf. Sci.. 2018;428:1029-1035.
- [CrossRef] [Google Scholar]
- Design of defect and metallic silver in silver phosphate photocatalyst using the hydroxyapatite and glucose. Indones. J. Chem.. 2020;20:1441-1447.
- [CrossRef] [Google Scholar]
- Surface modification of Ag3PO4 using the alginate for highly active photocatalyst under visible light irradiation. Surf. Interfaces. 2022;28:101672
- [CrossRef] [Google Scholar]
- Oxygen vacancy enhanced photocatalytic activity of perovskite SrTiO3. ACS Appl. Mater. Interfaces. 2014;6:19184-19190.
- [CrossRef] [Google Scholar]
- Fabrication and photocatalytic activity of Ag3PO4/T-ZnOw heterostructures. Nanoscale Res. Lett.. 2020;15:131.
- [CrossRef] [Google Scholar]
- Novel Ag3PO4/MoO3 p-n heterojunction with enhanced photocatalytic activity and stability under visible light irradiation. Appl. Surf. Sci.. 2017;409:250-260.
- [CrossRef] [Google Scholar]
- Microstructural parameters from X-ray diffraction peak broadening. Scr. Mater.. 2004;51:777-781.
- [CrossRef] [Google Scholar]
- Large scale and facile synthesis of novel Z-scheme Bi2MoO6/Ag3PO4 composite for enhanced visible light photocatalyst. Mater. Lett.. 2016;169:250-253.
- [CrossRef] [Google Scholar]
- Preparation of core-shell Ag3PO4@GOQDs and degradation of ciprofloxacin under visible light. Mater. Lett.. 2022;309:131451
- [CrossRef] [Google Scholar]
- Effective adsorption and removal of phosphate from aqueous solutions and eutrophic water by Fe-based MOFs of MIL-101. Sci. Rep.. 2017;7:3316.
- [CrossRef] [Google Scholar]
- Efficient photocatalytic degradation of tetracycline hydrochloride by Ag3PO4 under visible-light irradiation. Environ. Sci. Pollut. Res.. 2016;23:14422-14430.
- [CrossRef] [Google Scholar]
- In situ synthesis of Ag3PO4/C3N5 Z-scheme heterojunctions with enhanced visible-light-responsive photocatalytic performance for antibiotics removal. Sci. Total Environ.. 2021;754:141926
- [CrossRef] [Google Scholar]
- Ag3PO4-based photocatalysts and their application in organic-polluted wastewater treatment. Environ. Sci. Pollut. Res.. 2022;29:18423-18439.
- [CrossRef] [Google Scholar]
- Novel Ag3PO4/CeO2 p-n hierarchical heterojunction with enhanced photocatalytic performance. Mater. Res.. 2016;19:673-679.
- [CrossRef] [Google Scholar]
- Atomic-level and modulated interfaces of photocatalyst heterostructure constructed by external defect-induced strategy: A critical review. Small. 2021;17:2004980.
- [CrossRef] [Google Scholar]
- Construction of p-n type Ag3PO4/CdWO4 heterojunction photocatalyst for visible-light-induced dye degradation. Appl. Surf. Sci.. 2020;534:147544
- [CrossRef] [Google Scholar]
- Hierarchical Ag3PO4@ZnIn2S4 nanoscoparium: An innovative Z-scheme photocatalyst for highly efficient and predictable tetracycline degradation. J. Colloid Interface Sci.. 2021;586:708-718.
- [CrossRef] [Google Scholar]
- Construction and mechanism of a highly efficient and stable Z-scheme Ag3PO4/reduced graphene oxide/Bi2MoO6 visible-light photocatalyst. Catal. Sci. Technol.. 2018;8:3818-3832.
- [CrossRef] [Google Scholar]
- A facile synthesis of Ag3PO4/BiPO4 p-n heterostructured composite as a highly efficient photocatalyst for fluoroquinolones degradation. Environ. Res.. 2022;203:111843
- [CrossRef] [Google Scholar]
- Fabrication of Z-scheme Ag3PO4/MoS2 composites with enhanced photocatalytic activity and stability for organic pollutant degradation. Appl. Surf. Sci.. 2016;377:99-108.
- [CrossRef] [Google Scholar]
- Physicochemical characterization of maize tassel as an adsorbent. I. Surface texture, microstructure, and thermal stability. J. Appl. Polym. Sci.. 2009;111:1923-1930.
- [CrossRef] [Google Scholar]


