

Translate this page into:
The impact of thermal extraction on the quality of Phyllanthus emblica Linn. fruit: A systematic study based on compositional changes
⁎Corresponding authors. hanliyx@163.com (Li Han), zhangdingkun@cdutcm.edu.cn (Dingkun Zhang), linjunzhi@cdutcm.edu.cn (Junzhi Lin)
-
Received: ,
Accepted: ,
This article was originally published by Elsevier and was migrated to Scientific Scholar after the change of Publisher.
Abstract
Abstract
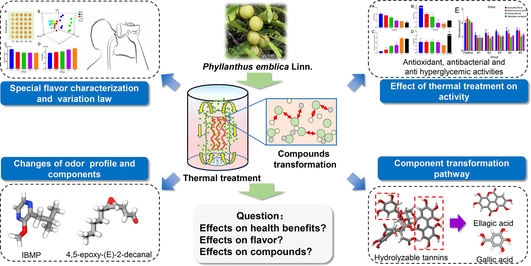
Phyllanthus emblica (PE) is a well-known tropical crop with a distinct flavor and several health advantages. From the standpoint of the transformation of volatile and nonvolatile components, the purpose of this paper is to investigate the impact of heat extraction on the flavor attributes and biological activity of PE. According to studies, thermal extraction can greatly enhance the amount of the molecule 4,5-epoxy-(E)-2-decanal with a green odor while removing offensive scents like 2-isobutyl-3-methoxy pyrazine. Temporal dominant description evaluation found that with the extension of thermal extraction time, the five flavors of PE are enhanced. According to high-resolution mass spectrometry studies, the primary reaction processes during thermal extraction were the hydrolysis and condensation of tannin and flavonoid glycosidic bonds. The main core groups of compound transformation were galloyl and hexahydroxydibenzoyl (HHDP), which led to the final product gallic acid and ellagic acid were significantly increased. Finally, it was found that thermal extraction can significantly enhance the antioxidant and antibacterial activities of PE.
Keywords
Phyllanthus emblica
Thermal extraction
Quality

1 Introduction
The fruit of Phyllanthus emblica Linn. (PE), which is a popular fruit tree belonging to the Phyllanthaceae family widely distributed in tropical and subtropical countries, such as India, Southwest China, Vietnam, Thailand and Indonesia, with thousands of years of edible history. In many Asian regions, PE is a chief source crop of vitamin C and minerals (Variya et al., 2016). As a fruit, its distinctive aftertaste sweetness and sour flavor are its most distinguishing flavor traits. These flavors can alleviate dry mouth and pharyngeal discomfort by providing long-lasting comfort to the tongue after a brief sour and astringent taste (Huang et al., 2021). Polyphenols, flavonoids, and amino acids are also abundant in PE. Particularly, polyphenols can make up as much as 33 % of the dry weight of PE (Avula et al., 2013). It has excellent antioxidant(Jhaumeer Laulloo et al., 2018) properties as well as anti-inflammatory, anti-diabetic, antibacterial, and anti-tumor effects due to the abundance of phenolic hydroxyl groups in it (Huang et al., 2021). PE is one of the three plants that are recommended by the WHO for planting internationally because of its distinctive flavor, abundant nutritional value, and exceptional efficacy. PE is currently widely employed in the production of dietary supplements, foods, pharmaceuticals, beverages, etc. due to its potent health advantages and distinctive flavor.
One of the crucial processes in the industrial processing of PE is thermal extraction. The PE extracting solution (PES) can be directly dried as PE extract (using microwave or spray drying), which can be employed as a step in the manufacturing and processing process. Therefore, PES will experience a thermal treatment process throughout the industrial extraction, drying, or sterilizing stages. The final product's flavor and activity may substantially depending on the process's time and temperature. Considering that PES is a common polyphenol solution (Yang and Liu 2014), PES's chemical reaction can be split into enzymatic and non-enzymatic reactions (thermal conversion), although thermal extraction inactivates the enzyme. The Arrhenius equation states that temperature is the primary determinant of a non-enzymatic reaction's outcome (Huang et al., 2019). Previous studies(Huang et al., 2019) discovered that polyphenols can primarily experience hydrolysis, oxidation, polymerization, and other reactions during the extraction process, which have a significant impact on their appearance, flavor, and activity. For instance, when heating tea soup, the change in appearance and flavor is more noticeable the higher the temperature and the longer the heating time (Zhu et al., 2020). Alcohol and coffee, both popular beverages, have similar reports (Li and Sun 2019). Some non-thermal extraction techniques, like ultrasonic, high hydrostatic pressure, pulsed electric fields, and non-thermal plasma, have recently gained popularity in the quest for authentic flavor and energy conservation. The flavor and biological activity of natural products are greatly influenced by the various extraction techniques. However, it has not been reported how different extraction techniques affect PES's flavor, taste, and bioactivity, and it is unclear how components transform during thermal extraction, which is a pressing issue that needs to be looked into.
To address the aforementioned issues, a rapid sensory evaluation research methodology for PES was established in this paper based on temporal dominant description taste evaluation and HS-SPME/GC-QQQ-MS/MS odor analysis technology. Additionally, the effects of the thermal extraction process on flavor, appearance, and physical and chemical properties were systematically investigated. Secondly, the primary difference indicators before and after heat extraction were discovered, and the primary transformation components and transformation pathways were hypothesized and confirmed based on multivariate statistical analysis. Finally, the component-activity correlation analysis method was utilized to uncover its quality markers after studying the transition laws of PES composition, flavor, taste, and activity. This is important for the processing and quality assessment of PES. In short, the purpose of this paper is to investigate the flavor and activity of PE after thermal processing, such as extraction, drying, or sterilization. We also hope that this study will serve as a guide for PE extraction and preparation in the pharmaceutical, food, and beverage, and other industries.
2 Materials and methods
2.1 Ethics statement
Volunteers were given written informed consent regarding the purpose of the study and their right to keep information confidential. Informed written consent was obtained from all participants.
2.2 Materials and chemicals
Milli Q water purification system (Millipore, Bedford, MA, USA). HPLC-grade methanol Fisher Chemical (Fisher Chemical, Pittsburg, PA, USA). HPLC-grade formic acid, Anhydrous Ethanol (Analytical purity), Vitamin C (Chengdu KeLong Chemical Factory, Chengdu, China). DPPH free radical scavenging ability test kit, ABTS buffer solution (Solaribio biotechnology Co., ltd. Beijing, China), α-Glucosidase (Sigma, USA), 4-Nitrophenyl-β-d-glucopyranoside (PNPG, Sigma, USA) Acarbose (Bayer, Germany). Standards of Citric acid, mucinous acid, malic acid Gallic acid (GA, No. CHB201131), Epicatechin gallate (ECG, No. CHB-B-081), Quercetin(Q, No. CHB-H-040), Corilagin (CR, No. CHB-K-004), Gallocatechin (GC, No.4051109), Catechin (C, No.14051508), Epigallocatechin gallate (EGCG, No.14121608), Gallocatechin gallate (GCG, No.14102009), Ellagic acid (EA, No. CHB-R-039), Chebulagic acid (CLA No. CHB-H-114), Chebulic acid (CA No. CHB-H-140), Chebulinic acid (CBA No. CHB-H-018) were purchased from Chengdu Biopurify Phytochemicals ltd. (Chengdu, China). The purity of the twelve standards was each above 98.0 %.
2.3 Preparation of sample solution
Take an appropriate amount of 6 batches of PE dried fruits (batch number: 190401; 201203; 200601Z; 201209; 210101; 200301) as parallel samples. Accurately weigh an appropriate amount of PE, add 10 times pure water, heat and reflow for 0 h (ultrasonic 30 min, E1), 0.5 h (E2), 1 h (E3), 1.5 h (E4), 2 h (E5), and make up for the weight loss after cooling. Then immediately centrifugate at high speed (9000 r) for 10 min, and take the supernatant as the sample solution.
2.4 Determination method of appearance and physicochemical parameters
Accurately suction 300 μL of the sample and added it to a 96-well plate. Then the flatbed scanner (Epson perfection V370 Photo) was used to obtain the scanned image. And the Photoshop CC was used to obtain the R, G, B values of the and make a color chart, and the data were analyzed by PCA. The surface tension was measured by DCAT-21 surface tension analyzer (DataPhysics, Germany). The temperature was set at 25 ℃, and added 30 mL PES. The surface tension was measured by Wilhelmy hanging plate method after temperature equilibrium. The solution viscosity was determined by LVDV-1 T viscometer (Shanghai Fangrui Instrument Co., ltd.), the temperature was set at 25 ℃, rotor 1 was selected, 20 mL PES was added, and the rotational speed was set at 12 r/min.
2.5 Electronic tongue analysis method
The signal acquisition parameters were set as follows: acquisition temperature 25 ℃, data acquisition time 120 s, acquisition cycle 1 s, stirring speed 1 R/s. The ultrapure water was used as cleaning solution, and the sensor was cleaned for 10 s before each measurement. The above PE solutions was filtered through a 0.45 μm microporous membrane and placed in a 50 mL matching beaker for determination. Each sample was determined 10 times in parallel according to the above method, in order to obtain stable results. For reliable data, the last three times of data are taken as the output value. The average of the three output values of each sample was taken as the post-processing data. The verification results show that RSD was<2 %, indicating that the instrument was stable. When the sample was measured, the PE sample solution was diluted to a concentration of 6 mg/mL for testing.
2.6 UPLC-QTOF-Mass conditions
2.6.1 Sample preparation
Precisely draw 0.1 mL of the above PE extraction solution to 5 mL volumetric flask, add 50 % methanol–water solution to the scale line and dissolve it by ultrasonic for 30 min as the sample solution. Appropriate amount of each reference substance was weighed and made into reference substance solution respectively. All solutions above were filtered through 0.22 μm membranes (Jinteng, Tianjin, China) before injection.
2.6.2 Chromatographic conditions
Samples were analyzed by Acquity UPLC I-class (Waters) ultraperformance liquid chromatography system. The Waters ACQUITY UPLC BEH C18 column (2.1 mm × 100 mm, 1.7 μm) was used for the analysis. The mobile phase A was 0.1 % formic acid aqueous solution, and the mobile phase B was acetonitrile solution. The gradient elution was 0–3 min, 2 %-2% B; 3–5 min, 2 %-7% B; 5–15 min, 7 % −21 % B; 15–20 min, 21 %-78 % B; 20–21 min, 78 %-85 % B; 21 % −24 % min, 85 %-95 % B; 24–26 min, 95 %-95 %B; 26–28 min, 95 %-2%B; 28–30 min, 2 %-2%. The column temperature was set as 40 ℃, and the flow rate was 0.3 mL/min, and the injection volume was 3 μL.
2.6.3 Mass spectrometry conditions
Samples were analyzed by SYNAPT XS (Waters) high-resolution time-of-flight mass spectrometer. The electrospray ion source (ESI) negative ion mode is used for detection and analysis. The spatial resolution was 120 μm, capillary voltage was 4 kV, cone voltage 50 V, ion source temperature 150℃. The atomizing gas was high-purity nitrogen, cone gas flow rate was 50 L/h, desolvention gas flow rate was set as 600 L/h, and the temperature was set as 250 ℃. The mass spectrum data was collected in MSE mode, ion scanning range was m/z100-1200. Leucine-enkephalin (LE) was used for calibration during data acquisition. LE [M−H]- accurate relative molecular mass was calculated as m/z 554.2615 in negative ion mode.
2.6.4 Data processing and multivariate analysis
Masslynx 4.1 was used to collect data, and the original data was imported into progenesis Qi (Waters, V2.0) for processing. The quality error parameter |ppm|<5 was set, and the peak comparison, selection and normalization were performed to obtain the retention time, m/z and peak intensity of each sample. The above information was imported into EZinfo 3.0 for principal component analysis (PCA) and partial least squares discriminant analysis (OPLS-DA) to find the different compounds. Finally, compounds with VIP > 1and P < 0.05 were selected as differential metabolites.
2.7 Temporal dominant description method
To evaluate the taste difference of PES, a human sensory test using the visual analog scale (VAS) was proposed to verify the results(Han et al., 2018). With the approval of the medical ethics committee of the Affiliated Hospital of Chengdu University of TCM, 10 well-trained and healthy volunteers (4 males and 6 females, aged 21–28) were selected. Volunteers were selected from graduate students at Chengdu University of Traditional Chinese Medicine. They had no smoking, drinking and other bad habits, no genetic history, no recent oral and throat diseases, and normal taste. All volunteers were voluntary and signed informed consent before the trail.
PES has five basic flavors, which are astringency, bitterness, sourness, saliva secretion and aftertaste-sweetness. It is necessary to establish a special method for PES taste and flavor evaluation, which is called temporal dominant description method(Li et al., 2019). During the training sessions, volunteers were trained with different concentrations of model solutions (Sucralose, 3.0, 5.0,7.0 mg/mL; Tannic acid, 0.5, 1.0,2.0 mg/mL; Citric acid, 0.5, 0.8,1.0 mg/mL; Quinine, 0.1, 0.2, 0.3 mg/ml), so they were accustomed to the evaluation scales and bitterness intensities. A drop of approximately 10 mL of each solution was applied to the upper surface of the tongue for 10 s. Then, the test solution was expectorated. Volunteers were asked to score the “bitterness, sweetness, astringency, sourness” using the 100 mm VAS by placing a mark along a 100 mm line 23. Between each test interval, the mouth was rinsed well with distilled water so that no bitter taste remained. Volunteers were given a break (at last 1 h or more) between each sample.
The taste intensity retention time was used to define the flavors duration (TIRT). The intensity of the PES's bitterness, astringency, and sourness (I) has been decreasing throughout the entire drinking process, whereas the aftertaste-sweetness and salivary secretion have been rising and then lowering throughout. To comprehensively describe TIRT, a coefficient reflecting time needs to be established to reduce the data dimension.
It was found through fitting calculation that the sensory intensity and retention time were linearly fitted (y = kx + b), and the fitting results were shown in Table 1. Thus, the slope k value could be easily obtained. The k value has the connotation that the shorter the taste retention period, the higher the absolute value of k must be. To characterize the flavor retention time, we now present its retention time coefficient K. The formula is as follows:
Batch
KB
R2
KS
R2
KA
R2
KAS
R2
E1
2.667
0.996
1.132
0.911
1.499
0.985
2.001
1.000
E2
1.600
0.989
1.062
0.879
1.350
0.885
1.538
0.903
E3
1.613
0.953
1.126
0.848
1.541
0.954
1.018
1.000
E4
1.395
0.929
1.013
0.833
1.301
0.973
1.177
1.000
E5
1.163
0.936
0.841
0.833
1.270
0.972
1.500
0.984
K represents the TIRT coefficient of 5 tastes, which are defined as: bitterness (KB), astringency (KA), sourness (KS), and aftertaste-sweetness (KAS). Salivary secretion is calculated by the sum of salivary secretion times. In the fitting process, the data starting from 5 s until the taste intensity is greater than or equal to 0.5 are regarded as fitting objects. This rule applies to sourness, bitterness and astringency, and the TIRT coefficient K and R2 can be directly obtained (k < 0, R2 > 0.800). However, the aftertaste-sweetness intensity increased first and then decreased. Their K value is the reciprocal of rising slope k1 minus the falling slope k2 (k1 > 0 k2 < 0). Finally, Multiply the above-mentioned sensory TIRT coefficient K by the sum of various sensory intensities (SI) at each time point to obtain the comprehensive taste coefficient T of each taste. The calculation formula is as follows:
n is the number of time points in the evaluation process.
2.8 HS-SPME/GC-QQQ-MS/MS conditions
2.8.1 HS-SPME conditions
The lyophilized sample was crushed into fine powder (passed through a No. 3 sieve). Accurately weighed 0.5 g PE fine powder and placed in a 20 mL inert headspace bottle, and then equilibrated at 50 °C for 40 min. Before and after sample injection, the Solid phase microextraction (SPME) head was automatically aged for 3 min in the 270 ℃ aging device, inserted into the headspace via a PTFE septum, without contact the sample. After extraction and adsorption at a constant temperature of 50 ℃ for 10 min, the SPME head quickly insert the GC–MS injection port in the pre-operation state, desorb at 250 ℃ for 2 min, and then perform GC–MS/MS analysis.
2.8.2 Chromatography and mass spectrometry conditions
The PE samples (lyophilized powder) were analyzed by a TQ8050 NX triple quadrupole GC–MS equipped with Aoc-6000 automatic sampler and an electron bombardment ion source (EI), a PAL heating magnetic stirring module and a PAL SPME Arrow solid phase microextraction sampler (1.5 mm × 120 μm × 20 mm, PN: ARR15-DVB/C-WR-120/20CT, CTC Analytics AG, Switzerland). The inertcap pure wax capillary column (30 m × 0.25 mm × 0.25 μm) was used as chromatographic column during analysis. The chromatographic conditions were set as follows: injection temperature was 250 ℃, split ratio was 5:1, injection pressure was 83.5 kPa; carrier gas was high purity helium, carrier gas control mode was constant pressure mode; purge flow was 3.0 % mL/min. The temperature program was set as follows: the initial temperature was 50 ℃ for 5 min, then raised from 10 ℃ to 250 ℃ for 10 min; the column equilibrium time was 2.0 min. The mass spectrometry conditions were set as follows: the ionization energy was 70 EV, the ion source temperature was 200 ℃, the mass spectrum transmission interface temperature was 250 ℃, the collision gas is argon; the mass spectrum monitoring mode is multi reaction monitoring (MRM), the detector voltage is + 0.3kv relative to the tuning result, and the solvent delay time is 1.3 min. In order to improve the sensitivity of the detection, the compounds were monitored by time segment.
2.8.3 Qualitative and quantitative method
Precisely draw 1 μL of a mixed solution (0.1 μg/mL) containing 3 kinds of internal standard substances for analysis to obtain the peak area of the internal standard substance, and finally measure the sample according to the above conditions. The qualitative of the target compound is confirmed by the qualitative and quantitative transition. The quantification of the target compound is quantified by the standard curve of 150 compounds built in the Shimadzu TQ8050 reanalysis software (The method parameters and sensory information (odor characteristics and odor threshold, etc.) of about 150 odor compounds were registered in the database.) combined with the measured peak area of the internal standard. Through the method package and database, it is very convenient to establish a variety of odor compounds screening methods, and use the built-in standard curve to semi quantify the detected compounds, and confirm the odor causing substances by comparing the results with their odor threshold.
The term ‘odor threshold’ describes the least concentration (pg/mg) of a substance that irritates people's sense of smell. The content and threshold work together to determine how well odor components perform in PE, rather than just the content alone. The ratio of the concentration to the threshold is called the odor activity values (OAV):
In the formula: C represents the component content (pg); M for the sample mass(mg); Th for the component’s odor threshold (pg/mg). Generally, the components with OAV > 0.1 should be considered to have an obvious impact on their odor.
2.9 Antioxidant and antihyperglycemic activities
The α-glucosidase and PNPG reaction system was used as a model for testing, and the specific operations were as follows: Added 10 μL of α-glucosidase solution (2 U/mL) and 10 μL of the sample solution to each reaction well in turn, mixed well and incubated in a 37 ℃ water bath for 15 min. Then, added 50 μL of PNPG (1 mmol/L), placed it in a 37 ℃ water bath and incubate for 30 min, and finally added sodium carbonate solution to stop the reaction. Each sample had 3 replicate wells. The absorbance was measured at 405 nm as soon as possible by a multifunctional microplate reader. Acarbose was used as a positive control, the concentration was 12, 14, 16, 18, 20, 22, 24, 26, 28, 30 mg/mL; the samples were set with 8 concentration gradients of 10, 50, 100, 250, 500, 750, 1000 and 2500 μg/ml and calculate the inhibition rate.
DPPH, ABTS radical scavenging activity (IC50) and FRAP total antioxidant capacity of the sample were measured according to the instructions of the kit (Solebo biotechnology Co., ltd.).
2.10 Determination of antibacterial and antifungal activity
Staphylococcus aureus, Escherichia coli, Aspergillus variegatus and Aspergillus flavus (purchased from Baina Biological Co., ltd., China) were inoculated and cultured for 3 generations. Under aseptic conditions, take 0.2 mL of bacterial suspension (the best concentration of bacterial solution is 1 × 10⁶ CFU/mL) and spread it evenly on the surface of the agar plate. The positive group was gentamicin sulfate injection (diluted four times, 10 mg/mL). Take 2 mL of each sample solution (10 times water extract, filter sterilization) into a sterilized EP tube, and then put a 6 mm diameter neutral filter paper into the EP tube to soak for 4 h. Place the filter paper clockwise on the same plate, parallel three groups, and measure the average value after incubation at 37 ℃ for 24 h.
2.11 Data processing and analysis
Analysis was performed by using Heat map and Cor-Heatmap tools in Hiplot (https://hiplot.com.cn), a comprehensive web platform for scientific data visualization. Statistical analyses were performed using SPSS 22.0 package (SPSS Inc., Chicago, IL, USA) and Oringin 2018 (OriginLab, Hampton, Massachusetts, USA). PCA and OPLS-DA were analyzed by SIMCA-P11.0 (Umetrics AB, Umea, Sweden).
3 Results
3.1 PES physicochemical properties changes during thermal extraction
The physical properties and appearance of PES changed significantly during the extraction process, and the results are shown in Fig. 1 (E1 represent ultrasonic extraction or thermal extraction for 0 h; E2, E3, E4 and E5 stand for heating reflux extraction for 0.5 h, 1 h, 1.5 h and 2 h respectively).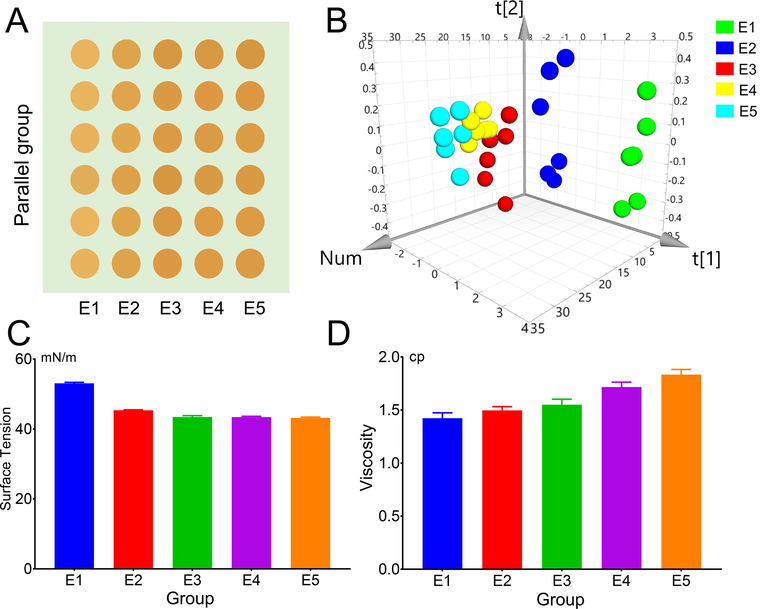
Appearance and physical properties results, A the appearance of different extraction time, B PCA analysis of R, G, B values of different extraction time appearance, C variation of surface tension and D viscosity at different extraction time.
The results in Fig. 1 demonstrated that the color of PES deepened as extraction time increased, surface tension significantly decreased, and viscosity was favorably connected with extraction time. The metamorphosis of internal parts is intimately tied to this change in appearance and physical characteristics. Indicating that some components created after transformation have higher surface activity than the original components, such as polysaccharides and polyphenols (Zhan et al., 2018). Therefore, its physical and chemical properties are closely related to the transformation of its components.
3.2 Sensory evaluation results
3.2.1 Temporal dominant description results
A temporal dominating description method (Li et al., 2019) to assess the sensory qualities of PES was established based on its taste characteristics, and it is capable of precisely and dynamically describing the flavor changes that occur in PES during the thermal extraction process.
Heat maps were used to examine the average scores of PES samples (E1 to E5) at various time intervals, and the results are displayed in Fig. 2A. Sourness, bitterness, and astringency dominated taste perception in the first 0–20 s, followed by aftertaste sweetness and saliva secretion in the second 20–60 s. As seen in Fig. 2B, PCA can clearly distinguish PES at five locations (R2 = 0.989, Q2 = 0.87), demonstrating that the model is capable of evaluating the sensory time intensity in its whole. The loading scatter plot can also show how extraction time affect PES tastes (The smaller the Euclidean distance, the greater the impact). The result of Fig. 2A and the distance of E1 from each point in Fig. 2C both indicate that E1′s tastes intensity are the weakest. Additionally, E4 has a stronger taste of saliva secretion and aftertaste-sweetness, whereas E3 is more noticeably impacted by bitterness and sourness. E5 has the most noticeable astringency. The smallest bitterness and astringency make E1 seem like the best option, but the aftertaste-sweetness is not obvious. The strength of the astringency and sourness soon decreased after spitting out PES, and the aftertaste-sweetness and salivation now predominate. The major elements that had the biggest influence on customer preferences is aftertaste-sweetness, a flavor that is most characteristic to PE. Considering the biological activity and flavor, E2 and E4 are the best choices.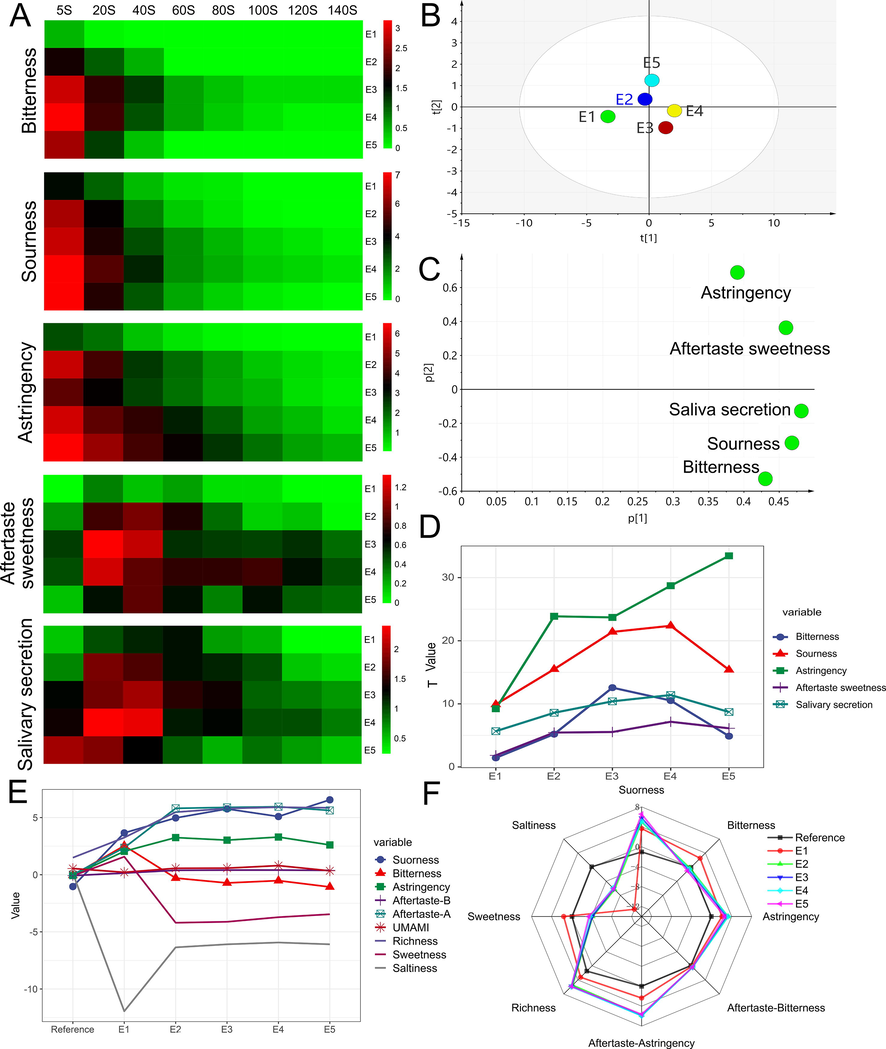
Temporal dominant description method and electronic tongue results, A the VAS scores heat map of PES samples (E1 to E5) at different extraction time points, B PCA analysis results of T value, C loading scatter plot, D change tendency of T values, E, F electronic tongue measurement results.
Electronic tongue was employed as a benchmark to further validate the temporal dominant description method's findings. In all tastings, E1 could be recognized from other samples according to the radar map (Fig. 2 F). The aftertaste-sweetness and bitterness showed the highest value at the E1 time point, and then decreased to 0 or negative value with the extension of the extraction time, which was slightly different from the volunteers' results. The trend of sourness and astringency was consistent with the volunteer evaluation results (Fig. 2 E, F). The majority of participants believed PES to have very little bitterness, according to the results of the volunteer evaluation stage. The complexity of PES's components and the possibility that some bitter compounds go unrecognized by the electronic tongue may play a significant role in this discrepancy (Reis et al., 2020). Additionally, the cause of the aftertaste-sweetness in PES is unknown, however it is hypothesized that it may be due to ingredients like EC or EGC, which is similar to tea soup (Zhang et al., 2016). According to certain research (McBurney and Bartoshuk 1973), the aftertaste's sweetness could be a contrast effect and an oral cavity illusion. When the bitterness, sourness and astringency of PES continue to rise, the contrast effect is significantly enhanced, leading the brain to perceive the sweetness as stronger(Liu et al., 2023). This may be why the aftertaste-sweetness cannot be detected by the electronic tongue. As a result, the temporal dominant description method can be used to collect more plentiful sensory data.
3.2.2 Transformation of volatility components (Odor components)
One of the sensory qualities of PES is its distinct fragrance. It typically has a sweetness and aroma similar to caramel after thermal extraction, which may primarily be the result of the Maillard reaction during the heating and extraction process. Based on HS-SPME/GC-QQQ-MS/MS odor analysis technology, this paper established a rapid method to identify the chemical components in the special odor of PES, and explored the key differences in the odor components of different extraction time of PES.
According to the OAV calculation formula, the odor components of different batches of PES were analyzed, and 44 components with OAV > 0.1 were found (Table.2). The primary difference markers before and after heating extraction can be quickly identified using the OAV combined with multivariate statistical analysis method (OPLS-DA, Fig. 3A), and significantly difference markers (VIP > 1, t < 0.05 and OAV > 0.1) were found in Fig. 3B and C, namely ethyl acetate, acetic acid, 5-methyl furfural, phenylacetaldehyde and cinnamic acid. ** t < 0.05, ***t < 0.01.
No
Compounds
Odor description
Threshold Th (pg/mg)
Rt(min)
Average content of different time points C (pg)
Difference marker
E1
E2
E3
E4
E5
1
Ethyl acetate
Pineapple fragrance
1000
2.104
17679.810
4978.099
4170.190
4812.597
3084.240
***, VIP > 1
2
Diacetyl
The smell of butter
10
2.844
2780.087
3044.103
3013.911
3565.254
4027.459
***,
3
Mesityl oxide
Sweet, chemical
10
5.885
219.310
114.199
109.183
58.015
97.774
***
4
Octanal
Sharp and powerful aromas of green and pungent fat and wax, with fruity and jasmine flavor
100
9.505
5042.463
3720.061
5249.689
3089.878
4270.557
**
5
trans-2-Heptenal
Fat, soap, almond
10
10.062
7576.881
6416.928
8467.292
2316.654
5600.729
***
6
Acetic acid
Sour taste
1000
12.214
155781.700
144864.600
165983.400
151018.900
146999.400
***, VIP > 1
7
n-Decanal
Soap, fat and wax, orange peel
1
13.100
1934.932
857.739
1010.537
647.460
914.326
***
8
Benzaldehyde
Almond, caramel
1000
13.311
17749.770
10876.730
23326.900
13415.560
15396.800
***
9
2-isobutyl-3-methoxypyrazine
Soil flavor, spice flavor, green pepper flavor
0.01
13.452
115.295
0.00
0.00
1.482
2.984
***
10
Propionic acid
Putrid, spicy, soy sauce
1000
13.494
28489.240
27113.080
32335.810
28386.72
27966.280
**
11
2-Nonenal
Paper smell
1
13.593
712.872
444.596
274.554
193.8355
364.596
***
12
Linalool
Fragrance of flowers and lavender
10
13.748
168.231
77.238
67.215
93.078
66.678
***
13
1-Octanol
Metal, burnt, chemical
100
13.890
2446.057
1112.965
1629.611
1039.398
1519.007
***
14
5-Methyl furfural
Almond, caramel
1000
14.045
18341.990
18410.610
30691.11
28451.61
27409.110
***, VIP > 1
15
2-Methylisoborneol
Stale and mouldy
0.1
14.412
55.292
21.092
16.1185
25.302
43.0823
**
16
Butyric acid
Putrid, cheese, sweat
1000
14.783
11648.820
10312.040
14454.66
12758.38
12293.490
***
17
Phenylacetaldehyde
Sweetness and honey
10
15.005
5273.081
11327.300
18975.170
15960.59
14878.980
***, VIP > 1
18
Isovaleric acid
Putrid, sweat, sour
100
15.333
8692.676
8011.605
10624.230
9697.376
9639.278
***
19
Salicylaldehyde
Herbal, toasted
1
15.477
421.378
474.004
1599.766
1080.489
1108.472
***
20
trans-2,4-Nonadienal
Green fragrance, wax and fat fragrance
10
15.830
140.112
67.627
121.844
37.979
56.982
***
21
Borneol
Stale and mouldy
1
15.843
115.335
145.7845
68.821
83.160
56.425
***
22
n-Dodecanal
It has a strong aroma similar to pine leaf oil and orange oil
10
15.973
934.002
910.518
1065.818
983.073
519.857
***
23
Methyl salicylate
mint
1
16.737
1200.007
843.041
2697.523
1253.449
1897.136
***
24
Isocaproic acid
Putrid, sweat, sour
100
17.007
1407.514
1540.538
1826.279
1804.966
1618.833
***
25
Caproic acid
The smell of sweat
100
17.485
23065.970
20280.700
28414.050
27251.1
25879.550
***
26
Geraniol
Geranium, rose
1
17.578
890.972
365.687
210.674
182.1175
322.966
***
27
Guaiacol
Sweetness, medicine, smoke
1
17.683
425.341
385.427
962.766
685.9205
749.733
***
28
Benzyl acetone
Fruity, ethereal
0.1
17.695
47.115
114.831
113.401
22.477
58.058
***
29
Benzyl alcohol
Sweet, fragrant
100
17.859
4497.089
2934.417
5527.015
3635.269
4164.503
***
30
gamma-Octalactone
Coconut aroma
1
18.339
171.964
114.652
152.928
63.7055
136.989
***
31
Dibutylhydroxytoluene
Phenol smell
10
18.373
283.703
143.2315
204.395
330.4785
361.382
***
32
beta-Ionone
There are aromas of violet, raspberry and seaweed
0.1
18.662
14.278
0.00
0.00
0.00
6.2183
***
33
Enanthic acid
Green, orange, soap, gasoline
10
18.718
3795.854
4339.398
4582.191
4744.185
3963.703
34
4,5-Epoxy-(E)-2-decenal
Green fragrance, metal smell
0.01
19.363
341.767
245.0385
491.539
261.4515
427.676
35
p-Ethylguaiacol
Spice and clove oil aroma
0.1
19.601
92.2110
97.9505
134.066
115.211
111.543
***
36
p-Cresol
It has the smell of smoke and herbal medicine
1
20.099
490.315
462.228
935.463
650.2635
673.653
***
37
m-Cresol
Plastic, faeces smell
0.1
20.184
605.872
562.249
1211.434
835.6695
865.460
38
2,3-Xylenol
Gasoline smell
1
20.789
2.356
14.049
20.419
15.59
10.696
39
Pelargonic acid
Green fragrance, oil fragrance
100
20.992
3084.561
3663.357
2449.716
3167.952
2207.319
***
40
Capric acid
Greasy, stale
10
22.030
747.462
974.287
561.2085
818.2395
434.442
***
41
Coumarin
Sweet and green
1
23.753
14.947
11.956
16.089
13.9845
14.070
***
42
Phenylacetic acid
Floral, honey
10
24.646
1686.522
1674.168
1839.024
1568.55
1629.066
***
43
Vanillin
Vanilla
1
24.681
490.291
448.2035
1731.433
785.6225
1445.416
***
44
Cinnamic acid
It has the fragrance of cinnamon
100
27.562
25344.500
35321.860
62970.090
49,981
69568.300
***, VIP > 1
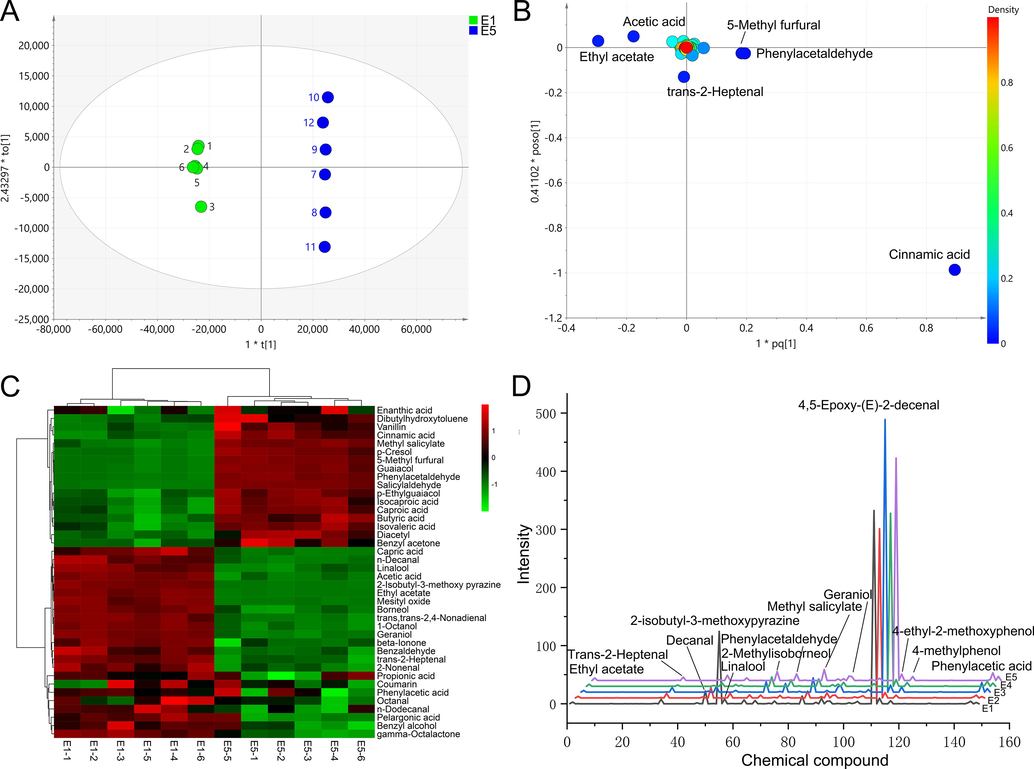
Analysis results of odor components, A, OPLS-DA results for E1 and E5, B loading scatter plot (the marked components indicate VIP > 1), C difference compounds (t < 0.05, the threshold>0.1), D odor characteristic spectrum (OCS) of PES.
To precisely describe the odor differences, here we introduce the odor characteristic spectrum (OCS) to quickly and intuitively describe the odor profile of the sample. The OCS of PES is obtained in Fig. 3D by using the odor components as the abscissa and the OAV (Intensity) as the ordinate, and this allows us to quickly identify the components that are crucial in causing odor alterations. According to Fig. 3D, 2-isobutyl-3-methoxypyrazine is the distinctive odor of E1, which provides a clue as to whether it was extracted through heating. Wine often contains 2-isobutyl-3-methoxy pyrazine (IBMP), a substance that should be avoided because it is mostly produced by unripe grapes and can adversely impact the wine's overall flavor (Ling et al., 2021). Among them, 4,5-epoxy-(E)-2-decanal occupies the most conspicuous position. This substance has a green flavor, and its OAV keeps rising with the extension of heat extraction time. N-decanal and methyl salicylate are two more noteworthy components. While the latter's OAV value continuously rises, the former's falls during the extraction process (Table.3). Methyl salicylate is described as mint smell, which is frequently added to cosmetics to improve their aroma. Other flavor substances, such as methyl salicylate, geraniol, phenylacetaldehyde and vanillin, increase dynamically with the extension of extraction time, giving PES more distinctive flavor.
No
Compounds
Odor description
E1
E2
E3
E4
E5
1
beta-Ionone
Aroma of violets, raspberries, seaweed
1.428
0.473
0.617
0.710
0.622
2
Acetic acid
Sour
1.558
1.449
1.660
1.510
1.470
3
Phenylacetic acid
Floral scent, honey
1.687
1.674
1.839
1.569
1.629
4
gamma-Octalactone
Coconut aroma
1.720
1.147
1.529
0.637
1.370
5
Cinnamic acid
With cinnamon aroma
2.534
3.532
6.297
4.998
6.957
6
Caproic acid
Sweat smell
2.307
2.028
2.841
2.725
2.588
7
Diacetyl
Butter scent
2.780
3.044
3.014
3.565
4.027
8
Enanthic acid
Green, orange, soap, gasoline
3.796
4.339
4.582
4.744
3.964
9
Vanillin
Vanilla
4.903
4.482
17.314
7.856
14.454
10
Guaiacol
Sweet, medicinal, smoke
4.253
3.854
9.628
6.859
7.497
11
Salicylaldehyde
Herbal flavor, toast flavor
4.214
4.740
15.998
10.805
11.085
12
Benzyl acetone
Fruity, ethereal
4.712
11.483
11.340
2.248
5.806
13
p-Cresol
Smoky, herbal smell
4.903
4.622
9.355
6.503
6.737
14
Phenylacetaldehyde
Sweet, honey,
5.273
11.327
18.975
15.961
14.879
15
2-Methylisoborneol
Earthy, musty
5.529
2.109
1.612
2.530
4.308
16
trans-2-Heptenal
Fatty, soap, almond
7.577
6.417
8.467
2.317
5.601
17
Trans-2-nonanal
Papery
7.129
4.446
2.746
1.938
3.646
18
Geraniol
Geranium aroma, rose aroma
8.910
3.657
2.107
1.821
3.230
19
p-Ethylguaiacol
With spice and clove oil aroma
9.221
9.795
13.407
11.521
11.154
20
Methyl salicylate
Mint
12.000
8.430
26.975
12.534
18.971
21
n-Decanal
Soap, waxy, orange peel aroma
19.349
8.577
10.105
6.475
9.143
22
m-Cresol
Plastic, fecal smell
60.587
56.225
121.143
83.567
86.546
23
2-Isobutyl-3-methoxy pyrazine
Earthy, spice, green pepper
115.296
0.000
0.000
1.482
2.984
24
4,5-Epoxy-(E)-2-decenal
Green scent, metallic scent
341.767
245.039
491.539
261.452
427.676
3.3 Transformation of non-volatile components
Heated extraction usually involves a non-enzymatic chemical reaction that facilitates the hydrolysis of tannins to produce low molecular weight molecules, including polyols, gallic acid, ellagic acid, and saccharides. However, under conditions of continued heating, these small molecular products will continue to react, leading to complex end products (Lu et al., 2008). PES has a molecular structure that has numerous active sites and active groups, including phenolic hydroxyl and carboxyl groups, acyl groups, etc. that allow for a range of complex reactions. According to results (Fig. 4), this process has the following characteristics: 1. The reaction process is intricate, involving both hydrolysis and polymerization; 2. The reaction is significant and rapid after heating; 3. A variety of end products with intricate structures are produced. With the help of high-resolution mass spectrometry, we focus on the following aspects:1. Determine the chemical change profile, such as reaction type, general reaction rules, etc.; 2. Identify the compounds with the most significant transformation; 3. Identify some representative basic transformation pathways; 4. Pay attention to the transformation of important active ingredients in PES, such as gallic acid and ellagic acid.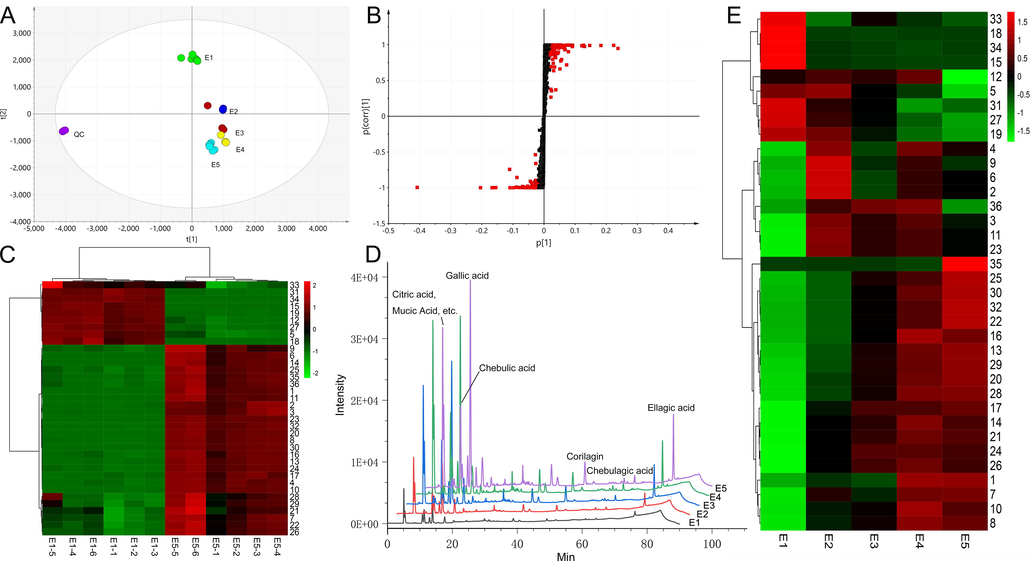
Analysis results of differential markers, A. PCA results, B S-plot, C difference marker heat map, D, HPLC chromatogram at different extraction times, E. change trends of differential markers.
Through Progenesis QI software, standard substance and literature information, 36 differential markers (VIP > 1, p < 0.05) were identified (Fig. 4 B, C), which represented the most significant transformed compounds in PES (Table.4). In differential markers, the decreased components may participate in transformation. The reaction pathway can be determined by analyzing the dynamic change trend of the compound in combination with literature reports and experiments.
No
Compound
Retention time (min)
Molecular formula
Measured (m/z)
Molecular ion
Error
(ppm)Isotope similarity
Content change
1
Quercetin
14.9703
C15H10O7
301.0344
M−H
−3.3317
91.4662
↓
2
3,4,8,9,10-pentahydroxy-6-oxo-6H-benzo[c]chromene-1-carboxylic acid
14.3442
C14H8O9
300.9983
M−H2O−H
−2.0450
89.5665
↑
3
Granatin B
14.3299
C41H28O27
951.0747
M−H
0.1397
81.9781
↑
4
Tellimagrandin II
14.1306
C41H30O26
937.0958
M−H
0.6183
83.46731
↑
5
Quercitrin
14.0949
C21H20O11
447.0923
M−H, 2 M−H
−2.1753
92.5691
↓
6
Bicornin
12.5511
C48H32O30
1087.091
M−H
0.7384
75.2856
↑
7
Ellagic acid
11.2482
C14H6O8
300.9982
M−H
−2.7505
95.0828
↑
8
Tercatain
10.5721
C34H26O22
785.0844
M−H
0.1668
82.8016
↑
9
Sanguiin H2
10.4656
C48H32O31
1103.086
M−H
0.1781
80.9349
↑
10
m-Trigallic acid
9.9388
C21H14O13
473.0362
M−H
0.1163
84.2970
↑
11
1-O-Galloylpedunculagin
9.5901
C41H28O26
935.0795
M−H
−0.1203
89.0098
↑
12
1,3,4-trigalloyl-beta-d-glucopyranose
9.5901
C27H26O19
635.0886
M−H2O−H
−0.5601
83.5092
↓
13
Corilagin
8.6509
C27H22O18
633.0738
M−H
0.7252
95.2451
↑
14
4,4,5,5,6,6′-hexahydroxy- [1, 1′-biphenyl]-2, 2-dicarboxylic acid
8.2307
C14H10O10
337.0193
M−H
−2.3119
90.7627
↑
15
6-[4-({[7,8,8,12,13,22-hexahydroxy-19-(hydroxymethyl)-3,6,16-trioxo-2,17,20,23-tetraoxapentacyclo[16.3.1.17,11.04,9.010,15]tricosa-4,10,12,14-tetraen-21-yl]oxy}carbonyl)-2,6-dihydroxyphenoxy]-3,4,5-trihydroxyoxane-2-carboxylic acid
5.6405
C33H30O25
807.0906
M−H2O−H
0.9501
91.6979
↓
16
6-({1-carboxy-3,8,9,10-tetrahydroxy-6-oxo-6H-benzo[c]chromen-4-yl}oxy)-3,4,5-trihydroxyoxane-2-carboxylic acid
4.7151
C20H16O15
495.0418
M−H
0.2367
87.2027
↑
17
3,4,5-trihydroxy-6-(3,4,5-trihydroxybenzoyloxy)oxane-2-carboxylic acid
4.7222
C13H14O11
327.035
M−H2O−H
−2.2045
89.54094
↑
18
Succinylacetoacetate
4.4806
C8H10O6
183.0294
M−H2O−H
−2.5031
95.4474
↓
19
1,2-Digalloyl-beta-d-glucopyranose
4.2812
C20H20O14
483.078
M−H, 2 M−H
−0.1006
89.7035
↑
20
3,4-dihydroxy-5-(3,4,5-trihydroxybenzoyloxy)benzoic acid
3.7045
C14H10O9
321.0246
M−H
−1.8258
91.0399
↑
21
4-[(6-carboxy-3,4,5-trihydroxyoxan-2-yl)oxy]-4′,5,5′,6,6′-pentahydroxy-[1,1′-biphenyl]-2,2′-dicarboxylic acid
1.5344
C20H18O16
513.0519
M−H
−0.6480
89.0181
↑
22
6-Methyl 2-galloylgalactarate
1.1723
C14H16O12
751.1207
2 M−H
−0.5153
98.4140
↑
23
Sanguiin H4
1.1366
C27H24O19
633.0735
M−H
0.2529
79.0543
↑
24
2-O-Galloyl-1,4-galactarolactone
1.0295
C13H12O11
343.0307
M−H
−0.0179
94.0372
↑
25
Gallic acid
1.0017
C7H6O5
169.0141
M−H
−0.7509
98.7058
↑
26
1-Methyl 2-galloylgalactarate
0.9517
C14H16O12
375.0566
M−H
−0.7721
89.8624
↑
27
2-Galloylglucose
0.8453
C13H16O10
331.0666
M−H, 2 M−H
−1.3246
96.4136
↓
28
5-O-Galloyl-1,4-galactarolactone
0.6953
C13H12O11
687.0699
M−H, 2 M−H
1.4303
93.2576
↑
29
Citric acid
0.6953
C6H8O7
191.0195
M−H
−1.1884
97.2197
↑
30
3,4,5,11,12,13,21,22,23-nonahydroxy-9,14,17-trioxatetracyclo[17.4.0.02,7.010,15]tricosa-1(23),2,4,6,19,21-hexaene-8,18-dione
0.6674
C20H18O14
481.0642
M−H
3.8702
88.7237
↑
31
Malic acid
0.5675
C4H6O5
133.0141
M−H
−1.4131
95.5124
↓
32
Chebulic acid
0.5389
C14H12O11
355.0314
M−H2O−H, M−H
1.2365
92.7179
↑
33
2-O-Galloylgalactaric acid
0.5318
C13H14O12
361.0419
M−H, 2 M−H
1.71817
94.8857
↓
34
Galactinol
0.5039
C12H22O11
341.1097
M−H
2.2280
90.6854
↓
35
D-2-Hydroxyglutaric acid
0.5039
C5H8O5
147.0296
M−H
−1.7772
96.0944
↑
36
2-Hydroxybutyric acid
0.5039
C4H8O3
85.02942
M−H2O−H
−0.7952
98.0449
↑
From the content change (peak area) before and after thermal extraction (Fig. 4 E), it is easy to find several components with the strongest transformation during the thermal extraction process. They are No. 27, 33, 28, 15, 19, 25, 13, 21, 7, 24, 29, 22 and 5 (from high to low). They almost all belong to Gallotannins and Ellagitannins (Lu et al., 2008). It is easy to deduce that aglycone (polyol), gallic acid, and hexahydroxybiphthalic acid are the core components of this reaction. They increase continuously in thermal extraction and become the end products of hydrolyzable tannins. Through the verification of standard model solutions, Fig. 5 shows the hydrolysis process of representative difference markers in PES during thermal extraction. It was shown that the content of some tannins increased during the heat extraction process, indicating that the polymerization event took place concurrently. For instance, during thermal treatment, 2-O-galloylgalactaric acid decomposes into gallic acid and galactic acid. It also reveals an increase of 5-O-galloyl-1,4-galactarolactone, which may be the result of the molecular rearrangement of 2-O-galloylgalactaric acid following hydrolysis.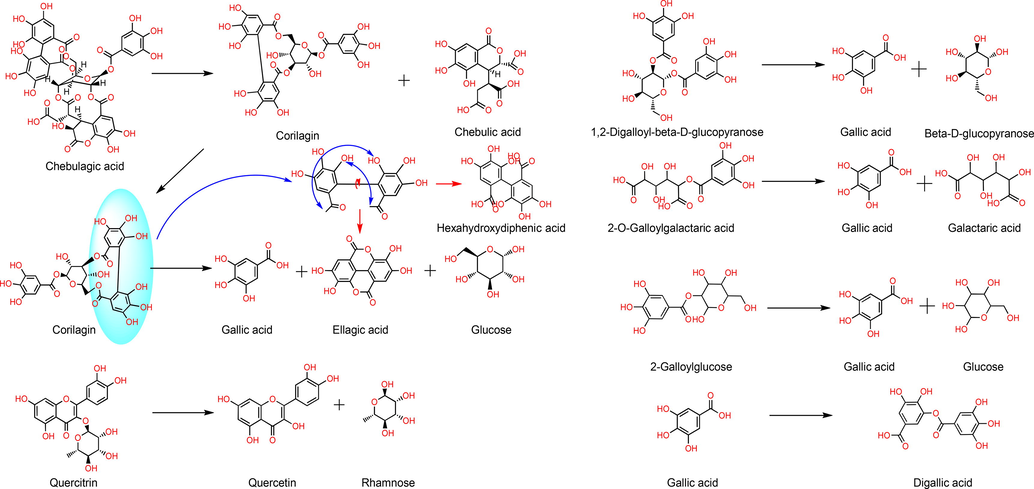
Main differential compounds transformation pathways.
The pearson correlation analysis was used to examine the relationship between the differential markers and the sensory evaluation data of volunteers (highest value at each time point) at various extraction time points for the screening and identification of flavor compounds. Table.5 reveals that the majority of substances, including citric acid, gallic acid, and its derivatives, strongly correlate with sourness. Tellimagrandin II, ellagic acid, tercatain, 4,4,5,5,6,6′-hexahydroxy-[1,1′-biphenyl]-2,2-dicarboxylic acid, and other tannins are the primary astringency-related substances. More sophisticated factors, such as flavor contrast, may play a role in the development of the aftertaste's sweetness. Due to the fact that sour can produce salivation, sour components have a strong correlation with salivary secretion. Blank means not significant.
Compound number
Suorness
Bitterness
Astringency
Aftertaste-Sweetness
Salivary secretion
Hits
4
0.89
1
7
0.95
0.98
0.90
3
8
0.99
0.95
0.89
0.97
4
10
0.98
0.95
0.98
3
13
0.94
0.91
0.89
3
14
0.99
0.97
0.88
0.89
0.99
5
15
−0.95
−0.89
−0.90
−0.91
−0.91
5
16
0.90
0.90
0.90
3
17
0.98
0.96
0.88
0.94
4
18
−0.94
−0.88
−0.89
−0.91
−0.90
5
19
−0.89
1
20
0.97
0.92
0.92
0.91
4
21
0.99
0.97
0.89
0.89
0.98
5
22
0.89
1
24
0.97
0.97
0.94
0.96
4
25
0.90
1
26
0.98
0.97
0.93
0.98
4
27
−0.95
−0.87
−0.88
3
28
0.97
0.94
0.93
3
29
0.95
0.92
0.90
3
30
0.91
1
31
−0.97
−0.93
−0.87
−0.96
4
32
0.89
1
33
−0.97
1
34
−0.95
−0.89
−0.90
−0.91
−0.91
5
3.4 Study on PES activity changes and correlation analysis
The hypoglycemic activity of PE is primarily manifested in its inhibitory effect on α-glucosidase; while PES has strong antioxidant and antibacterial properties thanks to the abundance of phenolic hydroxyl groups. This study examines how relevant biological activities alter dynamically as a result of the PES heat extraction process. Fig. 6 makes it very evident that as extraction time is increased, several biological activities are also noticeably improved. Studies revealed that after hydrolysis, some hydrolyzed tannins will have dramatically increased biological activity, such as antibacterial activity (Aguilar-Galvez et al., 2014). Additionally, it is believed that hydrolysable tannins acquire their antibacterial properties from the presence of hexahydroxydiphenoyl and nonahydroxyterphenoyl moieties (Ekambaram et al., 2016). According to Taguri et al. (Taguri et al., 2006), the pyrogallol group is a crucial structural component of polyphenols' antibacterial action. The extra free galloyl group appeared to boost the ellagitannin's inhibitory actions on E. coli (Puljula et al., 2020). Under the conditions of heat extraction, rutin can hydrolyze to quercetin. But quercetin's weak water solubility might lessen its antibacterial power. In addition, polymerization also occurs during the extraction process and has the potential to result in the production of new hydrolyzed tannins. Therefore, the biological activity is always changing, but ultimately leads to the increase of the overall activity of PES.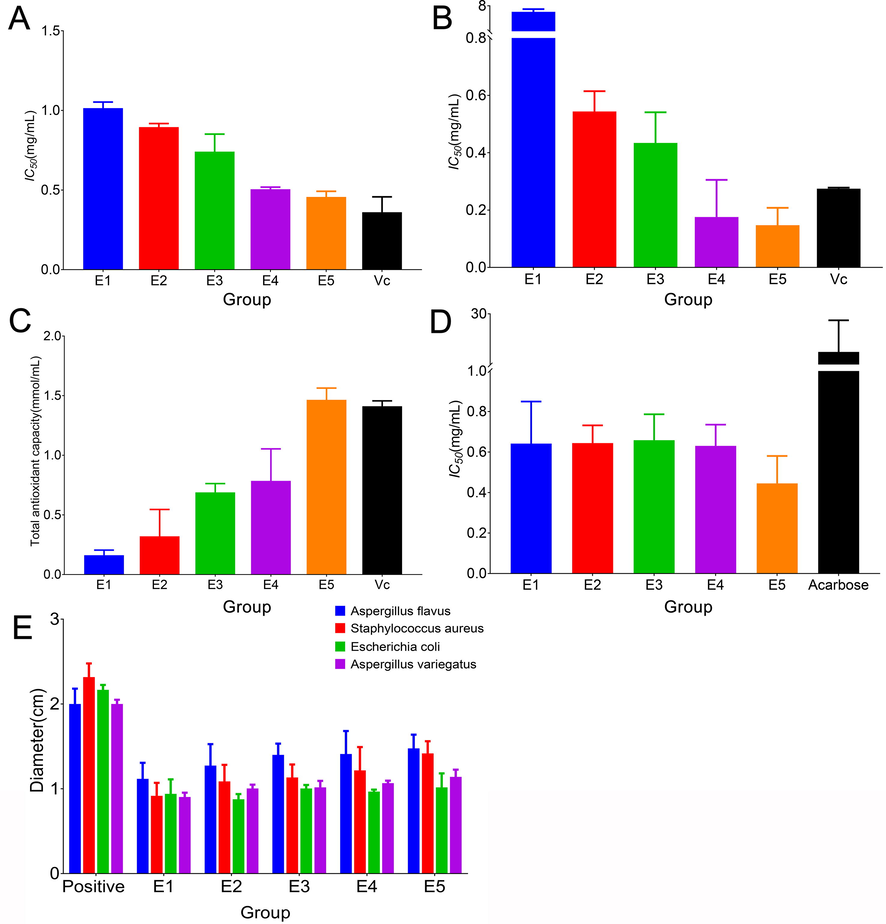
The biological activity changes of PES with extraction time, A, B and C are ABTS, DPPH, and FRAP antioxidant capacity respectively, D, α Glucosidase inhibitory activity, E antibacterial activity, F correlation heat map of biological activity and differential markers.
The changes in biological activity and differential markers are strongly connected. The pearson correlation heat map analysis was utilized for correlation analysis in order to explore prospective biological activity indicators. The empty space denotes a poor significance test result (p > 0.05). It should be noted that the activity is stronger the lower the IC50 value. In Table 6, the more components hit, the more critical it is. For instance, the compounds Nos. 8, 13, 19, 20, 22, 25, 27, 29, 30 and 32 contain certain well-known bioactive substances, such as corilagin and gallic acid, which are now the most reported substances (Yang and Liu 2014). Escherichia coli has no correlation with all components, so it is not listed. Blank means not significant.
Compound number
Aspergillus flavus
Staphylococcus aureus
Aspergillus variegatus
DPPH
ABTS
FRAP
Anti hyperglycemia
Hits
1
0.89
0.92
−0.95
3
3
−0.90
1
5
−0.92
−0.89
0.93
−0.98
4
7
0.92
−0.91
2
8
0.95
0.87
0.92
−0.91
−0.93
5
10
0.91
0.88
−0.90
−0.91
4
11
−0.92
1
12
0.96
1
13
0.98
0.94
0.95
−0.98
0.90
5
14
0.93
−0.96
2
15
−0.88
1.00
2
16
0.90
0.88
−0.98
3
17
0.98
0.90
−0.96
3
18
1.00
1
19
−0.95
−0.93
−0.94
0.99
−0.93
5
20
0.98
0.94
0.96
−0.97
0.89
5
21
0.94
0.87
−0.97
3
22
0.95
0.98
0.97
−0.98
0.96
5
23
−0.92
1
24
0.94
−0.97
2
25
0.97
0.97
0.96
−0.97
0.96
5
26
0.93
−0.97
2
27
−0.97
−0.97
−0.99
0.97
−0.92
5
28
0.97
0.92
0.94
−0.97
4
29
0.98
0.94
0.96
−0.97
0.90
5
30
0.96
0.96
0.97
−0.99
0.95
5
31
−0.92
−0.91
0.95
3
32
0.95
0.98
0.97
−0.98
0.96
5
33
0.93
1
34
−0.87
1.00
2
35
−0.99
1
4 Conclusion
Due to the colloid that its polysaccharides produce, PES's surface tension decreases and its color and viscosity increase as the thermal extraction time lengthens. According to the temporal dominating description approach developed in this study, all taste intensities grew as heating time increased, but the comprehensive taste index revealed that E4 and E2 have better flavor. Additionally, it was discovered through OCS analysis that thermal extraction can get rid of unpleasant smells like IBMP, a type of green pepper flavor that ruins the flavor of foods and beverages, and increase significantly the intensity of the compound 4,5-epoxy-(E)-2-decanal, which gives PES a green smell. The hydrolysis and condensation of tannins were the two fundamental steps in the difficult transformation of non-volatile compounds. And practically all of them are connected to the hexahydroxydibenzoyl (HHDP) and galloyl chemical structures. This is a typical reaction that occurs during the thermal extraction of polyphenols, which are significant elements that affect PES’s activity and flavor. In the examination of biological activity, heat extraction was helpful in enhancing biological activity, which may be attributed to an increase in gallic acid, ellagic acid, corilagin, 2-galloylglucose, citric acid, and chebulic acid, among other compounds. In conclusion, PE's flavor and biological activity can be greatly enhanced by thermal treatment.
CRediT authorship contribution statement
Haozhou Huang: Methodology, Data curation, Writing – original draft. Mengqi Li: Methodology, Data curation, Writing – original draft. Qinchu Tan: Methodology, Data curation. Ce Tang: . Jihai Gao: . Xiaoming Bao: . Sanhu Fan: . Taigang Mo: . Li Han: Conceptualization, Supervision, Validation, Writing – review & editing. Dingkun Zhang: Conceptualization, Supervision, Validation, Writing – review & editing. Junzhi Lin: Conceptualization, Supervision, Validation, Writing – review & editing.
Acknowledgements
This study was supported by grants from the National Natural Science Foundation of China (81973493); Open Project of State key Laboratory of Innovation Medicine and High Efficiency and Energy Saving Pharmaceutical Equipment in Jiangxi University of Traditional Chinese Medicine (GZSYS202005); Sanajon Pharmaceutical Group Chengdu University of TCM production, study and Research Joint Laboratory Project (2019-YF04-00086-JH) and Sichuan Province Science and Technology Plan Funded Project (2021YFN0100). Thanks to Innovative Institute of Chinese Medicine and Pharmacy of Chengdu University of TCM for its technical support in mass spectrometry work.
Data Availability Statements
The datasets generated during and/or analysed during the current study are available from the corresponding author on reasonable request.
Conflict of interest
Author Sanhu Fan and Taigang Mo were employed by company Sanajon Pharmaceutical Group. All other authors declare no competing interests.
References
- Potential of tara (Caesalpinia spinosa) gallotannins and hydrolysates as natural antibacterial compounds. Food chemistry.. 2014;156:301-304.
- [CrossRef] [Google Scholar]
- Simultaneous determination and characterization of tannins and triterpene saponins from the fruits of various species of Terminalia and Phyllantus emblica using a UHPLC-UV-MS method: application to triphala. Planta medica.. 2013;79:181-188.
- [CrossRef] [Google Scholar]
- Scope of Hydrolysable Tannins as Possible Antimicrobial Agent. Phytotherapy research : PTR.. 2016;30:1035-1045.
- [CrossRef] [Google Scholar]
- A novel quantified bitterness evaluation model for traditional Chinese herbs based on an animal ethology principle. Acta pharmaceutica Sinica. B.. 2018;8:209-217.
- [CrossRef] [Google Scholar]
- Exploration on the Approaches of Diverse Sedimentations in Polyphenol Solutions: An Integrated Chain of Evidence Based on the Physical Phase, Chemical Profile, and Sediment Elements. Frontiers in Pharmacology.. 2019;10:11.
- [CrossRef] [Google Scholar]
- Potential effect of tropical fruits Phyllanthus emblica L. for the prevention and management of type 2 diabetic complications: a systematic review of recent advances. European journal of nutrition. 2021
- [CrossRef] [Google Scholar]
- Phytochemical Screening and Antioxidant Properties of Phyllanthus emblica from Mauritius. Chemistry of Natural Compounds.. 2018;54:50-55.
- [CrossRef] [Google Scholar]
- Li, P., D. K. Zhang, J. Z. Lin, et al., 2019. [Optimized model for formulation prescription of traditional Chinese medicine buccal tablets based on temporal dominant description of sensations combined with multivariate statistical analysis:an example of Compound Caoshanhu Buccal Tablets]. Zhongguo Zhong yao za zhi = Zhongguo zhongyao zazhi = China journal of Chinese materia medica. 44, 3035-3041. https://doi.org/10.19540/j.cnki.cjcmm.20190410.303.
- Grape and wine polymeric polyphenols: Their importance in enology. Critical reviews in food science and nutrition.. 2019;59:563-579.
- [CrossRef] [Google Scholar]
- Ling, M., Y. Zhou and Y. Lan, 2021. Modification of Sensory Expression of 3-Isobutyl-2-methoxypyrazine in Wines through Blending Technique. 26, https://doi.org/10.3390/molecules26113172.
- Kinetics of non-catalyzed hydrolysis of tannin in high temperature liquid water. Journal of Zhejiang University. Science. B.. 2008;9:401-406.
- [CrossRef] [Google Scholar]
- Interactions between stimuli with different taste qualities. Physiology & behavior.. 1973;10:1101-1106.
- [CrossRef] [Google Scholar]
- Antimicrobial Activities of Ellagitannins against Clostridiales perfringens. Escherichia coli, Lactobacillus plantarum and Staphylococcus aureus.. 2020;25
- [CrossRef] [Google Scholar]
- Interaction of polyphenols with model membranes: Putative implications to mouthfeel perception. Biochimica et biophysica acta. Biomembranes.. 2020;1862:183133
- [CrossRef] [Google Scholar]
- Antibacterial spectrum of plant polyphenols and extracts depending upon hydroxyphenyl structure. Biological & pharmaceutical bulletin.. 2006;29:2226-2235.
- [CrossRef] [Google Scholar]
- Emblica officinalis (Amla): A review for its phytochemistry, ethnomedicinal uses and medicinal potentials with respect to molecular mechanisms. Pharmacological research.. 2016;111:180-200.
- [CrossRef] [Google Scholar]
- Composition and biological activities of hydrolyzable tannins of fruits of Phyllanthus emblica. Journal of agricultural and food chemistry.. 2014;62:529-541.
- [CrossRef] [Google Scholar]
- Bulk, Foam, and Interfacial Properties of Tannic Acid/Sodium Caseinate Nanocomplexes.. 2018;66:6832-6839.
- [CrossRef]
- Improving the sweet aftertaste of green tea infusion with tannase. Food chemistry.. 2016;192:470-476.
- [CrossRef] [Google Scholar]
- Microbial bioconversion of the chemical components in dark tea. Food chemistry.. 2020;312:126043
- [CrossRef] [Google Scholar]
- The material basis of astringency and the deastringent effect of polysaccharides: A review. Food chemistry.. 2023;405:134946.
- [CrossRef] [Google Scholar]


