

Translate this page into:
The interaction mechanism of tepotinib and α-glucosidase: A prelude to control type 2 diabetes mellitus
⁎Corresponding author at: Chuanhuan South Road 490, Pudong New Area, Shanghai 201299, China. wangyingshpd@126.com (Ying Wang)
-
Received: ,
Accepted: ,
This article was originally published by Elsevier and was migrated to Scientific Scholar after the change of Publisher.
Abstract
α-Glucosidase is associated with the enhancement in postprandial blood glucose. Therefore, inhibition of α-glucosidase activity could be considered as a potential strategy to control type 2 diabetes mellitus (DM). Tepotinib (TPT) as an enzyme inhibitor with a molecular formula of C29H28N6O2 has a distinct structure that may make it useful for interacting with α-glucosidase, causing conformational changes and inhibiting enzyme activity. In this study, the interaction mechanism of TPT and α-glucosidase was explored. The enzyme activity assay showed that TPT could inhibit α-glucosidase activity with the IC50 value of 0.071 ± 0.007 mg/mL (164 ± 16.5 µM), which was comparable with that of acarbose (IC50 = 0.045 ± 0.006 mg/mL = 255 ± 38.25 µM) as a clinical drug. It was further determined that Ser 241 and His 280 amino acid residues in the active site assist in the formation of the TPT-α-glucosidase complex mediated by hydrogen bonding and van der Waals forces, which might lead to the conformational folding of α-glucosidase to some extent. Additionally, the interaction of TPT and α-glucosidase reduced the surface hydrophobicity of the enzyme and altered the microenvironment around Tyr 158 amino acid residue in the active site. These findings suggested that TPT might be employed as a potential inhibitor of α-glucosidase activity, suggesting that it should be further explored in future studies to develop a TPT-based system for application in the amelioration of DM.
Keywords
Tepotinib
α-glucosidase
Activity
Mechanism
Diabetes mellitus

1 Introduction
In addition to being one of the four main categories of non-communicable disorders, diabetes mellitus (DM) has been regarded as one of the most significant global health issues of our time.
According to the International Diabetic Foundation (IDF), over 600 million will suffer from DM by 2045 (Cho,Shaw et al., 2018). The prevalence of type 2 DM, a chronic metabolic disease, has been steadily rising worldwide. Due to this fact, it is quickly turning into an epidemic in some countries, with the number of affected individuals predicted to be increased in the following decade due to a significant enhancement in the aging population (Olokoba,Obateru et al., 2012, Wu,Patterson et al., 2022).
One of the main features of type 2 diabetes and its concerns is assigned postprandial hyperglycemia, which can be regulated by inhibiting the absorption of carbohydrates (Banwari,Kawathekar et al., 2023). α-Glucosidase presented in the small intestinal mucosal brush, shows the ability to hydrolyze oligosaccharides to α-glucose via degrading α-1,4 glycosidic bond from the non-reducing end of the oligosaccharide to produce α-glucose (α → α) (Sauer,Sigurskjold et al., 2000, Ding,Hu et al., 2018). Therefore, α-glucosidase is essential for the metabolism of carbohydrates. It may be possible to control postprandial hyperglycemia and its complications by decreasing glucose absorption through the development of some potential compounds as inhibitors of α-glucosidase activity (Ding,Hu et al., 2018, Han,Wang et al., 2023, Phong,Yang et al., 2023). For example, it was shown that oleanolic acid and ursolic acid can be used as two potential allosteric inhibitors against α-glucosidase activity. In fact, Ding et al. demonstrated that oleanolic acid and ursolic acid are able to inhibit α-glucosidase activity with IC50 values of 6.35 µM and 16.9 µM, respectively through a reversible and non-competitive fashion (Ding,Hu et al., 2018). Furthermore, Phong et al. reported that 12 flavonoids extracted from the stems and branches of A. mono Maxim had inhibitory activity against α-the glucosidase activity, while two dimeric flavan-3-ols showed the strongest inhibitory effect (with IC50 values of 49.69–48.80 µM) through a non-competitive model (Phong,Yang et al., 2023). Additionally, Popović et al. studied the capacity of natural deep eutectic systems and their components to inhibit the α-glucosidase activity and found that ascorbate shows the ability to serve as a strong inhibitor of α-glucosidase activity, where IC50 value for ascorbate was found to be above 180-folds lower than for acarbose (Popović,Agić et al., 2023).
Therefore, studying the interaction of small molecules/drugs and α-glucosidase is essential to assess their binding affinity and efficacy in inhibiting the enzyme activity.
Tepotinib (TPT) as a kinase inhibitor with a molecular formula of C29H28N6O2, molecular weight of 492.6 g/mol, IUPAC name of 3-[1-[[3-[5-[(1-methylpiperidin-4-yl)methoxy]pyrimidin-2-yl]phenyl]methyl]-6-oxopyridazin-3-yl]benzonitrile has been recently approved as a novel drug for treatment of non-small cell lung cancer patients that show an aberrant mesenchymal-epithelial transition mRNA (Markham, 2020, Morise,Sakai et al., 2021). A recent study has explored the interaction of TPT with a plasma protein and found that TPT has led to fluorescence quenching through a static process mediated by interaction with drug binding site of ptotein (Amir and Javed, 2023). Also, TPT interaction with plasma protein induced some conformational changes and declined the α-helical content of protein.
Therefore, it is a great idea to further investigate the effect of TPT on the structure and activity of α-glucosidase by different spectroscopic and theoretical studies to obtain some useful information about the regulation of DM.
2 Materials and methods
2.1 Materials
Tepotinib (TPT) was purchased from ChemieTek (Indianapolis, IN, USA). α-Glucosidase (EC 3.2.1.20, G5003, ≥10 units/mg protein, from Saccharomyces cerevisiae, 1-anilinonaphthalene-8-sulfonic acid (ANS), and 4-nitrophenyl α-D-glucopyranoside (pNPG, purity > 99 %, CAS Number: 3767–28-0) were provided by Sigma-Aldrich Co. (St. Louis, MO, USA). The α-glucosidase was dissolved in sodium phosphate buffer (100 mM, pH 6.8). The stock solution of TPT (1 mM) was prepared in a dimethyl sulphoxide (DMSO) solution and further diluted with sodium phosphate buffer (100 mM, pH 6.8). Acarbose hydrate (purity ≥ 98 %, CAS Number 56180–94-0) was purchased from Aladdin Biochemical Technology Co., Ltd. (Shanghai, China). All other materials were of analytical grade and used without further purification.
2.2 α-Glucosidase activity assay
The inhibitory ability of TPT on α-glucosidase activity was assessed as reported previously (Ding,Huang et al., 2023). Briefly, α-glucosidase with a concentration of 4 μg/mL was added by increasing concentrations of TPT or acarbose at 37 ℃ for 60 min, followed by the addition of pNPG with a concentration of (0.14 mg/mL) into the solution and the absorbance of the samples was read at 405 nm using a quartz cuvette of path length 1.0 cm on a UV-1800 UV–visible spectrophotometer (Shimadzu, Japan). The relative activity of the enzyme was then determined based on the following Eq. (1):
Where X and X0 are the slopes of the Eq. acquired with and without TPT, respectively. The half inhibitory concentration (IC50) as the concentration of TPT inducing a reduction of 50 % α-glucosidase activity was then determined (Ding,Huang et al., 2023).
2.3 Intrinsic fluorescence spectra
Intrinsic fluorescence spectra of α-glucosidase solution (3 mL, 1 U/mL) titrated by successively addition of 2 µL of TPT (0, 0.02, 0.04, 0.06, 0.08, 0.1, and 0.15 mg/mL) were read on a RF-5301PC fluorescence spectrophotometer (Shimadzu, Japan) equipped with a 1.0 cm quartz cell at 298, 303 and 310 K. After the incubation for 2 min, the fluorescence spectra were read in the range of 300–480 nm, while the excitation wavelength was set at 280 nm. Furthermore, 5 nm widths were used for both excitation and emission slits. All fluorescence spectra were corrected against buffer and inner filter effects to eliminate the noise effects (Puchalski,Morra et al., 1991).
2.4 ANS fluorescence assay
ANS fluorescence analysis was assessed using a fluorescence spectrofluorimeter as reported previously (Dai, Li et al. 2020). Briefly, the excitation was fixed at 390 nm and the emission was read at 480 nm. The widths of the excitation and emission slits were both adjusted to 5 nm. Aliquots of TPT with increasing concentrations of 0, 0.02, 0.04, 0.06, 0.08, 0.1, and 0.15 mg/mL were sequentially added into a 3 mL protein-ANS solution (3 mL, 1 U/mL enzyme with 16 μL 8 mM ANS). The ANS fluorescence intensity was then read and reported as the final data. The data were corrected against buffer and TPT fluorescence intensities (Dai,Chen et al., 2019).
2.5 Synchronous fluorescence spectra
The synchronous fluorescence study (1 U/mL) was run to examine the polarity changes around tyrosine (Tyr) and tryptophan (Trp) residues of α-glucosidase via fixing the excitation and emission wavelength interval (Δλ) at 15 and 60 nm, respectively. The other parameters were fixed similar to section 2.3.
2.6 Far-ultraviolet circular dichroism (UV CD) studies
Far-UV CD analysis of α-glucosidase in the presence of TPT were performed at wavelengths between 190 and 260 nm under constant nitrogen glow. The CD spectra were assessed with an α-glucosidase concentration of (1 U/mL), while a TPT concentration of 0.15 was added to the samples. All observed CD spectra were measured in a sodium phosphate buffer (100 mM, pH 6.8) at room temperature and corrected for buffer signal. The instrument sensitivity, path length of quartz cell, scan rate, and scan time were set at 2 mdeg/cm, 1 mm, 100 nm/min, and 0.5 s, respectively (Zhao,Wen et al., 2020). The contents of secondary structures of α-glucosidase were assessed by the online SELCON3 program (https://dichroweb.cryst.bbk.ac.uk/html/home.shtml).
2.7 Molecular simulation
The 3D structure of TPT was retrieved from PubChem database (Conformer3D_COMPOUND_CID_25171648.sdf, https://pubchem.ncbi.nlm.nih.gov), followed by optimization of its structure in Discovery Studio. The molecular docking analysis between TPT and α-glucosidase (rigid structure) was performed as reported previously (Dai,Chen et al., 2019), with some minor modifications, using the AutoDock Vina software. The isomaltase from Saccharomyces cerevisiae (PDB: 3A4A) was used as the receptor because its active site had the highest sequence homology to α-glucosidase (Dai,Chen et al., 2019). The number of exhaustiveness and top hits were fixed as default. The pose with the lowest docking energy was used as the optimized outcome.
2.8 Statistical analysis
The statistical analyses were done using SPSS software, while a comparison of the data was performed by Tukey's test, at a P < 0.05 of significance using a one-way analysis of variance (ANOVA).
3 Result and discussion
3.1 α-Glucosidase inhibition by TPT in vitro
As shown in Fig. 1, both TPT and acarbose were able to trigger inhibitory effects against α-glucosidase mainly via a concentration-mediated fashion. The IC50 value of TPT was found to be around 0.071 ± 0.007 mg/mL (164 ± 16.5 µM), which was comparable with that of acarbose (IC50 = 0.045 ± 0.006 mg/mL = 255 ± 38.25 µM) as a clinical drug, indicating that TPT can be appointed as a promising inhibitor against α-glucosidase activity. Nevertheless, the IC50 value of acarbose as the positive control compound was higher than that of the previously reported value (IC50 = 200 μM), which might be due to the variations in studied procedures, experimental conditions, and even the sources of materials (Wan,Yuan et al., 2012). Also, other polyfunctional heteroaromatics with pyridazin based-backbone can be used as a potential core to develop promising inhibitors of α-glucosidase. For example, it was shown that ethyl 3-(2-(1-(4-nitrobenzyl)-1H-1,2,3-triazol-4-yl)ethyl)-5,6-diphenylpyridazine-4-carboxylate had IC50 values of round 58–73 µM, whereas IC50 value of acarbose was around 750 µM (Moghimi,Salarinejad et al., 2021). Furthermore, it was reported that all triazine-carbazole, triazine thiazole, triazine-triazole, and triazine-N-arylacetamides derivatives were more potent (IC50 = 26.3–148.9 μM) than acarbose (IC50 = 173.8 μM) (Firoozpour,Kazemzadeh Arasi et al., 2023). The authors then indicated that oxygen of nitro group and phenyl rings formed hydrogen bonding, Pi-Pi T-shaped interaction, as well as Pi-alkyl interaction can provide potential forces to mediate inhibitory effects of pyridazine-based derivatives (Firoozpour,Kazemzadeh Arasi et al., 2023).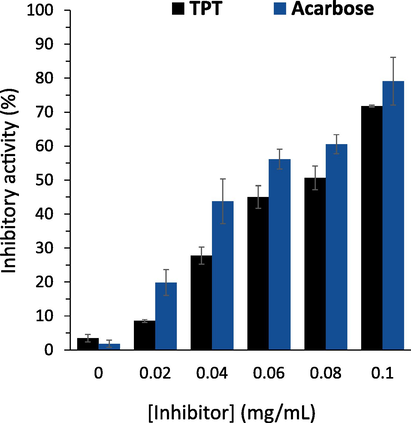
Inhibition activity of α-glucosidase in the presence of varying concentrations of TPT or acarbose. α-Glucosidase (4 μg/mL) was added by different concentrations of TPT or acarbose at 37 ℃ for 60 min, followed by the addition of pNPG with a concentration of (0.14 mg/mL) into the solution. The absorbance of the samples was read at 405 nm. The data is expressed as mean ± standard deviation (SD) of three experiments.
Also, it should be noted that TPT has several other groups, including methylpiperidin, pyrimidine, and benzonitrile along with pyridazin which can establish different forces with amino acid residues of α-glucosidase and induce some structural changes and corresponding enzyme activity inhibition. For example, piperidine alkaloid derived from Roots of Grewia nervosa showed a concentration-depended α-glucosidase activity inhibition with an IC50 value of 53.40 μM (Meena,Majik et al., 2017). Furthermore, Barakat et al. reported that substituted phenyl derivatives of nitroethyl pyridinium dione possessed IC50 values of IC50 = 57.6––415.4 μM, while acarbose had an IC50 = 840 ± 1.73 μM against α-glucosidase activity inhibition (Barakat,Islam et al., 2016).
3.2 Mechanism of interaction between TPT and α-glucosidase
The apparent inhibitory effect of TPT on α-glucosidase activity may suggest that TPT could directly interact with the enzyme. To further study the interaction between TPT and α-glucosidase, a fluorescence quenching study was done because this approach can provide some useful information regarding the interaction behavior, including binding mechanism, binding constants, and binding forces.
3.3 Fluorescence quenching study
Fluorescence quenching analysis was done to study the intrinsic interaction mechanisms of TPT and α-glucosidase in vitro. As depicted in Fig. 2, α-glucosidase demonstrated a strong fluorescence peak around 341 nm, deriving from the Trp and Tyr amino acid residues. Nevertheless, as different concentrations of TPT were added, the α-glucosidase-associated fluorescence intensity reduced continuously. The relative fluorescence intensity of α-glucosidase declined to 15.60 % at 298 K (Fig. 2A), 21.66 % at 303 K (Fig. 2B), and 22.75 % at 310 K (Fig. 2C) when the concentration of TPT increased to 0.15 mg/mL.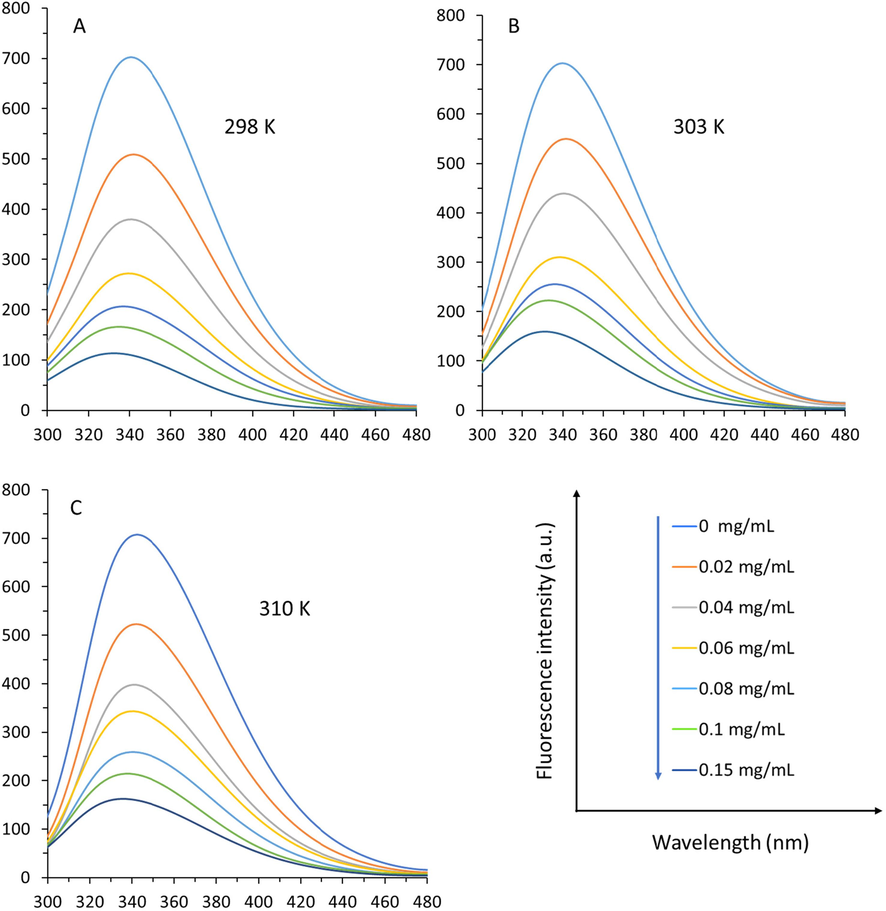
Fluorescence quenching study of α-glucosidase at three different temperatures of 298 K (A), 303 K, and 310 K (C) in the presence of varying concentrations of TPT as determined by fluorescence spectroscopy. α-Glucosidase solution (3 mL, 1 U/mL) was titrated by the addition of 2 µL of TPT (0, 0.02, 0.04, 0.06, 0.08, 0.1, and 0.15 mg/mL). After the incubation for 2 min, the fluorescence spectra were read, while the excitation wavelength was set at 280 nm.
These data revealed that TPT form a complex with the enzyme. In addition, with enhancing the concentrations of TPT, the emission peaks around 341 nm showed an obvious blue shift, proving that TPT may affect the spatial conformation of α-glucosidase.
Fluorescence quenching of a fluorophore, reduction of the quantum yield of fluorescence, stimulated by different molecular interactions can be categorized into three types of dynamic, static, and combinational quenching (Blatt,Chatelier et al., 1986, Tan and Caram, 2023). To explore the fluorescence quenching mechanism, the well-known Stern-Volmer Eq. has been widely used for data analysis as follows (Günal-Köroğlu,Yılmaz et al., 2022):
The curves of F0/F versus [Q] at three various temperatures of 298, 303, and 310 K are shown in Fig. 3A.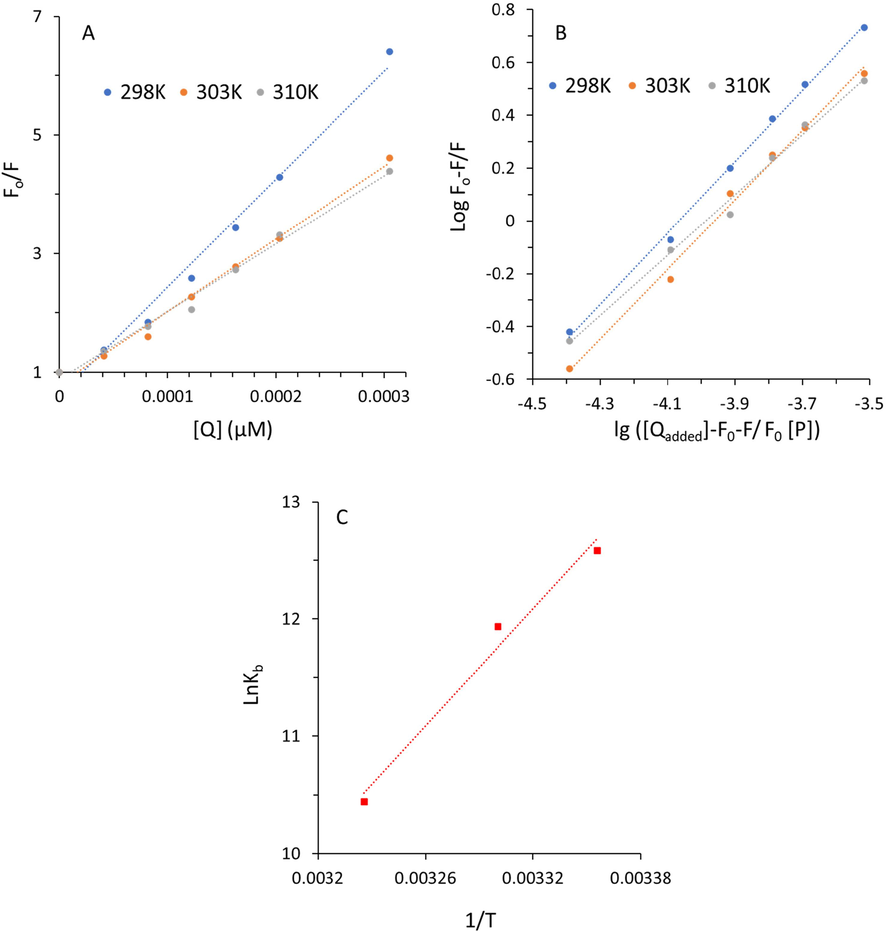
Stern-Volmer plot (A), modified Stern-Volmer plot (B), and van’t Hoff plot (C) of fluorescence quenching study of α-glucosidase at three different temperatures of 298 K, 303 K, and 310 K in the presence of varying concentrations of TPT as determined by fluorescence spectroscopy. α-Glucosidase solution (3 mL, 1 U/mL) was titrated by the addition of 2 µL of TPT (0, 0.02, 0.04, 0.06, 0.08, 0.1, and 0.15 mg/mL). After the incubation for 2 min, the fluorescence spectra were read, while the excitation wavelength was set at 280 nm.
The values of KSV and kq for the formation of α-glucosidase-TPT complex are summarized in Table 1.
T (K)
KSV (×104 M−1) × 104
kq (×1012 M−1 s−1)
R2
298
1.81
1.81
0.98
303
1.21
1.21
0.99
310
1.14
1.14
0.99
The data showed that the KSV values decline with rising temperature as well as the values of kq are much greater than the reported diffusion rate constant of the biomacromolecule (2 × 10¹⁰ M−1·s−1), suggesting that the quenching of α-glucosidase by TPT is mediated via a static quenching mechanism (Condict and Kasapis, 2022, Zelenovic,Kojadinovic et al., 2023).
3.4 Binding constant (Kb) and number of binding sites (n)
According to Eq. (2) reported previously, the static quenching mechanism follows the following modified Stern-Volmer Eq. (Dai,Chen et al., 2019):
Where Kb is known as the binding constant of ligand on protein and n is the number of binding sites. [Qadded] is the TPT concentration, [P] is the total enzyme concentration. These values were determined from the plot of the linear Eq. obtained by lg[(F0 -F)/F] against lg ([Qadded]‐F0‐F/F0 [P]) and the resultant graphs are displayed in Fig. 3B. The values of lgKb and n were calculated and tabulated in Table 2.
T (K)
lgKb
n
R2
298
5.47
1.34
0.99
303
5.19
1.31
0.99
310
4.54
1.14
0.99
The decreasing trend of lgKb with rising temperature reveals that the capability of TPT binding to α-glucosidase is reduced. In fact, increasing temperature causes slight structural changes in α-glucosidase that are detrimental to the formation of α-glucosidase-TPT complexes.
The values of n were almost equivalent to 1, indicating that the TPT and the α-glucosidase can form a 1:1 bio-complex (Chen,Liu et al., 2015, Fu,Shen et al., 2021).
3.5 Thermodynamic parameters and contributing forces
The interaction forces between ligands and proteins are mainly driven by hydrophilic (hydrogen bonding, van der Waals forces, electrostatic forces) and hydrophobic interactions (Ross and Subramanian, 1981, El Gammal,Elmansi et al., 2023). Thermodynamic parameters [enthalpy change (ΔH), entropy change (ΔS), and Gibbs free energy (ΔG)] play a key role in confirming the binding forces between ligands and proteins. Thermodynamic parameters can be determined from the van’t Hoff Eq. (3) and Gibbs-Helmholtz Eq. (4) as follows (Yin, Sun et al. 2023):
where Kb denotes the binding constant, R is the universal gas constant, and T is the absolute temperature. The values of ΔH and ΔS were determined from the slope and Y-intercept of the linear van’t Hoff plot derived from lnKb against 1/T (Fig. 3C) and the value of ΔG was obtained from the Eq. (3) and the resultant data were presented in Table 3.
T (K)
ΔH (kJ/mol)
ΔS (J/mol.K)
ΔG (kJ/mol)
298
−138.34
−358.97−31.36
303
−29.57
310
−27.06
It can be deduced that the value of ΔH was −138.34 kJ/mol, whereas the value of ΔS was −358.97 J/mol. K. The negative ΔS value is typically considered as evidence for the involvement of hydrogen bonding. Also, the negative value of ΔH indicated that the binding process is frequently enthalpy-driven via hydrogen binding interaction (Ross and Subramanian, 1981). Therefore, hydrogen bonding along with van der Waals forces could play a key role in the interaction between TPT and α-glucosidase which might result in the stability of the formed complex (Dai,Chen et al., 2019). The value of ΔG was −31.36 kJ/mol at 298 K, indicating that the TPT-α-glucosidase complex forms spontaneously (Dai,Li et al., 2020).
3.6 Surface hydrophobicity
ANS is known as a typical hydrophobic dye employed to analyze alteration in the surface hydrophobicity of biomolecules (Dai,Li et al., 2020). Therefore, in this study, the surface hydrophobicity of α-glucosidase was explored by assessing the ANS-binding fluorescence intensities of α-glucosidase either alone or with different concentrations of TPT. As shown in Fig. 4, the ANS fluorescence intensity of α-glucosidase continuously reduces upon the addition of increasing concentrations of TPT, revealing the reduction of α-glucosidase hydrophobicity after interaction with TPT.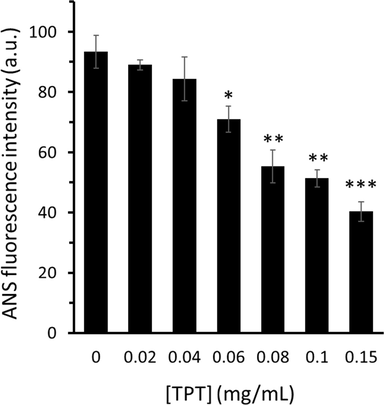
ANS fluorescence study of α-glucosidase in the presence of varying concentrations of TPT. The excitation was set to 390 nm and the emission was read at 480 nm. TPT with increasing concentrations of 0, 0.02, 0.04, 0.06, 0.08, 0.1, and 0.15 mg/mL were sequentially added into a 3 mL protein-ANS solution (3 mL, 1 U/mL enzyme with 16 μL 8 mM ANS). The data is expressed as mean ± standard deviation (SD) of three experiments. *P < 0.05, **P < 0.01, ***P < 0.001 relative to the control group.
Compared to the α-glucosidase alone, the detected decline in the surface hydrophobicity of the α-glucosidase-TPT system can be described by the certainty that some of the TPT molecules may attach to hydrophobic moieties on the surfaces of the protein molecules (Jia,Gao et al., 2017, Dai,Chen et al., 2019). Additionally, it appears that upon interacting with TPT, α-glucosidase undergoes some conformational changes that could cause slight folding of the protein's structure and a reduction in the ability of the ANS to bind enzyme. This data is in good agreement with a previous study which showed that the interaction between procyanidin dimer and α-glucosidase resulted in the reduction of ANS fluorescence intensity of the enzyme evidenced by spectroscopic analysis (Dai,Chen et al., 2019).
3.7 Synchronous fluorescence spectroscopy
The red or blue shift in the maximum emission wavelength can provide some useful information regarding the alterations in the polarity around the Try and Trp residue microenvironment when the wavelength interval (Δλ) was fixed at around 15 and 60 nm, respectively (Yan,Zhang et al., 2014, He,Zhai et al., 2022). As displayed in Fig. 5A, no red or blue shift of maximum emission wavelength of Trp residues was detected, while the fluorescence spectra of Tyr residues demonstrated an apparent blue shift from 285 to 279 nm (Fig. 5B) with increasing the TPT concentration from 0 to 0.15 mg/mL.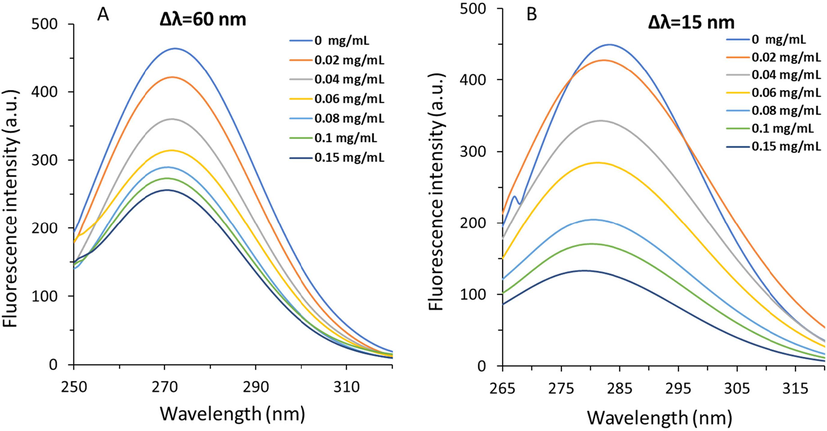
Synchronous fluorescence study of α-glucosidase at 298 K in the presence of varying concentrations of TPT as determined by fluorescence spectroscopy. α-Glucosidase solution (3 mL, 1 U/mL) was titrated by the addition of 2 µL of TPT (0, 0.02, 0.04, 0.06, 0.08, 0.1, and 0.15 mg/mL). After the incubation for 2 min, the fluorescence spectra were read, while the wavelength interval (Δλ) was set at 60 nm (A), and 15 nm (B).
Also, the fluorescence quenching contributions of both Trp and Tyr amino acid residues were compared using synchronous fluorescence spectroscopy (Fig. 5 A, B). It was determined that with the addition of TPT concentration up to 0.15 mg/mL, the fluorescence intensity related to Tyr amino acid(s) further decreased to that of Trp amino acid(s). These data revealed that after the interaction between TPP and α-glucosidase, Tyr residues undergoes more displacement than Trp, maybe due to closer position to the binding pocket (Yin,Sun et al., 2023). These outcomes revealed that the conformation of α-glucosidase was altered considerably in the way that the polarity around Tyr amino acid residue(s) decreased and the hydrophobicity increased during the interaction process with TPT (Li,Yang et al., 2023, Yin,Sun et al., 2023).
3.8 Circular dichroism (CD) study
Far-UV CD spectroscopy measurement is usually used to determine alterations in the secondary conformer (α-helix, β-sheet, β-turn, and random coils) of proteins. The Far-UV CD spectra of α-glucosidase without and with TPT were characterized by two main minima at about 208 and 222 nm, revealing characteristics of α-helix structures (Ghosh,More et al., 2014, Fan,Feng et al., 2023). From Fig. 6, the values of minima enhanced slightly with increasing TPT concentration, deducing a partial alteration in the α-glucosidase secondary structure. Alterations in the content of the α-helix, β-sheet, β-turn, and random coils of the α-glucosidase structure were determined for free enzyme and enzyme-TPT complex. Free α-glucosidase had around 21.57 % α-helix, 21.93 % β-sheet, 24.78 % β-turn, and 31.72 % random coils (Table 4), which is comparable with the data reported previously (Dai,Chen et al., 2019). After interaction with 0.15 mg/mL TPT, the contents of α-helix, β-sheet, and β-turn increased to 23.19 %, 22.99 %, and 25.71 %, respectively, while the content of random coils decreased (28.11 %).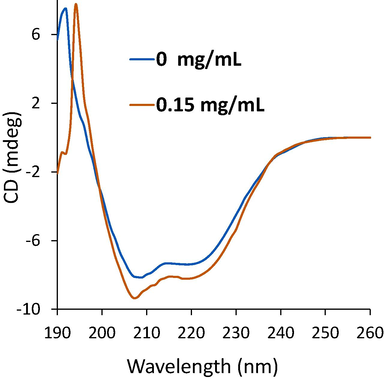
Far-UV CD study of α-glucosidase at 298 K in the presence of TPT. α-Glucosidase solution (1 U/mL) was titrated by the addition of TPT (0.15 mg/mL). After the incubation for 2 min, the CD spectrum were read.
[TPT] (mg/mL)
α-helix
β-sheet
β-turn
Random coil
0
21.57 %
21.93 %
24.78 %
31.72 %
0.15
23.19 %
22.99 %
25.71 %,
28.11 %
No similar data have been reported for the interaction of some small molecules such as procyanidin dimer (Dai,Chen et al., 2019) and epigallocatechin gallate (Dai,Li et al., 2020) with α-glucosidase, revealing the involvement of different forces in the interaction of TPT and α-glucosidase. In fact, based on the alterations of α-glucosidase secondary structure detected in the present study, it was deduced that TPT interaction facilitated the folding of the polypeptide chain, the formation of some new hydrogen bonding networks, and the rearrangement of some hydrogen bonds which might cause conformational stability of α-glucosidase to some extent.
3.9 Molecular docking analysis
Molecular docking analysis can provide a detailed understanding of the binding mode between a drug and a protein/enzyme. The homologous model of α-glucosidase conformation was selected to perform a molecular docking approach as reported previously (Yan,Zhang et al., 2014, Dai,Chen et al., 2019). In fact, these studies reported that the α-glucosidase and protein (PDB 3A4A) shared the same active site evidenced by the sequence alignment (Yan,Zhang et al., 2014, Dai,Chen et al., 2019). Therefore, after optimization of TPT (Fig. 7A) and enzyme (Fig. 7B) structures, docking analysis was carried out. In our study, the Vina scores for 20 runs were in the range of −10.8 kcal/mol to −5.7 kcal/mol, and the lowest energy score (-10.8 kcal/mol) was used to interpret the binding interaction of TPT and α-glucosidase. The docking complex clearly showed that the TPT molecule is able to interact with the active site of the α-glucosidase (Fig. 7C) and may interact with several amino acid residues. Indeed, TPT showed to interact with Asp 307 (ionic bond), His 280 (cation-pi), Tyr 158 (hydrophobic force and pi-pi stacking), Thr 310, Asp 325, Val 319 (weak hydrogen bonds), and Ser 241, His 280 (hydrogen bonding) amino acid residues (Fig. 7D). Also, it was shown that TPT was surrounded by Lys 156, Gln 279, Asp 307, Val 308, Gly 309, Arg 315, Val 319, Pro 320, Phe 321, Ser 304, Thr 310, Ser 311, His 280, Phe 159, Ser 157, Phe 303, Asp 242, Thr 245, Ser 240, Pro 312, and Phe 314 amino acid residues, which verifies that the binding site for TPT was close to the active site pocket of α-glucosidase. Almost similar results have been reported upon interaction of luteolin, C15H10O6, with α-glucosidase where Phe 303, Ser 304, His 305, Val 308, Gly 309, Thr 310, Ser 311 and Pro 312 were the main amino acid residues in the binding pocket (Yan,Zhang et al., 2014).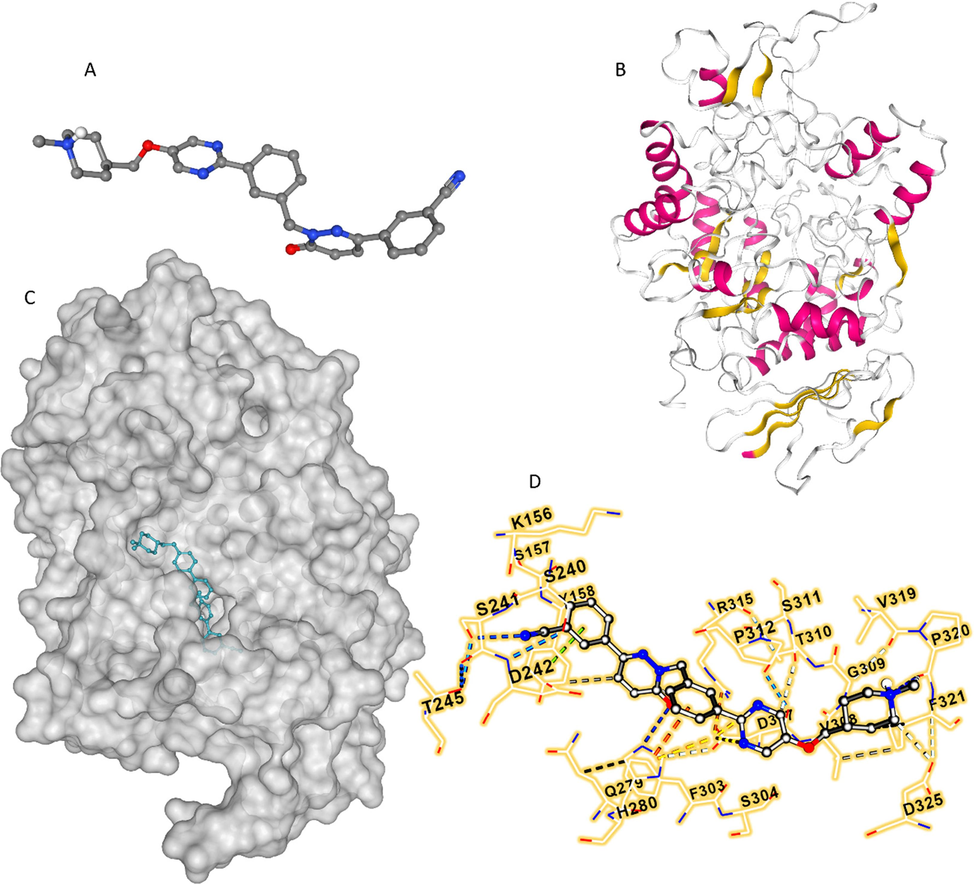
TPT structure (A), α-glucosidase structure (B), TPT-α-glucosidase complex after docking study (C), and amino acid residues of α-glucosidase surrounding the TPT at the binding site (D). The study was done by molecular docking study as described in section 2.6.
Furthermore, based on experimental data, it was determined that the main interaction force for the formation of TPT-α-glucosidase complex was hydrogen bonding, which we may suggest that Ser 241 and His 280 amino acid residues in the active site play a key role in the interaction of TPT and α-glucosidase through the establishment of hydrogen bonding. Through screening of α-glucosidase inhibitors in Hypericum perforatum L. using different techniques such as bio-affinity chromatography coupled with UPLC/MS as well as molecular docking approaches, it has been determined that Ser 241 plays an important role in the formation of polar contacts between biapigenin, 4′,4′'',5,5′',7,7′'-hexahydroxy-3,8′'-biflavone, a high-potential/reversible/mixed inhibitor, and α-glucosidase (Dong,Hu et al., 2023). Also, Tang et al. reported that Ser 241 and His 280 amino acid residues are located in the vicinity of the binding site of salvianolic acid C on α-glucosidase and form hydrogen bonding interactions (Tang,Ma et al., 2019). Additionally, the determination of potential α-glucosidase inhibitory peptides derived from rice wine indicated that QFTPR peptide can interact with the active site of the enzyme through hydrogen bonding with Ser 241 and His 280 amino acid residues (Zheng,Chi et al., 2023).
On the other hand, synchronous fluorescence spectroscopy analyses showed that following the interaction of α-glucosidase with TPT, Tyr residues were relocated to a more hydrophobic environment (Fig. 5B). According to a molecular docking analysis, Tyr 158 is one of the major amino acid residues surrounding the TPT molecule and is essential for the formation of hydrophobic and pi-pi stacking forces with α-glucosidase (Fig. 7D). Xue et al. reported that cyanidin-3-glucoside (C21H21O11+, Cl − ) could interact with α-glucosidase through binding to Tyr 158 located in the active site of the enzyme (Xue,Zhu et al., 2021). Dong et al. also reported that Tyr 158 plays an important role in the interaction of hypericin, (4,5,7,4′,5′,7′-hexahydroxy-2′,2′-dimethyl-o-naphthalene dione) and α-glucosidase (Dong,Hu et al., 2021). The authors then claimed as acarbose has been reported to interact with active site amino acid residues of α-glucosidase (Tyr 158, Ser 240, Asp 242, Gln 279, Asp 307, Arg 315, Tyr 316, and Glu-411) (Wang,Jiang et al., 2019), inhibition mechanism of hypericin and acarbose is similar. Based on this outcome and the comparison with previous reports (Wang,Jiang et al., 2019, Dong,Hu et al., 2021), we could also suggest that TPT may inhibit the α-glucosidase activity in a reversible competitive manner, which needs further enzyme kinetic assays in future studies.
4 Conclusion
In conclusion, the interaction of TPT and α-glucosidase was assessed by several experimental and theoretical analyses. In the first step, the enzyme activity assay showed that TPT is able to inhibit α-glucosidase activity. Further studies demonstrated that hydrogen bonds and van der Waals forces are primarily responsible for potential and spontaneous interaction of TPT and α-glucosidase. Also, it was shown that TPT resulted in an increase in the content of α-helix and β-sheet of α-glucosidase structure. Molecular docking analysis revealed that TPT can bind with the active site of the enzyme and Ser 241/His 280 amino acid residues play a key role in the formation of hydrogen bonds between enzyme and TPT. Also, Tyr 158 in the active site experienced a relocation to a hydrophobic environment after the interaction of α-glucosidase with TPT. Therefore, we can claim that TPT could be utilized as an efficient inhibitor against α-glucosidase activity, nevertheless, further investigations in vivo and pre-clinical are required in the future.
Funding
This study was supported by the National Natural Science Foundation of China, NO.81200596.
CRediT authorship contribution statement
Ying Wang: Conceptualization, Supervision, Resources, Project administration, Funding acquisition, Methodology, Writing – original draft. Lingyan Xu: Conceptualization, Investigation, Visualization, Writing – original draft. Qin Tao: Conceptualization, Data curation, Validation, Formal analysis. Bin Zhou: Conceptualization, Data curation, Formal analysis, Project administration, Resources. Zhenhong Zhu: Conceptualization, Project administration, Validation, Formal analysis.
Acknowledgment
The authors would like to thank Yang Sui for conceptualization and analysis of some data.
Declaration of competing interest
The authors declare that they have no known competing financial interests or personal relationships that could have appeared to influence the work reported in this paper.
References
- Elucidation of binding dynamics of tyrosine kinase inhibitor tepotinib, to human serum albumin, using spectroscopic and computational approach. Int. J. Biol. Macromol.. 2023;241:124656
- [Google Scholar]
- Pathophysiology and treatment of type 2 diabetes mellitus: A Review. Journal of Coastal Life Medicine. 2023;11:1171-1193.
- [Google Scholar]
- Synthesis of pyrimidine-2, 4, 6-trione derivatives: anti-oxidant, anti-cancer, α-glucosidase, β-glucuronidase inhibition and their molecular docking studies. Bioorg. Chem.. 2016;68:72-79.
- [Google Scholar]
- Effects of quenching mechanism and type of quencher association on stern-volmer plots in compartmentalized systems. Biophys. J .. 1986;50(2):349-356.
- [Google Scholar]
- Lignin interacting with α-glucosidase and its inhibitory effect on the enzymatic activity. Food Biophys.. 2015;10:264-272.
- [Google Scholar]
- IDF Diabetes Atlas: Global estimates of diabetes prevalence for 2017 and projections for 2045. Diabetes Res. Clin. Pract.. 2018;138:271-281.
- [Google Scholar]
- Critical issues encountered in the analysis of protein-phenolic binding interactions via fluorescence spectroscopy. Food Hydrocoll.. 2022;124:107219
- [Google Scholar]
- Investigation the interaction between procyanidin dimer and α-glucosidase: Spectroscopic analyses and molecular docking simulation. Int. J. Biol. Macromol.. 2019;130:315-322.
- [Google Scholar]
- Analysis of inhibitory interaction between epigallocatechin gallate and alpha-glucosidase: A spectroscopy and molecular simulation study. Spectrochimica Acta Part a: Molecular and Biomolecular Spectroscopy. 2020;230:118023
- [Google Scholar]
- Inhibitory mechanism of two allosteric inhibitors, oleanolic acid and ursolic acid on α-glucosidase. Int. J. Biol. Macromol.. 2018;107:1844-1855.
- [Google Scholar]
- Blood glucose-lowering activity of protocatechuic acid is mediated by inhibiting α-glucosidase. Food Sci. Human Wellness 2023
- [Google Scholar]
- Inhibitory activity and mechanism investigation of hypericin as a novel α-glucosidase inhibitor. Molecules. 2021;26(15):4566.
- [Google Scholar]
- Rapid screening of α-glucosidase inhibitors in Hypericum perforatum L. using bio-affinity chromatography coupled with UPLC/MS. Biomed. Chromatogr.. 2023;37(2):e5536.
- [Google Scholar]
- Insights on the in-vitro binding interaction between donepezil and bovine serum albumin. BMC Chemistry. 2023;17(1):31.
- [Google Scholar]
- Thiazole-benzamide derivatives as α-glucosidase inhibitors: Synthesis, kinetics study, molecular docking, and in vivo evaluation. J. Mol. Struct.. 2023;136011
- [Google Scholar]
- Design, synthesis and α-glucosidase inhibition study of novel pyridazin-based derivatives. Med. Chem. Res.. 2023;32(4):713-722.
- [Google Scholar]
- Essential moieties of myricetins, quercetins and catechins for binding and inhibitory activity against α-Glucosidase. Bioorg. Chem.. 2021;115:105235
- [Google Scholar]
- Diosgenin from Dioscorea bulbifera: novel hit for treatment of type II diabetes mellitus with inhibitory activity against α-amylase and α-glucosidase. PLoS One. 2014;9(9):e106039.
- [Google Scholar]
- Exploring the lentil protein and onion skin phenolics interaction by fluorescence quenching method. Food Biosci.. 2022;50:102000
- [Google Scholar]
- Inhibition mechanism of α-glucosidase inhibitors screened from Tartary buckwheat and synergistic effect with acarbose. Food Chem.. 2023;420:136102
- [Google Scholar]
- Inhibition of α-glucosidase by trilobatin and its mechanism: kinetics, interaction mechanism and molecular docking. Food Funct.. 2022;13(2):857-866.
- [Google Scholar]
- Comparison of binding interaction between β-lactoglobulin and three common polyphenols using multi-spectroscopy and modeling methods. Food Chem.. 2017;228:143-151.
- [Google Scholar]
- Studies on the inhibition of α-glucosidase by biflavonoids and their interaction mechanisms. Food Chem.. 2023;420:136113
- [Google Scholar]
- Quick identification of piperidine alkaloid from roots of Grewia nervosa and their glucosidase inhibitory activity. Chem. Biodivers.. 2017;14(12):e1700400.
- [Google Scholar]
- Synthesis, in-vitro evaluation, molecular docking, and kinetic studies of pyridazine-triazole hybrid system as novel α-glucosidase inhibitors. Bioorg. Chem.. 2021;109:104670
- [Google Scholar]
- O13-4 Tepotinib safety in MET exon 14 (METex14) skipping NSCLC: Updated results from the VISION trial. Ann. Oncol.. 2021;32:S291.
- [Google Scholar]
- Type 2 diabetes mellitus: a review of current trends. Oman Med. J.. 2012;27(4):269.
- [Google Scholar]
- Insights into the inhibitory activity and mechanism of action of flavonoids from the stems and branches of Acer mono Maxim. against α-glucosidase via kinetic analysis, molecular docking, and molecular dynamics simulations. J. Mol. Struct.. 2023;1282:135188
- [Google Scholar]
- α-Glucosidase inhibitory activities of natural deep eutectic systems and their components: Ascorbate is a powerful inhibitor of α-glucosidase. J. Mol. Liq.. 2023;383:122086
- [Google Scholar]
- Assessment of inner filter effect corrections in fluorimetry. Fresenius J. Anal. Chem.. 1991;340:341-344.
- [Google Scholar]
- Thermodynamics of protein association reactions: forces contributing to stability. Biochemistry. 1981;20(11):3096-3102.
- [Google Scholar]
- Glucoamylase: structure/function relationships, and protein engineering. Biochimica Et Biophysica Acta (BBA)-Protein Structure and Molecular Enzymology. 2000;1543(2):275-293.
- [Google Scholar]
- On the inadequacy of Stern-Volmer and FRET in describing quenching in binary donor–acceptor solutions. J. Chem. Phys.. 2023;158(20)
- [Google Scholar]
- Exploring the effect of salvianolic acid C on α-glucosidase: Inhibition kinetics, interaction mechanism and molecular modelling methods. Process Biochem.. 2019;78:178-188.
- [Google Scholar]
- Antioxidant and α-glucosidase inhibitory phenolics isolated from highbush blueberry flowers. Food Chem.. 2012;135(3):1929-1937.
- [Google Scholar]
- Inhibitory mechanism of novel allosteric inhibitor, Chinese bayberry (Myrica rubra Sieb. et Zucc.) leaves proanthocyanidins against α-glucosidase. J. Funct. Foods. 2019;56:286-294.
- [Google Scholar]
- Worldwide estimates of incidence of type 2 diabetes in children and adolescents in 2021. Diabetes Res. Clin. Pract.. 2022;185:109785
- [Google Scholar]
- Counter-current fractionation-assisted bioassay-guided separation of active compound from blueberry and the interaction between the active compound and α-glucosidase. Foods. 2021;10(3):509.
- [Google Scholar]
- α-Glucosidase inhibition by luteolin: Kinetics, interaction and molecular docking. Int. J. Biol. Macromol.. 2014;64:213-223.
- [Google Scholar]
- Mechanism of interaction between urolithin A and α-glucosidase: Analysis by inhibition kinetics, fluorescence spectroscopy, isothermal titration calorimetry and molecular docking. J. Mol. Struct.. 2023;1286:135567
- [Google Scholar]
- Interactions of different urolithins with bovine serum albumin. Nat. Prod. Commun.. 2023;18(5)
- [Google Scholar]
- Interaction mechanism between α-glucosidase and A-type trimer procyanidin revealed by integrated spectroscopic analysis techniques. Int. J. Biol. Macromol.. 2020;143:173-180.
- [Google Scholar]
- Identification of novel α-glucosidase inhibitory peptides in rice wine and their antioxidant activities using in silico and in vitro analyses. LWT. 2023;178:114629
- [Google Scholar]


