

Translate this page into:
The manufacture of three types of organic butternut squash flour and their impact on the development of some oat gluten-free products
⁎Corresponding author. emanmail2005@yahoo.com (Eman A. Mahmoud), emanmail2005@du.edu.eg (Eman A. Mahmoud),
-
Received: ,
Accepted: ,
This article was originally published by Elsevier and was migrated to Scientific Scholar after the change of Publisher.
Peer review under responsibility of King Saud University.
Abstract
Butternut squash is common fruit world-wide, considered as a rich source of nutrients and bioactive compound and has promising food industrial application. Local organic butternut squash is pyriform in shape, with a semi-grooved shell, copper skin, and yellowish-orange flesh. The fruits weigh an average of 884.11 g and have a pulp yield of 82.98% and a peel yield of 12.36%.This study aims to manufacture three types of organic butternut squash flour (peel, unpeeled pulp, and peeled pulp) and utilize them as a substitute for oat flour at various ratios (5, 10, and 15%) to prepare gluten-free muffins, cookies, and waffles. A sensory evaluation of prepared products was carried out. The nutritional value, color, mineral content, phytochemicals, microstructure, functional, and physicochemical properties of butternut squash flours and top rated oatmeal products were determined. According to the findings, organic butternut squash flours were low-calorie flours with high protein, fiber, minerals, beta-carotene, and antioxidant content. For all sensory assessment parameters, muffins with a replacement ratio of 15%, cookies with 10%, and waffles with 5% pulp flour were considered the most acceptable. The protein, fiber, beta-carotene, and mineral contents of optimised gluten-free products increased significantly compared with control samples. The current study will help flour suppliers and food scientists better understand and promote the use of butternut squash flour. Gluten-free prepared products can meet the nutritional needs of celiac disease patients.
Keywords
Butternut squash
Oatmeal flour
Gluten-free
Muffin
Cookies
Waffle

1 Introduction
Butternut squash (Curcurbita moschata, L) or “butternut pumpkin” is a year-round fruit in Egypt. It belongs to the genus Cucurbita of the Cucurbitaceae family, which includes 800 species and 130 genera. Egypt is ranked 14th in the world, producing 406, 78 tonnes of pumpkin per year, while China is the world's top pumpkin producer, producing 8, 427, 68 tonnes yearly (AtlasBig, 2022). Butternut production in Africa has increased dramatically in recent years. Organic butternut squash is a perennial herbaceous fruit that produces 650–1000 g fruits in about 90 days (Toan and Thuy, 2018). Butternut squash has long been utilized as a food source and is now well recognized as a functional food. Butternut squash is often served steamed or in soups and desserts. It is a necessary fruit due to its therapeutic and nutritional characteristics (DeEscalada-Pla et al., 2020; Ahmad and Khan, 2019). The fresh fruit contains a total carotenoid of up to 10 mg/100 g, which is effective in avoiding vitamin A deficiency as well as vitamins C (9–10 mg/100 g) and E (1.03–1.06 mg/100 g). Also, it is rich in other vitamins (A, B1, B2, B6, and K), amino acids, carbohydrates, phenols, and minerals (Ca, Mg, K, P, and Fe). This fruit is beneficial for weight loss because of its high water content, low fat level, and low calorie content. Butternut bioactive components, including carotenoids, sterols, and tocopherols, are claimed to protect against a range of diseases, including diabetes, hypertension, cancer, cholesterol, and coronary heart disease (Mujaffar and Ramsumair, 2019; Piyalungka et al., 2019; Song and Sun, 2017). The pulp of the butternut squash is the most utilized portion of the fruit; it may be used to manufacture preserves, beverages, pickles, desserts, and pastry products. Fruit pulp is used to treat enteritis, indigestion, and dyspepsia. Fruit peels are abundant in fiber and phytochemicals, so they may assist food products in having higher nutritional value. Butternut squash is used in a range of food products as a result of these facts (Batista et al., 2018).
Drying butternut squash is a simple technique to compensate for seasonal fluctuations. To extend the shelf life of dried butternut squash, grind it into flour. It is used to raise the nutritional value and boost the color of baked products (See et al., 2007). It is frequently used as natural colorant in flour mixtures, sauces, soups, noodles, and seasonings, as well as a cereal flour replacement in baked products including cookies, cakes, and bread. Pumpkin is a gluten-free plant, and up to 20% of pumpkin flour can be used in human food. Pumpkin flour is high in antioxidants and phenols, both of which can help treat and prevent chronic ailments (Bochnak and Świeca, 2020; Kiharason et al., 2017). In the food industry, developing baked products with attractive natural colors has long been a focus. The attractive golden-orange color of butternut squash flour may contribute to enhancing the appearance and quality of bakery products (Dari and Yaro, 2017).
Oats are a type of cereal grain that is commonly consumed throughout the world. Granolas, low-calorie beverages, baked pastries, and therapeutic dishes are simply a few of the items that comprise it. Compared to other whole grains, oats provide more fiber, protein, minerals, and vitamins. Oatmeal is gluten-free and high in dietary fiber and beta-glucan. Oats include beta-glucan (2.0–7.5%), protein (13–20%), crude fat (2–12%), and around 60% carbohydrates. Oats are rich in antioxidants and comprise various essential amino acids that the human body requires. Oat products have a specific nutritional profile that can significantly enhance our food (Sterna et al., 2015). Celiac disease, inflammatory diseases, diabetes, dyslipidaemia, hypertension, and vascular disease are all treated with oats. Celiac disease is characterized by gliadin sensitivity. It is one of the most common causes of children's chronic diarrhoea, resulting in gastrointestinal nutrition absorption disorders. The sole therapy option is to follow a gluten-free diet for the remainder of one's life, avoiding gliadin consumption. As a consequence, celiac patients should avoid wheat-based baked items. Gluten-free products have been commercially produced to look like wheat-based ones. In response to the rising demand for healthy foods, the baking industry is focused on the development of oat-functional foods. Oats may be part of the future of inexpensive, nutritious food in a setting of escalating global food security concerns and the twin associated illnesses of underweight and obesity (Clemens and Klinken, 2014). Bakery products are widely consumed as a staple food worldwide. In recent decades, bakery products have been intensively explored and developed via fortification of active ingredients such as dietary fiber, vitamins, minerals, and bioactive compounds to increase their nutritional and therapeutic values (Mudgil et al., 2016). Therefore, butternut squash flour could be incorporated into oatmeal flour to improve its nutritional, therapeutic, and color properties.
Despite the fact that organic butternut squash is a rising commercial crop with an established export market, there is a lack of knowledge of its nutritional content and industrial applications in the local market. Consumers would be able to choose foods that meet their nutritional demands if they knew about these fruits, and researchers would be able to conduct more investigations. To our knowledge, no information exists on the nutritional, chemical, and quality properties of oat gluten-free products manufactured with butternut flour. Furthermore, the morphological, technical, nutritional, and physiochemical properties of fresh organic butternut squash fruit and its flour in Egypt's local varieties have yet to be studied. The goal of this study was to produce three types of organic butternut squash flour (peel, unpeeled pulp, and peeled pulp) and compare their nutritional value, mineral content, functional, microscan, and physiochemical properties. In addition, the free-gluten oat flour was substituted with butternut flours in various ratios (5, 10, and 15%) to develop and assess gluten-free muffins, cookies, and waffles as functional foods.
2 Materials and methods
2.1 Materials
Mature fresh organic butternut squash (Cucurbita moschata.L), gluten-free oat flour, and ingredients for muffins, cookies, and waffles were purchased from a local market in Damietta, Egypt in November 2021. Authentic beta-carotene was employed as the standard. All chemicals utilized in this investigation were of analytical grade and acquired from Sigma-Aldrich, Cairo, Egypt.
2.2 Methods
2.2.1 Technological methods
Butternut squash flours and gluten-free products were prepared and standardized at the Food Technology Laboratory, Department of Food Industries, Faculty of Agriculture, Damietta University, Egypt.
2.2.1.1 Small organic butternut squash (SOBS) flours production
Butternut squash flours were prepared according to the technique reported by Noor Aziah and Komathi (2009). Fruits were washed under running tap water to remove dirt, and soil. A fruit manual peeler was used to remove the peel off the butternuts. The pulp and peels were then cut into 2 mm thick slices using a fruit slicer (Santos 48, France) before being soaked in a 0.1% w/v citric acid solution for 15 min to prevent enzymatic browning (Sathiya Mala et al., 2016). The peels and pulp were then cleansed with distilled water before being dried overnight at 50 °C in a hot air drier (FDD720, Tech-Lab, China). To acquire a homogeneous flour particle size, the dried slices were ground to a fine powder using a laboratory mill (Moulinex grinder, China) and then a dry sieve shaker (Endecott, OCT200L, UK) with a 250 μm aperture size and a 200 mm diameter mesh sieve. Three types of flour were prepared (Fig. 1) unpeeled pulp flour (UPF), peeled pulp flour (PPF), and peel flour (PF). The final butternut squash flours were preserved in an airtight glass containers and stored in a refrigerator at 5 °C prior to analysis.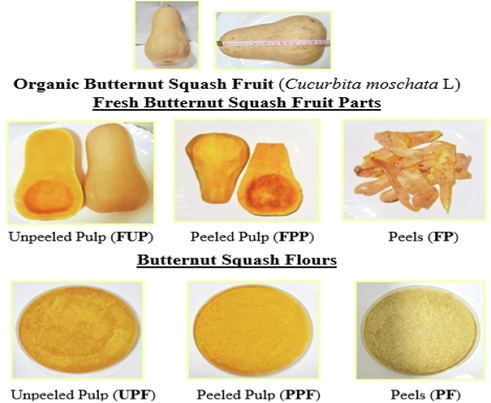
Fresh organic butternut squash (Cucurbita moschata.L) and prepared flours; (Photo by Eman. A. Mahmoud).
2.2.1.2 Preparation of flour blends
Three levels (5, 10, and 15%) of SOBS flours (PF, UPF, and PPF) were substituted for oatmeal flour in the method to prepare gluten-free muffins, cookies, and waffles. The control samples of muffins, cookies, and waffles were prepared with 100% oat flour (Table 1). UPF: Unpeeled Pulp flour, PPF: peeled pulp flour, PF: peels flour.
Ingredients
Gluten- free products formulations
Muffins
Cookies
Waffles
0%
5%
10%
15%
0%
5%
10%
15%
0%
5%
10%
15%
Oatmeal flour (g)
150
145
140
135
150
145
140
135
150
145
140
135
Butternut flours (g)
(UPF or PPF or PF)
0
5
10
15
0
5
10
15
0
5
10
15
Butter (g)
57
57
57
57
40
40
40
40
32
32
32
32
Sugar (g)
60
60
60
60
42.4
42.4
42.4
42.4
40
40
40
40
Egg (g)
79
79
79
79
–
–
–
–
80
80
80
80
Vanilla (g)
0.5
0.5
0.5
0.5
0.5
0.5
0.5
0.5
0.5
0.5
0.5
0.5
Baking powder (g)
5
5
5
5
1.75
1.75
1.75
1.75
1.65
1.65
1.65
1.65
Sodium chloride (g)
–
–
–
–
1.33
1.33
1.33
1.33
1.33
1.33
1.33
1.33
Milk (mL)
56
56
56
56
–
–
–
–
100
100
100
100
Water (mL)
–
–
–
–
18
18
18
18
–
–
–
–
2.2.1.3 Processing of gluten- free products
Three gluten-free products (muffin, cookie, and waffle) were manufactured using standardized recipes that substituted oatmeal flour with SOBS flour at different levels ranging from 5 up to 15% (Table 1).
2.2.1.3.1 Muffins preparation
Gluten-free muffins were produced following the technique described by Ho et al., (2019), with minor recipe modifications. The recipe for the muffins was as follows: butter (57 g) and sugar (60 g) were mixed until they became creamy and soft. Then, other liquid ingredients (79 g of egg, 0.5 g vanilla, and 56 g of milk) were added into the batter and blended until fluffy and light using a hand-mixer (Kenwood, OWHM670, China). All the dry ingredients, such as 150 g of oatmeal flour or SOBS blends flour, and baking powder (5 g), were carefully mixed in a different bowl. The dry components were then sifted and gently blended into the wet ingredients. The circular paper cup (50 ml) was then filled with roughly 40 g of batter and baked for 40 min at 180 °C in a conventional oven (Shineho, w294, China). Prior to analysis, the baked gluten-free muffins were allowed to cool at room temperature.
2.2.1.3.2 Cookies preparation
Gluten-free cookies were produced following the technique described by Kohajdová et al., (2014), with minor recipe modifications. The cookie formula was as follows: 150 g of oatmeal flour, 42.4 g sugar, 0.5 g vanilla, 40 g butter, 1.75 g baking powder, 1.33 g sodium chloride, and 18 ml of water. The ingredients were mixed together into a smooth dough. Baking was carried out for 10 min at 180 °C in a conventional oven (Shineho, w294, China). Prior to analysis, the cookies were allowed to cool at room temperature after baking.
2.2.1.3.3 Waffles preparation
Gluten-free waffles were produced following the technique described by Păucean et al., (2015), with minor recipe modifications. The waffle formula was as follows: 150 g of oatmeal flour, 40 g sugar, 32 g butter, 1.33 g sodium chloride, 1.75 g baking powder, 0.5 g vanilla extract, 80 g egg, and 100 ml milk. A hand-blender (Kenwood, OWHM670, China) was used to mix the ingredients. The batter was shaped and baked in a waffle maker (Tristar WF-1160) for 3 min at 350 °C to get a consistent pattern with deep indentations on either side. Finally, the waffles were cooled at room temperature prior to analysis.
2.2.2 Analytical methods
2.2.2.1 Nutritional properties
Moisture, fat, protein, fiber, and ash contents of fresh SOBS parts, SOBS flours (UPF, PPF, and PF), and prepared oatmeal gluten-free products (muffin, cookie, and waffle) were determined following the AOAC (2005). On the basis of the difference, the total carbohydrate content was calculated. Fat had a calorific value of 9 cal gram−1, whereas carbohydrate and protein had a calorific value of 4 cal gram−1 (Joint FAO /WHO, 1970).
2.2.2.2 Mineral composition
Nine key minerals, including five macro-minerals (Na, Ca, Mg, K, and P) and four micro-minerals (Fe, Zn, Cu, and Mn) were assayed following the AOAC (2005). A Gallenkamp flame analyzer (Model PEP7, U.K.) was used to determine the soduim and potassium. Other minerals were measured using an atomic absorption spectrophotometer (Perkin Elmer 932AA, Australia). The phosphorus concentration was measured using a calorimeter at 660 nm (Taussky and Shorr, 1953).
2.2.2.3 Phytochemical compounds
β-carotene content (mg/100 g) was determined in an 80% acetone extract using a spectrophotometer at 440 nm (AOAC, 2005). Total phenolic content (mg GAE/g) using the Folin-Ciocalteu method and total flavonoids (mg rutin/100 g) were determined in an 80% methanol extract using a spectrophotometer at 765 nm and 510 nm, respectively (Zakaria and Tan, 2013; Maurya and Singh, 2009). To prepare the methanol extract, the sample (1 g) was combined with 80% methanol (10 ml) and shaken for 24 hr at room temperature before filtering.
2.2.2.4 Color properties
Color of fresh SOBS parts, SOBS flours, and prepared products samples were measured using Spectrophotometer (Minolta model CM-3500d, Japan) following See et al., 2007). L* (lightness), a* (red/green), and b* (yellow/blue) are the color characteristics of the Hunter.
2.2.2.5 Functional properties of SOBS flours
Oil binding capacity and water absorption capacity were assessed according to Beuchat (1977). The swelling index was determined by inserting 1 g of SOBS flour into a standard test tube, adding 25 ml of distilled water, and vigorously shaking every 10 min for one hour with a vortex (VM-300-Taiwan). A 24-hour rest period at room temperature was used to allow the sample to fully expand. As a result, the following swelling index is calculated:
2.2.2.6 Quality analysis of prepared oatmeal gluten-free products
The products were cooled for about 1 h at 25 °C (room temperature) after baking. Its weight, height, volume, specific volume, color, and micro-structure were determined. Quality measurements were conducted with three replicates of each treatment.
2.2.2.6.1 Physical properties
The height (mm) of gluten-free products was determined by a vernier (KENDO, 150 mm). Three distinct angles were used to determine the product's dimensions. An average of the three measurements was taken. The volume (cm3) and specific volume (cm3/g) of prepared products were determined quickly using a bench top laser-based scanner (VolScan Profiler, UK) (Ho et al., 2019).
2.2.2.6.2 Microstructural analysis
Samples of gluten-free products were cut into cubic (0.5 × 0.5 cm) shapes and freeze dried. After coating dried SOBS flours and prepared products with gold palladium, scanning electron microscopy (SEM) images at a magnification of 200 were taken of their microstructures (Zeiss, Evo, Germany).
2.2.3 Sensory evaluation
To assess the muffins, cookies, and waffles, a total of 25 (13 females and 12 males) trained panelists (post-graduate students and academics aged 20–55) with a minimum of four years of experience were employed. The Food Industries Department at Damietta University provided scientific oversight for all sensory investigations. After a 45-minute introduction, the panelists started recording the study's objectives, terminology, and each sensory feature and key point on the rating. A clean knife was used to cut the products into cubes (4x10 cm3). To avoid bias, the panelists were presented with the 3-digit coded samples concurrently and evaluated them in random order. A one-minute delay between samples was required to minimize the effects. After analyzing each sample, panelists were given drinking water to rinse their mouths to reduce the taste effect (Iwe, 2002). Samples were served on white plastic platters at ambient temperature and assessed for general acceptability, color, odor, taste, appearance, and texture. The degree of like was determined using a ten-point hedonic scale (1-extreme dislike, 5-fair, and 9-extreme like). The mean values of the three assessments were calculated.
2.2.4 Statistical analysis
All tests were conducted in triplicate. One-way ANOVA has been used to determine significant differences (p ≤ 0.05) among the treatments. Post-hoc HSD (Tukey’s Honestly Significant Difference) test was employed to compare the mean values. All data was examined using SAS v. 9.2 software for statistical analysis (SAS Institute, 2011).
3 Result and discussion
3.1 Morphological and technological properties of SOBS
Pumpkins come in a wide range of weights, colors, shapes, and sizes. It features a moderate thick shell, edible pulp, and a seed cavity in the center. The morphological and technological properties of the small organic butternut squash fruit (SOBS) are listed in Table 2. OBSF is a small pyriform pumpkin with a semi-grooved shell, copper skin, and light orange-yellow pulp. The fruits weighed an average of 940.11 g and were 22.13 cm in length and 34.52 cm in diameter. They had a fruit index of 1.56, a neck diameter of 26.51 cm, and a pulp thickness of 9.12 cm. Each fruit had an average of 88 seeds and measured 0.62 mm in length, 0.31 mm in width, and 0.75 mm in thickness. Seed kernels weighed 17.50 g, whereas peels weighed 8.85 g. The yields of pulp, peels, seeds, and placenta were 82.98, 12.36, 2.98, and 1.68%, respectively. There has been limited research published on the organic butternut squash fruit. All prior research has focused on large-scale, over-five-kilogram pumpkins cultivated using conventional farming approaches. The morphological and technological characteristics of this small organic species have never been documented to our knowledge. SD = Standard Deviation, n = 3.
Morphological properties
Average ± SD
Fruit shape
Pyriform
Fruit size
Small (less than 1 kg)
Shell
Semi-grooved
Skin color
Copper
Flesh color
Light orange-yellow
Fruit weight (g)
940.11 ± 1.52
Fruit length (cm)
22.13 ± 2.24
Fruit diameter (cm)
34.52 ± 1.95
Fruit index (diameter /length)
1.56 ± 2.10
Neck diameter (cm)
26.51 ± 2.11
Pulp thickness (cm)
9.12 ± 3.01
Seeds length (mm)
0.62 ± 0.02
Seeds width (mm)
0.31 ± 0.01
Seeds thickness (mm)
0.75 ± 0.02
Number of seeds/fruit
88 ± 1.83
Seeds kernel weight (g/fruit)
17.50 ± 1.45
Seeds peels weight (g/fruit)
8.85 ± 1.94
Technological properties
Pulp weight (g/fruit)
733.63 ± 3.61
Pulp yield (%w/w)
82.98 ± 2.57
Peels weight (g/fruit)
109.28 ± 2.74
Peels yield (%w/w)
12.36 ± 2.13
Seeds weight (g/fruit)
26.35 ± 1.89
Seed yield (%w/w)
2.98 ± 1.71
Placenta weight (g/fruit)
14.85 ± 1.63
Placenta yield (%w/w)
1.68 ± 1.58
These findings matched those of Quintana et al., (2018), who found that the weights of Colombian inorganic squash varied from 575.40 to 1561.30 g, with lengths ranging from 16.40 to 29.00 cm and diameters ranging from 8.50 to 11.30 cm. It also had a 71.50% pulp yield, a 10.11% peel yield, and a 3.11% seed yield. The seeds had a 36.93% hull and a 63.06% kernel. According to Aguilar-Gutierrez et al., (2009), the pulp yield of C. moschata was 86.06 % and the shell yield was 13.89 %, with a high yield for seeds of 5.89 %. Variations in these findings could be due to the species, fruit size, growing area, and growing conditions. The shell form, pulp hardness, and chemical composition all contribute to the butternut's quality. Various morphological features revealed significant commonalities across cultivars. Additionally, it may be beneficial to understand the morphological and technological characteristics of small-sized organic butternut squash that may be employed in the food technology sector.
3.2 Nutritional value and color properties of SOBS
The nutritional value and color properties of the fresh parts and flours of SOBS are shown in Table 3. SOBS parts differed significantly (P ≤ 0.05) in terms of crude fiber, carbohydrates, and calories. Peeled pulp has significantly more (P ≤ 0.05) total carbohydrates and calories but significantly less (P ≤ 0.05) protein, fat, fibers, and ash content than both unpeeled pulp and peels. Peels had significantly richer (P ≤ 0.05) crude fibre and significantly lower (P ≤ 0.05) total carbohydrates and calories than unpeeled and peeled pulp. There were no significant variations (P ≤ 0.05) in moisture between unpeeled and peeled pulp. The moisture content in flour can affect the density and flow ability of the flour (Tze et al., 2012). The crude protein content of FPP (4.41%) was significantly lower (P ≤ 0.05) than that of FP (5.83%) and FUP (5.31%). Despite this, PPF had a lower significant (P ≤ 0.05) crude protein content (10.06%) than PPF (11.85%) and UPF (11.33%). The protein content of UPF and PF was not significantly different (P ≤ 0.05). FUP: fresh Unpeeled Pulp; FPP: fresh peeled pulp; FP: fresh peels; UPF: Unpeeled Pulp flour; PPF: peeled pulp flour; PF: peels flour; * on fresh weight basis ** on dry weight basis. Values with various superscripts in the same row are statistically significant at level 5%.
Nutritional value (%w/w)
Fresh
Flour
FUP
FPP
FP
UPF
PPF
PF
Moisture*
84.23 ± 0.32a
85.83 ± 0.41a
82.79 ± 0.22b
8.82 ± 0.12c
9.41 ± 0.23c
7.35 ± 0.14d
Crude protein **
5.31 ± 0.11c
4.41 ± 0.62d
5.83 ± 0.34c
11.33 ± 0.21a
10.06 ± 0.33b
11.85 ± 0.23a
Crude fat**
1.79 ± 0.18a
1.03 ± 0.12c
1.72 ± 0.64a
1.59 ± 0.42b
1.01 ± 0.16c
1.68 ± 0.25b
Crude fibres**
10.26 ± 0.21b
8.76 ± 0.72c
12.95 ± 0.41a
9.66 ± 0.31b
8.73 ± 0.16c
12.64 ± 0.22a
Ash **
6.48 ± 0.18a
5.43 ± 0.14b
5.68 ± 0.21b
7.15 ± 0.17a
6.42 ± 0.19b
6.67 ± 0.22a
Carbohydrates **
76.16 ± 0.27b
80.37 ± 0.11a
73.82 ± 0.23c
70.27 ± 0.13d
73.78 ± 0.18c
67.16 ± 0.13f
Calories (kcal/100 g) **
341.99 ± 0.19b
348.39 ± 0.46a
334.08 ± 0.23c
340.71 ± 0.25b
344.45 ± 0.23a
331.16 ± 0.17c
Color properties
L*
66.67 ± 0.17c
67.31 ± 0.22c
63.62 ± 0.43d
72.36 ± 0.37a
73.14 ± 0.25a
69.45 ± 0.11b
a*
14.84 ± 0.41a
14.86 ± 0.35a
15.81 ± 0.62a
13.98 ± 0.21b
14.08 ± 0.34b
15.56 ± 0.45a
b*
45.54 ± 0.64d
50.01 ± 0.88c
39.49 ± 0.81e
55.56 ± 0.32b
60.14 ± 0.82a
49.62 ± 0.61c
Hue Angle θ
73.87 ± 0.34b
68.96 ± 0.34c
75.48 ± 0.50a
74.19 ± 0.48b
69.32 ± 0.35c
76.84 ± 0.47a
As a consequence, this is the first comprehensive chemical-technological research of the small-sized butternut squash cultivated under organic farming. Previously, research revealed that the pulp of organic butternut squashes had comparable chemical properties, including 89.47 % moisture, 1.14 % protein, 0.13 % fat, 1.22 % ash, 2.68% crude fibres, and 8.04 % carbohydrate on a fresh basis (Armesto et al., 2020). Mala and Kurian (2016) reported that fresh pumpkin pulp and peel had comparable results. Additionally, Nakhon et al. (2017) demonstrated identical findings for pumpkin flour made from peeled pulp. On the other hand, Dhiman et al. (2018) reported that pumpkin pulp flour contained 6.28 % moisture, 6.12% protein, 1.5% fat, 4.61% ash, 2.96% crude fibers, and 62.57% carbohydrate. Disparities in growing circumstances, farming conditions, and cross-species variation might explain the differences. SOBS flours are an excellent ingredient for use in the baking industry, particularly for low-calorie and low-fat baked products.
Fresh butternut squash is soaked in 0.1% citric acid (w/v) prior to drying to inactivate enzymes and prevent discolouration. The flour discoloration during the milling and drying processes might be caused by non-enzymatic browning (Feng and Tang, 1998). SOBS flours have a higher L* value (brighter color) and b* value (more yellowness) than fresh parts, but a lower a* value (less red color ) (Table 3). This suggested increased brightness and yellowness as a result of moisture evaporation, which increased carotene content. In addition, a* value increases with high moisture and decreases with drying and milling to produce flour. The hue angle is linked with the commonly recognized yellow color, which is represented by a 900°angle. The product with a low hue angle is more orange-red, whereas the product with a high hue angle is more green (Francis, 1980). The Hue values did not differ significantly (P ≤ 0.05) across the fresh parts and their flour. The chromatic hue angle values and L* values were shown to be closely correlated. The color of both the fresh parts and the flours was closer to the yellowish color. The yellow color might be attributed to the beta-carotene content in butternuts.
3.3 Functional, physicochemical, and phytochemical properties of SOBS flours
Water absorption is a key functional and physiochemical property of proteins. It has the potential to affect the nutritional properties and food quality. Plant fibers have more pectin than grains and legumes, which allows them to absorb water more efficiently. Pumpkins include insoluble fibers with high water absorption, such as pectin, hemicellulose, cellulose, and lignin (Păucean and Man, 2014). As shown in Fig. 2, PF had a higher significant (P ≤ 0.05) water absorption capacity (9 ml/g) than UPF (7 ml/g) and PPF (6 ml/g). As a consequence, SOBS flour will enhance the product's stability and may be used as a thickening agent in soups and sauces.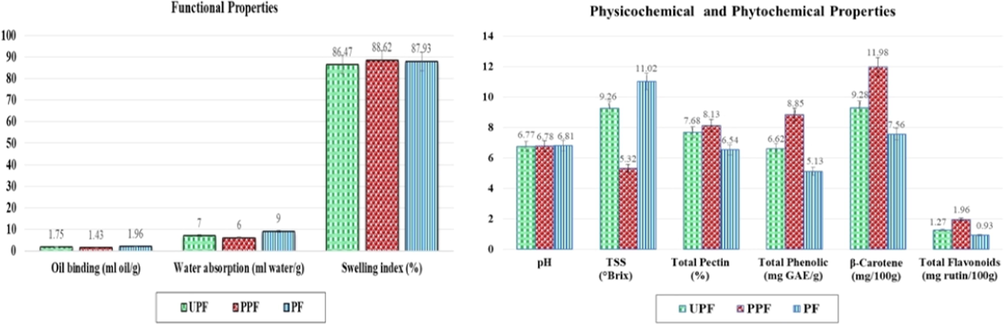
Phytochemical and functional properties of SOBS flours. UPF: Unpeeled Pulp flour, PPF: peeled pulp flour, PF: peels flour.
In terms of swelling index, SOBS flours swelled extremely well, with no significant differences (P ≤ 0.05) between PPF (88.62%), UPF (87.93%), and PF (86.47%). The capability of flour to swell is inversely related to fat-fiber content. Fat inside the fibers inhibits water molecules from entering the flour, resulting in less swelling. As all flour has a low fat content, the fiber's capability to absorb water and enhance swelling increases (Nyam et al., 2013).
In terms of oil binding, there were significant differences (P ≤ 0.05) between PF (1.96 ml/g), UPF (1.75 ml/g), and PPF (1.43 ml/g). This result might be explained by the high fiber content of PF in comparison to UPF and PPF. Furthermore, heat treatment during the drying process of peel and pulp of pumpkin seeds improves flour's capacity to bind oil, whereas denaturation assists in the protein hydrophobicity deterioration (Fagbemi et al., 2005). These findings are corroborated by Saewan and George (2020), who found no significant differences in swelling index properties between the peel and pulp flour of pumpkin, but significant differences (P ≤ 0.05) in water absorption and oil binding. Pumpkin flour absorbs water effectively and binds oil well, making it a good alternative emulsifier for food preparation (Roongruangsri and Bronlund, 2016). The functional properties of SOBS flours, such as water absorption, swelling index, and oil binding, are recognized as key factors in improving baking product standards.
The pH is related to protein solubility and the detection of bacterial spoilage in foods (Soria-Hernández et al., 2015). UPF, PPF, and PF pH values were near neutral at 6.77, 6.78, and 6.81, respectively. This data was consistent with the findings of Quintana et al. (2018), who found that the pH values of Colombian squash pulp and peel flour were 6.84 and 6.87, respectively.
TSS is a fruit ripeness index that measures the amount of dry matter left after all the water has drained. TSS values for PF (11.02 °Brix) were significantly higher (P ≤ 0.05) than TSS values for UPF (9.26 °Brix) and PPF (5.32 °Brix).This study supported the findings of Quintana et al. (2018), who discovered that the TSS of Colombian squash was 10.46 °Brix for the peel and 5.01 °Brix for the pulp.
Pectin is a complex polysaccharide, and its structure and physiological characteristics may be affected by extraction conditions, location, sources, and a variation of other environmental variables (Seleim et al., 2015). Fig. 2 shows that PPF (8.13%) had the highest pectin content whereas PF had the lowest (6.54%). UPF had a moderately significant (P ≤ 0.05) pectin content (7.68%). These findings confirmed the results of Jacobo-Valenzuela et al. (2011) who revealed that the pectin content of Mexican squash pulp was 7.35% and 5.53 % in the peel.
Total phenolic content is considered to preserve tissue. It was determined in gallic acid equivalent because of its high reactivity to the Folin–Ciocalteu reagent and acid stability (Asif et al., 2017). PPF extract had the highest total phenolic content (8.85 mg GAE/g) of the three SOBS flours (P ≤ 0.05), while PF extract had the lowest total phenolic content (5.13 mg GAE/g). PPF has a high level of total phenols with a high antioxidant capacity, which might be attributed to the fact that pulp is a key location for plant metabolism and secondary metabolite synthesis. According to Bahramsoltani et al. (2017), pumpkin peel had 22.92 mg GAE/g total phenolic content. Bochnak and Świeca (2020) investigated the influence of drying temperatures on the total phenolic content of pumpkin pulp flour; their findings ranged from 4.32 to 11.35 mg GAE/g, and the highest values were obtained for pumpkin flour dried at 70 °C. Moreover, Wanna (2019) discovered that pumpkin pulp (116.66 mg GAE/g) had a higher total phenolic content than pumpkin peel (110.45 mg GAE/g). These findings verify our prior findings, demonstrating that SOBS pulp flour has a higher concentration of total polyphenols than SOBS peel flour. Mala and Kurian (2016) found no statistically significant difference (P ≤ 0.05) in the phenolic content (5.21 mg GAE/g) of pumpkin pulp and (5.19 mg GAE/g) peel. On the other hand, Ali and Naz (2017) determined the total phenolic content in the peels and pulp of Pakistani pumpkin were 2.683 and 1.678 mg GAE/g, respectively, and this discrepancy with our findings could be attributed to a variety of factors such as pumpkin variety, cultivation conditions, climate, postharvest storage, and solvents used for extracts.
In terms of β-carotene content, the pulp and peel of SOBS are high in carotenoids, which give the fruit its yellowish orange color. Vitamin A, generated from carotenoids, promotes healthy vision, growth, reproduction, and immunity. Vitamin A insufficiency is the leading cause of blindness and mortality in new-borns. PPF extract had the highest significant (P ≤ 0.05) β-carotene content (11.98 mg/100 g), whereas PF extract had the lowest (7.56 mg/100 g). The UPF extract (9.28 mg/100 g) has a β-carotene content between PPF and PF (Fig. 2). Fresh Indian pumpkin pulp has lower β-carotene levels (32 mg/100 g) than pumpkin flour (116.75 mg/100 g), according to Kurian et al., (2021). The present β-carotene contents of PPF and PF were comparable to those reported by Hussain et al., (2021), who found that C. maxima pulp powder contained 6.18 mg/100 g of β-carotene and peel powder contained 4.60 mg/100 g. Additionally, these data reveal that butternut contains a high level of carotenoids, particularly β-carotene. Murkovic et al., (2002) determined the β-carotene content of three species of pumpkins and discovered that levels varied between 0.06 and 2.3 mg/100 g in C. pepo, 1.4 to 7.4 mg/100 g in C. maxima, and 3.1 to 7.0 mg/100 g in C. moschata. Variations in beta-carotene content between studies could be attributed to differences in pumpkin cultivars, genotypes, postharvest, and meteorological conditions.
Flavonoids and phenolics are both well-known active plant components in humans. The PPF extract had the highest flavonoid content (1.96 mg rutin/100 g), whereas the PF extract contained the least (0.93 mg rutin/100 g). The flavonoid content of UPF extract (1.27 mg rutin/100 g) was determined to be between PPF and PF (Fig. 2). PPF included a greater amount of total flavonoids, probably due to increased metabolism in these fruit tissues, which resulted in increased metabolite synthesis. Although the total flavonoid content of pumpkin is lower than the total phenolic content, even tiny levels of total flavonoid content have a significant antioxidant effect (Asif et al., 2017). The flavonoids content of PPF and PF was similar to the trend described by Hussain et al., (2021), who stated that C. maxima pulp flour contained 77.11 mg CE/100 g of flavonoids and peel flour contained 45.00 mg CE/100 g. According to Jang et al. (2001), pumpkin peel flour had 81.5 mg/100 g flavonoids, whereas pulp flour contained 38.7 mg/100 g. Jarungjitaree and Naradisorn (2019) reported that the total flavonoid content of pumpkin peel varied considerably based on the extraction solvent and methanol concentration used.
3.4 The structure of SOBS flours by scanning electron microscope
−605155236918500 The electron microscope scan demonstrates that the surface structures of SOBS flours particles are clotted (Fig. 3). This might be a result of free water evaporating during oven drying, as well as microstructure pressures formed inside the flour particles (Rahman et al., 2017). In general, the SOBS flours particles appear to have large and open pores, which is most probably due to the soak of fresh butternut squash parts in 0.1% citric acid (w/v) prior to hot air drying, which shrinks butternut squash tissues and allows for osmosis. The drying process reduces the moisture content in the SOBS tissues and changes the structure of the tissues, making them more fragile and easy to dry. According to Fig. 3, PF particles have a flaky structure with a larger surface area than UPF and PPF samples. The PPF samples had a bigger particle size and a higher moisture content than the PF samples, whilst the UPF samples had an intermediate particle size, which might be connected to the previous finding that PF had a higher capacity for water absorption than UPF and PPF.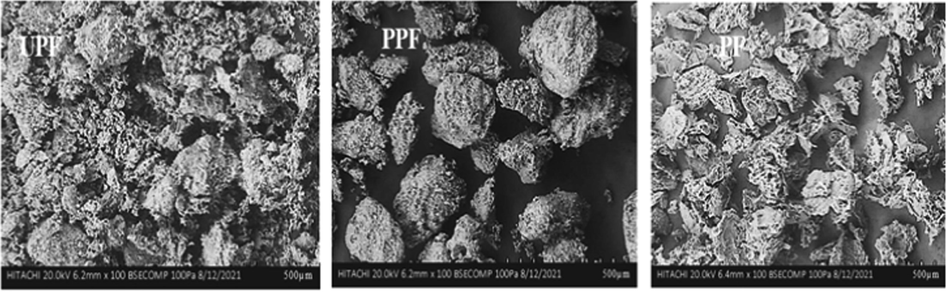
Particles Morphology of SOBS flours. UPF: Unpeeled Pulp flour, PPF: peeled pulp flour, PF: peels flour.
3.5 Minerals composition of SOBS flours
Minerals have critical functions within the body. Numerous minerals are insufficiently eaten to fulfill their daily metabolic requirements. Consuming fruits and vegetables is critical for ensuring proper mineral intake since these foods have the highest mineral content. The major minerals required in the diet include Na, Ca, Mg, K, P, Cl, and S. While trace minerals such as Fe, Zn, Cu, Mn, Co, B, Cr, and Cd are required in amounts less than 100 mg per day (Moreira, 2006). As seen in Fig. 4, the amounts of P, K, Mg, and Na in SOBS flours were significantly higher (P ≤ 0.05) than the levels of Fe, Zn, Cu, and Mn. Mn had the lowest concentration of any of the nine elements examined in UPF (0.44 mg/100 g) and PF (0.84 mg/100 g), whereas Cu had the lowest concentration in PPF (1.11 mg/100 g). PPF had higher levels of potassium (4134.42 mg/100 g), calcium (420.62 mg/100 g), sodium (95.31 mg/100 g), iron (12.06 mg/100 g), zinc (5.18 mg/100 g), and manganese (1.84 mg/100 g) than UPF and PF. The PF contained the highest significant (P ≤ 0.05) amounts of phosphorus (829.17 mg/100 g) and magnesium (415.98 mg/100 g). Comparing to the dietary recommendations, UPF, PPF, and PF had significant higher levels of P, Ca, Mg, Fe, Cu, Zn, and Mn, but lower levels of Na (US Institute of Medicine, 2001). This means that SOBS flours are a rich source of essential minerals for middle-aged and older people.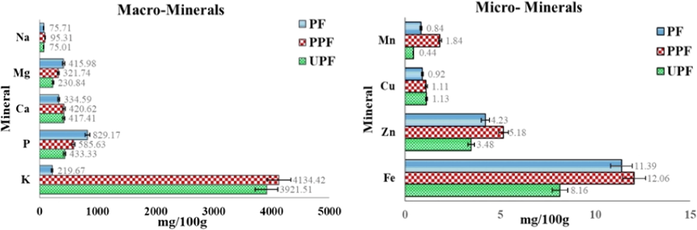
Minerals composition of SOBS flours. UPF: Unpeeled Pulp flour, PPF: peeled pulp flour, PF: peels flour.
4 Technological application of SOBS flours
4.1 1.Sensory evaluation of prepared oatmeal gluten- free products
The mean scores of sensory parameters of SOBS flours (0, 5, 10, and 15%) substituted free-gluten oatmeal muffins, cookies, and waffles are shown in Fig. 5. Color, taste, odor, appearance, texture, and general acceptability were significantly different (P ≤ 0.05) amongst samples. Substituting a portion of oatmeal flour with SOBS flour at a ratio of 5% up to 15% was acceptable in all manufactured products. This might be due to the flavor, color, and taste of butternuts. The analysis revealed that all products prepared with PPF had the highest level of sensory acceptability, followed by standard samples and samples with alternative treatments. However, the quantity of PPF substituted varied depending on the resulting product: muffins included 15%, cookies had 10%, and waffles contained 5%. Color (9.75), odor (9.21), texture (8.75), taste (9.87), appearance (9.75), and general acceptability (9.46) were the mean values for muffins with 15% PPF in contrast to control samples color (8.64), odor (8.85), texture (8.87), taste (8.36), appearance (8.21), and general acceptability (8.16). Additionally, the mean values for cookies containing 10% PPF were color (9.26), odor (9.08), texture (8.92), taste (9.01), appearance (8.71), and general acceptability (8.63), compared to the control sample's color (8.46), odor (8.75), texture (8.58), taste (8.54), appearance (8.11), and general acceptability (8.32). Color (8.15), odor (8.06), texture (7.69), taste (8.39), appearance (8.04), and general acceptability (8.24) were the mean values for Waffle in contrast to the control sample color (7.49), odor (7.84), texture (7.11), taste (7.92), appearance (7.23), and general acceptability (7.82). Sensory characteristics significantly decreased (P ≤ 0.05) when PF and UPF were used as high substitute levels for oat flour.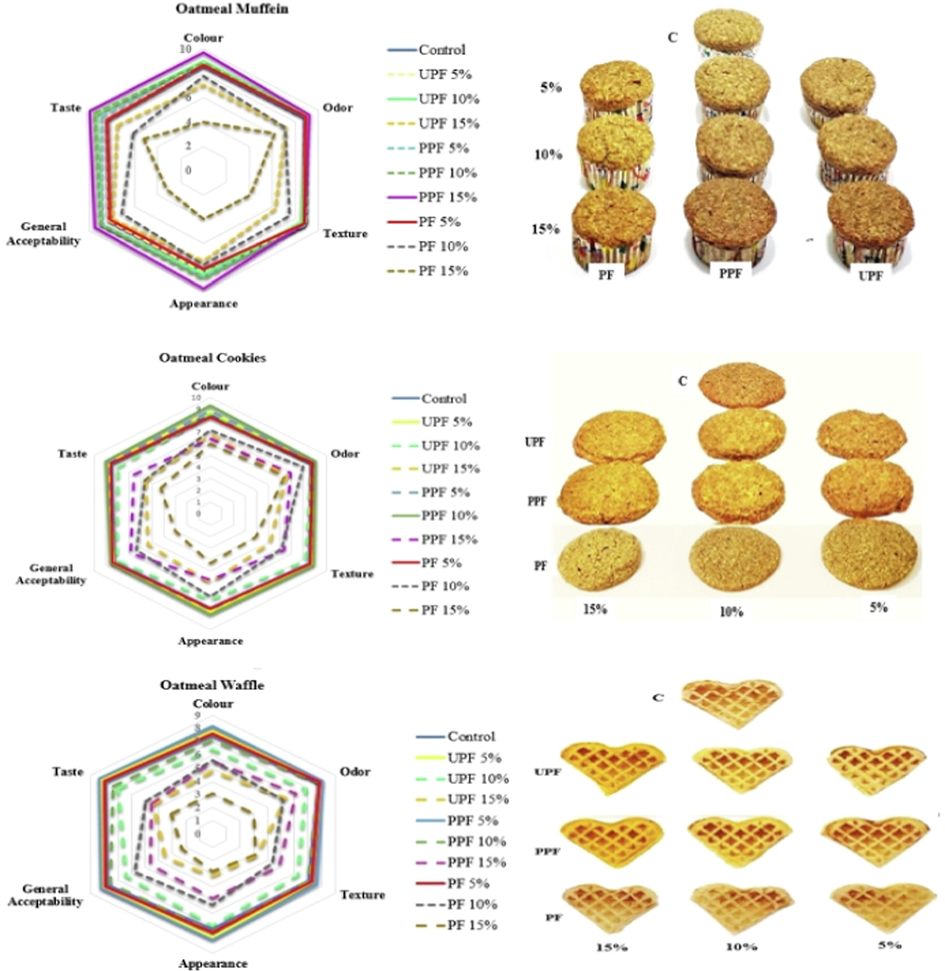
Sensory evaluation of prepared products from the substitution of SOBS flours for oatmeal flour. UPF: Unpeeled Pulp flour, PPF: peeled pulp flour, PF: peels flour.
By increasing the replacement ratio of UPF and PPF, the yellow-orange color intensity of prepared products is increased. The butternut fruit's yellow color is caused by the carotene pigment. The color of products manufactured with PF tends to turn yellowish-green as the replacement ratio increases because SOBS peels include chlorophyll and carotene pigments. There may be changes to carotenoids and other pigments when they are baked because of the oxidation process and the temperature (Roongruangsri and Bronlund, 2016).
The participants were generally satisfied with the texture of the cookies and waffles produced, but their satisfaction decreased significantly (P ≤ 0.05) when the replacement ratio was increased to 15% and the products became hard. This result confirmed the findings of Pongjanta et al. (2006) that the optimal ratio of pumpkin pulp flour to wheat butter replacement was 10% in cookies and 20% in cakes. On the other hand, Nyam et al. (2013) found that wheat bread using 5% pumpkin peels flour was the most acceptable because it had a pleasant aroma and a soft texture due to the peel flour's increased capacity to retain moisture compared to wheat flour. The discrepancy in findings across prior research is attributable to the various manufacturing conditions, such as the kind of flour, pumpkin species, and product type.
4.1.1 Nutritional value, and color properties of optimized prepared gluten-free products
The nutritional value, phytochemicals, and color properties of control and substituted muffins with 15% PPF, cookies with 10% PPF, and waffles with 5% PPF are shown in Table 4. The results indicate that the crude protein content of prepared products substituted with PPF was not significantly lower (P ≤ 0.05) than control samples. The crude fat content of muffins substituted with 15% PPF (9.42%), cookies substituted with 10% PPF (15.86%), and waffles substituted with 5% PPF (11.99%) decreased significantly (P ≤ 0.05) when compared to control samples of 10.91, 17.51, and 12.47%, respectively. Ash and fiber content increased significantly (P ≤ 0.05) in substituted product with PPF compared with control samples. This might be due to the fact that the protein and fat-rich oatmeal flour was replaced by the fiber-rich PPF in the preparation of the product. This might be because the fiber-rich PPF was used to replace the protein-fat-rich oatmeal flour in the manufacturing products. The amount of carbohydrates and calories in products was significantly reduced when oatmeal flour was replaced with PPF. This is especially noteworthy given the products' lower calorie and carbohydrate content. In general, the products substituted with PPF were lower in protein, fat, carbohydrates, and calories and higher in crude fibers and ash. Our findings are consistent with those of See et al., 2007), who reported that adding 15% of pumpkin flour to cake composites increased crude fiber and ash while decreasing fat and protein. Values in the same row with different superscripts are significantly different at 5% level; PPF: peeled pulp flour.
Nutritional value (%w/w)
(On dry basis)Optimized oatmeal gluten- free products
Muffins Cookies Waffles
Control
PPF 15%
Control
PPF 10%
Control
PPF 5%
Crude protein
14.81 ± 0.34a
14.09 ± 0.5a
15.33 ± 0.68a
14.80 ± 1.03a
14.97 ± 0.59a
14.75 ± 0.65a
Crude fat
10.91 ± 0.89d
9.42 ± 0.12f
17.51 ± 0.48a
15.86 ± 0.59b
12.47 ± 0.35c
11.99 ± 0.33c
Crude fibres
4.01 ± 0.67f
9.56 ± 0.94b
9.40 ± 0.23b
11.48 ± 1.45a
5.72 ± 0.44d
6.74 ± 0.52c
Ash
1.58 ± 0.23f
5.99 ± 0.39a
1.75 ± 0.68e
4.87 ± 0.68b
1.85 ± 0.66d
3.30 ± 1.26c
Carbohydrates
68.69 ± 0.78a
60.94 ± 0.86d
56.01 ± 0.39e
52.99 ± 0.56f
64.99 ± 0.29b
63.22 ± 0.47c
Calories (kcal/100 g)
432.19 ± 1.28b
384.90 ± 0.95d
442.95 ± 1.78a
413.90 ± 1.11c
432.07 ± 0.67b
419.79 ± 0.45c
phytochemical properties
β-carotene (mg/100 g)
1.91 ± 1.11d
21.25 ± 1.15a
1.72 ± 1.62e
15.93 ± 1.36b
1.17 ± 1.25f
9.31 ± 1.18c
Total phenolic (mg GAE/g)
1.30 ± 1.32b
1.52 ± 1.21a
1.03 ± 1.73d
1.38 ± 1.43c
0.24 ± 0.84f
0.42 ± 0.52e
Total flavonoids
(mg rutin/100 g)0.23 ± 1.18c
0.48 ± 0.92a
0.09 ± 1.83e
0.36 ± 1.61b
0.21 ± 1.17d
0.35 ± 1.19b
Color properties
L*
46.56 ± 1.47c
42.81 ± 1.45e
63.48 ± 1.76a
58.32 ± 1.35b
45.37 ± 1.25d
42.18 ± 1.64e
a*
6.24 ± 1.23d
11.58 ± 0.99a
8.19 ± 1.48c
9.97 ± 1.18b
3.52 ± 1.19e
5.41 ± 1.37d
b*
30.20 ± 1.11f
39.45 ± 1.57a
32.26 ± 2.11d
36.98 ± 1.24b
31.61 ± 1.11d
33.91 ± 1.25c
Muffins with 15 %PPF had the significant highest level (P ≤ 0.05) of β-carotene (21.25 mg/100 g), total phenolic (1.52 mg GAE/g), and total flavonoids content (0.48 mg rutin/100 g), followed by substituted cookies with 10 %PPF, which had β-carotene (15.93 mg/100 g), total phenolic (1.38 mg GAE/g), and total flavonoids content (0.36 mg rutin/100 g). Waffle substituted with 5 %PPF had the significant lowest level (P ≤ 0.05) of β-carotene (9.31 mg/100 g), total phenolic (0.42 mg GAE/g), and total flavonoids content (0.35 mg rutin/100 g). Pumpkins are high in β-carotene and antioxidant, a compounds that may protect against some forms of cancer (See et al., 2007). The results indicated that oatmeal gluten-free goods containing PPF had a high concentration of beta-carotene, total phenols, and total flavonoids, as well as an improved nutritional quality.
Color is an important sensory element that influences a consumer's decision to purchase a product. Color values of oat gluten-free products substituted with PPF were measured in crumb and presented in Table 4. Pumpkins are high in carotene as a natural pigment responsible for the orange color and elevated a* and b* values (See et al., 2007). The higher a* values (redness) and b* values (yellowness) showed that the PPF flour had a more attractive color than oatmeal flour. Thus, incorporating butternut flour into food products would give the products an attractive color and increase customer approval.
4.1.2 Minerals composition of optimized prepared oatmeal gluten-free products
The results in Fig. 6 indicate that oat gluten-free products substituted with PPF have significantly higher levels (P ≤ 0.05) of macro and micro minerals than control products. The mineral content of prepared products increased when the substitution ratio with PPF was raised. Muffins with 15% PPF had significantly more (P ≤ 0.05) potassium (281.52 mg/100 g), phosphorous (388.16 mg/100 g), calcium (65.75 mg/100 g), magnesium (201.53 mg/100 g), sodium (41.42 mg/100 g), iron (4.76 mg/100 g), zinc (3.83 mg/100 g), and manganese (1.73 mg/100 g) than the control product. This finding was consistent with Kulkarni and Joshi (2013), who found that wheat biscuits substituted with 2.5% pumpkin pulp flour had more minerals such as phosphorus, calcium, and iron than the control samples. Butternuts flour is a good source of minerals and other elements. The PPF is assisting in the development of oatmeal gluten-free products in order to supply nutritious, mineral-dense foods to adults and kids.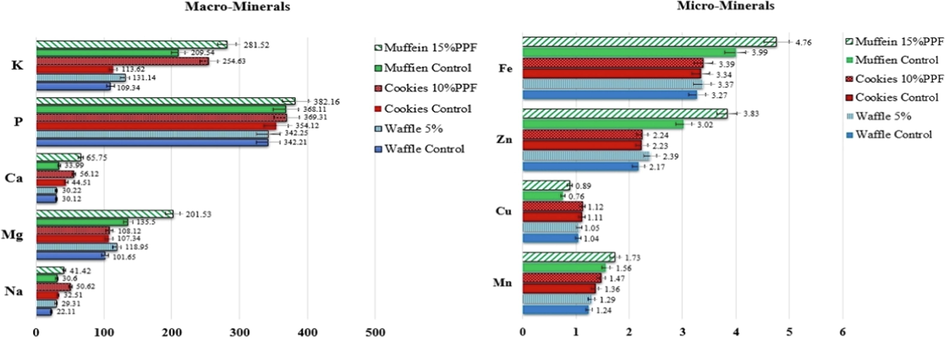
Minerals composition of optimized prepared oatmeal gluten-free products.
4.1.3 Physical properties of optimized prepared oatmeal gluten-free products
The physical properties of control and optimized prepared gluten-free products are shown in Table 5. Consumers make purchasing decisions based on the physical qualities of a product. Physical parameters such as height, weight, and specific volume of PPF-substituted products show no significant decrease (P ≤ 0.05) compared to control samples. In general, the weight loss of baked products has an inverse relationship with the water loss. The volume of muffins with 15% PPF and cookies with 10% PPF was significantly decreased (P ≤ 0.05) compared with control products. Furthermore, there was no significant decrease (P ≤ 0.05) in volume between the waffle with 5% PPF and control. This is consistent with Ho et al. (2019), who found that substituting up to 20% pumpkin flour for rice gluten-free muffins had no significant influence on the height and specific volume of the muffins. Variations in the physical properties of oatmeal-based products containing PPF may be caused by differences in chemical content, such as fibers and protein concentrations, the kind of product, and the ratio of PPF substituted. This study indicates that the high-fiber PPF is a good flour substitute for oatmeal flour when making gluten-free foods.
Product
Weight
(g)Volume
(cm3)Specific volume
(cm3 /g)Height
(mm)
Muffins control
20.11a
43.25a
2.15a
55.31a
Muffins 15 %PPF
19.16a
38.52b
2.06a
54.62a
Cookies control
12.08c
23.60d
1.95b
8.91d
Cookies 10% PPF
11.51c
22.21f
1.93b
9.92d
Waffle control
15.67b
31.58c
2.02b
23.71c
Waffle 5% PPF
15.56b
31.12c
2.00b
22.93c
4.1.4 Microstructure of optimized prepared oatmeal gluten-free products
The influence of PPF on the microstructure of oatmeal gluten-free prepared products was investigated using a scanning electron microscope. Fig. 7 illustrates the images of control and optimized substituted products. High specific volume indicates a more porous structure for baked products. Contrary to PPF-substituted products, control products had a more porous structure and bigger air cells with a more aerated structure. Specific volume statistics corroborated this conclusion (Table 5). Products with less aerated structures had a higher hardness value, so the hardness of cookies was higher than the muffins and waffles. Muffins containing 15% PPF exhibited lower porosity and heterogeneity in the pores. This could be a reason for the lower specific volume of the substituted muffins with 15 %PPF compared with control muffins. PPF-containing cookies featured tiny gas cells that formed a dense structure. Similarly, Polaki et al. (2010) noted that fiber-containing breads had a less porous structure than control loaves due to the fiber effect. There were no differences between control and 5% PPF substituted waffle. Pre-treatment of flour may have an effect on its qualities, including moisture content, water activity, color, particle size, tapped density, and bulk density (Prajapat et al., 2011).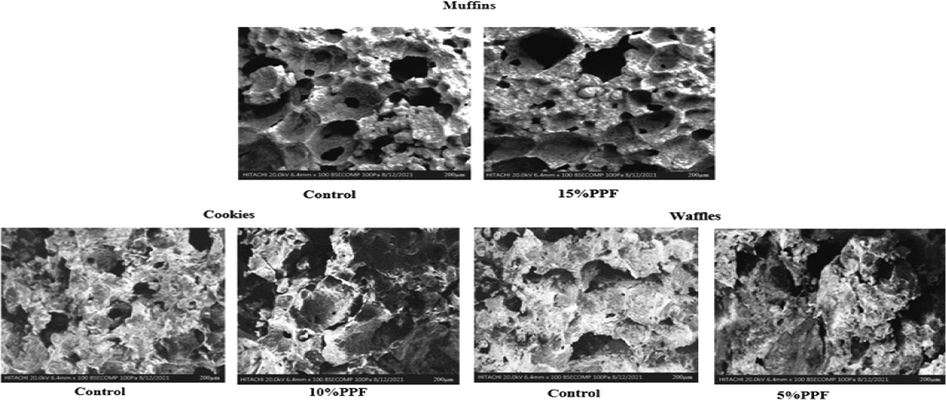
Microstructure of optimized prepared oatmeal gluten-free products.
5 Conclusion
This study aims to shed light on the butternut squash fruit, which is widely consumed fresh worldwide, and to prepare three types of flour to develop some gluten-free products (mufin, cookies, and wafles). In conclusion, butternut squash flours (UPF, PPF, and PF) are extremely nutritious and beneficial for human health. On the basis of sensory and physical properties, the muffins with a replacement ratio of 15%, cookies with 10%, and waffles with 5% pulp flour were considered the most acceptable. The golden yellow color intensity of prepared products is enhanced by raising the replacement ratio of UPF and PPF. Microstructural analysis revealed that adding PPF reduced the porosity of prepared products due to the dietary fiber. The products substituted with PPF were lower in protein, fat, carbohydrates, and calories and higher in crude fibers and ash. In addition, it had a high level of β-carotene, total phenols, and total flavonoids, as well as enhanced nutritional quality. Developed products might be suggested as functional foods for school-aged children, adults, and celiac disease patients. The present work provides valuable information for food scientists or industry stakeholders in order to improve butternut squash flour utilization and consumption. Additionally, this study may serve as a stepping stone to develop other gluten-free products including noodles, bread, and cakes.
Declaration of Competing Interest
The authors declare that they have no known competing financial interests or personal relationships that could have appeared to influence the work reported in this paper.
References
- Characterization quimica, fisica, funcional y nutrimental de la calabaza cehualca (cucurbita moschata d.) cv cehualca integral. tesis de maestra. In: Maestria en Ciencia y Tecnologia de Alimentos, Facultad de Ciencias Quimico Biologicas. Universidad Autonoma de Sinaloa; 2009.
- [Google Scholar]
- Pumpkin: horticultural importance and its roles in various forms: a review. Int. J. Horticul. Agric.. 2019;4(1):1-6.
- [Google Scholar]
- Free radical scavenging activity of pulps and peels of some selected vegetables commonly used in Pakistan. Pak. J. Agric. Res.. 2017;30(1):55-66.
- [Google Scholar]
- The Official methods of analytical, G.D.C. In: Horwitz William, Latimer George W., eds. Official methods of analysis of AOAC International. Gaithersburg, Md: AOAC International; 2005. https://www.worldcat.org/title/official-methods-of-analysis-of-aoac-international/oclc/62751475
- [Google Scholar]
- Nutritional characterization of butternut squash (Cucurbita moschata D.): Effect of variety (Ariel vs Pluto) and farming type (conventional vs. organic) Food Res. Int. 2020
- [CrossRef] [Google Scholar]
- Antioxidant, antibacterial and antiproliferative activities of pumpkin (cucurbit) peel and puree extracts-an in vitro study. Pak. J. Pharm. Sci.. 2017;30(4):1327-1334.
- [Google Scholar]
- AtlasBig. com., 2022. https://www.atlasbig.com/en-us/countries-pumpkin-production, accessed on: 27/3/2022.
- Evaluation of phytochemicals, antioxidant and burn wound healing activities of Cucurbita moschata Duchesne fruit peel. Iranian J. Basic Med. Sci.. 2017;20(7):798.
- [Google Scholar]
- Partial replacement of wheat flour by pumpkin seed flour in the production of cupcakes filled with carob. Food Sci. Technol.. 2018;38(2):250-254.
- [Google Scholar]
- Functional and electrophoretic characteristics of succinylated peanut flour proteins. J. Agric. Food. Chem.. 1977;25:258-261.
- [Google Scholar]
- Potentially bioaccessible phenolics, antioxidant capacities and the colour of carrot, pumpkin and apple powders – effect of drying temperature and sample structure. Int. J. Food Sci. Technol.. 2020;55(1):136-145.
- [Google Scholar]
- The future of oats in the food and health continuum. Br. J. Nutr.. 2014;112:S75-S79.
- [Google Scholar]
- Nutritional composition and storage of butternut squash. Ghana J. Hortic.. 2017;12(1):25-31.
- [Google Scholar]
- Innovative strategies and nutritional perspectives for fortifying pumpkin tissue and other vegetable matrices with iron. Food Sci. Human Wellness.. 2020;9(2):103-111.
- [CrossRef] [Google Scholar]
- Preparation of pumpkin powder and pumpkin seed kernel powder for supplementation in weaning mix and cookies. Int. J. Chem. Stud.. 2018;6(5):167-175.
- [Google Scholar]
- Effect of processing on the Functional Properties of full fat and defatted fluted pumpkin (Telfairia occidentalis) Seed Flours. J. Food Technol.. 2005;3(3):370-377.
- [Google Scholar]
- Microwave finish drying of diced apples in a spouted bed. J. Food Sci.. 1998;63:679-683.
- [Google Scholar]
- Physical and sensory qualities of gluten-free muffin produced from composite rice-pumpkin flour. Int. Food Res. J.. 2019;26(3):893-901.
- [Google Scholar]
- Determination of total phenolic, flavonoid, carotenoid, and mineral contents in peel, flesh, and seeds of pumpkin (Cucurbita maxima) J. Food Process Preserv.. 2021;00
- [CrossRef] [Google Scholar]
- Iwe, M.O. 2002. Handbook of sensory methods and analysis rejoint communication services Ltd Uwani Enugu. pp. 40-83.
- The comparison of food constituent in different parts of pumpkin. J. Kor. Soc. Food Sci. Nutr.. 2001;30(6):1038-1040.
- [Google Scholar]
- Evaluation of antioxidant and antifungal activities of pumpkin by-product and its application in banana. J. Food Sci. Agric. Technol.. 2019;4:129-213.
- [Google Scholar]
- Joint FAO/WHO. Expert committee on nutrition, 1970. Eighth report, food fortification, protein-calorie malnutrition, Geneva, Switzerland, 9–18 November 1970. 1971, World Health Organization: Geneva. https://apps.who.int/iris/handle/10665/40921.
- Kiharason, J.W., Isutsa1, D. K., Ngoda, P.N. 2017. Nutritive value of bakery products from wheat and pumpkin composite flour, G.J.B.B., 6 (1), 96-102.
- Effect of apple pomace powder addition on farinographic properties of wheat dough and biscuits quality. Chem. Pap.. 2014;68:1059-1065.
- [Google Scholar]
- Effect of replacement of wheat flour with pumpkin powder on textural and sensory qualities of biscuit. Int. Food Res. J.. 2013;20(2):587-591.
- [Google Scholar]
- Studies on development of instant pumpkin soup tablets and evaluation of storage stability. Indian J. Trad. Knowl.. 2021;20(2):486-491.
- [Google Scholar]
- Nutritional composition and antioxidant activity of pumpkin wastes. Int. J. Pharm. Chem. Biol. Sci.. 2016;6(3):336-344.
- [Google Scholar]
- Nutritional composition and antioxidant activity of pumpkin wastes. IJPCBS. 2016;6(3):336-344.
- [Google Scholar]
- Quantitative analysis of total phenolic content in adhatoda vasica nees extracts. Int. J. Pharm Tech Res.. 2009;2
- [Google Scholar]
- Moreira, T.R., 2006. Análise de perdas de mineraisemhortaliçassubmetidas a doismétodos de cocção(Monografia). Centro UniversitárioFranciscano, Santa Maria. Retrieved from http://www.nutricaoativa.com.br/arquivos/monografia3.pdf.
- Optimization of bread firmness, specific loaf volume and sensory acceptability of bread with soluble fiber and different water levels. J. Cereal Sci.. 2016;70(7):186-191.
- [Google Scholar]
- Carotenoid content in different varieties of pumpkins. J. Food Compos. Anal.. 2002;15:633-638.
- [Google Scholar]
- Comparisons of physicochemical properties and antioxidant activities among pumpkin (Cucurbita moschata L.) flour and isolated starches from fresh pumpkin or flour. Int. J. Food Sci. Technol.. 2017;52(11):2436-2444.
- [Google Scholar]
- Physicochemical and functional properties of peeled and unpeeled pumpkin flour. J. Food Sci.. 2009;74(7):S328-S333.
- [Google Scholar]
- Fiber from pumpkin (Cucurbita pepo L.) seeds and rinds: physico-chemical properties, antioxidant capacity and application as bakery product ingredients. Malaysian J. Nutr.. 2013;19(1):99-109.
- [Google Scholar]
- Physico-chemical and sensory evaluations of wheat bread with pumpkin (Cucurbita maxima) pulp incorporated. J. Agroaliment. Process. Technol.. 2014;20(1):26-32.
- [Google Scholar]
- Development of oat based-food formulation and quality. J. Agroaliment. Process. Technol.. 2015;21(3):261-266.
- [Google Scholar]
- Effects of osmotic pretreatment and frying conditions on quality and storage stability of vacuum-fried pumpkin chips. Int. J. Food Sci. Technol.. 2019;54(10):2963-2972.
- [Google Scholar]
- Utilization of pumpkin powder in bakery products. Songklanakarin J. Sci. Technol.. 2006;28(1):71-79.
- [Google Scholar]
- Effect of pretreatment and drying methods on quality of valueadded dried aonla (Emblica officinalis Gaertn) shreds. J. Food Sci. Technol.. 2011;48(1):45-52.
- [Google Scholar]
- Quintana, S.E., Marsiglia, R.M., Machacon, D., Torregroza, E., García-Zapateiro, L.A., 2018. Chemical composition and physicochemical properties of squash (Cucurbita moschata) cultivated in bolivar department (Colombia). Contemp. Eng. Sci. 11(21): 1003-1012. 10.12988/ces.2018.8384.
- Rahman, N.A.A., Razak, S.Z.A., Taip, L.A.L.F.S., Kamal, S.M.M., 2017. Response surface optimization for hot air-frying technique and its effects on the quality of sweet potato snack, 1-8.
- Effect of air-drying temperature on physico-chemical, powder properties and sorption characteristics of pumpkin powders. Int. Food Res. J.. 2016;23(3):962-972.
- [Google Scholar]
- Preparation of pumpkin pulp and peel flour and study their impact in the biscuit industry. J. Biol. Agric. Healthc.. 2020;10(6):25-33.
- [CrossRef] [Google Scholar]
- SAS Institute, 2011. The SAS system for windows: release 9.2. Cary: SAS Institute.
- Effect of pre-treatments on the proximate composition of pumpkin flour. Int. J. Innovat. Stud. Sci. Eng. Technol.. 2016;2(5):17-24.
- [Google Scholar]
- Physico-chemical and sensory evaluation of breads supplemented with pumpkin flour. ASEAN Food J.. 2007;14(2):123-130.
- [Google Scholar]
- Comparative study on the -carotene, -tocopherol and pectin values from three cultivars of pumpkin (Cucurbita maxima) World J. Dairy Food Sci.. 2015;10(2):132-140.
- [Google Scholar]
- Hypolipidaemic and hypoglycaemic properties of pumpkin polysaccharides. 3. Biotech.. 2017;7(3):159.
- [CrossRef] [Google Scholar]
- Physicochemical and functional properties of vegetable and cereal proteins as potential sources of novel food ingredients. Food Technol. Biotechnol.. 2015;53(3):269-277.
- [Google Scholar]
- Oat grain functional ingredient characterization. Food Biotechnol. Eng.. 2015;9:755-758.
- [Google Scholar]
- A microcolorimetric method for the determination of inorganic phosphorus. J. Biol. Chem.. 1953;202(2):675-685.
- [Google Scholar]
- Production of high-quality flour and the made biscuits from pumpkin. Int. J. Food Sci. Nutr.. 2018;3(5):157-166.
- [Google Scholar]
- Physicochemical and nutritional properties of spraydried pitaya fruit powder as natural colorant. J. Food Sci. Biotechnol.. 2012;21(3):675-682.
- [CrossRef] [Google Scholar]
- US Institute of Medicine., 2001. Dietary reference intakes for vitamin A, vitamin K, arsenic, boron, chromium, copper, iodine, iron, manganese, molybdenum, nickel, silicon, vanadium, and zinc. A report of the panel on micronutrients, subcommittees on upper reference levels of nutrients and of interpretation and use of dietary reference intakes, and the standing committee on the scientific evaluation of dietary reference intakes. Washington, DC: National Academy Press, Food and Nutrition Board.
- Free radical scavenging capacity and total phenolic contents in peel and fleshy crude extracts of selected vegetables. Pharmacogn. J.. 2019;11(6):1351-1358.
- [Google Scholar]
- Determination of flavonoids in Citrus grandis (Pomelo) peels and their inhibition activity on lipid peroxidation in fish tissue. Int. Food Res. J.. 2013;20:313-317.
- [Google Scholar]


