

Translate this page into:
The protective effect of Dogwood preparation on hepatic ischemia–reperfusion injury in mice by down-regulating PTGS2
⁎Corresponding author. lhswmg@sina.com (Hongsheng Liu)
-
Received: ,
Accepted: ,
This article was originally published by Elsevier and was migrated to Scientific Scholar after the change of Publisher.
Peer review under responsibility of King Saud University. Production and hosting by Elsevier.
Abstract
Hepatic ischemia - reperfusion injury (HIRI) is a major cause of postoperative complications and mortality after hepatobiliary surgery, but there is currently no effective treatment strategy. Dogwood is a valuable Chinese Medicine which helps to protect the liver. Our animal experiments showed that ethanol extract (DD) of Dogwood could significantly lower the levels of Aspartate aminotransferase (AST) and Alanine aminotransferase (ALT) in HIRI mice serum. The findings revealed that DD had protective effect against HIRI in mice. Furthermore, we used network pharmacology to screen 613 target genes corresponding to Loganin, Ursolic acid and Oleanolic acid of the main active components contained in DD and 1117 target genes corresponding to HIRI, with 87 common target genes among them. The STRING database was then used to generate a protein–protein interaction (PPI) dataset of 87 target genes, which was then imported into Cytoscape3.7.2 to generate the top 10 target genes using the MCC function of cytoHubba. Next, using the DAVID online database, 87 target genes were assigned to 35 KEGG pathways. Pathways in cancer had 17 target genes with the highest score. The top 10 target genes identified by MCC function were cross-referenced with 17 target genes identified by Pathways in cancer. HSP90AA1, MAPK3, PTGS2, MMP2, IL2, PPARG, MTOR and IL6 were identified as target genes. In the meantime, transcriptomic sequencing was performed, and a total of 165 differential genes between drug administration group and HIRI group were identified. At last PTGS2 is locked as the hub target gene of DD intervention in HIRI. Following that, immunohistochemistry and real-time fluorescence quantitative PCR were used to verify the results. The results showed that DD protected mice against HIRI by lowering the expression level of PTGS2. In conclusion, DD may protect the mice against HIRI by regulation of PTGS2 expression.
Keywords
Ethanol extract of Dogwood (DD)
Hepatic ischemia - reperfusion injury (HIRI)
PTGS2
Network pharmacology
RNA-seq

1 Introduction
Hepatic ischemia–reperfusion injury (HIRI) refers to the liver injuries caused by restoration of blood supply following a period of hepatic ischemia. HIRI is a two-phase process of ischemia-induced cell injury and reperfusion induced inflammatory reaction (Ding et al., 2022), which is unavoidable in liver transplantation, hepatectomy and other procedures, and is an major cause of early graft failure, tissue damage, organ rejection and even transplantation failure (Huang et al., 2022; Zhou et al., 2021). The mechanism of HIRI is complex, involving a variety of cells and pluralistic processes (Kan et al., 2018). Liver ischemia–reperfusion is a dynamic process. In the early stage of liver ischemia, the supply of sugar and oxygen is insufficient, ATP production is reduced, and cell metabolism is disrupted, which can directly cause hepatocyte injury (Shen et al., 2010). In the process of reperfusion, activated immune cells aggravate hepatocyte injury by releasing cytokines, chemokines and cell adhesion molecules (Abu-Amara et al., 2010). However, the mechanism of HIRI remains unknown, and there are no effective clinical prevention and treatment methods. As a result, it is critical to understand its mechanism of action and develop new drugs to treat HIRI.
The concept of “network pharmacology” was proposed by British pharmacologist Hopkins in 2007 (Hopkins, 2007), which clarified that the occurrence of human diseases is the result of the disruption in the dynamic balance of multi-gene, multi-protein and multi-pathway interactions in human body. Network pharmacology, unlike traditional pharmacological research strategies, does not study the interaction of a single disease, a single target and a single drug in isolation, but rather measures the regulatory effect of drugs on biomolecular networks from a systematic and holistic perspective, which is characterized by systematical, correlation and predictability (Li & Zhang, 2013). As a result, this research method has provided a significant turning point and hope for the research and development of traditional Chinese medicine.
Dogwood is a valuable traditional Chinese medicine, which tonifies the liver and kidneys. Many clinically commonly used Chinese patent medicines, such as “Liuwei Dihuang pill”, “Bawei Shenqi pill” and “Zuogui pill”, contain Dogwood. It can treat the clinical symptoms of waist and knee pain, kidney qi deficiency and dizziness by tonifying liver and kidney, tonifying kidney Qi and nourishing kidney Yin. The water extract of Dogwood with Loganin as the main active component has been shown in modern pharmacology to interfere with the development of diabetes mellitus by inhibiting cytokine-mediated apoptosis of β-cells, increasing cell viability and oxidative capacity, and enhancing the expression of activated T-cytokine 2 (NFATC2) (Sharp-Tawfik et al., 2019; Xu et al., 2021). The main active ingredient in the alcohol extract of dogwood is ursolic acid, which can regulate NF-κB and MAPK signaling pathways by inhibiting the binding of lipopolysaccharide (LPS) and Toll-like receptor 4 (TLR4) on immune cells, thereby improving colitis and playing an anti-inflammatory role (Jiang et al., 2016). Furthermore, Dogwood extract also has anti-tumor (Telang et al., 2019)), neuroprotective (Tian et al., 2020), anti-osteoporosis (Huang et al., 2021), immunomodulatory (Qu et al., 2019), anti-depression (Liu, Yang, & Zhang, 2020), antibacterial and insecticidal (Antolak et al., 2017) properties. Hence, given Dogwood’s extensive pharmacological effects in the treatment of a variety of difficult and complex clinical diseases, it is worthwhile to investigate its potential pharmacological effects and molecular mechanisms in other diseases.
In our study, the animal experiment of DD intervention in HIRI mice showed that (HIRI + DD) group could significantly reduce the level of AST and ALT in mice serum, with a significant difference compared with HIRI group (**P < 0.01), indicating that DD could effectively intervene the occurrence of HIRI in mice. Furthermore, we used bioinformation network pharmacology in conjunction with RNA-seq to further explore the potential mechanism of DD alleviating HIRI, in order to provide theoretical support for the clinical development of new drugs to treat HIRI. The overall flow chart of this study is shown in Fig. 1.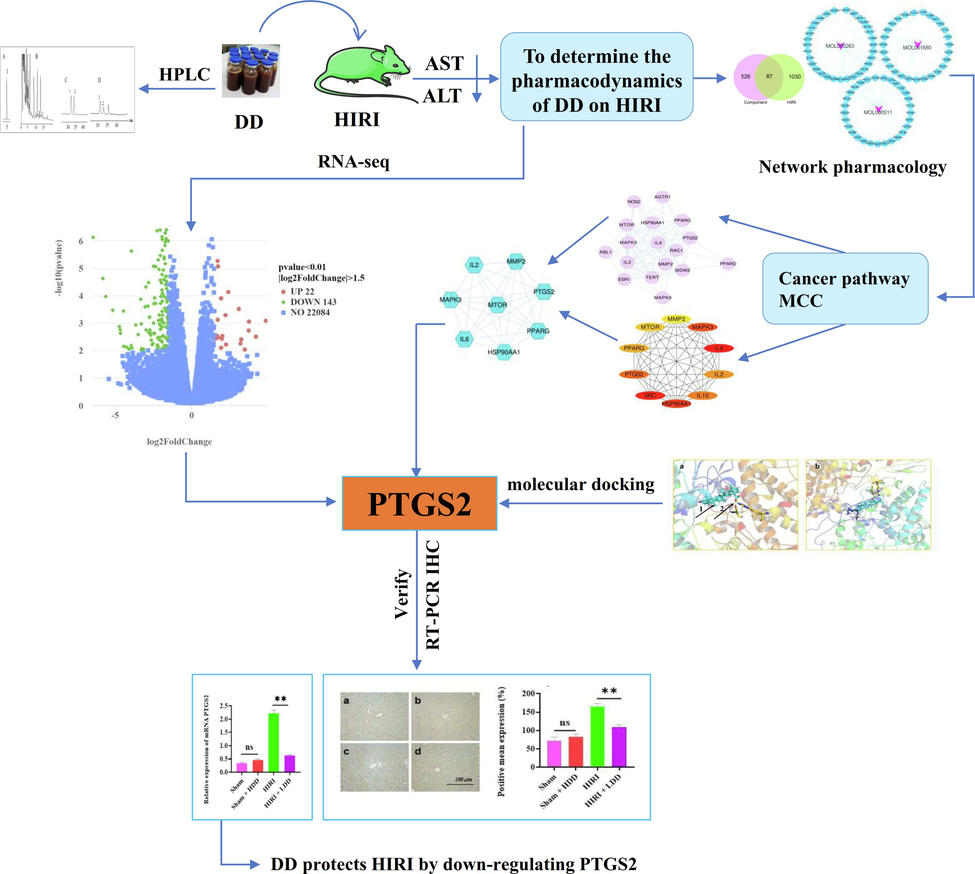
Flow chart of the project.
2 Materials and methods
2.1 Content determination by RP-HPLC
2.1.1 Determination of Loganin content in DD preparation
DD preparation was provided by the Key Laboratory of Critical Care and Emergency Medicine, National Health Commission (Tianjin, China).
The determination was performed on Zorbax SB-C18 column (150 mm × 4.6 mm, 5 μm), mobile phase consisted of acetonitrile (Chromatographic pure German Merck Company) −0.1 % phosphoric acid aqueous solution (Chromatographic Pure Tianjin Guangfu Fine Chemical Institute), gradient elution: 0–10 min, 14 acetonitrile to 16.5 % acetonitrile, UV wavelength 236 nm, injection 3 μl, volume flow 1.0 mL/min, column temperature 30 ℃.
2.1.2 Determination of Ursolic acid and Oleanolic acid in DD preparation
The determination was performed on Zorbax SB-C18 column (150 mm × 4.6 mm, 5 μm) with mobile phase consisted of acetonitrile-0.1 % phosphoric acid aqueous solution (adding 2 mmol/L γ-cyclodextrin), γ-cyclodextrin (Shanghai Yuanye Biotechnology Co., LTD.), gradient elution: 0––42 min, 52 % acetonitrile to 70 % acetonitrile, UV wavelength 210 nm, injection 3 μl, volume flow 1.0 mL/min, column temperature 30 ℃.
2.2 Animal experiment
2.2.1 Animal and drug therapy
The animals used in the experiment were provided by the Institute of Medical Laboratory Animals, Chinese Academy of Medical Sciences, License number: SCXK (Beijing) 2014–––0004. Animals were male C57BL mice aged 5–––6 weeks, weighing 19–––22 g, housed in an air-conditioned SPF environment. The temperature was controlled at 22.5 ± 1.0 °C, the humidity was controlled at 55 ± 10 °C, and the mice could eat and drink at will. The DD preparation were administered by gavage at high and low doses of 100 mg/kg and 50 mg/kg (crude drug/mouse body weight).
2.2.2 Animal surgical procedure
Thirty-five mice were randomly divided into 5 groups, 7 mice in each group: Sham operation group (Sham), sham operation + DD high-dose group (Sham + HDD), HIRI model group, model group + DD low-dose group (HIRI + LDD), and model group + DD high-dose group (HIRI + HDD). Among them, (Sham + HDD), (HIRI + LDD) and (HIRI + HDD) were given DD by gavage (ig) once a day for 7 days, and the other Sham and HIRI model groups were given the same amount of normal saline ig. One hour after the last administration of preconditioning, the mice were anesthetized with ip (by intraperitoneally) pentobarbital sodium (40 ng/g). The abdominal cavity was opened in the middle of the upper abdomen, the liver was carefully exposed, and the hilar ligament was dissociated. In HIRI, (HIRI + LDD) and (HIRI + HDD) groups, the left lobe and middle lobe of liver were clipped to block blood flow, and the vascular clamp was released 1 h later to restore blood flow (in Sham and (Sham + HDD) groups, only the hilum was free without blocking blood flow). After 6 h of reperfusion, the eyeball was removed for blood collection. Part of the liver tissue was isolated and stored at −80 ℃, and the other part was stored in 10 % formalin.
2.2.3 Serum biochemical analysis
Firstly, the collected mouse blood was left at room temperature for 60 min and centrifuged at 3 000 r/min for 20 min to separate the serum. Then, the levels of AST and ALT in serum of mice were determined by the automatic clinical biochemical analyzer (Sysmex CHEMIX-180) of Tianjin First Central Hospital, China.
2.2.4 Histopathological examination of liver
The liver tissues of each experimental group were removed from 10 % formalin for histopathological examination. The samples were first fixed in 4 % paraformaldehyde buffer and then embedded in paraffin. The samples were then sliced into 5 μm sections, dewaxed with xylene and ethanol, stained with hematoxylin and eosin (HE), and dehydrated. Finally, the sections were examined with a microscope and histological changes were observed at a randomly selected magnification of 200.
2.3 Acquisition of hub target genes by DD intervention in HIRI
2.3.1 Construction of active ingredient-HIRI target gene network
It is known from the literature that Loganin, Ursolic acid and Oleanolic acid are the main active components of DD that play a good pharmacological role (Czerwinska et al., 2021; Yang et al., 2019; Guo et al., 2021; Hou, Wei, & Liu, 2021). Therefore, we carried out studies on these three components of DD. Firstly, the structures of small molecule compounds related to Loganin, Ursolic acid and Oleanolic acid in DD were obtained from the systematic pharmacology database and analysis platform TCMSP (https://tcmspw.com./tcmsp.php). Then, Pharm Mapper (https://lialb-ecust.cn/pharmmapper/) and Swiss Target Prediction (https://www.swisstaget prediction.ch/) database were used to predict their corresponding target genes. The obtained target genes were merged and duplicated removed and unified in UniProt service platform (https://www.uniprot.org/), and finally expressed as UniProt ID to establish the target database of three active components of DD. Next, the target genes related to HIRI were predicted with the keyword “hepatic ischemia reperfusion injury” on the GeneCards database (https://www.genecards.org/), and then transformed into positive sum on the UniProt service platform, and finally expressed as UniProt ID. A total of 87 intersection target genes of DD component and HIRI were collected, and Cytoscape3.7.2 software was used to map the active component-HIRI disease target gene visualization network.
2.3.2 Protein-protein interactions of intersection target genes
The gene symbols of 87 intersection target genes were imported into the STRING service platform (https://string-db.org/), and the species was limited to homo sapiens. The protein–protein interaction network (PPI) dataset was obtained. Then the PPI dataset was imported into Cytoscape3.7.2 and the MCC function in cytoHubba was used to obtain the top 10 key target genes.
2.3.3 KEGG pathway analysis
KEGG analysis of 87 gene symbol intersection target genes was performed using the DAVID (https://david.ncifcrf.gov/) online database with OFFICIAL_GENE SYMBOL as the Select Identifier and species set to Homo sapiens. KEGG enrichment dataset was obtained with P < 0.01 and FDR < 0.05 as screening conditions.
2.3.4 DD interferes with the acquisition of preliminary key target genes in HIRI
The intersection of target genes contained in the most important Pathways in cancer of the above KEGG and the top 10 important target genes obtained through MCC function were considered as preliminary key target genes for DD intervention in HIRI.
2.3.5 The differential genes of DD in HIRI were screened by RNA-seq
Three samples (n = 3) from each of the above three experimental groups (Sham, HIRI, HIRI + LDD) were selected to screen out the differential genes among the groups by RNA-seq experiment.
2.3.6 The final hub target genes of DD intervention in HIRI were determined by multi-omics
The screening conditions of |log2(Fold Change) | >= 1.5 & P value <= 0.05 were set for the differential target genes obtained by RNA-seq (HIRI + LDD) vs HIRI, and the intersection of the obtained target genes and the key target genes obtained in the above was the final hub target gene of DD intervention in HIRI.
2.4 Validation of hub target genes
2.4.1 To demonstrate the binding status of protein receptor and ligand by molecular docking
PDB (https://www.rcsb.org/) and PubChem (https://pubchem.ncbi.nlm.nih.gov/) databases were used to download the 3D structure of hub target gene obtained by multi-omics method and the SPF structure of small molecule compound corresponding to DD, and Dock Thor (https://dockthor.lncc.br/v2/) online tool was used for molecular docking. To further reveal the binding status of protein receptor and small molecule compound ligand.
2.4.2 The target genes of hub were verified by immunohistochemistry
First of all, the mouse liver tissue was sequentially sliced, dewaxed into water, and then put into the microwave oven for antigen repair. Then the sections were incubated in 3 % hydrogen peroxide solution for 25 min at room temperature in the dark to block endogenous peroxidase. Then, 3 % BSA was added drop by drop and blocked at room temperature for 30 min. After gently shaking off the blocking solution, the sections were added with PTGS2 (1:200) antibody diluted in PBS and incubated overnight at 4 °C. On the second day, the tissues were covered with HRP labeled secondary antibodies corresponding to the primary antibodies and incubated for 50 min at room temperature. After the sections were washed with PBS, freshly prepared DAB color developing solution was added inside the circle, and the color developing time was controlled under the microscope. The positive color was brown and yellow, and the sections were washed with tap water to stop color developing. Finally, the nuclei were counterstained with hematoxylin and dehydrated and sealed.
2.4.3 The target genes of hub were verified by real-time fluorescent PCR
Firstly, Trizol reagent (Invitgen, USA) was used to extract total RNA(n = 3) from liver tissues of each experimental group. Then, cDNA was obtained by reverse transcription using RT Easy TM II (Foregene, Chengdu, China) kit. Reverse transcription polymerase chain reaction (RT-PCR) and SYBR Green qPCR Master Mix (GlpBio, USA) were used to quantify gene expression levels. Primer information is shown in Table 1 and reaction system is shown in Table 2.
Gene
Primers
Primer sequence (5′-3′)
Segment length (bp)
PTGS2
forwards
TACCCTCCTCACACATCCCTCG
133
reverse
CCTGCTTGAGTATGTCGCAC
GAPDH
forwards
CCTTCATTGACCTCAACTACATGG
135
reverse
CTCGCTCCTGGAAGATGGTG
Component
Final Con.
Vol/1rxns
2 × Real-time PCR Master Mix
1×
10 μl
Primer set (5 μM)
0.15 μM
0.6 μl
ROX Calibrating dye (50 × )
1×
0.4 μl
rTaq DNA polymerase (5U/μl)
0.05U
0.2 μl
Template
2–8 μl
DdH2O
To 20 μl
2.5 Data analysis
All data were analyzed by GraphPad 5.0 software. The experimental values of each group were analyzed by one-way ANOVA, and the differences between groups were analyzed by Tukey's post-hoc statistics and expressed as mean ± standard error ( ± s) (n = 3). *P < 0.05 was considered statistically significant.
3 Result
3.1 RP-HPLC detect results
Using the peak area integral value (A) and mass concentration (C) for linear regression, Loganin's regression equation was obtained as A = 4.9426C + 36.7299, correlation coefficient (r) = 0.99934, and the linear range was 3.906 ∼ 250 mg/L. The lowest detection mass concentration was 15.6 μg/L. The retention time of Loganin was 4.337 min. The measured content of Loganin was 2.502 mg/mL (n = 6), as shown in Fig. 2 (A-B).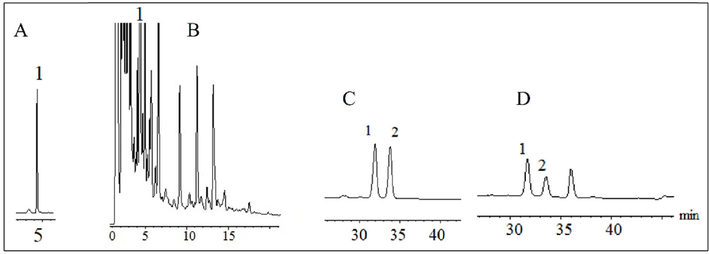
Three components in DD preparation were determined by RP-HPLC.
Using the peak area integral (A) mass concentration (C) for linear regression, the regression equation of Ursolic acid was obtained as A = 461.8633C-0.3661, correlation coefficient (r) = 0.99999, the linear range was 10.156–325 mg/L, and the minimum detection mass concentration was 2.96 mg/L. The retention time of ursolic acid was 33.804 min.
Using the peak area integral (A) mass concentration (C) for linear regression, the regression equation of oleanolic acid was obtained as A = 671.9645C-2.0901, correlation coefficient (r) = 0.99999, the linear range was 9.375–320 mg/L, and the minimum detected mass concentration was 2.69 mg/L. The retention time of oleanolic acid was 31.935 min. The contents of Ursolic acid and Oleanolic acid were 0.133 mg/mL and 0.156 mg/mL respectively (n = 6), as shown in Fig. 2 (C-D).
In Figure A, “1″ is the standard curve of Loganin. In Figure B, ”1″ is the chromatographic peak of Loganin in DD preparation samples. In Figure C, “1″ and ”2″ are the standard curves of Oleanolic acid and Ursolic acid, respectively. In Figure D, “1″ and ”2″ are the chromatographic peaks of Oleanolic acid and Ursolic acid in DD preparation samples, respectively.
3.2 Serum biochemistry and liver tissue HE detection results
3.2.1 Serum biochemistry detection results
After the serum samples of the 5 groups of animal experiments were detected by automatic clinical biochemical analyzer, compared with the Sham group, the serum levels of ALT and AST in the HIRI model group were significantly increased (**P<0.01), indicating that the model was successfully established. Compared with the HIRI model group, the serum levels of ALT and AST in (HIRI + LDD) and (HIRI + HDD) groups were significantly decreased (**P < 0.01), indicating that DD had a protective effect on HIRI mice. Sham and (Sham + HDD) groups were compared, the changes of ALT and AST in serum of mice were not statistically significant (P > 0.05), indicating that DD would not cause damage to the liver tissue of normal mice, indicating the safety of DD. There was no significant difference between high and low dose of DD (HIRI + LDD) and (HIRI + HDD) (P > 0.05). Showed that A dose range of 50 to 100 mg/kg (drug/ body weight) could protect against HIRI in mice, but there was no dose dependence, as shown in Fig. 3 (A, B). In this project, the (HIRI + LDD) group was selected to complete the subsequent immunohistochemical (IHC) and RT-PCR experimental verification.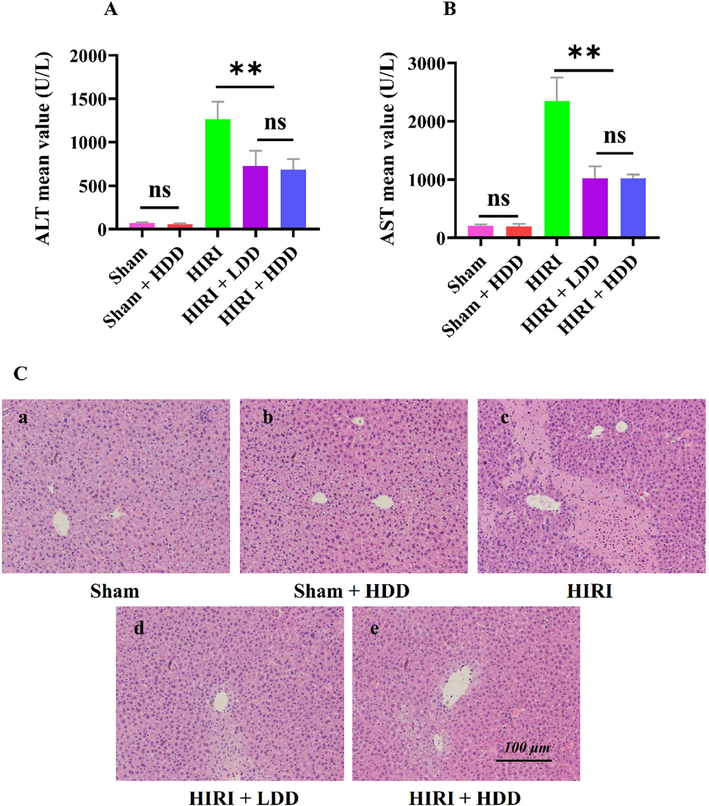
Effect of DD on AST, ALT and HE in HIRI mice.
3.2.2 Liver tissue HE detection results
Liver tissue sections of mice in each group were selected for HE staining. The experimental results showed that compared with Sham group, liver tissue of mice in HIRI group showed different degrees of swelling/necrosis, steatosis, inflammatory cell infiltration, etc. Compared with the HIRI group, the hepatocytes in the (HIRI + LDD) group were round and full, and no obvious inflammatory changes were observed. It can be seen that the pathological changes of liver tissues were reversed and improved, indicating that DD had a protective effect on HIRI in mice. The liver tissue of mice in Sham and (Sham + LDD) groups basically did not change, indicating that DD basically did not cause damage to the liver tissue of normal mice, as shown in Fig. 3 (C).
The results in A-B showed that compared with the Sham group, the serum levels of ALT and AST in the HIRI model group were significantly increased (**P<0.01), indicating that the model was successfully established. Compared with the HIRI model group, the serum levels of ALT and AST in (HIRI + LDD) and (HIRI + HDD) groups were significantly decreased (**P<0.01), indicating that DD had a protective effect on HIRI mice. The changes of ALT and AST in serum of mice in Sham and (Sham + HDD) groups were not statistically significant (P > 0.05), indicating that DD would not cause damage to normal mouse liver tissue, indicating the safety of DD. There was no significant difference between (HIRI + LDD) and (HIRI + HDD) (P > 0.05). The results showed that the dose range of 20 to 40 mg/g (drug/mouse body weight) could protect against HIRI in mice, but there was no dose dependence.
The results of HE staining are shown in the C. C-a showed that the liver tissue of mice was intact. C-b shows that most of the mouse liver is intact. C-c shows that the liver tissue showed swelling/necrosis, steatosis and inflammatory cell infiltration in different degrees. C-d and C-e indicated that the pathological status of mouse liver tissue was improved compared with C-c, but there was no significant difference between them. In conclusion, HE detection results showed that DD had a protective effect on HIRI in mice. The ruler of the C diagram is 100 μm and the magnification is 100 times.
3.2.3 Analysis of active ingredient-HIRI target gene network results
The structures of Loganin, Ursolic acid and Oleanolic acid contained in DD were downloaded from TCMSP database and uploaded to Pharm Mapper service platform in MOL2 format for target prediction. SMILES of Loganin, Ursolic acid and Oleanolic acid containing three chemical components of DD were uploaded to the Swiss Target Prediction database platform for target prediction. Then, the target sites were collected, sorted out and expressed as UniProt ID after removing the duplicates, and a total of 613 target sites of DD were finally obtained.
Using “hepatic ischemia reperfusion injury” as the key word, 1117 target genes were obtained in GeneCards database and represented by UniProt ID. A total of 87 common target genes were obtained by intersection with the 613 component prediction target genes obtained above, and then visualized by Venn diagram software (https://bioinformatics.psb.ugent.be/webtools/Venn/). Pink represents component target genes and green represents HIRI target genes, as shown in Fig. 4 (A). Table 3. Cytoscape 3.7.2 software was used to draw a viewable composition-HIRI network mapping. In the figure, pink nodes represent DD small molecule compounds, blue nodes represent HIRI-related target genes, and green lines represent intersecting lines between components and disease target genes, as shown in Fig. 4 (B).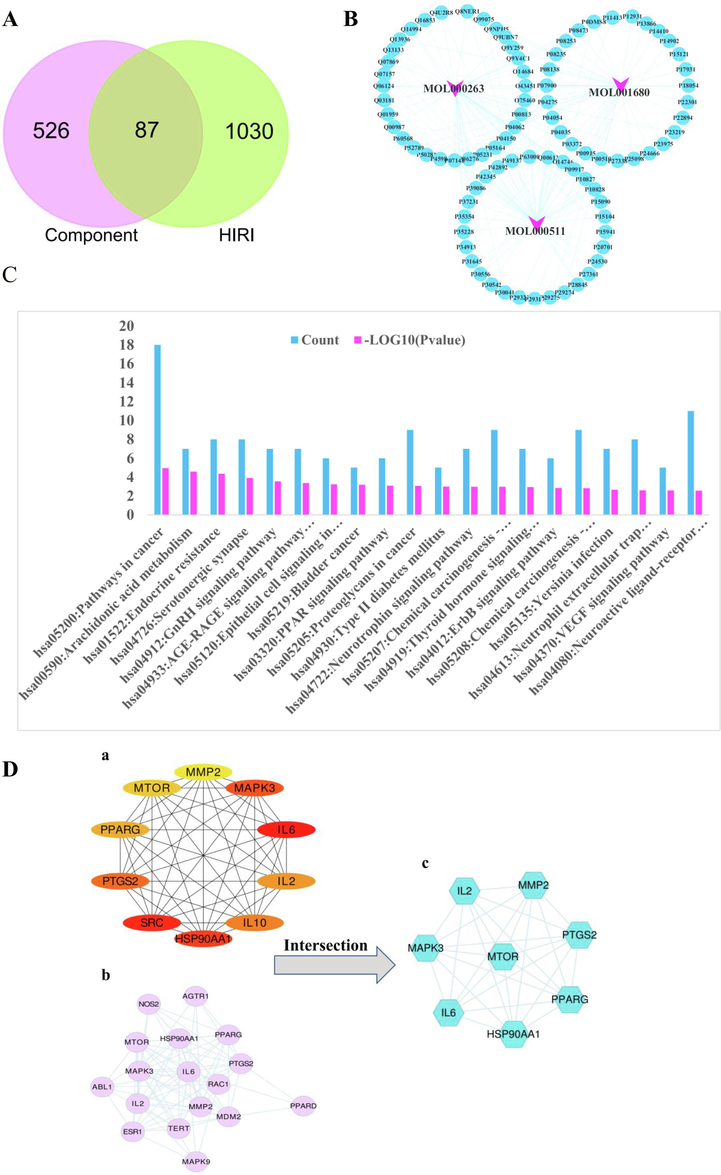
Results of network pharmacological analysis of this project.
Mol ID
Target name
Gene symbol
Uniprot
MOL001680
Lysine-specific demethylase 3A
KDM3A
Q9Y4C1
MOL001680
Choline/ethanolamine kinase
CHKB
Q9Y259
MOL000263
Histone deacetylase 6
HDAC6
Q9UBN7
MOL001680
NADPH oxidase 4
NOX4
Q9NPH5
MOL000511
Proheparin-binding EGF-like growth factor
HBEGF
Q99075
MOL000263
Vanilloid receptor
TRPV1
Q8NER1
MOL000263
Solute carrier family 22 member 6 (by homology)
SLC22A6
Q4U2R8
MOL000263
Membrane primary amine oxidase
AOC3
Q16853
MOL000263
Nuclear receptor subfamily 1 group I member 3
NR1I3
Q14994
MOL001680
Voltage-dependent L-type calcium channel subunit alpha-1C
CACNA1C
Q13936
MOL000263
LXR-alpha
NR1H3
Q13133
MOL000263
Peroxisome proliferator-activated receptor alpha
PPARA
Q07869
MOL000511
Tight junction protein ZO-1
TJP1
Q07157
MOL000263
Protein-tyrosine phosphatase 2C
PTPN11
Q06124
MOL000263
Peroxisome proliferator-activated receptor delta
PPARD
Q03181
MOL000263
Dopamine transporter
SLC6A3
Q01959
MOL000263
p53-binding protein Mdm-2
MDM2
Q00987
MOL000263
Heat shock factor protein 1
HSF1
Q00613
MOL000511
Ras-related C3 botulinum toxin substrate 1
RAC1
P63000
MOL001680
Interleukin-2
IL2
P60568
MOL001680
Hexokinase type II
HK2
P52789
MOL001680
Matrix metalloproteinase 14
MMP14
P50281
MOL000263
MAP kinase-activated protein kinase 2
MAPKAPK2
P49137
MOL001680
Mitogen-activated protein kinase 9
MAPK9
P45984
MOL001680
Endothelin-converting enzyme 1
ECE1
P42892
MOL000511
FKBP12-rapamycin complex-associated protein
MTOR
P42345
MOL000263
Glutamate receptor ionotropic kainate 1
GRIK1
P39086
MOL000263
Peroxisome proliferator-activated receptor gamma
PPARG
P37231
MOL000263
Cyclooxygenase-2
PTGS2
P35354
MOL000263
Nitric oxide synthase, inducible
NOS2
P35228
MOL001680
Epoxide hydratase
EPHX2
P34913
MOL000511
Serotonin transporter
SLC6A4
P31645
MOL000263
Type-1 angiotensin II receptor
AGTR1
P30556
MOL001680
Adenosine A1 receptor
ADORA1
P30542
MOL000263
Peroxiredoxin-6
PRDX6
P30041
MOL001680
Ephrin type-B receptor 2
EPHB2
P29323
MOL001680
Ephrin type-A receptor 2
EPHA2
P29317
MOL001680
Adenosine A2b receptor
ADORA2B
P29275
MOL001680
Adenosine A2a receptor
ADORA2A
P29274
MOL000263
11-beta-hydroxysteroid dehydrogenase 1
HSD11B1
P28845
MOL000263
MAP kinase ERK1
MAPK3
P27361
MOL000511
Amine oxidase [flavin-containing] B
MAOB
P27338
MOL001680
Beta-adrenergic receptor kinase 1
GRK2
P25098
MOL000263
Low molecular weight phosphotyrosine protein phosphatase
ACP1
P24666
MOL000511
Endothelin receptor ET-B
EDNRB
P24530
MOL001680
Norepinephrine transporter
SLC6A2
P23975
MOL000263
Cyclooxygenase-1
PTGS1
P23219
MOL001680
Matrix metalloproteinase 8
MMP8
P22894
MOL001680
Interleukin-10
IL10
P22301
MOL000511
Leukocyte adhesion glycoprotein LFA-1 alpha
ITGAL
P20701
MOL000263
Arachidonate 12-lipoxygenase, 12S-type
ALOX12
P18054
MOL001680
Galectin-3
LGALS3
P17931
MOL000263
Mucin-1
MUC1
P15941
MOL001680
Aldose reductase (by homology)
AKR1B1
P15121
MOL000263
Glutamine synthetase
GLUL
P15104
MOL000263
Fatty acid binding protein adipocyte
FABP4
P15090
MOL000511
Indoleamine 2,3-dioxygenase
IDO1
P14902
MOL001680
Sucrase-isomaltase
SI
P14410
MOL001680
Sodium/glucose cotransporter 1
SLC5A1
P13866
MOL001680
Tyrosine-protein kinase SRC
SRC
P12931
MOL000263
Glucose-6-phosphate 1-dehydrogenase
G6PD
P11413
MOL000263
Thyroid hormone receptor beta-1
THRB
P10828
MOL000263
Thyroid hormone receptor alpha
THRA
P10827
MOL000263
Adenosine A3 receptor
ADORA3
P0DMS8
MOL000263
Arachidonate 5-lipoxygenase
ALOX5
P09917
MOL001680
Neprilysin (by homology)
MME
P08473
MOL000263
Matrix metalloproteinase 2
MMP2
P08253
MOL000263
Mineralocorticoid receptor
NR3C2
P08235
MOL001680
Low affinity neurotrophin receptor p75NTR
NGFR
P08138
MOL001680
Heat shock protein HSP 90-alpha
HSP90AA1
P07900
MOL000263
Fatty acid-binding protein, liver
FABP1
P07148
MOL000263
Butyrylcholinesterase
BCHE
P06276
MOL000263
Interleukin-6
IL6
P05231
MOL000511
Myeloperoxidase
MPO
P05164
MOL001680
von Willebrand factor
VWF
P04275
MOL000263
Glucocorticoid receptor
NR3C1
P04150
MOL001680
Beta-glucocerebrosidase
GBA
P04062
MOL000263
Phospholipase A2 group 1B
PLA2G1B
P04054
MOL000263
HMG-CoA reductase
HMGCR
P04035
MOL000263
Estrogen receptor alpha
ESR1
P03372
MOL001680
Carbonic anhydrase I
CA1
P00915
MOL001680
Adenosine deaminase
ADA
P00813
MOL001680
Tyrosine-protein kinase ABL
ABL1
P00519
MOL001680
Serine/threonine-protein kinase/endoribonuclease IRE1
ERN1
O75460
MOL001680
Maltase-glucoamylase
MGAM
O43451
MOL000263
Telomerase reverse transcriptase
TERT
O14746
MOL000263
Prostaglandin E synthase
PTGES
O14684
3.3 Acquisition of hub target genes
3.3.1 Preliminary key target genes were obtained
The PPI dataset of 87 intersection target genes obtained from STRING database was imported into Cytoscape3.7.2 software, and the MCC function in cytoHubba was used to obtain the top 10 Hub target genes. They were MAPK3 (P27361), PTGS2 (P35354), PPARG (P37231), HSP90AA1 (P07900), IL6 (P05231), SRC (P22301), IL2 (P60568), MPO (P05164), MTOR (P42345), MMP2 (P08253), see Fig. 4 (D-a).
A total of 35 KEGG pathways were obtained by using DAVID online database with *P < 0.01 and *FDR < 0.05 as screening conditions, of which only 20 pathways were shown in this study, as shown in Fig. 4 (C). The Pathways in cancer with the best scores had 17 target genes, they were MAPK3 (P27361), PTGS2 (P35354), PPARG (P37231), HSP90AA1 (P07900), IL6 (P05231), NOS2 (P35228), IL2 (P60568), AGTR1 (P30556), RAC1 (P63000), PPARD (Q03181), MDM2 (Q00987), MTOR (P42345), NOS2 (P35228), ESR1(P03372), MAPK9 (P45984), ABL1 (P00519), TERT (O14746), see Fig. 4 (D-b).
The intersection target genes contained in Pathways in cancer and MCC function were obtained as HSP90AA1, MAPK3, PTGS2, MMP2, IL2, PPARG, MTOR and IL6 respectively, which were the preliminary key target genes of DD intervention in HIRI, as shown in Fig. 4 (D-c).
The pink nodes in A represents the number of DD component target genes, namely 613. The green nodes represent the number of HIRI target genes, which is 1117. The intersection target genes of HIRI were 87.
B is the mapping map of DD component-HIRI network. In the figure, pink nodes represent DD small molecule compounds, blue nodes represent HIRI-related target genes, and light blue lines represent intersecting lines between components and disease target genes.
C is Schematic diagram of KEGG pathway of 87 intersection target genes. As shown in the figure, Pathways in cancer are one of the most critical pathways according to the screening criteria of *P < 0.01 and *FDR < 0.05.
D is schematic diagram of preliminary screening of key target genes for DD intervention in HIRI.
3.3.2 Results of RNA-seq experiments
First, the original data obtained by sequencing was filtered, and clean reads were obtained after error rate check and GC content distribution check. Finally, the gene expression value (FPKM) of each sample was obtained. Then, the FPKM of each sample was analyzed by PCA to evaluate the differences between groups and sample duplication within groups, as shown in Fig. 5 (A). As shown in the figure, the data of each group achieved the purpose of sample dispersion between groups and sample aggregation within groups. Next, we normalized the original read count, mainly to correct for sequencing depth. Then, the data were statistically analyzed by hypothesis test probability (Pvalue) and FDR multiple hypothesis test correction. In this experiment, the software DESeq2 (Love, Huber, & Anders, 2014) was used to obtain the differential genes of (HIRI + LDD) vs HIRI. After setting the screening conditions of |log2(Fold Change) | >= 1.5 & P value <= 0.05, 22 up-regulated genes and 143 down-regulated genes were obtained, as shown in Fig. 5 (B) volcano diagram.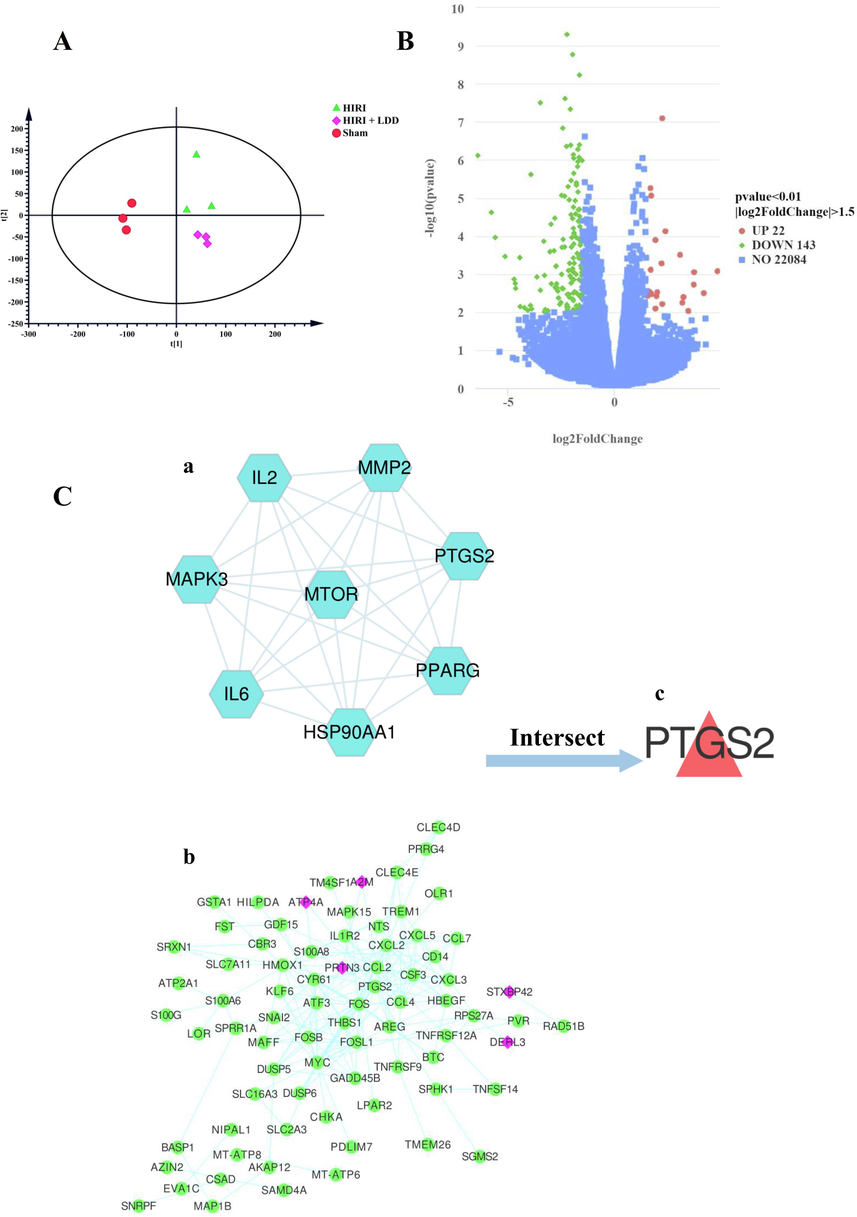
The final determination of hub gene in this study.
3.3.3 DD intervention HIRI final hub target gene determination
The 165 differential target genes obtained from (HIRI + LDD) vs HIRI in RNA-seq were used to obtain a dataset containing 78 target genes (including 5 green target genes were up-regulated and 73 pink target genes were down-regulated) through protein–protein interaction using STRING database, as shown in Fig. 5 (C- b). Meanwhile, the experimental data of 165 differential genes in HIRI vs Sham group were summarized, as shown in Table 4 and Table 5. Then, it was crossed with the 8 preliminary key target genes obtained in above (see Fig. 5 C-a) to obtain PTGS2, that is, PTGS2 may be the hub target gene of DD intervention in HIRI, see Fig. 5 (C-c). In the table, HD = HIRI + LDD, H = HIRI, S = Sham.
group
log2FoldChange
pvalue
gene name
up or down
HDvsH
1.636781163
0.002917899
Stxbp4
up
HvsS
−1.937616999
0.001047489
Stxbp4
down
HDvsH
1.729648328
0.003349596
Mterf2
up
HvsS
−2.305793891
0.001775362
Mterf2
down
HDvsH
1.550223458
0.003756678
Gnat2
up
HvsS
−1.671977641
0.02275282
Gnat2
down
HDvsH
3.190455441
0.005641382
Zfp85os
up
HDvsH
1.923290302
0.000127094
Zbtb7c
up
HDvsH
2.207308841
0.000522752
Unc79
up
HDvsH
3.079834226
0.00031023
Prtn3
up
HDvsH
3.470032278
0.00928945
Ppp1r26
up
HDvsH
2.006125866
0.002974097
mt-Ta
up
HDvsH
1.694793104
0.000769537
Gtpbp4-ps1
up
HDvsH
3.242713814
0.004000833
Gm5597
up
HDvsH
1.974808281
0.003803716
Gm48882
up
HDvsH
1.690510774
5.52E-06
Gm44787
up
HDvsH
2.387186482
7.50E-05
Gm24196
up
HDvsH
4.843391911
0.000834525
Gm16121
up
HDvsH
3.743437953
0.000895242
Gm15348
up
HDvsH
4.197465606
0.003172184
Gm14226
up
HDvsH
2.241144876
8.03E-08
Gm10309
up
HDvsH
1.725857929
8.63E-06
Derl3
up
HDvsH
2.244144775
0.006166227
B430219N15Rik
up
HDvsH
1.921962132
0.008094221
Atp4a
up
HDvsH
3.726967659
0.00189938
A2m
up
group
log2FoldChange
pvalue
gene name
up or down
HDvsH
−1.680075979
1.680075979
Zfas1
down
HvsS
1.127925079
0.01478025
Zfas1
up
HDvsH
−1.52335009
1.52335009
Trem1
down
HvsS
6.951826095
8.02E-10
Trem1
up
HDvsH
−1.660649477
1.660649477
Tox
down
HvsS
2.01487306
1.79E-06
Tox
up
HDvsH
−1.747672392
1.747672392
Tnfsf14
down
HvsS
4.49585254
1.66E-10
Tnfsf14
up
HDvsH
−2.214311036
2.214311036
Tnfrsf9
down
HvsS
4.418255907
0.000101339
Tnfrsf9
up
HDvsH
−1.789790227
1.789790227
Tnfrsf12a
down
HvsS
3.225317847
2.10E-09
Tnfrsf12a
up
HDvsH
−1.522623865
1.522623865
Tm4sf1
down
HvsS
0.818505066
0.021470426
Tm4sf1
up
HDvsH
−2.049299996
2.049299996
Thbs1
down
HvsS
5.08089515
8.88E-31
Thbs1
up
HDvsH
−2.435283146
2.435283146
Stc1
down
HvsS
5.434212809
2.06E-10
Stc1
up
HDvsH
−1.986500177
1.986500177
Srxn1
down
HvsS
2.487765034
8.83E-12
Srxn1
up
HDvsH
−1.646048585
1.646048585
Srgn
down
HvsS
2.657167014
1.50E-12
Srgn
up
HDvsH
−3.043728218
3.043728218
Sprr1a
down
HvsS
3.840240659
6.94E-07
Sprr1a
up
HDvsH
−2.085614988
2.085614988
Sphk1
down
HvsS
3.492304421
3.14E-10
Sphk1
up
HDvsH
−1.978368125
1.978368125
Smim3
down
HvsS
2.023639664
0.000773235
Smim3
up
HDvsH
−1.935910265
1.935910265
Slc7a11
down
HvsS
5.471999827
4.04E-10
Slc7a11
up
HDvsH
−1.556042743
1.556042743
Slc2a3
down
HvsS
2.16003133
6.30E-06
Slc2a3
up
HDvsH
−1.590965504
1.590965504
Slc16a3
down
HvsS
2.741425443
5.33E-07
Slc16a3
up
HDvsH
−3.47879994
3.47879994
Sec1
down
HvsS
5.777176033
0.000124294
Sec1
up
HDvsH
−1.726046973
1.726046973
Samd4
down
HvsS
1.178698222
0.00360258
Samd4
up
HDvsH
−1.511923451
1.511923451
S100a8
down
HvsS
5.319941887
3.05E-22
S100a8
up
HDvsH
−1.732526404
1.732526404
Rps27a
down
HvsS
1.91596588
7.51E-07
Rps27a
up
HDvsH
−1.668696849
1.668696849
Rell1
down
HvsS
2.25474854
2.59E-06
Rell1
up
HDvsH
−2.105566989
2.105566989
Ramp3
down
HvsS
4.43906427
1.46E-08
Ramp3
up
HDvsH
−1.987248631
1.987248631
Ptgs2
down
HvsS
3.83776213
9.95E-05
Ptgs2
up
HDvsH
−1.696131176
1.696131176
Prrg4
down
HvsS
3.783229293
6.10E-10
Prrg4
up
HDvsH
−2.793628827
2.793628827
Prr7
down
HvsS
2.051402427
0.018254058
Prr7
up
HDvsH
−1.942069632
1.942069632
Pi15
down
HvsS
3.542147843
1.42E-05
Pi15
up
HDvsH
−2.462977495
2.462977495
Olr1
down
HvsS
5.358877337
8.35E-06
Olr1
up
HDvsH
−3.959804938
3.959804938
Nts
down
HvsS
4.92221776
0.00339107
Nts
up
HDvsH
−1.863572597
1.863572597
Myc
down
HvsS
2.995061615
2.38E-09
Myc
up
HDvsH
−6.434085359
6.434085359
Mup-ps21
down
HvsS
6.548114588
1.23E-09
Mup-ps21
up
HDvsH
−1.508894663
1.508894663
Mir17hg
down
HvsS
1.365040578
0.028072298
Mir17hg
up
HDvsH
−2.475319088
2.475319088
Map1b
down
HvsS
2.173820679
0.012557619
Map1b
up
HDvsH
−1.912619981
1.912619981
Maff
down
HvsS
2.728054166
1.20E-08
Maff
up
HDvsH
−2.640140019
2.640140019
Klrb1b
down
HvsS
2.827653758
0.006721627
Klrb1b
up
HDvsH
−1.740646871
1.740646871
Klf6
down
HvsS
3.217449747
4.84E-15
Klf6
up
HDvsH
−2.343659526
2.343659526
Kcne4
down
HvsS
3.547599429
1.36E-07
Kcne4
up
HDvsH
−1.923344257
1.923344257
Il1r2
down
HvsS
7.784590354
1.77E-16
Il1r2
up
HDvsH
−2.045193298
2.045193298
Hmox1
down
HvsS
4.521479834
1.22E-17
Hmox1
up
HDvsH
−1.654453774
1.654453774
Hmga1
down
HvsS
1.035947503
0.001085425
Hmga1
up
HDvsH
−3.318208676
3.318208676
Hilpda
down
HvsS
5.232134296
9.84E-07
Hilpda
up
HDvsH
−1.948087561
1.948087561
Hbegf
down
HvsS
1.978855041
4.75E-05
Hbegf
up
HDvsH
−2.077896667
2.077896667
Haus8
down
HvsS
1.52271929
0.00031222
Haus8
up
HDvsH
−2.412100719
2.412100719
Gpr171
down
HvsS
3.806137888
0.000629985
Gpr171
up
HDvsH
−2.147808363
2.147808363
Gm5483
down
HvsS
5.057652532
7.38E-05
Gm5483
up
HDvsH
−2.585498177
2.585498177
Gm45223
down
HvsS
2.391176452
0.015627895
Gm45223
up
HDvsH
−1.628851235
1.628851235
Gm28229
down
HvsS
1.649403373
0.009107812
Gm28229
up
HDvsH
−1.672421669
1.672421669
Gm13339
down
HvsS
2.023574911
0.002224967
Gm13339
up
HDvsH
−1.932198835
1.932198835
Gm10736
down
HvsS
2.046992702
0.016307069
Gm10736
up
HDvsH
−1.634489709
1.634489709
Glipr2
down
HvsS
1.861319851
3.41E-05
Glipr2
up
HDvsH
−2.150219087
2.150219087
Gdf15
down
HvsS
3.164640389
0.000288931
Gdf15
up
HDvsH
−2.995349539
2.995349539
Gadd45b
down
HvsS
3.880644116
0.000329799
Gadd45b
up
HDvsH
−2.134170768
2.134170768
Fst
down
HvsS
1.803665808
0.001061211
Fst
up
HDvsH
−3.497506842
3.497506842
Fosl1
down
HvsS
4.655628905
5.69E-10
Fosl1
up
HDvsH
−4.469443299
4.469443299
Fosb
down
HvsS
5.102965343
1.03E-06
Fosb
up
HDvsH
−2.325693246
2.325693246
Fos
down
HvsS
3.072836814
0.001722801
Fos
up
HDvsH
−3.285670433
3.285670433
Fam71f2
down
HvsS
2.727482521
0.038404348
Fam71f2
up
HDvsH
−1.557379829
1.557379829
Fam110c
down
HvsS
1.822254717
0.002364219
Fam110c
up
HDvsH
−1.551249686
1.551249686
Eva1c
down
HvsS
1.833033849
0.005255909
Eva1c
up
HDvsH
−1.71704274
1.71704274
Dusp6
down
HvsS
1.474143835
0.000774864
Dusp6
up
HDvsH
−2.270904035
2.270904035
Dusp5
down
HvsS
2.575676885
2.11E-07
Dusp5
up
HDvsH
−1.653490733
1.653490733
Cyp4f18
down
HvsS
2.076573947
0.001693345
Cyp4f18
up
HDvsH
−2.75916468
2.75916468
Cxcl5
down
HvsS
4.17454269
0.000263414
Cxcl5
up
HDvsH
−3.936082933
3.936082933
Cxcl3
down
HvsS
7.605137853
5.27E-08
Cxcl3
up
HDvsH
−2.768579535
2.768579535
Cxcl2
down
HvsS
7.37462855
6.72E-15
Cxcl2
up
HDvsH
−2.179597831
2.179597831
Csf3
down
HvsS
6.17608246
2.17E-05
Csf3
up
HDvsH
−1.58758556
1.58758556
Clec4e
down
HvsS
5.602987704
3.77E-15
Clec4e
up
HDvsH
−1.540615196
1.540615196
Clec4d
down
HvsS
6.38829675
1.49E-15
Clec4d
up
HDvsH
−1.593407303
1.593407303
Chka
down
HvsS
1.149537979
0.028949424
Chka
up
HDvsH
−2.709344699
2.709344699
Celsr3
down
HvsS
4.359644989
0.000678829
Celsr3
up
HDvsH
−1.784720195
1.784720195
Cd14
down
HvsS
5.578967952
9.61E-25
Cd14
up
HDvsH
−1.928531243
1.928531243
Ccl7
down
HvsS
4.717077235
4.56E-08
Ccl7
up
HDvsH
−2.41438031
2.41438031
Ccl4
down
HvsS
4.28129749
1.22E-06
Ccl4
up
HDvsH
−1.835051048
1.835051048
Ccl2
down
HvsS
3.070294982
1.15E-10
Ccl2
up
HDvsH
−1.911147269
1.911147269
Btc
down
HvsS
1.834386105
0.000859634
Btc
up
HDvsH
−5.617882186
5.617882186
Atp2a1
down
HvsS
3.99002602
0.005788025
Atp2a1
up
HDvsH
−2.809872624
2.809872624
Atf3
down
HvsS
5.692773408
4.99E-20
Atf3
up
HDvsH
−4.447114516
4.447114516
Asb11
down
HvsS
4.692005252
0.009930855
Asb11
up
HDvsH
−1.82757496
1.82757496
Arntl2
down
HvsS
2.334848967
7.22E-05
Arntl2
up
HDvsH
−3.296337039
3.296337039
Areg
down
HvsS
2.754927337
0.016635356
Areg
up
HDvsH
−2.238313629
2.238313629
Akap12
down
HvsS
2.984783063
1.01E-12
Akap12
up
HDvsH
−1.803797918
1.803797918
Adam8
down
HvsS
4.49209096
3.21E-12
Adam8
up
HDvsH
−3.914041065
3.914041065
AC159187.1
down
HvsS
4.880215203
0.004133128
AC159187.1
up
HDvsH
−4.682055486
4.682055486
5830428M24Rik
down
HvsS
3.085591253
0.033980078
5830428M24Rik
up
HDvsH
−2.254887002
2.254887002
Ttll13
down
HDvsH
down
−1.647413882
1.647413882
Pvr
HDvsH
−1.973915011
1.973915011
Tspan8
down
HDvsH
−1.607687307
1.607687307
Tmem26
down
HDvsH
−1.870033149
1.870033149
Tmem252
down
HDvsH
−1.629018447
1.629018447
Spsb4
down
HDvsH
−1.504336867
1.504336867
Snrpf
down
HDvsH
−1.58100298
1.58100298
Snai2
down
HDvsH
−1.803367445
1.803367445
Slc6a16
down
HDvsH
−2.358902701
2.358902701
Sgms2
down
HDvsH
−3.660222737
3.660222737
S100g
down
HDvsH
−1.52004334
1.52004334
S100a6
down
HDvsH
−1.598038555
1.598038555
Rnd1
down
HDvsH
−2.494626324
2.494626324
Rad51b
down
HDvsH
−1.585595534
1.585595534
Pxylp1
down
HDvsH
−4.234910944
4.234910944
Ppp1r32
down
HDvsH
−2.656803121
2.656803121
Ppil6
down
HDvsH
−1.637380294
1.637380294
Pdlim7
down
HDvsH
−2.976032503
2.976032503
Nupr1l
down
HDvsH
−2.851716684
2.851716684
Nipal1
down
HDvsH
−1.931011655
1.931011655
N4bp3
down
HDvsH
−1.947100003
1.947100003
mt-Atp8
down
HDvsH
−1.970821302
1.970821302
mt-Atp6
down
HDvsH
−1.5438236
1.5438236
Mapk15
down
HDvsH
−1.786948428
1.786948428
Lpar2
down
HDvsH
−2.53005369
2.53005369
Lor
down
HDvsH
−2.246627801
2.246627801
Itpka
down
HDvsH
−1.802326787
1.802326787
Igkc
down
HDvsH
−1.540314071
1.540314071
Id4
down
HDvsH
−2.012703973
2.012703973
Hba-a2
down
HDvsH
−2.176785594
2.176785594
Gsta1
down
HDvsH
−1.616322479
1.616322479
Gm6807
down
HDvsH
−4.077721011
4.077721011
Gm6745
down
HDvsH
−1.902400993
1.902400993
Gm4950
down
HDvsH
−1.758973901
1.758973901
Gm3362
down
HDvsH
−2.166634563
2.166634563
Gm19705
down
HDvsH
−2.024590818
2.024590818
Gm18194
down
HDvsH
−3.12874673
3.12874673
Gm15452
down
HDvsH
−5.798354509
5.798354509
Gm10804
down
HDvsH
−2.086353946
2.086353946
Gm10154
down
HDvsH
−1.886370898
1.886370898
Gm10146
down
HDvsH
−1.944957978
1.944957978
Eps8l1
down
HDvsH
−2.041344386
2.041344386
Epb41l4aos
down
HDvsH
−1.933186708
1.933186708
Depp1
down
HDvsH
−2.740446416
2.740446416
D930048N14Rik
down
HDvsH
−1.974636542
1.974636542
Cyr61
down
HDvsH
−4.663449218
4.663449218
Cyp2c52-ps
down
HDvsH
−1.701595622
1.701595622
Csad
down
HDvsH
−1.712864633
1.712864633
Cpeb1
down
HDvsH
−2.486448702
2.486448702
Clec2h
down
HDvsH
−1.929271717
1.929271717
Cbr3
down
HDvsH
−4.726004164
4.726004164
Car9
down
HDvsH
−1.908517526
1.908517526
Bcl2a1d
down
HDvsH
−2.023106285
2.023106285
Basp1
down
HDvsH
−1.668584131
1.668584131
Azin2
down
HDvsH
−5.165609356
5.165609356
AC127341.3
down
HDvsH
−3.260546546
3.260546546
4930539E08Rik
down
HDvsH
−1.762227762
1.762227762
2410006H16Rik
down
HDvsH
-figure2.227810032
2.227810032
1110020A21Rik
down
A is diagram of principal component analysis (PCA) of RNA-seq. As shown in the figure, each experimental group basically achieved the purpose of sample aggregation within the group and dispersion between the groups.
B is the volcano map of (HIRI + LDD) vs HIRI group. As shown in figure after setting screening conditions of |log2(Fold Change) | >= 1.5 & P value <= 0.05, 22 up-regulated genes and 143 down-regulated genes were obtained.
C is the schematic diagram of the final hub target genes of DD intervention in HIRI determined by multi-omics experiments. a is the 8 preliminary key target genes screened by network pharmacology. b shows 163 differential target genes obtained by (HIRI + LDD) vs HIRI and 78 target genes obtained by STRING database protein–protein interaction, Among them, there were 73 down-regulated genes in green nodes, pink nodes are upregulated genes, a total of 5 and c is the intersection target gene PTGS2 of a and b. That is, PTGS2 was the final hub target gene in this study.
3.4 Verification results of hub target gene
3.4.1 Results of molecular docking experiments
The crystal structure of PTGS2 protein was obtained from PDB database and uploaded to Dock Thor online molecular docking tool. At the same time, 3D structures of Ursolic acid and Oleanolic acid were downloaded from PubChem database and uploaded to Dock Thor in sdf form. Click Blind Docking to determine the live site and perform molecular docking with the corresponding protein crystal structure. Ursolic acid, Oleanolic acid binds to the active site of PTGS2 (PDB ID 5f19) through 5 and 2 hydrogen bonds to form a complex. Thus, the molecular docking results preliminarily revealed the mechanism of DD intervention in HIRI, and the docking results are shown in Fig. 6 (A-B). In the future, molecular biology experiments will be used to verify the gene.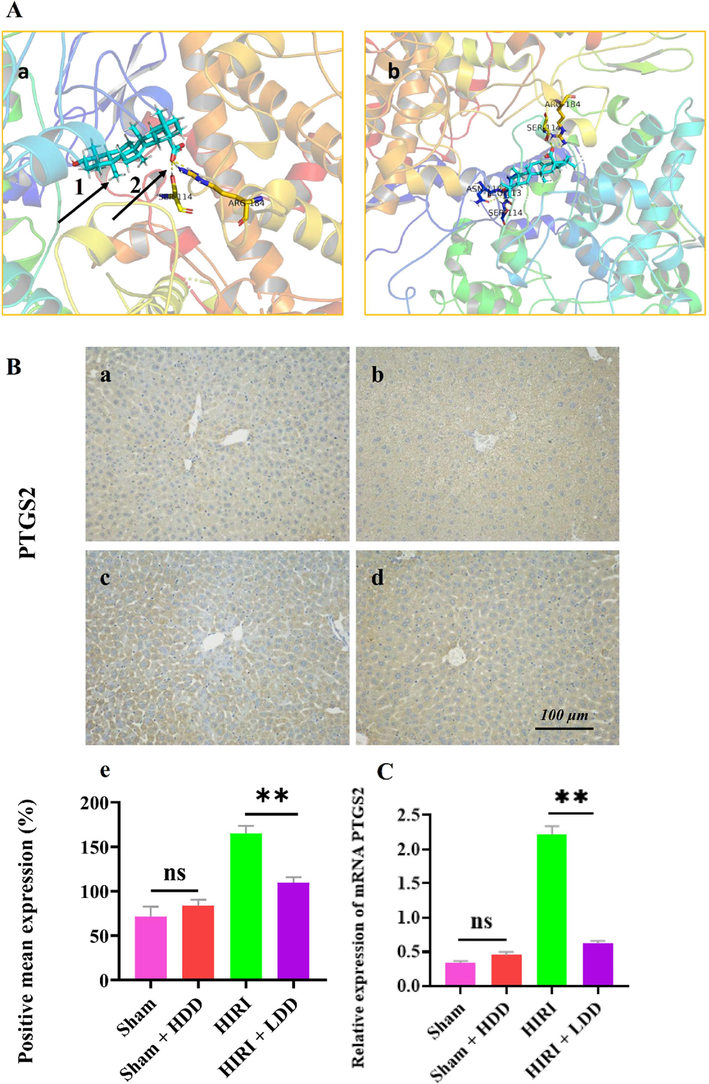
PTGS2 was verified experimentally.
3.4.2 The experimental results of PTGS2 target gene were verified by immunohistochemistry
The sections of Sham, (Sham + HDD), HIRI and (HIRI + LDD) groups (n = 3) were immunostained with PTGS2 (1:200) antibody. Histochemistry score (H-score) was used to convert the positive number and staining intensity of each section into corresponding values, so as to achieve the purpose of semi-quantitative tissue staining. The results showed that the expression of PTGS2 in HIRI group was significantly increased compared with that in Sham group (**P < 0.01), indicating that the target genes were low expressed in normal liver tissues and high expressed in HIRI. Compared with HIRI group, the expression of PTGS2 in (HIRI + LDD) group was significantly decreased (**P < 0.01), indicating that DD could protect HIRI by reducing the expression of the target genes. There was no significant difference in the expression of PTGS2 between Sham and (Sham + HDD) groups (P > 0.05), indicating that DD did not cause harm to the normal liver tissue of mice. See Fig. 6 (B).
3.4.3 RT-PCR was used to verify the experimental results of PTGS2 target genes
The relative expression of PTGS2 in each group was calculated according to the standard curve and Ct value and expressed as 2 -ΔΔCt. Compared with the Sham group, the expression of PTGS2 mRNA in the liver tissue of mice in the HIRI model group was significantly increased (**P < 0.01), indicating that PTGS2 mRNA was highly expressed in the pathological state of mice in HIRI. Compared with the HIRI model group, the mRNA of PTGS2 in the liver tissue of mice in the (HIRI + LDD) group was significantly decreased (**P < 0.01), indicating that DD can intervene the occurrence and development of HIRI in mice and has a protective effect on HIRI. Compared with the Sham group, the expression of PTGS2 mRNA in the liver tissue of mice in the (Sham + HDD) group had no significant change (P > 0.05), indicating that DD drug did not cause harm to the normal liver tissue of mice, indicating the safety of the drug. See Fig. 6 (C).
A is a schematic diagram of molecular docking. 1 is the ligand of a small molecule compound. 2 is the hydrogen bond.
Figure a shows Oleanolic acid forming a complex with the active site of PTGS2 through two hydrogen bonds. Figure b shows Ursdic acid forming a complex with the active site of PTGS2 through five hydrogen bonds.
B is the immunohistochemical test to verify PTGS2.
a = Sham, b= (Sham + HDD), c = HIRI, d= (Sham + LDD). The scale is 100 μm and the magnification is 200 times. e is the expression of PTGS2 among groups analyzed by one-way ANOVA and Tukey's post-hoc statistical method, expressed as mean + SD ( ± s). As shown in the figure, there was no significant change in the expression of PTGS2 in (Sham + HDD) group compared with Sham group (P > 0.05). It indicated that DD drug did not cause harm to liver tissue of normal mice. Compared with HIRI group, the expression of PTGS2 in (Sham + LDD) group had significant changes (**P < 0.01). These results indicated that DD drug had protective effect on HIRI in mice.
C shows the expression of PTGS2 verified by RT-PCR. Compared with the Sham group, the expression of mRNA PTGS2 in the liver tissue of mice in the HIRI model group was significantly increased (**P < 0.01), indicating that the expression of mRNA PTGS2 was high in the pathological state of mice in HIRI. There was no significant change in the expression of mRNA PTGS2 in (Sham + HDD) group compared with Sham group (P > 0.05). Compared with HIRI model group, mRNA PTGS2 in liver tissue of mice in (HIRI + LDD) group were significantly decreased (**P < 0.01), indicating that DD can interfere with the occurrence and development of HIRI in mice, and has a protective effect on HIRI in mice.
4 Discuss
In patients undergoing hepatobiliary surgery, HIRI is the most common cause of poor prognosis. Therefore, it is of great significance to actively investigate the pathological mechanism and preventive strategies against HIRI. Dogwood is a rare medicinal material with a long history and culture that is commonly used clinically in China. It is the main component of many clinical compounds and classical prescriptions, and it is crucial in the prevention and treatment of difficult and diverse diseases. Ursolic acid, Oleanolic acid and Loganin are all pharmacologically important components of Dogwood. The alcohol extraction method was used for DD in this study to extract both water-soluble components Loganin (PAN et al., 2020) and lipid-soluble components Ursolic acid and Oleanolic acid (Wu, Wang, & Tian, 2021), ensuing the pharmacological activity of DD preparation. By analyzing the experimental results at different stages of IRI, relevant scholars discovered that in the early stage of 0–3 h, liver cells primarily suffered from metabolic disorders, and then Kupffer cells were activated and released inflammatory factors, resulting in inflammatory reactions that exploded at 6 h of IRI (Piao et al., 2021). As a result, the protective mechanism of DD on HIRI was observed at 6 h IRI in this project. In this study, we selected two doses of DD (100 mg/kg and 50 mg/kg) and monitored the expression of AST and ALT to ascertain its pharmacodynamics impact on HIRI. In contrast to the model group, the two dose groups of DD had significantly lower levels of AST and ALT expression (**P < 0.01), but there was no difference between the two dose groups of DD (P > 0.05), indicating that no dose dependence had developed. As a result, future research on DD dose is necessary.
Network pharmacology and RNA-seq technology allowed us to determine the critical role PTGS2 plays in the DD protection of HIRI in mice. Immunohistochemistry and RT-PCR were used to confirm the findings, and they showed that PTGS2 expression in the HIRI model group was significantly higher (**P < 0.01) than in the Sham group, indicating that PTGS2 was highly expressed in the pathological process of liver ischemia–reperfusion injury. The expression of PTGS2 was significantly lower in the (HIRI + LDD) group compared to the HIRI group (**P < 0.01), suggesting that DD had a protective effect on HIRI mice. Because there was no difference in PTGS2 expression between the Sham and (Sham + HDD) groups (P > 0.05), DD does not cause harm healthy liver tissue, demonstrating its safety. PTGS2 is an inducible isoenzyme in the prostaglandin endoperoxidase synthases (PTGS) family. The other isoenzyme was PTGS1, which was structurally expressed. PTGS2 is under-expressed in resting cells and most tissues in physiological state. However, during the IRI process, NF-κB is dissociated, activated, and translocated from the cytosol to the nucleus as a result of ischemia, hypoxia, oxidative stress and other factors (Gao et al., 2018; Gao et al., 2017). PTGS2, as a downstream target gene of NF-κB, is rapidly induced under hepatic ischemia and hypoxia (Chen et al., 2013). First, PTGS2 is an inducible cyclooxygenase that causes the release of a wide range of inflammatory factors. Second, during IRI, the accumulation of oxygen free radicals (ROS) caused by oxidative stress caused by cell ischemia and hypoxia results in a pathological process of the body, and a large number of cytokines such as TNF-α, PAF, IL-1β, IL6 and others are released. TNF-α is an important activator of the traditional NF-κB signaling pathway. When the transcriptional activity of TNF-α is increased, it can activate the expression of NF-κB, further induce the expression of PTGS2, and cause liver cell injury and apoptosis. Third, damaged liver cells stimulated by other growth factors will increase PTGS2 expression, catalyzing the production of various prostaglandins from arachidonic acid, resulting in increased inflammatory reactions. As shown in Fig. 7A, increased PTGS2 expression is associated with the accumulation of ROS, the massive release of inflammatory factors, the activation of NF-κB, hepatocyte injury, and apoptosis In addition, Wang et al. (Wang et al., 2022) reported that eugenol could slow the progression of RA (rheumatoid arthritis) by inhibiting the expression of NF-kB signaling pathway and PTGS2 in fibroblast-like synoviocytes, indicating that it could be a potential new drug for the clinical prevention and treatment of RA. Zhou et al. (Zhou et al., 2021) reported that the severity of human coronary atherosclerosis was positively correlated with the expression of PTGS2, ACSL4, caspase-1 and NLRP3, and negatively correlated with the expression of GPX4. By enriching the biological processes of lipid metabolism, inflammation, and C-type lectin receptor signaling pathways, the direct or indirect interactions between the above five proteins were elucidated, and PTGS2 was finally shown to be the hub gene of atherosclerosis. According to Xu et al. (Xu & Chen, 2022), PTGS2 is a key gene in systemic sclerosis, and its downregulation is positively correlated with the occurrence of the disease and abnormal immune cell infiltration. This could be a promising therapeutic target for preventing the progression of systemic sclerosis to malignancy. According to these reports, PTGS2 plays an important role in the diagnosis and treatment of various diseases, and its expression during disease development provides a reference for judging the severity of the disease. Interestingly, this is similar to what we found. We confirmed the expression of PTGS2 in the process of HIRI through our analysis and experiments, and concluded that PTGS2 is a key target gene for the prevention and treatment of HIRI, and that it may become a marker for clinical judgment of the degree of hepatocyte injury in HIRI.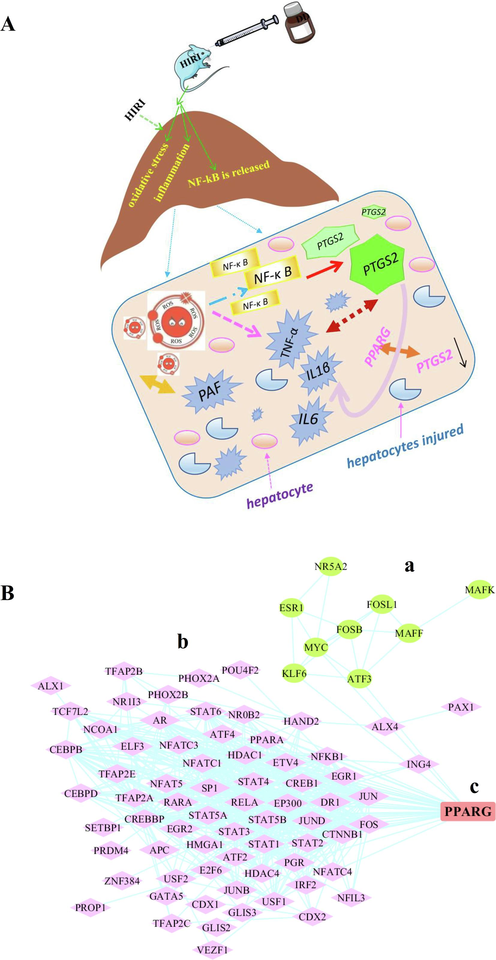
Mechanism and future research contents.
In addition, we used the Map viewer function in NCBI (https://www.ncbi.nlm.nih.gov/projects/mapview/) database to set the upstream 2000nt and downstream 100nt regions of the transcription start site of PTGS2, obtained the promoter region of PTGS2 and imported it into JASPAR (https://jaspar.genereg.net) database. PTGS2 transcription factors were obtained based on a score greater than 500. Simultaneously, PTGS2 was input into TRRUST (https://www.grnpedia.org/trrust/) database to obtain the corresponding transcription factors, as shown in Fig. 7 (B-b). In our RNA-seq study, 10 transcription factors were identified under the screening conditions of |log2(Fold Change) | >= 1.0 & P value < 0.05 as shown in Fig. 7 (B-a). Then, its intersection with PTGS2 transcription factor screened by the database was obtained to obtain PPARG, as shown in Fig. 7 (B-c). From our study and literature reports, we found that PTGS2, a key enzyme to initiate inflammatory response, was highly expressed when HIRI occurred, and it caused the release of inflammatory mediators TNF-α, IL-1β and IL-6, which promoted hepatocyte apoptosis and aggravated liver injury. Therefore, in the future, we will investigate the relationship between PTGS2 and its transcription factor PPARG, as well as the expression of related inflammatory factors TNF-α, IL-1β and IL-6 following the use of PTGS2 inhibitor.
A is the schematic diagram of the mechanism of this study.
B is the schematic diagram of the extended research content of this project. The green nods are the transcription factors obtained after setting the screening conditions of |log2(Fold Change) | >= 1.0 & P value < 0.05 in RNA-seq, see Figure B-a. The pink nodes are PTGS2 transcription factors obtained by setting the score greater than 500 through NCBI, TRRUST and JASPAR databases, see Figure B-b. Blue is the intersecting lines between nodes. The red node PPARG represents the intersection of transcription factors obtained by the two pathways, see Figure B-c. In the future, we will further explore the relationship between PTGS2 and its transcription factor PPARG, and further reveal the molecular mechanism of DD intervention in HIRI.
5 Conclusion
In conclusion, HIRI is an urgent clinical problem, so it is of great clinical significance to carry out relevant research. A large number of data have shown that there are many targets associated with HIRI. However, in our study, PTGS2 was found to be the hub target gene of DD intervention in HIRI through the method of bioinformation multi-omics. Moreover, the active site of PTGS2 forms complexes with Ursolic acid and Oleanolic acid, which reduce the expression of PTGS2 in HIRI, thus realizing the protective effect of DD on HIRI in mice.
Ethics statement
The animal study was reviewed and approved by Animal Ethics Committee of Nankai University, Tianjin, China.
Author contributions
LH and WH conceived the overall idea of this study and completed the analysis of network pharmacology data mining. LZ and LH have completed the determination of three active ingredients in DD preparation. JL and LZ completed animal experiments and all molecular biological experiments. LH and WH completed the molecular docking simulation and manuscript writing. LH completed transcriptomic sequencing data analysis and manuscript modification. FX provides guidance for molecular biology experiments and funding support for this research. In conclusion, all authors agreed on the final version of the manuscript.
Funding
This work was financially supported by National Natural Science Foundation of China (82072212) and Tianjin Municipal Bureau of Public Health, China (ZC20215).
Tianjin Municipal Bureau of Public Health.
Declaration of Competing Interest
The authors declare that they have no known competing financial interests or personal relationships that could have appeared to influence the work reported in this paper.
References
- Liver Ischemia/Reperfusion Injury: Processes in Inflammatory Networks-A Review. Liver Transplantation. 2010;16(9):1016-1032.
- [Google Scholar]
- Phenolic Compounds Contained in Little-known Wild Fruits as Antiadhesive Agents Against the Beverage-Spoiling Bacteria Asaia spp. Molecules. 2017;22(8)
- [Google Scholar]
- Lactobacillus acidophilus Strain Suppresses the Transcription of Proinflammatory-Related Factors in Human HT-29 Cells. Journal of Microbiology and Biotechnology. 2013;23(1):64-68.
- [Google Scholar]
- Cornus mas and Cornus officinalis-A Comparison of Antioxidant and Immunomodulatory Activities of Standardized Fruit Extracts in Human Neutrophils and Caco-2 Models. Plants-Basel. 2021;10(11)
- [Google Scholar]
- E3 ubiquitin ligase ring finger protein 5 protects against hepatic ischemia reperfusion injury by mediating phosphoglycerate mutase family member 5 ubiquitination. Hepatology. 2022;76(1):94-111.
- [Google Scholar]
- PTGER2 activation induces PTGS-2 and growth factor gene expression in endometrial epithelial cells of cattle. Animal Reproduction Science. 2017;187:54-63.
- [Google Scholar]
- PTGFR activation promotes the expression of PTGS-2 and growth factors via activation of the PKC signaling pathway in bovine endometrial epithelial cells. Animal Reproduction Science. 2018;199:30-39.
- [Google Scholar]
- Role of Plant-Derived Natural Compounds in Experimental Autoimmune Encephalomyelitis: A Review of the Treatment Potential and Development Strategy. Frontiers in Pharmacology. 2021;12
- [Google Scholar]
- The Protective Effect of Panax notoginseng Mixture on Hepatic Ischemia/Reperfusion Injury in Mice via Regulating NR3C2, SRC, and GAPDH. Frontiers in Pharmacology. 2021;12
- [Google Scholar]
- In Silico Network Analysis of Ingredients of Cornus officinalis in Osteoporosis. Medical Science Monitor. 2021;27
- [Google Scholar]
- A Renally Clearable Activatable Polymeric Nanoprobe for Early Detection of Hepatic Ischemia-Reperfusion Injury. Advanced Materials. 2022;34(24)
- [Google Scholar]
- Jiang, Y., Chen, H., Wang, L., Zou, J., Zheng, X., & Liu, Z. 2016. Quality Evaluation of Polar and Active Components in Crude and Processed Fructus Corni by Quantitative Analysis of Multicomponents with Single Marker. Journal of Analytical Methods in Chemistry, 2016.
- Ischemia-Reperfusion Injury in Aged LiversThe Energy Metabolism, Inflammatory Response, and Autophagy. Transplantation. 2018;102(3):368-377.
- [Google Scholar]
- Traditional Chinese medicine network pharmacology: theory, methodology and application. Chinese Journal of Natural Medicines. 2013;11(2):110-120.
- [Google Scholar]
- Liu, P., Yang, P., & Zhang, L. 2020. Mode of Action of Shan-Zhu-Yu (Cornus officinalis Sieb. et Zucc.) in the Treatment of Depression Based on Network Pharmacology. Evidence-Based Complementary and Alternative Medicine, 2020.
- Moderated estimation of fold change and dispersion for RNA-seq data with DESeq2. Genome Biology. 2014;15(12)
- [Google Scholar]
- Pan, X. H., Li, T., Yin, S., Liu, Y.L., Zhao, W, & Lin, H. 2020. Ultrasonic assisted extraction of Rehmannia rehmanniae and its prescription. Guide to Traditional Chinese Medicine, 26(8):12-15,23.
- Optimal intervention time of ADSCs for hepatic ischemia-reperfusion combined with partial resection injury in rats. Life Sciences. 2021;285
- [Google Scholar]
- Effect of cornel iridoid glycoside on microglia activation through suppression of the JAK/STAT signalling pathway. Journal of Neuroimmunology. 2019;330:96-107.
- [Google Scholar]
- Compositional analysis and biological characterization of Cornus officinalis on human 1.1B4 pancreatic beta cells. Molecular and Cellular Endocrinology. 2019;494
- [Google Scholar]
- Alloimmune Activation Enhances Innate Tissue Inflammation/Injury in a Mouse Model of Liver Ischemia/Reperfusion Injury. American Journal of Transplantation. 2010;10(8):1729-1737.
- [Google Scholar]
- Growth inhibitory efficacy of Cornus officinalis in a cell culture model for triple-negative breast cancer. Oncology Letters. 2019;17(6):5261-5266.
- [Google Scholar]
- Neuroprotective Effects of Cornus officinalis on Stress-Induced Hippocampal Deficits in Rats and H2O2-Induced Neurotoxicity in SH-SY5Y Neuroblastoma Cells. Antioxidants. 2020;9(1)
- [Google Scholar]
- Eugenol suppresses the proliferation and invasion of TNF-a-induced fibroblast-like synoviocytes via regulating NF-kB and COX-2. Biochemical and Biophysical Research Communications. 2022;612:63-69.
- [Google Scholar]
- Simultaneous qualitative and quantitative analyses of ursolic acid and oleanolic acid in Punica granatum L. (Pomegranate) flowers by high-performance thin-layer chromatography. Jpc-Journal of Planar Chromatography-Modern Tlc. 2021;34(2):165-172.
- [Google Scholar]
- The Downregulation of PTGS2 Mediated by ncRNAs is TightlyCorrelated with Systemic Sclerosis-Interstitial Lung Disease. Frontiers in Genetics. 2022;12
- [Google Scholar]
- Loganin Inhibits Angiotensin II-Induced Cardiac Hypertrophy Through the JAK2/STAT3 and NF-kappa B Signaling Pathways. Frontiers in Pharmacology. 2021;12
- [Google Scholar]
- The medicinal active ingredients and their associated key enzyme genes are differentially regulated at different growth stages in Cornus officinalis and Cornus controversa. Industrial Crops and Products. 2019;142
- [Google Scholar]
- Verification of ferroptosis andpyroptosis and identification of PTGS2 as the hub gene in human coronary artery atherosclerosis. Free Radical Biology and Medicine. 2021;171:55-68.
- [Google Scholar]


