

Translate this page into:
The stir-frying can reduce hepatorenal toxicity of Fructus Tribuli by inactivating β-glucosidase and inhibiting the conversion of furostanol saponins to spirostanol saponins
⁎Corresponding authors. tougaotcm@163.com (Chao Zhang), wenxianjiansuotcm@126.com (Fei Guo)
-
Received: ,
Accepted: ,
This article was originally published by Elsevier and was migrated to Scientific Scholar after the change of Publisher.
Abstract
The purpose of this study was to illustrate the mechanism of “enzyme inactivation and toxicity reduction” of Fructus Tribuli (FT) after being heating processed. Ultra-high performance liquid chromatography coupled with triple quadrupole tandem mass spectrometry (UHPLC-MS/MS) was used to quantitatively analyze the contents of four steroidal saponins in crude Fructus Tribuli (CFT) and stir-fried Fructus Tribuli (SFT) under different storage times at room temperature. The enzyme activity of β-D-glucosidase in CFT and SFT were determined and calculated by ultraviolet–visible spectrometry (UV-VIS spectrometry). In addition, the enzyme hydrolysates of FOT and tribuluside A were qualitatively analyzed by ultra-high-performance liquid chromatography coupled with quadruple-time-of-flight mass spectrometry (UHPLC-Q-TOF/MS). The hepatorenal toxicity of spirostanol saponins in FT were further confirmed by in vivo and in vitro experiment. This study confirmed that “enzyme inactivation and toxicity reduction” was one of the reasons why the stir-frying can reduce hepatorenal toxicity of FT, and further enriched the exploration on the mechanism of processing toxicity reduction.
Keywords
Stir-frying
Hepatorenal toxicity
Fructus Tribuli
Enzyme inactivation
Toxicity reduction

- 293T
-
human embryonic kidney cell line
- AAS
-
aristolochic acid A
- ALP
-
alkaline phosphatase
- ALT
-
alanine aminotransferase
- ANOVA
-
one-way analysis of variance
- AST
-
aspartate aminotransferase
- BUN
-
blood urea nitrogen
- CCK-8
-
Cell Counting Kit-8
- CFT
-
crude Fructus Tribuli
- CR
-
creatinine
- CTC
-
carbon tetrachloride
- DMEM
-
Dulbecco’s Modified Eagle’s Medium
- FBS
-
fetal bovine serum
- FOT
-
26-O-β-D-glucopyranosyl-3β,22α,26-triol-(25R)-5α-furostan-12-one-3-O-β-D-galactopyranosyl-(1→2)-[β-D-xylopyranosyl-(1→3)]-β-D-glucopyranosyl-(1→4)-β-D-galactopyranoside
- FT
-
Fructus Tribuli
- FT-1
-
water eluate
- FT-2
-
40% ethanol eluate
- FT-3
-
60% ethanol eluate
- FT-4
-
75% ethanol eluate
- FT-5
-
95% ethanol eluate
- Glc
-
glucose. IC50: the half-maximal inhibitory concentration value
- KIM-1
-
kidney injury molecule 1
- LO2
-
human normal liver cell line
- NAG
-
β-N-Acetylglucosaminidase
- pNPG
-
4-Nitrophenyl-β-D-glucopyranoside
- SD
-
Sprague-Dawley
- SFT
-
stir-fried Fructus Tribuli
- TBIL
-
total bilirubin
- TIC
-
total ion chromatogram. UHPLC-MS/MS ultra-high performance liquid chromatography coupled with triple quadrupole tandem mass spectrometry
- UHPLC-Q-TOF/MS
-
ultra-high-performance liquid chromatography coupled with quadruple-time-of-flight mass spectrometry
- UV–VIS spectrometry
-
ultraviolet–visible spectrometry
Abbreviations
1 Introduction
Fructus Tribuli (FT) is the dried and ripe fruit of an annual plant (Tribulus terrestris L.) which belongs to family Zygophyllaceae. It has a long history as traditional Chinese herb and is recorded in Sheng Nong's herbal classic, Chinese first monograph on traditional Chinese medicine. In the Chinese Pharmacopoeia, FT has been used for the treatment of skin pruritus, headache, vertigo and mammary duct blockage (Commission 2020). Modern pharmacological studies have found that FT possesses functions of anti-cancer (Patel et al., 2019), anti-inflammatory (Tian et al., 2020), anti-depression (Zhang et al., 2017), anti-ischemic stroke (Guo et al., 2020), anti-bacterial (Batoei et al., 2016), inhibition of pulmonary fibrosis (Qiu et al., 2019), and treatment of cardiovascular diseases (Jiang et al., 2016). Additionally, as a beverage (bush teas), FT has long been used empirically to propel urinary stones in Iraq (Al-Ali et al., 2003). And as a common nutritional supplement, FT has significantly alleviated muscle damage and promoted anaerobic performance of trained male boxers (Ma et al., 2017).
With the wide application of FT, its toxic and side effects have also been attracted attention. There are two prior case reports of FT-induced hepatorenal toxicity. One young male presented severe nephrotoxicity after consuming 2 L of FT water in two consecutive days (Talasaz et al., 2010). The other young male, presenting with severe hyperbilirubinemia followed by acute renal failure and bile containing casts in the tubules, taken FT extract tablets (one tablet a day for a few months) as part of his body-building program (Ryan et al., 2015). Not only had FT been reported to cause hepatorenal toxicity in clinical applications, but also FT had been confirmed the hepatorenal toxicity in vitro and in vivo experiment. In vitro experiments confirmed that the methanol extract of FT had significant cytotoxicity against rat renal tubular epithelial cells with IC50 value of 0.16 mg/mL (Abudayyak et al., 2015). Rats were orally administered with water decoction of FT (50 times the human clinical dosage) once daily for three months, the long-term toxicity test showed that there were swelling, edema, inflammation in the liver and compensatory hyperplasia, hypertrophy in the kidney. However, these conditions could be recovered after two weeks of drug withdrawal (Xiang et al., 2006). Gandhi S (Gandhi et al., 2013) used steroidal saponins extract of FT (50 mg/kg for 8 weeks) to treat streptozotocin-induced diabetic rats, and confirmed its anti-diabetic effect, but found its potential nephrotoxicity that is independent its antidiabetic action. This study suggested that the nephrotoxicity of FT may be related to the steroidal saponins it contains. Apart from steroidal saponins, other metabolites such as flavonoids, alkaloids and polysaccharide etc have been identified from FT (Hashim et al., 2014), in which β-carboline alkaloids were responsible for chronic neurotoxicity of the sheep (Bremner et al., 2005).
“The raw drug is toxic while the cooked one is less toxic” was one of the theories of raw and cooked. It refers to some Chinese herbal medicines are toxic or irritant, which can be reduced or alleviated after being processed into cooked products (Zhong and Li 2020). Two processed products of FT are included in the Chinese Pharmacopoeia (Commission 2020), crude Fructus Tribuli (CFT) and stir-fried Fructus Tribuli (SFT). Our previous study found that SFT can significantly reduce hepatorenal toxicity (Qu et al., 2016) and the transformation of spirostanol saponins into their aglycones may be the reason of toxicity reduction of SFT (Yuan et al., 2019). However, in this paper we found another interesting mechanism of reducing toxicity after FT being heating processed.
According to the cyclization state of the F-ring, steroidal saponins are divided into two categories, spirostanol saponins and furostanol saponins (Fig. 1). Terrestrosin D, a spirostanol saponins separated from FT, has significant cytotoxic effect on prostate cancer cells and human umbilical vascular endothelial cells (Wei et al., 2014). Additionally, during our previous studies, it is found that the content of terrestrosin D in CFT was increased under different storage times at room temperature. Tschesche reported that the furostanol saponins sarsaparilloside was easily enzymatic hydrolyzed by β-glucosidase, lost C-26-glucose, cyclized the F-ring, and converted to the spirostanol saponins parillin (Tschesche et al., 1967). Hence, we proposed the scientific hypothesis that SFT could “enzyme inactivation and toxicity reduction”. A flowchart illustrating the strategy of the present study is shown in Supplementary Fig. S1.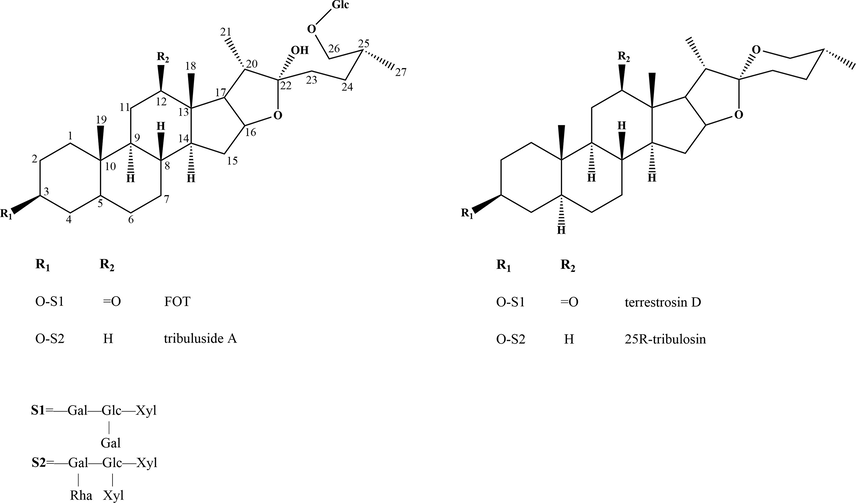
Structures of the steroidal saponins.
2 Materials and methods
2.1 Chemicals and reagents
LC–MS grade acetonitrile and formic acid were purchased from Fisher Scientific (Fair Lawn, New Jersey, USA). HPLC-grade ethanol (Duksan, Korea) was used for sample preparation. Purified water was obtained from the Elga purifi-cation system (Purelab Elga, Britain). β-glucosidase was purchased from Shanghai Yuanye Bio-Technology Co., Ltd. (Shanghai, China). 4-Nitrophenyl-β-D-glucopyranoside (pNPG) and p-Nitrophenol were purchased from Shanghai Macklin Biochemical Co., Ltd. (Shanghai, China). Other reagents and chemicals were all of analytical grade.
The standard of terrestrosin D (CAS: 179464–23-4) was purchased from the National Institutes for Food and Drug Control (Beijing, China). 26-O-β-D-glucopyranosyl-3β,22α,26-triol-(25R)-5α-furostan-12-one-3-O-β-D-galactopyranosyl-(1 → 2)-[β-D-xylopyranosyl-(1 → 3)]-β-D-glucopyranosyl-(1 → 4)-β-D-galactopyranoside (FOT) (CAS: 2643969–45-1), tribuluside A (CAS: 943915–16-0), and 25R-tribulosin (CAS: 79974–46-2) were provided by Baiping Ma, a researcher of Beijing Institute of Radiation Medicine. The purities of these analytes were determined to be > 98%.
The kits for detecting alanine aminotransferase (ALT), aspartate aminotransferase (AST), alkaline phosphatase (ALP), blood urea nitrogen (BUN), and creatinine (CR) were purchased from Rayto Life and Analytical Sciences Co., Ltd. (Shenzhen, China). Total bilirubin (TBIL) kit was purchased from Changchun Huili biotech Co., Ltd. (Changchun, China). β-N-Acetylglucosaminidase (NAG) kit and kidney injury molecule 1 (KIM-1) kit were purchased from Jiangsu KeyGEN Bio TECH Co., Ltd., (Nanjing, China).
Dulbecco’s Modified Eagle’s Medium (DMEM, with high glucose), 10% fetal bovine serum (FBS), 1% glutamax, 1% non-essential amino acids, 1% sodium pyruvate 100 mM solution were purchased from Gibco (New York, USA). 1% penicillin–streptomycin solution, Cell Counting Kit-8 (CCK-8) were purchased from Jiangsu KeyGEN Bio TECH Co., Ltd., (Nanjing, China).
2.2 Plant collection and identification
Three batches of CFT were collected from different areas in China (Table 1). The CFT were authenticated by Professor Fang Zhang of Shandong University of Traditional Chinese Medicine, and the voucher specimens (No.190212) were deposited at the College of Pharmacy of Shandong University of Traditional Chinese Medicine.
No.
Place of Origin
Batch Number
Manufacturer
1
Hebei
1,709,260,132
Bozhou Huqiao Pharmaceutical Co., Ltd.
2
Neimeng
C0851805001
Hebei Hehuachi Pharmaceutical Co., Ltd.
3
Hebei
180,501
Anguo Anxing Traditional Chinese Medicine Co., Ltd.
2.3 Preparation of CFT and SFT
According to the Chinese Pharmacopoeia 2020 edition, CFT was processed from FT by removing impurities. SFT was obtained from CFT. Each batch (100 g) of CFT was placed in a preheated stir-frying machine (MK-30, Jiangyin Zhutang Mingke Machinery Factory, China), heated at 200 ℃, stir-fried for 15 min, and then removed for cooling to room temperature.
The preparation of UHPLC–MS/MS analysis, UV–VIS spectrometry analysis, and UHPLC-Q-TOF/MS analysis samples were described in Supplementary materials.
2.4 Experimental animals
Healthy male SD rats, aged 5 – 8 weeks, weighted 140 ± 10 g, were purchased from Jinan Pengyue experimental animal breeding Co., Ltd. (No.: SCXK (LU) 2019 0003). Animals were kept in the animal house of Shandong University of Traditional Chinese Medicine while maintaining optimal condition of temperature and humidity and fed with a standard laboratory diet and water added libitum. All the experimental procedures were approved by the Committee on Animal Care and Usage of the Shandong University of Traditional Chinese Medicine [Reference No.: SDUTCM202101005]. All rats were sacrificed lawfully after completion of the experiments.
2.5 Cell culture
The human normal liver cell line (LO2) was supplied by Jiangsu KeyGEN BioTECH Co., Ltd. Human embryonic kidney cell line (293 T) was supplied by the Cell Bank of Chinese Academy of Sciences. The LO2 cells were cultured in DMEM (with high glucose) combined with 10% FBS and 1% penicillin/streptomycin. The 293 T cells were cultivated in DMEM (with high glucose) combined with 10% FBS, 1% glutamax, 1% non-essential amino acids, 1% sodium pyruvate 100 mM solution, and 1% penicillin/streptomycin. Both cells were cultured in a humidified incubator with 5% CO2 at 37 ℃.
2.6 UHPLC–MS/MS analysis
UHPLC separation was carried out using an Agilent 1290 UHPLC series (Santa Clara, CA, USA). A Halo ®C18 column (2.1 × 100 mm, 2.7 μm, Advanced Materials Technology, USA) was used for chromatographic separation. The mobile phase consisted of solvent A (0.05% formic acid, v/v and 5 μmol/L sodium formate in water) and solvent B (0.05% formic acid, v/v and 5 μmol/L sodium formate in acetonitrile). The UHPLC gradient elution was optimized as follows: 0 – 0.5 min at 15 – 20% B; 0.5 – 2 min at 20 – 35% B; 2 – 4 min at 35 – 50% B; 4 – 6 min at 50 – 90% B; 6 – 7 min at 90 – 100% B; 7 – 20 min at 100% B. The injection volume was 5 μL.
The MS/MS detection was performed on an Agilent 6470 triple quadrupole mass spectrometer (Santa Clara, CA, USA), equipped with an electrospray ionization source. The flow rate was 0.3 mL/min and the column temperature were maintained at 30 ℃. The optimized parameters for the four analytes are listed in Supplementary Table S2. The mass spectrometry parameter settings were optimized as follows: capillary voltage, +4000 V; drying gas temperature, 325 ℃; drying gas flow, 10 L/min; nebulizer pressure, 30 psi.
2.7 UV–-VIS spectrometry analysis
The enzyme activity of CFT and SFT was accurately determined by pNPG method with some modifications (Liu et al., 2010). A UV-6100A spectrophotometer (MAPADA INSTRUMENTS, Shanghai, China) equipped with two square quartz cells of 10 mm path length was used to measure the spectra of p-nitrophenol. The software UV–VIS was used for instrument control and spectral acquisition. Sodium carbonate solution was used as reference blank. The samples were scanned in the wavelength range of 350 – 450 nm with a sampling interval of 0.5 nm.
2.8 UHPLC-Q-TOF/MS analysis
UHPLC separation was conducted using the Agilent 1290 UHPLC series (Santa Clara, CA, USA). Chromatographic separation was performed on a Halo ®C18 column (2.1 × 100 mm, 2.7 μm, Advanced Materials Technology, USA). The reference substances and its enzymatic hydrolysates were analyzed by UHPLC-Q-TOF/MS with the gradient mobile phase consisting of 0.08% formic acid in acetonitrile, 0.08% formic acid in water, (0.0 – 8.0 – 14.0 – 18.0 – 23.0 – 28.0 – 33.0 – 38.0 – 38.1 – 42.0 min, 15 – 20 – 23 – 28 – 35 – 50 – 90 – 90 – 100 – 100% acetonitrile). The flow rate was 0.3 mL/min, and the column temperature were maintained at 35 ℃. The injection volume was 5 μL. The MS analysis was performed on an Agilent 6520 Q-TOF mass spectrometer (Santa Clara, CA, USA) equipped with an electrospray ionization source. The mass spectrometer operated in negative ion mode. The mass spectrometry parameter settings were optimized as follows: capillary voltage, negative ion 3500 V; gas temperature, 350 ℃; drying gas flow, 10 L/min; nebulizer pressure, 30 psi; skimmer voltage, 65 V; fragmentor voltage, 135 V. The nebulization and auxiliary gas were high-purity nitrogen, and the mass scanning range was m/z 100 – 1500 Da.
2.9 Preparation of ethanolic extracts
CFT powders (5.0 kg) were soaked in 6250 mL petroleum ether for 12 h. The mixtures were refluxed and extracted twice, each extraction lasting for 2 h. Then the CFT residues were refluxed and extracted twice with 10000 mL 70% ethanol (v/v), each extraction lasting for 2 h. The extracts were filtered, then the filtrates were combined. Ethanol was removed by a rotary evaporator. The extracts were purified by D101 macroporous adsorption resin column. Subsequently, the column was eluted successively with water, 40% ethanol (v/v), 60% ethanol (v/v), 75% ethanol (v/v), and 95% ethanol (v/v). Each ethanol eluate was vacuum evaporated, and then freeze-dried to obtain dry matter. The yield was 4.49%, 1.16%, 0.70%, 0.27% and 0.52%, respectively. Based on the weight of the dry matter obtained, each group was accurately weighed, and the volume was made up to exactly 10 mL using 70% ethanol (v/v). The concentration of each sample is 1.4 mg/mL of FT-1, 1.4 mg/mL of FT-2, 1.0 mg/mL of FT-3, 0.5 mg/mL of FT-4, and 1.4 mg/mL of FT-5, respectively. The sample solution was filtered through 0.22 μm microporous membrane for UHPLC-MS/MS analysis and UHPLC-Q-TOF/MS analysis.
2.10 Animals and husbandry
After a 7-day quarantine-acclimatization period, using the program Toxstat 2006, healthy male SD rats were randomly assigned to control group, carbon tetrachloride positive control group (CTC), aristolochic acid A positive control group (AAs), water eluate group (FT-1), 40% ethanol eluate group (FT-2), 60% ethanol eluate group (FT-3), 75% ethanol eluate group (FT-4), and 95% ethanol eluate group (FT-5). Each group consisted of 10 rats. The dosage of each group: eluate group (equivalent to 72 g of crude drug/kg body weight), AAs group (10 mg/kg body weight), CTC group (5 mL CCl4 dissolved in 95 mL of corn oil, 0.42 mL diluted CCl4/kg body weight), control group (distilled water at the same volume). Diluted CCl4 was given to the CTC group every 3 days via intraperitoneal injection for 56 consecutive days, and other groups were orally administered once daily for 56 consecutive days.
2.11 Clinical observations
Animals were observed daily for signs of clinical toxicity and mortality. Observations included, but were not limited to, the changes in spirit, activity, and hair color.
2.12 Body weight and food consumption
The body weights (g) of all rats in the main groups were measured every two days during the treatment period. Food consumption (g) was measured at weekly intervals during the treatment period.
2.13 Urinalysis and serum biochemistry
After consecutive 56 days of drug administration, each rat was placed in a metabolic cage for 24 h to collect urine. NAG and KIM-1 were measured by commercial kits. After treatments, rats were sacrificed, blood was sampled for serum biochemistry. Serums were sampled to detect ALT, AST, ALP, TBIL, BUN, and CR using commercial kits.
2.14 Necropsy and histopathological examination
Livers and kidneys were removed to perform a necropsy. The kidney and liver from each rat were weighed after the removal of peripheral fat, and organ indexes were calculated according to the formula: organ index (%) = organ weight (g)/body weight (g) × 100%.
All the collected tissues mentioned above were fixed in 10% neutral buffered formalin. A histopathological examination was performed following hematoxylin and eosin stain of the organs listed above from all animals. Tissue sections were observed using an optical microscope.
2.15 Cytotoxicity assay
LO2 cells and 293 T cells suspension (1 × 10⁴ cells/mL) were seeded in 96 well plate along. Cell suspension (100 μL) was added to each well, and cultivated at 37 °C, 5% CO2 humidified incubator. After 24 h of incubation, each well of the drug group was added with 100 μL of the test solution with different concentrations of each steroidal saponins. The final concentration of each test solution was 41.3, 20.6, 10.3, 5.2, and 2.6 μM. The negative control group was added with the same volume of DMEM incomplete culture medium containing DMSO. 10 μL of CCK-8 detection solution was added, followed by incubation at 37 °C for 2 h. The absorbance A of each well was measured at 450 nm with a microplate reader (DNM-9602G, Beijing Perlong New Technology Co., Ltd., Beijing, China). The experiments were repeated independently for six times. The inhibitory rate of cell growth was calculated according to the following formula: Inhibition rate (%) = (1 – Adrug group/Anegative control group) × 100%.
2.16 Flow cytometry assay
LO2 cells and 293 T cells suspension (1 × 10⁵ cells/mL) were cultivated in culture medium on a 6 well plate along for 24 h, then treated with each steroidal saponin (41.3 μM, the final concentration), then cultured for 24 h. The cells were harvested from the medium and washed twice with PBS, and resuspended with 500 μL binding buffer. And then stained with 5 μL FITC Annexin V and 5 μL propidiu-miodide for 5 – 15 min in the dark. Flow cytometry was performed within 1 h. The experiments were repeated independently for three times.
2.17 Statistical analysis
Data were presented as the mean ± SD. Significant differences were assessed by one-way analysis of variance (ANOVA) followed by Dunnett’s test using SPSS 22.0 (SPSS Inc., Chicago, IL, USA). A P value of < 0.05 was considered significantly different.
3 Results
3.1 Variations of steroidal saponins under different storage time conditions
The contents of steroidal saponins were quantitatively analyzed by UHPLC–MS/MS. As shown in Fig. 2, the contents of furostanol saponins (FOT and tribuluside A) in CFT demonstrated similar variations. With the storage time from 0 to 12 th month, the contents of furostanol saponins decreased gradually. Meanwhile, the contents of spirostanol saponins (25R-tribulosin and terrestrosin D) increased gradually. The data are shown in Table 2, compared with the contents of the 0-month group, CFT from three batches showed decreases in FOT of 34.45%, 36.03%, 31.63%, respectively; tribuluside A decreased by 29.87%, 16.77%, 28.06%, respectively; terrestrosin D increased by 34.45%, 36.03%, 31.63%, respectively; 25R-tribulosin increased by 23.80%, 29.52%, 28.47%, respectively.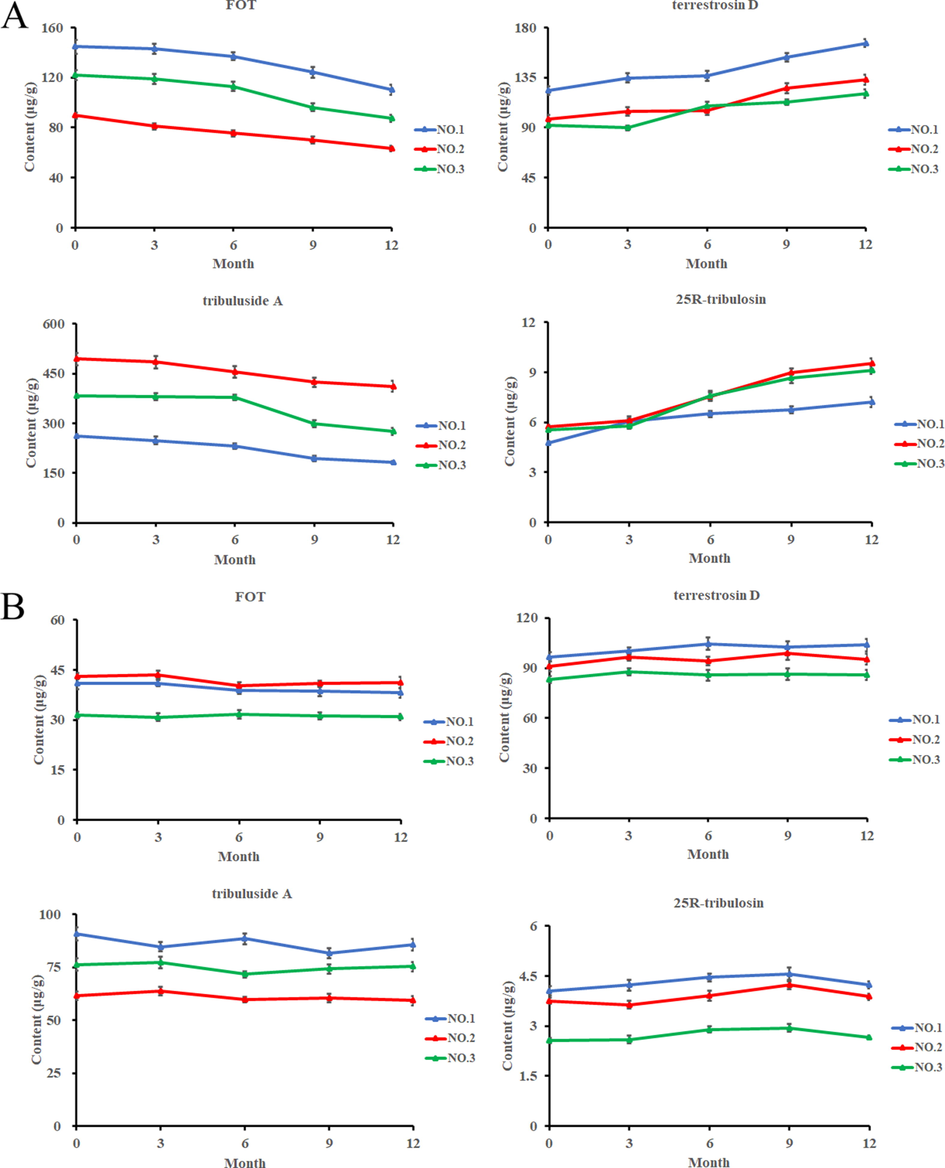
The contents change of four steroidal saponins in three batches of FT during storage at room temperature. CFT (A), SFT (B).
Analytes
FT
Batch
Content (μg/g)
0 month
3 months
6 months
9 months
12 months
tribuluside A
CFT
NO.1
261.27 ± 6.30
248.21 ± 11.44
230.74 ± 8.14
193.64 ± 8.41
183.22 ± 3.56**
NO.2
493.53 ± 18.77
484.12 ± 19.14
455.18 ± 17.36
423.63 ± 13.89
410.76 ± 16.00**
NO.3
382.68 ± 5.51
380.63 ± 9.91
377.74 ± 8.95
298.13 ± 10.16
275.31 ± 9.83**
SFT
NO.1
90.75 ± 3.17
84.72 ± 2.08
88 ± 2.40
81.68 ± 2.28
85.67 ± 2.66
NO.2
61.67 ± 2.08
63.70 ± 2.06
59.90 ± 1.29
60.52 ± 1.94
59.24 ± 2.22
NO.3
76.32 ± 3.04
77.42 ± 2.79
71.70 ± 1.48
74.22 ± 2.30
75.33 ± 2.27
25R-tribulosin
CFT
NO.1
4.76 ± 0.10
6.03 ± 0.18
6.50 ± 0.18
6.74 ± 0.20
7.21 ± 0.29**
NO.2
5.71 ± 0.12
6.11 ± 0.24
7.53 ± 0.25
8.96 ± 0.28
9.54 ± 0.30**
NO.3
5.56 ± 0.14
5.77 ± 0.16
7.59 ± 0.27
8.66 ± 0.31
9.12 ± 0.23**
SFT
NO.1
4.05 ± 0.14
4.23 ± 0.16
4.46 ± 0.11
4.57 ± 0.18
4.23 ± 0.10
NO.2
3.75 ± 0.09
3.64 ± 0.12
3.91 ± 0.15
4.23 ± 0.12
3.88 ± 0.09
NO.3
2.56 ± 0.08
2.60 ± 0.11
2.90 ± 0.10
2.94 ± 0.11
2.77 ± 0.04
FOT
CFT
NO.1
144.78 ± 5.62
142.90 ± 4.18
137.08 ± 3.21
124.17 ± 4.20
110.32 ± 3.88**
NO.2
89.69 ± 2.41
81.06 ± 2.44
75.41 ± 2.56
70.35 ± 2.77
63.21 ± 2.31**
NO.3
122.06 ± 3.97
118.88 ± 3.75
112.82 ± 3.72
96.26 ± 3.16
87.31 ± 2.66**
SFT
NO.1
40.89 ± 1.63
40.97 ± 0.88
38.85 ± 1.15
38.61 ± 1.49
38.04 ± 1.43
NO.2
43.04 ± 0.96
43.53 ± 1.17
40.30 ± 0.95
40.82 ± 0.93
41.21 ± 1.63
NO.3
31.44 ± 0.97
30.83 ± 1.21
31.67 ± 1.24
29.94 ± 0.83
30.89 ± 0.88
terrestrosin D
CFT
NO.1
123.48 ± 3.90
134.72 ± 4.22
136.21 ± 4.59
153.14 ± 3.94
166.02 ± 3.38**
NO.2
97.68 ± 3.47
104.63 ± 3.98
105.04 ± 3.89
125.00 ± 4.24
132.87 ± 4.62**
NO.3
91.66 ± 1.99
89.69 ± 2.15
109.54 ± 3.43
112.00 ± 2.61
120.65 ± 3.79**
SFT
NO.1
96.61 ± 2.88
100.00 ± 2.22
104.57 ± 3.85
102.57 ± 3.57
103.67 ± 3.49
NO.2
90.98 ± 3.01
96.33 ± 2.03
94.20 ± 2.56
98.60 ± 3.88
95.32 ± 3.42
NO.3
83.13 ± 2.24
87.65 ± 2.19
85.61 ± 3.31
86.42 ± 3.45
85.99 ± 3.02
3.2 Determination of β-glucosidase activity in CFT and SFT
From the spectra of CFT, a characteristic absorption peak of p-nitrophenol was observed at 401 nm in the CFT, while no such peak was observed for SFT (Fig. 3A). Statistical analysis of the data is shown in Fig. 3B, the enzyme activity indexes were significantly lower in the SFT group than that of the CFT group (p < 0.01).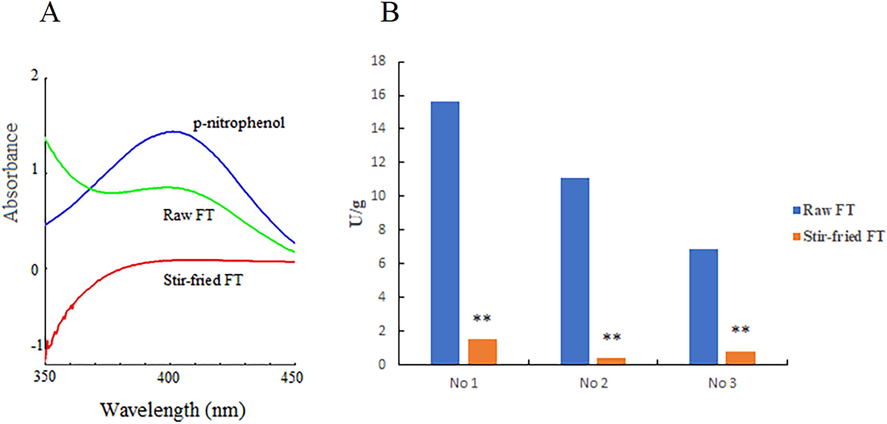
UV–VIS spectra (A). β-D-glucosidase enzymatic activity of raw FT and stir- fried FT (B).
3.3 Conversion of furostanol saponins by enzymatic hydrolysis
The enzymatic hydrolysates of furostanol saponins were qualitatively analyzed by UHPLC-Q-TOF/MS. The total ion chromatogram (TIC) is displayed in Fig. 4. The data are shown in Supplementary Table S3, peaks 1 – 4 were determined based on accurate mass, fragmentation pattern, retention time, and literature (Zhang et al., 2020).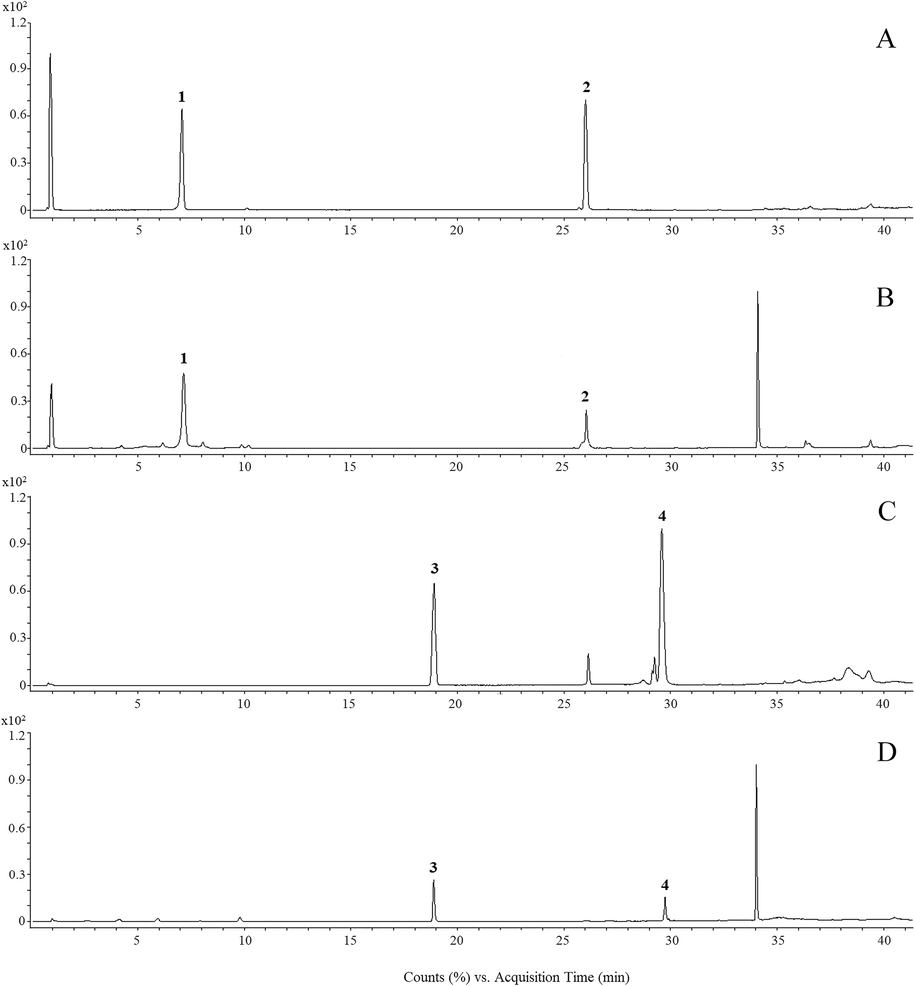
TIC of FOT, terrestrosin D (A), enzymatic hydrolysate of FOT (B), tribuluside A, 25R-tribulosin (C), and enzymatic hydrolysate of tribuluside A (D) in negative ion mode.
FOT (peak 1), terrestrosin D (peak 2), tribuluside A (peak 3), and 25R-tribulosin (peak 4) were clearly identified by comparison to the reference substances. The precursor ion (m/z 1047.4956 [M−H]-) of terrestrosin D were found in peak 2 (Fig. 4B). The precursor ion (m/z 1149.5686 [M−H]-) of 25R-tribulosin were found in peak 4 (Fig. 4D). The conversion was considered to proceed via enzymatic hydrolysis of the C-26-Glc. The proposed conversion pathway is presented in Fig. 5.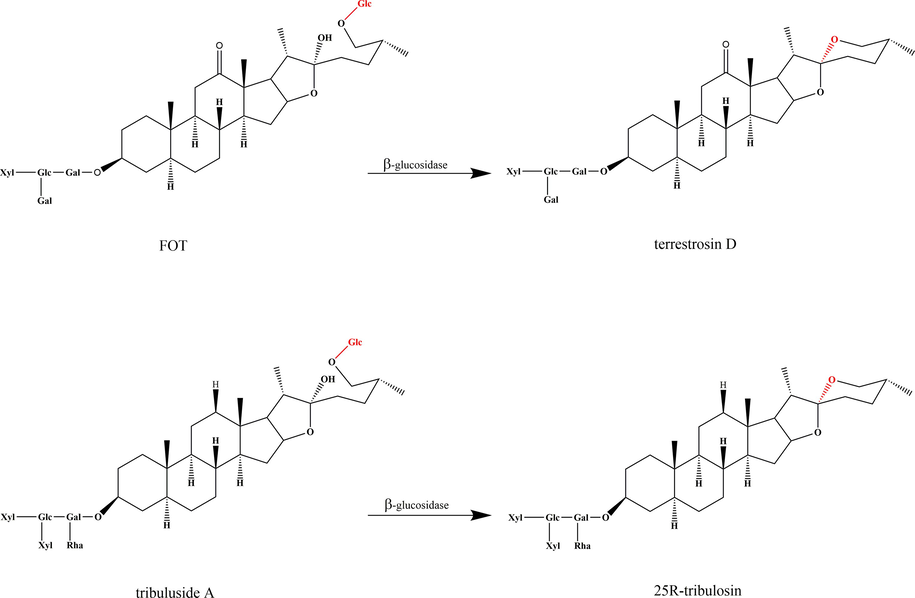
Proposed transformation pathway of FOT and tribuluside A during enzymatic hydrolysis.
3.4 Variations of steroidal saponins in different concentrations of ethanol elution
The TIC for FT-1 to FT-5 by UHPLC-Q-TOF/MS is displayed in Fig. 6. 31 steroidal saponins were determined by standard references, accurate mass, fragmentation pattern, retention time, and literature. The data are shown in Supplementary Table S4. In Fig. 6., peaks 1 – 25 are furostanol saponins, peaks 26 – 31 are spirostanol saponins. In the TIC, all furostanol saponins, mainly identified from FT-2 and FT-3, were distributed in the first 23 min of retention time. All spirostanol saponins, mainly identified from FT-4 and FT-5, were distributed in the retention times from 23 min to 35 min.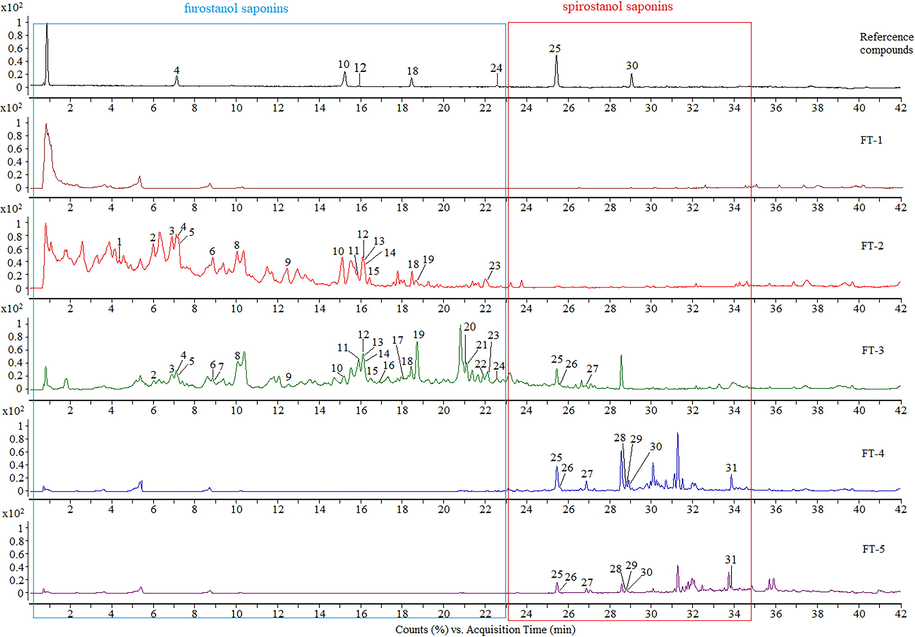
The TIC of a mixture of reference compounds and the ethanol eluates (FT-1 ∼ FT-5) in negative ion mode.
Two component pairs of furostanol saponins and spirostanol saponins with transformation relationships were selected for quantitative analysis. The contents of four steroidal saponins are shown in Table 3. The steroidal saponins were distributed regularly in different ethanol eluates. Furostanol saponins (FOT and tribuluside A) with high polarity were mainly present in FT-2 and FT-3, and spirostanol saponins (terrestrosin D and 25R-tribulosin) with low polarity were mainly present in FT-4 and FT-5. FT-1 did not contain any of the four steroidal saponins.
Analytes
Content (mg/g)
FT-1
FT-2
FT-3
FT-4
FT-5
FOT
——
3.77 ± 0.12
6.10 ± 0.14
0.32 ± 0.01
——
terrestrosin D
——
——
1.72 ± 0.06
20.35 ± 0.74
3.99 ± 0.16
tribuluside A
——
0.77 ± 0.03
7.17 ± 0.16
0.12 ± 0.01
——
25R-tribulosin
——
——
——
1.07 ± 0.05
0.15 ± 0.01
The data indicated that furostanol saponins (FOT and tribuluside A) were primarily found in FT-2 and FT-3, but the total content of FOT and tribuluside A in FT-3 was approximately 3 times higher than that of FT-2. Spirostanol saponins (terrestrosin D and 25R-tribulosin) were mainly present in FT-4 and FT-5, but the total content of terrestrosin D and 25R-tribulosin in FT-4 was approximately 5.2 times higher than that of FT-5. It can be concluded that, although furostanol saponins were distributed in both the FT-2 and FT-3, predominantly in the FT-3; spirostanol saponins were distributed in both the FT-4 and FT-5, but predominantly in the FT-4.
3.5 Evaluation of hepatorenal toxicity for ethanol eluate in vivo
No rats died during the experimental period. During the treatment period, the CTC and AAs group showed listlessness, reduced movement, loose stools, and yellow hair.
The data of body weight and food consumption are displayed in Fig. 7A, 7B. Compared with the control group, the body weight of CTC group decreased significantly from the 8 day to 12 day, the 22 day, and the 44 day to 48 day (p < 0.01). The weight of AAs group decreased significantly on the 10 day, the 22 day, and the 46 – 48 day (p < 0.01). The body weight of FT-4 group decreased significantly on the 10 day, and the 38 – 40 day (p < 0.05). The food consumption of CTC group showed a significant reduction at week 2 and week 7 during the treatment period (p < 0.01). AAs group decreased significantly at week 7 (p < 0.01). Moreover, a significant decrease was observed in FT-4 group at week 6 (p < 0.05).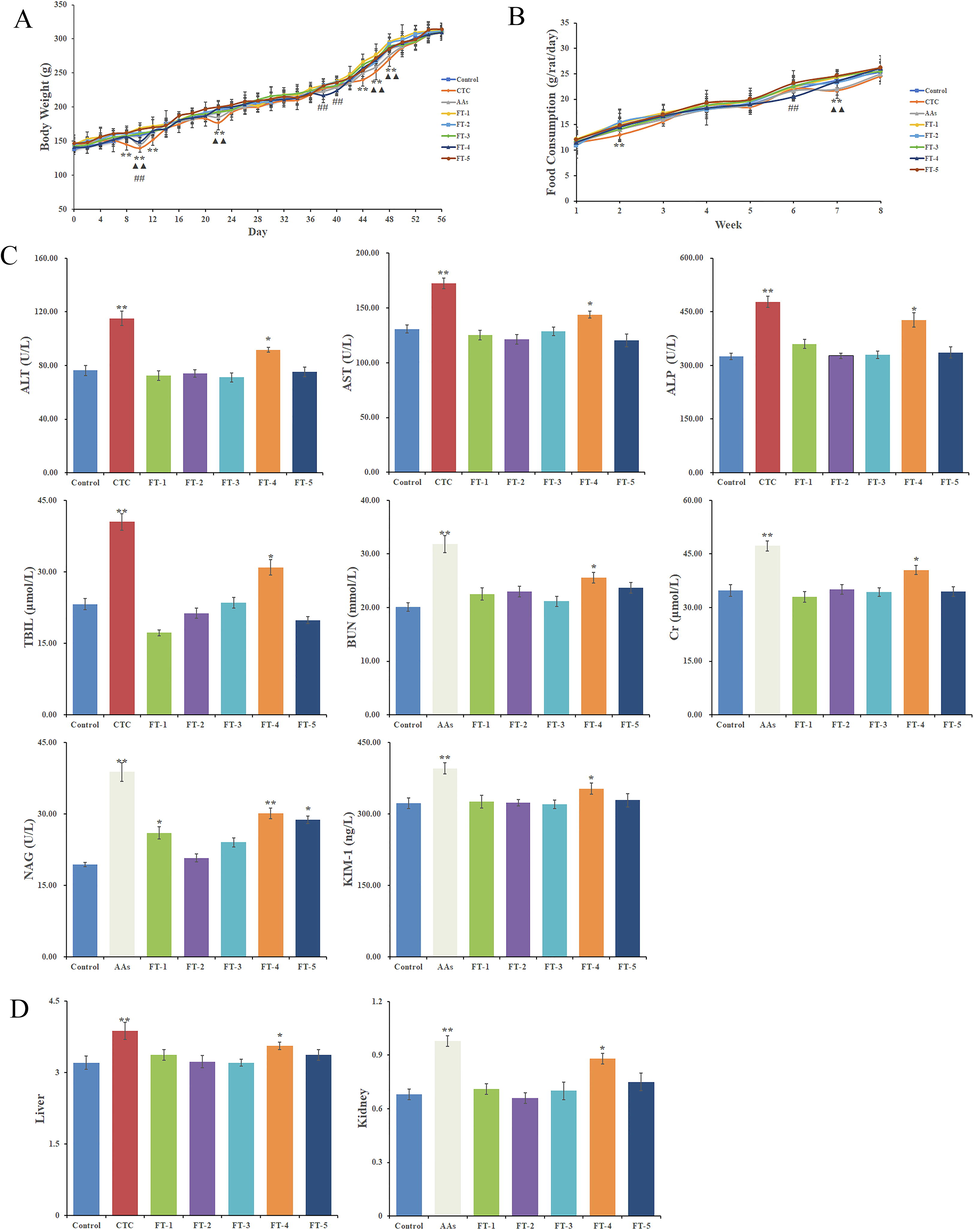
The body weights of rats (n = 10), compared with the control group: **Significant difference at CTC group p < 0.01 level; ▲▲Significant difference at AAs group p < 0.01 level; ##Significant difference at FT-4 group p < 0.05 level (A); The food consumption of rats, *Significant difference at CTC group p < 0.01 level; ▲▲Significant difference at AAs group p < 0.01 level; ##Significant difference at FT-4 group p < 0.05 level (B); The biochemical assays of rats, *p < 0.05, and **p < 0.01, relative to control group (C); The organ index of liver and kidney, *p < 0.05, and **p < 0.01, relative to control group (D).
The data of urinalysis and serum biochemistry are shown in Fig. 7C. Compared with the control group, the AAs group were significantly increased (p < 0.01) in urinalysis indexes (NAG, KIM-1) and kidney function indexes (BUN, CR), the CTC group were significantly increased (p < 0.01) in liver function indexes (ALT, AST, ALP, TBIL). All biochemical indexes in FT-4 were significantly increased (p < 0.05 or p < 0.01). There were no significant differences (p > 0.05) in the biochemical indexes of the FT-1, FT-3, and FT-5, except for NAG (p < 0.05). The results showed that 75% ethanol eluate had certain hepatorenal toxicity in rats.
The organ indexes of CTC group and AAs group were significantly increased (p < 0.01), and that of FT-4 group was increased (p < 0.05). Other groups had no significant difference (p > 0.05) (Fig. 7D).
Histopathological examinations of control group, FT-1 group, FT-2 group, and FT-3 group showed no abnormalities. The CTC group exhibited fatty degeneration of liver (indicated by the red arrow), dilated liver sinusoids (indicated by the blue arrow), and inflammatory cell infiltration (indicated by the black arrow). The inflammatory cells infiltrated, and a small amount of fatty degeneration were observed in FT-4 group. In FT-5 group, the structure of hepatic lobules was clear, and occasionally inflammatory cells infiltration. The AAs group exhibited the glomerular capillary loops hyperemia (indicated by the green arrow), denaturation of the renal tubular epithelial cells (indicated by the orange arrow), and inflammatory cell infiltration. In FT-4 group, a small amount of renal tubular distension (indicated by the purple arrow), and a small amount of inflammatory cell infiltration were found. The structure of the FT-5 group did not change significantly, and a small amount of inflammatory cell infiltration (Fig. 8).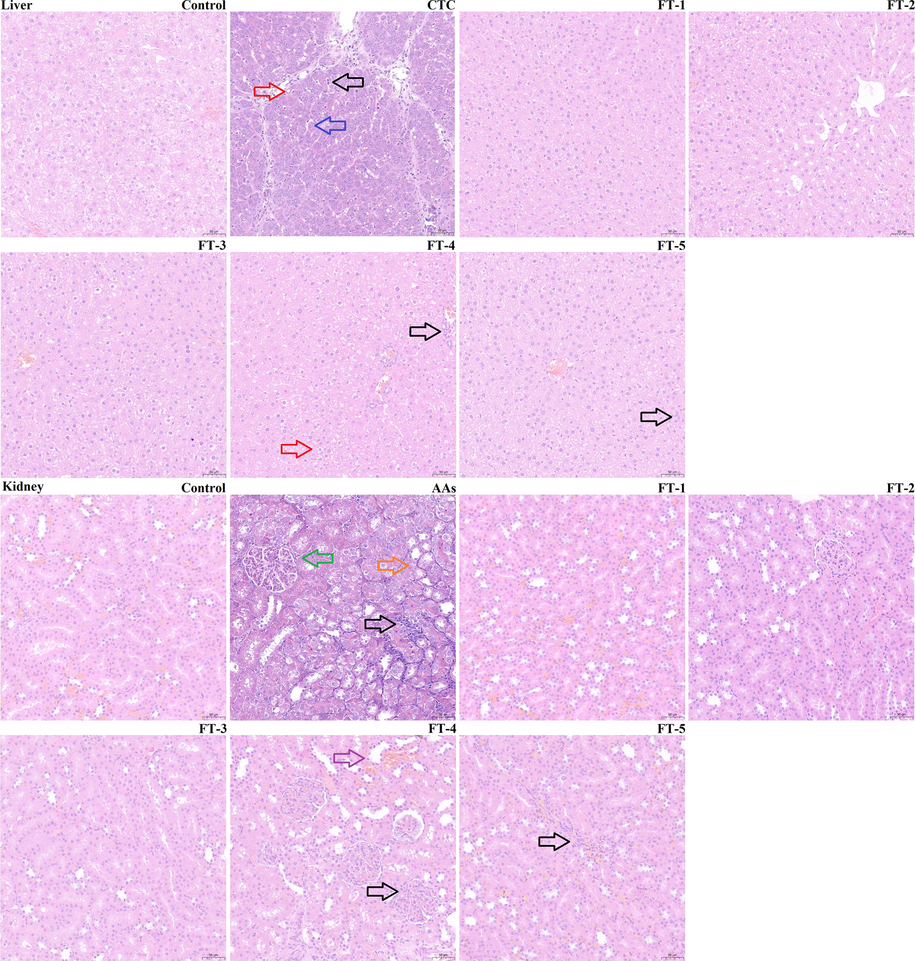
Histopathology of liver and kidney of rats after treatment with FT extract in comparison. Red arrow: fatty degeneration of liver; Blue arrow: dilated liver sinusoids; Black arrow: inflammatory cell infiltration; Green arrow: glomerular capillary loops hyperemia; Orange arrow: denaturation of the renal tubular epithelial cells; Purple arrow: renal tubular distension.
3.6 Evaluation of hepatorenal toxicity for FOT and terrestrosin D in vitro
The results revealed that FOT was inactive, while terrestrosin D displayed cytotoxicity against LO2 cells and 293 T cells with IC50 values of 16.88 μM and 21.80 μM, respectively. The inhibition rates of steroidal saponins on LO2 cells and 293 T cells are shown in Supplementary Table S5.
The flow cytometry data are showed in Fig. 9. Following treatment of LO2 cells and 293 T cells with FOT or terrestrosin D (41.3 μM) for 24 h, the necrosis rate of LO2 cells was 78.25 ± 9.12%, 8.6 ± 0.97%, respectively; the necrosis rate of 293 T cells was, 80.89 ± 8.77 %, 16.1 ± 1.54%, respectively. These data suggest that terrestrosin D triggers apoptosis and necrosis in LO2 cells and 293 T cells. However, FOT (41.3 μM) had no cytotoxicity on two cells.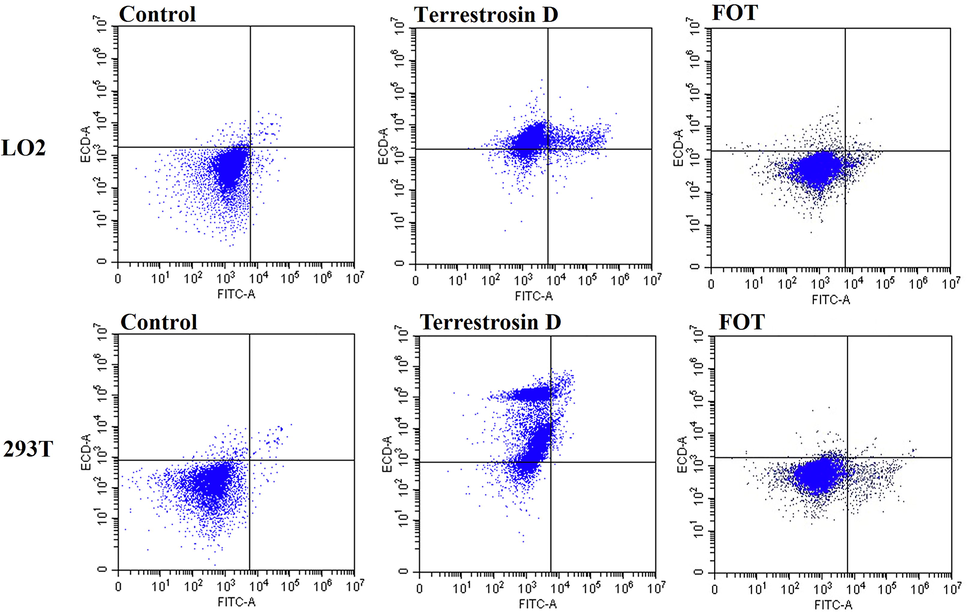
LO2 cells and 239 T cells were stained with annexin VFITC/PI, and then analyzed by flow cytometry.
4 Discussion
Processing of Chinese Materia Medica is a pharmaceutical technology adopted according to the theory of TCM, the needs of dialectical medication, the nature of the drug itself and the different requirements of dispensing preparations (Zhong and Li 2020). The main purposes of processing are to remove impurities, improve the Chinese herb’s efficacy, and reduce the Chinese herb’s toxicity and side effects. Our previous study has already found that SFT significantly reduced hepatorenal toxicity, which promoted us to discover the mechanism of “enzyme inactivation and toxicity reduction” of FT after being heating processed.
The C22-OH group in furostanol saponins, such as FOT and tribuluside A, is active and may be easily lost or substituted (Liang et al., 2002, Kite et al., 2007). During the stir-frying process, FOT and tribuluside A could transform into corresponding furostanol saponins with C-20-C-22 double bonds by dihydroxylation, while spirostanol saponins, such as terrestrosin D and 25R-tribulosin, could be converted into their aglycones by deglycosylation (Zhang et al., 2020). Therefore, the contents of FOT, tribuluside A, terrestrosin D, and 25R-tribulosin in CFT were higher than that of SFT. To the best of our knowledge, no study has shown that furostanol saponins with C-20-C-22 double bonds could cyclize the F-ring, and convert to the spirostanol saponins at room temperature. This suggests that the dehydroxylation reaction initiated by stir-frying process could also prevent the conversion of furostanol saponins to spirostanol saponins. However, there are trends in our data to suggest that furostanol saponins hydroxylated at C-22 were not completely converted to furostanol saponins with C-20-C-22 double bonds by stir-frying process. Our data show that with the extension of storage time at room temperature, the contents of spirostanol saponins (25R-tribulosin and terrestrosin D) in CFT increased significantly (p < 0.01), and the contents of furostanol saponins (FOT and tribuluside A) decreased significantly (p < 0.01), whereas the contents of 4 steroidal saponins in SFT had no significant change (p > 0.05). This is an interesting discovery. Although dehydroxylation and deglycosylation can explain the big difference in the contents of FOT, tribuluside A, terrestrosin D, and 25R-tribulosin between CFT and SFT, they cannot explain the new discovery of this paper. The previous studies reveal that dehydroxylation and deglycosylation usually occurs in high temperature (Ji et al., 2017), microbial (Quan et al., 2006) or acidic environment (Zhang et al., 2015). It is inferred that furostanol saponins hydroxylated at C-22, such as FOT and tribuluside A, cannot lose their C22-OH group and the contents of them cannot decrease by dehydroxylation or deglycosylation during long-time storage at room temperature. Why did furostanol saponins hydroxylated at C-22 decrease and spirostanol saponins increase after long-time storage at room temperature?
Inoue et al found that Costus speciosus (Koenig) Smith, a diosgenin-rich plant, contain β-glucosidase which could convert furostanol saponin, protogracillin, to spirostanol saponin, gracillin (Inoue and Ebizuka 1996, Inoue et al., 1996). Yang et al confirmed that a crude furostanol glycoside 26-O-β-glucosidase prepared from yam was removed the glucose at position C-26 of the furostanol glycoside structure and change it to the respective spirostanol glycoside (Yang et al., 2009). Another recent study reported β-glucosidase could effectively hydrolyze the C-26-Glc of turmeric steroidal saponins and convert them into diosgenin (Pang et al., 2015). Hence, we speculated that β-glucosidase, the biological enzyme coexisted in FT, could convert furostanol saponins to spirostanol saponins. In this paper, we performed enzymatic hydrolysis by furostanol saponins and β-glucosidase. From the results, it is clear that FOT and tribuluside A lost C-26-Glc, cyclized the F-ring, and respectively converted to terrestrosin D and 25R-tribulosin. The product of F-ring cyclization and before β-glucose bond breakage were not detected in the enzymatic hydrolysates. It is indicated that the product was unstable, and the F-ring was cyclized immediately after enzymatic hydrolysis and converted to the corresponding spirostanol saponins. It is consistent with the report (Tschesche et al., 1967).
“Enzyme inactivation” is a common phenomenon in the heating process of Chinese medicine. Tan et al found that the activity of myrosase in Brassica juncea(L.)Czern. et Coss. was destroyed significantly during stir-frying process (Tan et al., 2015). In this paper, activity of β-glucosidase in CFT and SFT was detected. The results confirm that the β-glucosidase in SFT was inactived in comparison to CFT.
In conclusion, when CFT is stored at room temperature for 12 months, furosterone saponins are transformed into corresponding spirosterone saponins in the action of β-glucosidase, which increased the content of spirosterone saponins by>30%. In SFT, the β-glucosidase was destroyed by stir-frying and it is blocked that the remaining furosterone saponins with C22-OH group converted to corresponding spirosterone saponins.
To verify the hypothesis in this paper, experiments must be carried out to compare the hepatorenal toxicity of furostanol saponins and spirostanol saponins, and the key issue in which was to solve the separation and preparation of furostanol saponins and spirostanol saponins. A method for the separation of furostanol saponins and spirostanol saponins by macroporous adsorption resin column was described, which mainly utilizes the difference in the polarity of the analytes (Li et al., 2017). First, the FT extract was adsorbed by macroporous adsorption resin column, and then eluted with a series of different concentrations of ethanol. Furostanol saponins were more polar and distributed in the low concentration ethanol, while spirostanol saponins were less polar and distributed in the high concentration ethanol. Furthermore, we added the concentration gradient of ethanol elution on the basis of the literature with a total of five gradients: water, 40% ethanol, 60% ethanol, 75% ethanol, and 95% ethanol to achieve a better separation of furostanol saponins and spirostanol saponins.
In most clinical settings, the extent of kidney injury is quantified by biomarkers such as BUN and CR (Roy et al., 2021). The levels of KIM-1 and NAG are specific and sensitive to kidney injury (Roy et al., 2021, Yang et al., 2021). In addition, levels of AST, ALT, ALP, and TBIL are markers for the assessment of liver injury (Mazumder et al., 2021). The liver and kidney are the primary organs for drug metabolism and excretion for drugs (Huang et al., 2021). In vivo experiment showed that FT-4 has significant hepatorenal toxicity. Other ethanol eluate has no hepatorenal toxicity, except urinalysis index NAG of FT-5. The qualitative and quantitative analysis of the five ethanol eluates (FT-1 to FT-5) were carried out in this paper. Spirostanol saponins were mostly concentrated in FT-4 due to its low polarity, conversely, furostanol saponins were present in trace amount. In FT-4, the content of spirostanol saponins (terrestrosin D and 25R-tribulosin) was about 48 times higher than that of furostanol saponins (FOT and tribuluside A). In FT-3, the content of spirostanol saponins (terrestrosin D and 25R-tribulosin) was only about an eighth of furostanol saponins (FOT and tribuluside A). The total content of terrestrosin D and 25R-tribulosin in FT-4 was approximately 5.2 times higher than that of FT-5, and about 12.5 times higher than that of FT-3. Correspondingly, the hepatorenal toxicity of FT-4 was much higher than that of FT-3 and FT-5, so it is inferred that furostanol saponins in FT have no hepatorenal toxicity, and spirostanol saponins are components with hepatorenal toxicity. Terrestrosin D, a spirostanol saponin, has the highest content in FT-4. So, we chose terrestrosin D and its corresponding furostanol saponin FOT as the research object to investigate its hepatorenal toxicity in vitro.
In vitro cell experiment indicated that terrestrosin D which displays a spirostanol saponin structure showed stronger cytotoxicity, whereas FOT, with a furostanol saponin structure, displayed no cytotoxicity. Thus, according to our results, the spirostanol saponins exhibits higher cytotoxicity than furostanol saponins, which is consistent with the literature (Xu et al., 2014). After orally administration, spirostanol saponins were metabolized into sapogenin by desugarization in the gastrointestinal tract, but in plasma and urine spirostanol saponins were still observed qualitatively and confirmed quantitatively (Tang et al., 2015). A recent study have shown that spirostanol saponins were observed to develop hepatorenal toxicity after oral administration (Sun et al., 2022). Furostanol saponins showed fast absorption into blood, but were maintained for a relatively short period, while the spirostanol saponins, such as dioscin and terrestrosin D, were absorbed into circulation more slowly, but increased gradually and lasted longer (Tang et al., 2015, Song et al., 2021). This may be one of the reasons for the spirostanol saponins rather than furostanol saponins with hepatorenal toxicity (Sun et al., 2022).
To the best of our knowledge, both steroidal saponins and triterpenoid saponins usually have a terminal absorption in UV detector, and the signals have low signal-to-noise ratio and severe baseline interference (Arslan and Cenzano, 2021). Additionally, the level of sensitivity to detect saponins by using evaporative light scattering detector or differential refractive index detector is not high. Therefore, LC-MS technique was used to determine steroidal saponins in this paper due to its high sensitivity and good accuracy.
The scientific connotation for “enzyme inactivation and toxicity reduction” of SFT was clarified: stir-frying could destroy β-glucosidase in CFT, and prevent the conversion of furostanol saponins without hepatorenal toxicity converted to spirostanol saponins with hepatorenal toxicity under different storage times at room temperature. The results of research can guide the harvesting, and processing of FT, improve the quality of processed products of FT, ensure the effectiveness and safety for clinical medication.
Acknowledgments
This work was supported by the Natural Science Foundation of Shandong Province, China (No. ZR2022MH009), a Project of Shandong Province Traditional Chinese Medicine Science and Technology Development Program (No.2019-0028), the National Key Innovative Talents Training Project of Traditional Chinese Medicine (National Education Letter of Traditional Chinese Medicine [2019] No.128), the Key Research and Development Plan of Shandong Province (No.2019GSF108171), and National Natural Science Foundation of China (No.81603298).
References
- Investigation on the toxic potential of Tribulus terrestris in vitro. Pharm. Biol.. 2015;53:469-476.
- [CrossRef] [Google Scholar]
- Tribulus terrestris: preliminary study of its diuretic and contractile effects and comparison with Zea mays. J. Ethnopharmacol.. 2003;85:257-260.
- [CrossRef] [Google Scholar]
- Characterization of Triterpene Saponins from Gypsophila arrostii by Electrospray Ionization Ion Trap Multiple-Stage Mass Spectrometry. Rev. Bras. Farmacogn.. 2021;31
- [CrossRef] [Google Scholar]
- Antibacterial activity of Tribulus terrestris methanol extract against clinical isolates of Escherichia coli. Herba Polonica.. 2016;62:57-66.
- [CrossRef] [Google Scholar]
- The alkaloids of Tribulus terrestris: A revised structure for the alkaloid tribulusterine. Acta Horticulturae. 2005;667:11-17.
- [CrossRef] [Google Scholar]
- Potential nephrotoxic effects produced by steroidal saponins from hydro alcoholic extract of Tribulus terrestris in STZ-induced diabetic rats. Toxicol. Mech. Methods. 2013;23:548-557.
- [CrossRef] [Google Scholar]
- Integrating metabolomics and network pharmacology to explore the protective effect of gross saponins of Tribulus terrestris L. fruit against ischemic stroke in rat. J. Ethnopharmacol.. 2020;263:113202
- [CrossRef] [Google Scholar]
- Medicinal properties, phytochemistry and pharmacology of Tribulus terrestris L. (Zygophyllaceae) Pak. J. Bot.. 2014;46:399-404.
- [Google Scholar]
- Altered integrity of hepatocyte tight junctions in rats with triptolide-induced cholestasis. Chin. J. Nat. Med.. 2021;19:188-194.
- [CrossRef] [Google Scholar]
- Purification and characterization of furostanol glycoside 26-O-β-glucosidase from Costus speciosus rhizomes. FEBS Lett.. 1996;378:157-160.
- [Google Scholar]
- Conversion of furostanol glycoside to spirostanol glycoside by β-glucosidase in Costus speciosus. Phytochemistry. 1996;41:725-727.
- [Google Scholar]
- Analysis of Chemical Variations between Crude and Salt-Processed Anemarrhenae rhizoma Using Ultra-High-Performance Liquid Chromatography-Mass Spectrometry Methods. Molecules. 2017;23
- [CrossRef] [Google Scholar]
- Aqueous extracts of Tribulus terrestris protects against oxidized low-density lipoprotein-induced endothelial dysfunction. Chin. J. Integr. Med.. 2016;22:193-200.
- [Google Scholar]
- Chromatographic behaviour of steroidal saponins studied by high-performance liquid chromatography-mass spectrometry. J. Chromatogr. A. 2007;1148:177-183.
- [CrossRef] [Google Scholar]
- Li, X. W., W. J. Wang and Y. R. Jin, 2017. A kind of method for preparing total furostanol saponins and total spirostanol saponins from tribulus terrestris.
- Structural characterization of steroidal saponins by electrospray ionization and fast-atom bombardment tandem mass spectrometry. Rapid. Commun. Mass. Sp.. 2002;16:1168-1173.
- [CrossRef] [Google Scholar]
- Extraction and enzymatic properties of β-glucosidase in leaves of Baphicacanthus cusia. Chin. Trad. Herbal Drugs.. 2010;41:1461-1464.
- [Google Scholar]
- Tribulus terrestris extracts alleviate muscle damage and promote anaerobic performance of trained male boxers and its mechanisms: Roles of androgen, IGF-1, and IGF binding protein-3. J. Sport Health Sci.. 2017;6:474-481.
- [CrossRef] [Google Scholar]
- Antidiabetic profiling, cytotoxicity and acute toxicity evaluation of aerial parts of Phragmites karka (Retz.) J. Ethnopharmacol.. 2021;270:113781
- [CrossRef] [Google Scholar]
- Conversion of furostanol saponins into spirostanol saponins improves the yield of diosgenin from Dioscorea zingiberensis by acid hydrolysis. RSC Adv.. 2015;5:4831-4837.
- [CrossRef] [Google Scholar]
- An insight into the anticancer mechanism of Tribulus terrestris extracts on human breast cancer cells. 3. Biotech.. 2019;9:58.
- [CrossRef] [Google Scholar]
- Terrestrosin D from Tribulus terrestris attenuates bleomycin-induced inflammation and suppresses fibrotic changes in the lungs of mice. Pharm. Biol.. 2019;57:694-700.
- [CrossRef] [Google Scholar]
- Effect of long term administration of stir-fried Tribuli Fructus on liver and kidney toxicity of rat. Shandong. J. Tradit. Chin. Med.. 2016;35 10.16295/j.cnki.0257-358x.2016.04.025
- [Google Scholar]
- The Microbiological Transformation of Protodioscin by Aspergillus oryzae. Chin. J. Nat. Med. Sep.. 2006;4:377-381.
- [Google Scholar]
- Polymyxin B-Induced Kidney Injury Assessment of a Novel Formulation of Polymyxin B (VRP-034) in Rats. Antibiotics (Basel).. 2021;10
- [CrossRef] [Google Scholar]
- Acute kidney injury and hyperbilirubinemia in a young male after ingestion of Tribulus terrestris. Clin. Nephrol.. 2015;83:177-183.
- [CrossRef] [Google Scholar]
- Pharmacokinetic comparisons of six steroid saponins in rat plasma following oral administration of crude and stir-fried Fructus Tribuli extracts by UHPLC-MS/MS. Biomed. Chromatogr.. 2021;35:e5151
- [CrossRef] [Google Scholar]
- Terrestrosin D, a spirostanol saponin from Tribulus terrestris L. with potential hepatorenal toxicity. J. Ethnopharmacol.. 2022;283:114716
- [CrossRef] [Google Scholar]
- Tribulus terrestris-induced severe nephrotoxicity in a young healthy male. Nephrol. Dial. Transplant.. 2010;25:3792-3793.
- [CrossRef] [Google Scholar]
- Determination of myrosase activity in Brassica juncea(L)Czern. et Coss and effect of processing on myrosase activity. Hunan. J. Tradit. Chin. Med.. 2015;31:175-176.
- [CrossRef] [Google Scholar]
- UPLC-QTOF-MS identification of metabolites in rat biosamples after oral administration of Dioscorea saponins: a comparative study. J. Ethnopharmacol.. 2015;165:127-140.
- [CrossRef] [Google Scholar]
- Anti-inflammatory activity in vitro, extractive process and HPLC-MS characterization of total saponins extract from Tribulus terrestris L. fruits. Ind. Crops Prod.. 2020;150:112343
- [CrossRef] [Google Scholar]
- Uber sarsaparillosid, ein saponinderivat mit bisglykosidischer furostanolstruktur. Tetrahedron Lett.. 1967;8:2785-2790.
- [Google Scholar]
- Terrestrosin D, a steroidal saponin from Tribulus terrestris L., inhibits growth and angiogenesis of human prostate cancer in vitro and in vivo. Pathobiology. 2014;81:123-132.
- [CrossRef] [Google Scholar]
- Effect of long-term toxicity test of 24 toxic Chinese herb on organ index in rats. J. Basic Chin. Med.. 2006;12:35-37.
- [Google Scholar]
- Four new furostanol saponins from the rhizomes and roots of Smilax scobinicaulis and their cytotoxicity. Molecules. 2014;19:20975-20987.
- [CrossRef] [Google Scholar]
- Effect of endogenous glycosidase on stability of steroidal saponins in Taiwanese yam (Dioscorea pseudojaponica yamamoto) during drying processes. Food Chem.. 2009;113:155-159.
- [CrossRef] [Google Scholar]
- Pharmacokinetics-based chronoefficacy of Fuzi against chronic kidney disease. J. Pharm. Pharmacol.. 2021;73:535-544.
- [CrossRef] [Google Scholar]
- Study on transformation rules of terrestrosin D in course of Tribuli Fructus stir-frying based on simulated processing technology. China J. Chin. Mater. Med.. 2019;44:3049-3054.
- [CrossRef] [Google Scholar]
- Analysis of variations in the contents of steroidal saponins in Fructus Tribuli during stir-frying treatment. Biomed. Chromatogr.. 2020;34:e4794
- [CrossRef] [Google Scholar]
- Antidepressant effect and mechanism of Gross saponins of Tribulus terrestris. Chinese Pharmacological Bulletin.. 2017;33:343-348.
- [Google Scholar]
- Advances of Studies on Biotransformation of Steroidal Saponins. Prog. Modern Biomed.. 2015;15:4391-4393.
- [CrossRef] [Google Scholar]
- Processing of Chinese Materia Medica. China Medical Science Press; 2020.
Appendix A
Supplementary data
Supplementary data to this article can be found online at https://doi.org/10.1016/j.arabjc.2022.103892.
Appendix A
Supplementary data
The following are the Supplementary data to this article:Supplementary data 1
Supplementary data 1


