

Translate this page into:
The study of ion transport parameters associated with dissociated cation using EIS model in solid polymer electrolytes (SPEs) based on PVA host polymer: XRD, FTIR, and dielectric properties
⁎Corresponding author at: Hameed Majid Advanced Polymeric Materials Research Lab, Physics Department, College of Science, University of Sulaimani, Qlyasan Street, Sulaimani 46001, Kurdistan Regional Government, Iraq. shujahadeenaziz@gmail.com (Shujahadeen B. Aziz)
-
Received: ,
Accepted: ,
This article was originally published by Elsevier and was migrated to Scientific Scholar after the change of Publisher.
Peer review under responsibility of King Saud University.
Abstract
Electrical impedance spectroscopy (EIS) model is used to determine ion transport parameters. The transport parameters such as mobility, carrier density and diffusion coefficient of ions are the subject of great interest. The solution cast method is used to fabricate SPEs using polyvinyl alcohol (PVA) loaded with different amounts of sodium iodide (NaI). XRD deconvolution is used to separate the crystalline phase from amorphous phase. The degree of crystallinity is reduced with an increased amount of NaI. FTIR is used to investigate the polymer/salt interactions. To find out the circuit element, the Nyquist plots of impedance results are fitted with EEC modeling. The bulk resistance obtained from the EEC modeling is used to determine DC conductivity. At room temperature the maximum conductivity of is measured. The regions belong to the electrode polarization (EP) effect are distinguished form the spectra of dielectric constant and dielectric loss. Due to the buildup of charge carriers, the dielectric constant and loss are observed to be high at the low-frequency region. Obvious peaks are appeared in the tanδ and M“ spectra at high salt concentrations. Shifting of the tanδ peaks to the high frequency region are detected. The incomplete circular arc of the argand plot is shown the non-Debye relaxation. It is found that with increasing frequency, AC conductivity increased. The regions belong to the EP and DC contributions are differentiated in the AC spectra.
Keywords
PVA solid electrolyte
XRD deconvlution
FTIR analysis
Impedance and EEC modeling
Ion transport parameters
Dielectric and electric modulus
AC conductivity

1 Introduction
Since the pioneering work of Wright (1975) and Armand et al. (1979). SPEs (solid polymer electrolytes) have received a great deal of study. The typical organic sol–gel electrolyte has been replaced by a new family of electrolyte materials known as SPEs. Their great durability, safety, processability, flexibility, and electrochemical and dimensional stability make them ideal for use in the food industry (Aziz, 2013). When alkali metal salts with low dissociation energy are dissolved in polar polymers, polymer electrolytes (PEs) are formed, and they can be employed in a variety of electrochemical devices (Aziz et al., 2016). Dissolving metal salts in a polymeric matrix and breaking them apart into cations and anions may be used to create PEs. These polymers have gotten a great attention because of their possible application in electro-chemical devices (Kim et al., 2004).
Because SPEs have been employed in lithium batteries and other electrochemical devices, many researchers are interested in their development (Jaafar et al., 2011). SPEs provide several benefits over liquid electrolytes, including Strong mechanical qualities, simplicity of thin-film manufacturing, and the ability to create good electrode–electrolyte interaction (Aziz, 2013). Electrolyte conductors made of conducting PEs are often made of polyvinyl alcohol (PVA): pure polymers (Lim et al., 2014; Radha et al., 2013; Hema et al., 2009) and blended polymer including polyvinyl pyrrolidone (Sundaramahalingam et al., 2019), arginine (Bhuvaneswari et al., 2115) and carboxymethyl cellulose (Mazuki et al., 2020). As a PE reformulator PVA has a number of positive properties that include semi-crystalline, non-toxicity, appropriate strength, and sufficient charge storage capacity (Liew et al., 2015; Liew et al., 2014). Biopolymers are polymers derived from naturally occurring sources. Using PVA as a host polymer for electrolyte synthesis is an attractive option, and it has previously been utilized in batteries and direct methanol fuel cells (Ming Yang and Chih Chiu, 2012). Responsive chemical functional groups abound in this hydrophilic polymer (Aziz, 2016). SPEs as a part of condensed matter physics have been widely explored in terms of ion relaxation and charge transfer processes (Aziz, 2013). Ion conducting electrolytes are often regarded as the brains of electrochemical devices. For electrochemical applications like batteries and supercapacitors, previous research has shown that the electrical properties of electrolytes must be determined. They may then be chosen for a certain application based on their DC conductivity. Few attempts have been undertaken to synthesize PVA-based SPEs complexed with sodium ions, according to a comprehensive literature assessment (Bhargav et al., 2007; Bhargav et al., 2007; Bhargav et al., 2009). The purpose of investigating the conduction process in polymer-based electrolytes is to obtain a better understanding of the nature of ion transport (Sheha and El-Mansy, 2008). There are also continuing efforts to increase the conductivity of various salts and polymers at room temperature. A lot of attention has been paid to Li salts complexed polymer electrolytes. PES containing sodium salts have only been tested in a few of studies.
Bhargav et al. (2007) prepared sodium ion conducting PE based on PVA comined with NaI using solution cast technique. The authors showed that the amorphous phase of PVA and conductivity increased by increasing the NaI salts dute the decrease of the degree of crystallinity. The maximum conductivity of 1.02 × 10⁻⁵ at 303 K achieved in their study for the PVA:NaI (70:30) wt. %. Hmamm (2020) fabricated PVA doped with different NaI amount. The authors showed that the degree of crystallinity decreased with the increase of the NaI salts. They also showed that the conductivity increased with increasing NaI amount. The similar behavior was reported by Makled et al. (2013) who indicated that the DC conductivity of PVA/CuI increased by increasing CuI mole fraction. Farah et al. (2019) synthesized SPE based on PVA, sodium trifluoromethanesulfonate (NaTf) salt, and 1-butyl-3-methylimidazolium bromide (BmImBr) ionic liquid. The authors found that the optimum weight ratio between NaTf salt and PVA to obtain maximum conductivity was 40:60. They showed that 50 wt% BmImBr into the PVA60 improved the ionic conductivity at room temperature from 4.87 × 10⁻⁶ S/cm to 2.31 × 10⁻³ S/cm.
Lithium is more scarce and costly, whereas sodium is more plentiful and cheaper. In addition, the pliability of these materials facilitates the establishment and maintenance of contact with other battery components (Subba Reddy et al., 2006). This study uses AC impedance spectroscopy, an essential technique for assessing electrical and dielectric characteristics of materials, to explore conductivity and relaxation processes connected to ion mobility. Recently research on relaxation and ion transport mechanisms in polymer electrolytes are the subject of great debate using various models. In the current study ion transport and relaxation dynamics are fouced in NaI ion conducting PVA-based SPE.
2 Experimental
2.1 Sample preparation
1 g of polyvinyl alcohol (PVA) dissloved in distilled water (D.W) at 90 °C for 65 min and then cooled to room temperature. NaI was dissolved in D.W and then (10, 20, 30, 40, 50 wt%) of NaI were added to the PVA solution under constant stirring at room temperature. Table 1 listed the fabricate samples. PVNA1, PVNA2, PVNA3, PVNA4, and PVNA5 are the codes of the SPE films. After additional stirring to ensure obtaining homogeneity, the solutions were placed in the plastic Petri dishes and dried at room temperature. SPE films were dryed for around 2 weeks at room temperature. For more clarification, the pictorial fabrication processes and picture of the electrolyte films for the fabricated SPE are shown in Fig. 1.
Sample Designation
PVA (1 g)
NaI (wt%)
NaI (g)
PVNA1
1
10
0.111
PVNA2
1
20
0.250
PVNA3
1
30
0.428
PVNA4
1
40
0.666
PVNA5
1
50
1
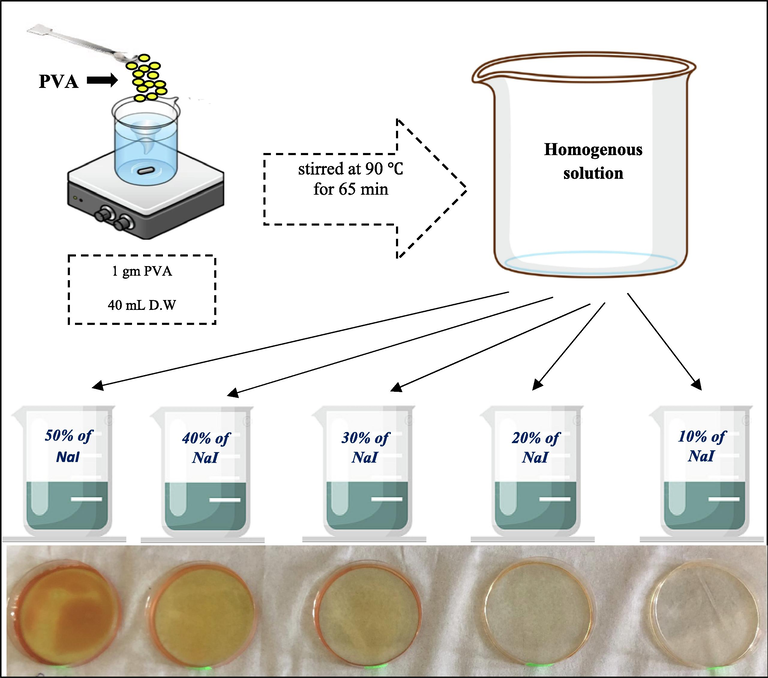
Fabrication process of SPEs and image of the electrolyte films.
2.2 X-ray diffraction (XRD) investigation
X-ray diffraction (XRD) patterns were obtained using (X'PERT-PRO) X-ray diffractometer with operating of current 40 mA and voltage 40 kV, to explore the nature of complexation between NaI and PVA. CuK X-rays of wavelength 1.5406 Ao were used for scanning the materials, and the glancing angles ranged from 10° to 70°, and the diffraction step size was 0.1°.
2.3 Fourier transform infrared (FTIR) study
The samples were subjected to FTIR spectroscopy in order to look for any probable interactions between distinct chemical groups. The films were measured using a Nicolet iS10 FTIR spectrophotometer between 400 and 4000 cm−1 with a resolution of 2 cm−1 (Perkin Elmer, Melville, New York, United States). FTIR spectroscopy was used to investigate the polymer electrolyte's ion conduction mechanism (Nicolet 380 spectrometer).
2.4 Electrochemical impedance spectroscopy (EIS)
An impedance spectroscopy model HIOKI 3532–50 LCR HiTESTER linked to a computer was utilized to do the conductivity measurements. The thickness of the films, which sandwiched between two stainless steel electrodes with a diameter of 2.05 cm, was measured using a micrometer screw gauge under spring tension.The EIS tests were carried out at ambient temperature with a signal intensity of 10 mv and frequency ranges from 100 Hz to 2 MHz. The negative imaginary component of ( ) was plotted against positive impedance ( ), when analysing the data obtained. Intercept at ( ) gives the bulk resistance ( ).
3 Result and discussion
3.1 FTIR study
Composition, structure, and interactions between the functional groups of PVA and NaI salts were studied using FTIR spectroscopy, which was used to analyse variations in the location of IR transmittance bands between 400 and 4000 cm−1. As can be seen in Fig. 2, PVA polymer with various NaI wt. % ratios is seen in the 400–4000 cm−1 wavenumber. Vibrational frequencies that differentiate the PVA polymer are the OH, C—O, CH2, CH3, and C⚌O bands (Nofal, et al., 2021). C⚌O stretching of carboxyls is connected to the 1709 cm−1 stretching absorption band. Carboxyls are believed to form hydrogen bonds with hydroxyl or other carboxyl groups in the films, either intramolecularly or intermolecularly (Kumari et al., 2012). Because of the creation of a complexation between the host polymer and the added NaI salt, hydroxyl group absorption frequency changes. The stretching absorption band at 1709 cm−1 is ascribed to the carboxyl C⚌O stretching. In the films, hydrogen bonds between carboxyl groups and hydroxyl groups or other carboxyl groups are expected to be the most common (Choo et al., 2016). The noticeable reduction in transmittance intensity as well as band shifting show the interactions between the host polymer's functional groups and the salt cations. Salt cations and functional groups interact electrostatically, reducing the vibration of polar groups (Choo et al., 2016; Negim, 2014; Gh et al., 2016).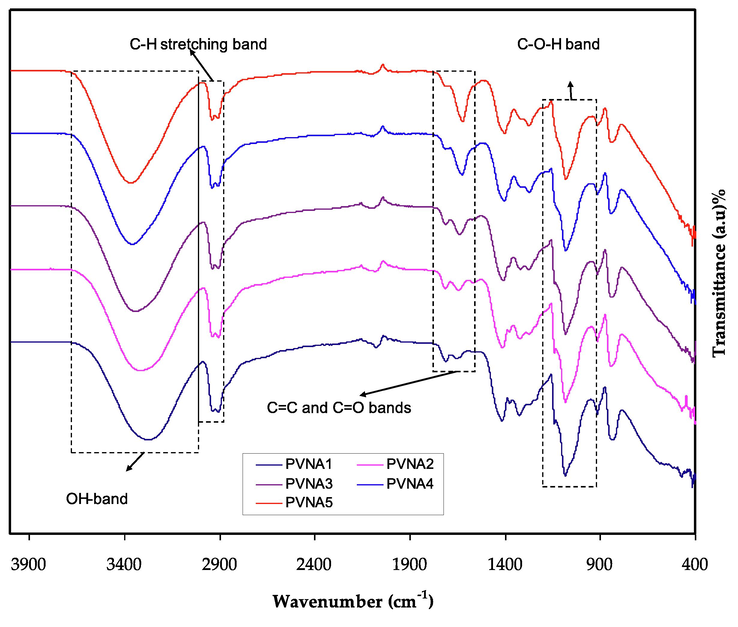
FTIR spectrum for PVA:NaI polymer electrolytes.
3.2 XRD analysis
The XRD technique is used to determine the structure and crystallinity of the prepared sample. As reported in ref. (Brza, 2020) and ref. (Abdelghany, 2020), for pure PVA a sharp board peak at 2⊖=19.5 correlates to the lattice plane (1 1 0) which shows the semi-crystalline character of PVA. PE's amorphous structure is likely to improve by adding salt to the polymer. The connection between DC conductivity ( ) and degree of amorphous nature is connected to the amorphous structure's higher ionic mobility and diffusivity of ions due to low energy barriers (Brza et al., 2020). Backbones of polymers with an amorphous structure are more flexible and have more segmental motion of the chains. Due to the electrical field (EF) effect, the segmental movement in the amorphous structure improves ionic movement by generating and breaking the solvated ions coordination sphere and providing more free space or volume in which the ions can diffuse (Malathi et al., 2010; Rangasamy et al., 2019).
The XRD deconvolution for the pure PVA and PVA/NaI SPE systems are depicted in Figs. 3 and 4, respectively. The deconvolution technique is useful for determining a material's microcrystalline characteristics (Zulkifli et al., 2020). This method is based on an algorithm that allows the crystalline and amorphous peak to be separated (Zainuddin, 2018). Table 2 lists the percentage of crystallinity (
) which is calculated using Eq. (1).
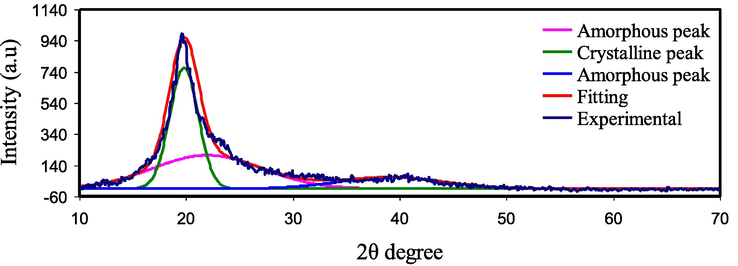
XRD for pure PVA film.
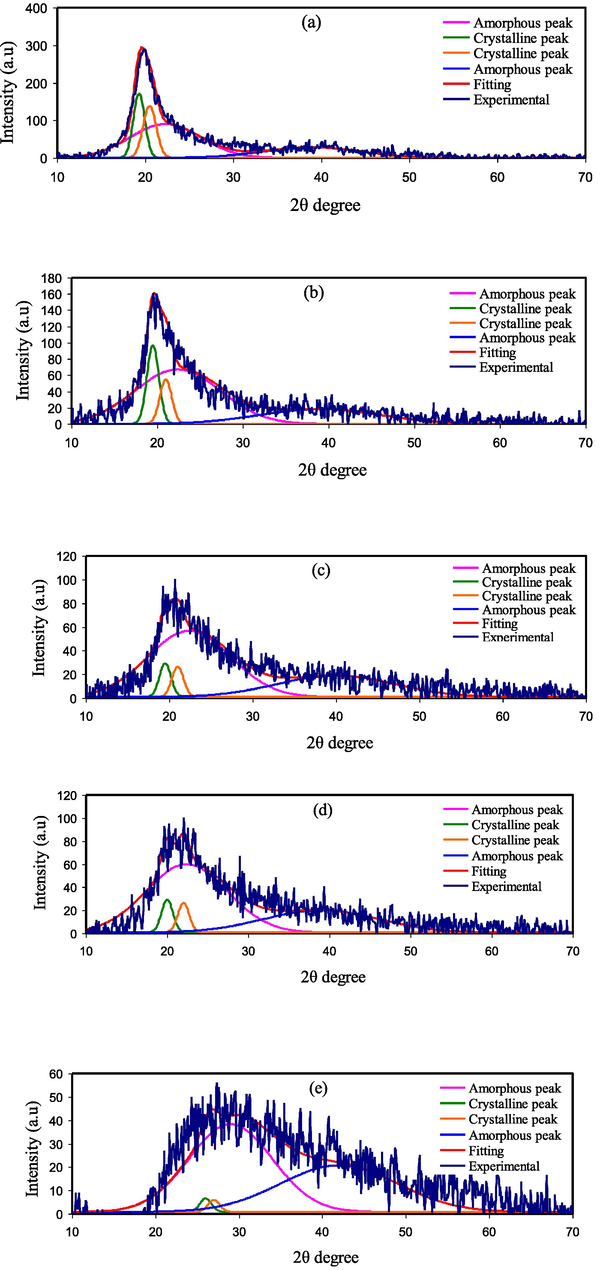
XRD deconvolution curves for SPEs a) PVNA1, b) PVNA2, c) PVNA3, d) PVNA4, and e) PVNA5.
Electrolyte
Degree of crystallinity (%)
Pure PVA
41.68
PVNA1
29.5
PVNA2
18.65
PVNA3
8.52
PVNA4
8.08
PVNA5
2.26
3.3 Impedance and ion transport parameters study
An understanding of the charge transfer process in ion conducting materials is essential from both a basic and technical viewpoint. Because of this, impedance spectroscopy has been developed (Machappa and Ambika Prasad, 2009; Abdullah et al., 2021; Aziz et al., 2019). It is the method of choice for researching the process. An ion-conducting membrane is a novel form of polymer that is the subject of this study. This has sparked the attention of several research teams over the last few years since their applications in various types of solid-state electrochemical devices are becoming more widespread (Nasef et al., 2007). The impedance data for the pure and electrolyte films are shown in Fig. 5 and Fig. 6 (a-e), respectively. Carrier conduction in the bulk of the system is related to the semicircles (Aziz et al., 2010). According to Malathi et al., the DC conductivity at the bulk is responsible for the parallel relationship between bulk resistance (
) and capacitance (Malathi et al., 2010). The straight line is seen at the low-frequency regions (i.e., spike). The spike is formed by the motion of ions at the blocking electrodes (Malathi et al., 2010; Selvasekarapandian et al., 2005; Aziz et al., 2010; Aziz et al., 2019; Aziz, 2018).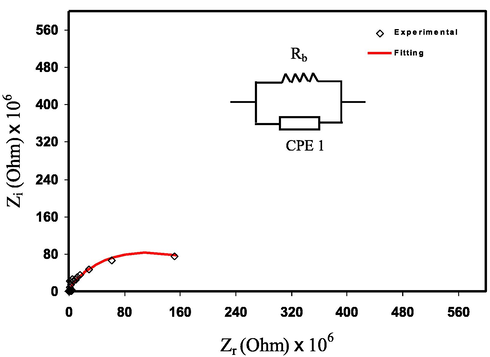
EIS for pure PVA.
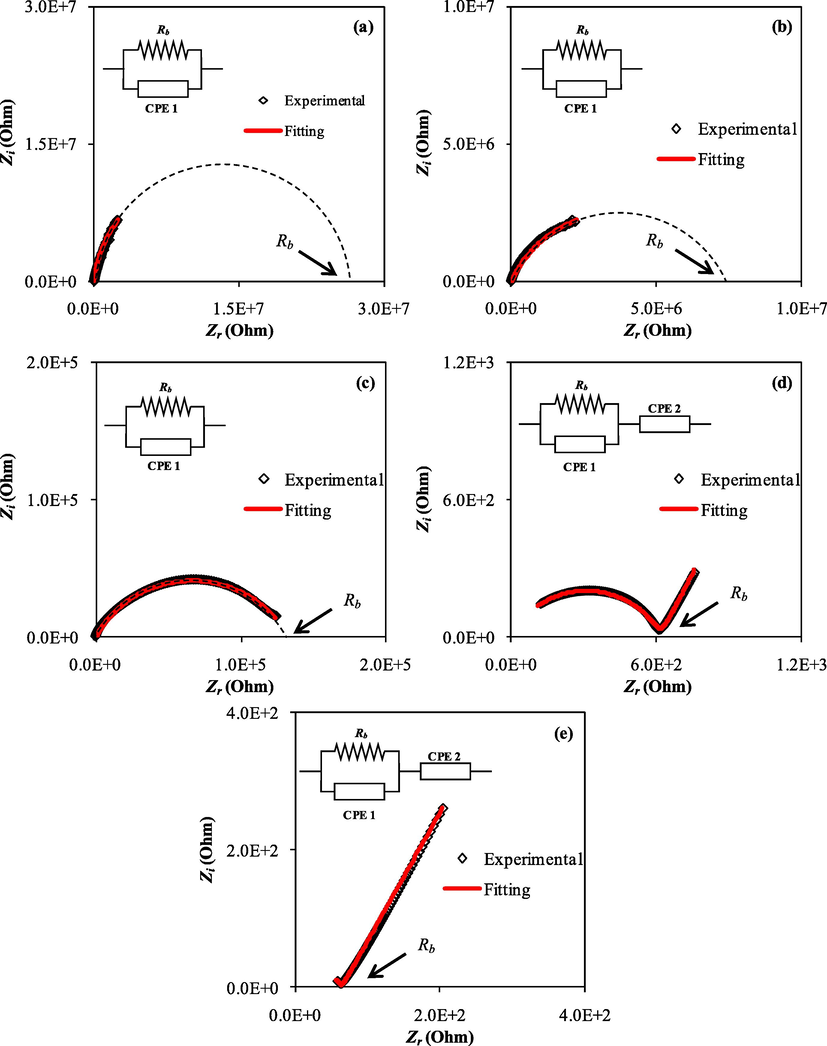
Nyquist plots for the a) PVNA1, b) PVNA2, c) PVNA3, d) PVNA4, and e) PVNA5.
Ion diffusion occurs across the membrane when an AC electric field is applied to the membrane electrolytes, resulting in ion accumulation at the electro/electrolyte interface. The stainless-steel electrodes' electronic nature prevents ions to pass through it, therefore the real and imaginary components of the impedance may be measured at various frequencies, resulting in impedance graphs. By crossing the spike with the plot's real axis, it was measured the values from the data analysis.
The following equation can be used to calculate DC conductivity (σdc) values:
Sample
p1 (rad)
p2 (rad)
CPE1(F)
CPE2 (F)
Conductivity (S
Pure PVA
0.79
2.78 × 10⁻¹¹
2.87 × 10⁻¹¹
PVNA1
0.94
3.03 × 10⁻¹⁰
5.61 × 10⁻¹⁰
PVNA2
0.74
2.00 × 10⁻⁹
1.99 × 10⁻⁹
PVNA3
0.71
1.05 × 10⁻⁸
1.16 × 10⁻⁷
PVNA4
0.74
0.71
2.86 × 10⁻⁸
3.13 × 10⁻⁵
2.51 × 10⁻⁵
PVNA5
0.71
0.69
3.13 × 10⁻⁸
4.03 × 10⁻⁵
2.41 × 10⁻⁴
The electrical equivalent circuit (EEC) model is used to fit the impedance data as shown in Fig. 5 and Fig. 6 (a-e) (Pradhan et al., 2011). The EEC model contains two constant phase elements (CPE1 and CPE2) and Rb. As seen in the inset of the Figures the EEC model consists of a parallel combination of Rb and CPE1 and it is in series with the CPE2 (Shukur et al., 2014). Pure PVA shows a semicircle only as the ions have not been added yet. A semicircle is only seen in the Fig. 6 (a-c) due to the motion of ions in the bulk of the electrolyte while a spike is also emerged owing to the motion of ions at the electrode and electrolyte interfaces as seen in Figure (d, e).
ZCPE's impedance is calculated as (Teo et al., 2012; Aziz and Abdullah, 2018):
While for the Fig. 6 (d and e), the values of Zr and Zi associated with the equivalent circuit (insets of Fig. 6 (d, e)) can be expressed as:
Table 3 represents the circuit element parameters for all samples. It's important to note that when the concentration of NaI increases, the conductivity is increased. Pure PVA has a conductivity of 2.87 × 10⁻¹¹ S/cm while the conductivity is noticeably increased to 2.41 × 10⁻⁴ S/cm for the sample loaded with 50 wt% NaI (PVNA5) due to the dissociation of more ions in the system.
Ion transport parameters are critical aspects that should be taken into account for energy storage device applications. For the PVNA4 and PVNA5 samples the number carrier density (n), diffusion coefficient (D), and mobility (μ) are determined using the following relationships (Arof, 2013; Electrolytes, 2022):
The diffusion coefficient (D) of ions is determined using Eq. (9).
The Boltzmann constant and absolute temperature are denoted by and , respectively.
The number density of ions (n) is determined using Eq. (11).
It is seen in Table 4 the mobility and diffusion coefficient of ions improved with icreasing NaI concentration as more salts are dissocitaed to free cations and anions.
Sample
D
μ (
)
N
PVNA1
–
–
–
PVNA2
–
–
–
PVNA3
–
–
–
PVNA4
1.33 × 10⁻¹²
5.18 × 10⁻¹¹
3.02 × 1024
PVNA5
1.60 × 10⁻¹¹
6.22 × 10⁻¹⁰
2.42 × 1024
3.4 Dielectric properties
Dielectric material characteristics may be characterized using a variety of approaches, according to recent research. A lot of research has been done in recent years to improve material characterization's accuracy and sensitivity (Uǧuz, 2020; Al-Omari and Lear, 2005; Park et al., 2016; Anderson and Jacob, 2011; Aziz et al., 2017). It has been observed that impedance measurements at various frequencies are an briliant method to examine dielectric material's molecular mobility (Aziz et al., 2019). The conductivity trend may be studied using dielectric studies. Fig. 7 and Fig. 8 show how the dielectric constant (ɛ) and dielectric loss (ɛ“) vary with frequency for different NaI salt amount at ambient temperature. Using the relationship given below, the dielectric constant and loss may be calculated from
and
parts of the complex impedance (
):
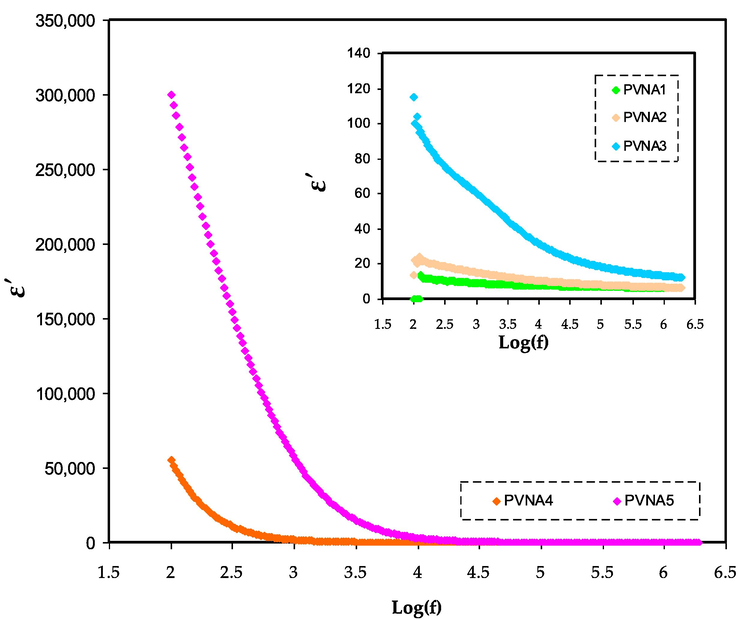
ɛ' spectra for PVNA1, PVNA2, PVNA3, PVNA4, and PVNA5 at ambient temperature.
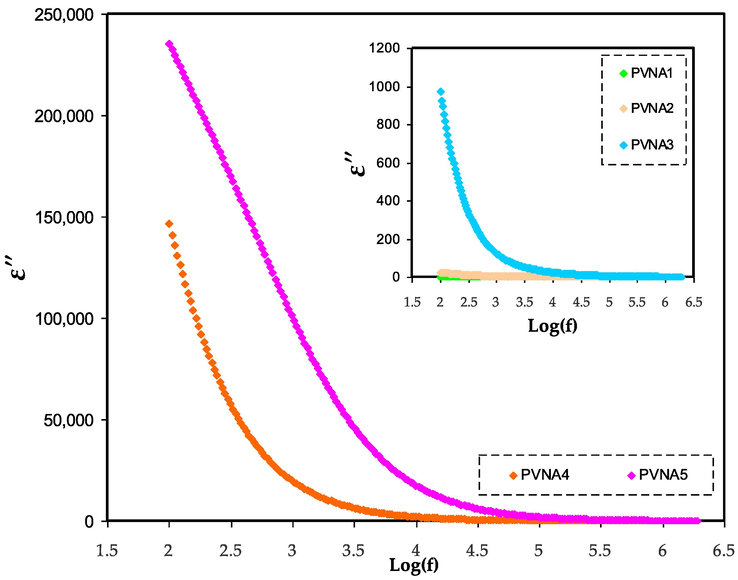
Dielectric loss spectra for PVNA1, PVNA2, PVNA3, PVNA4, and PVNA5 at ambient temperature.
A polymer electrolyte's conductivity may be investigated and evaluated using dielectric constants (Tamilselvi and Hema, 2016). When it comes to determining dipole alignment or polarization, the real component of dielectric permittivity (ε′) measures the capacitance. Similarly, the imaginary part (ε“), which represents dielectric loss, is related to conductance and it reflects the energy required to align the dipoles (Aziz, 2019). The study and detection of the formation of neutral ion pairs from the aggregation of dissolved ion pairs is crucial since such formations may decrease electrical conductivity (Aziz et al., 2017). As previously shown in XRD and FTIR tests, increasing the amount of NaI lowered the crystalline area. As illustrated in Figs. 7 and 8, the dielectric constant and dielectric loss in the low-frequency region are found to be high. This is due to charge carrier buildup or space charge polarization at the electrode/electrolyte interface (Aziz et al., 2019). At high frequency, the dielectric characteristics are reduced (i.e., the bulk property). To put it another way, decreasing the applied electric field frequency increases the time available for charge carriers to move, increasing the dielectric constant and dielectric loss in the process (Aziz and Abdullah, 2018). The reverse of electric field happens rapidly at frequency that cause the diffusion of ions not occurs along its path, and thus decreases polarization (Teo et al., 2012). The dielectric constant of the system containing 50 wt% NaI (PVNA5) was higher than that of the other samples. This is because the dielectric constant (ε') and the dielectric loss (ε”) are more influenced by amorphous phase in the system (Awasthi and Das, 2019; Khiar et al., 2016). As seen in Fig. 7 the PVNA5 sample has the highest dielectric constant and also DC conductivity as shown in Table 3 as more salts are dissociated into free ions.
As can be seen from the graphs, the dielectric loss is greater than the dielectric constant. Dielectric loss is influenced by two factors: dielectric polarization processes and DC conduction processes (Awasthi and Das, 2019).
3.5 Tangent delta analysis
Loss tangent peaks study the PE's relaxation processes. The PEs dipoles can be explained on the basis of dielectric relaxation (Marf et al., 2020; Aziz et al., 2017). Fig. 9 shows the loss tanδ dielectric relaxation against frequency at room temperature. The loss tangent peak shifts to high frequency, meaning that the dielectric relaxation occurs. The permanent dipoles and induced dipoles cause the dielectric relaxation peaks and conductivity. It has been documented that the polarization relaxation of mobile ions in a material is hidden by the induced diploes (Marf et al., 2020; Aziz et al., 2017). The peaks in Fig. 9 show the translational ion motions that are associated to the conductivity relaxation of the mobile charge carriers. This is a benefit for the transport of ions in the PEs segmental motion (Aziz et al., 2017). The tan δ increased as the frequency increased, owing to the active element (ohmic) dominant in comparison with the reactive element (capacitive). Followed by, the tan δ decrease at a higher frequency is seen which is owing to the active element independency frequency and thus, causes the dominant of the reactive element (Woo et al., 2012). The PEs relaxation process signified by the tan δ plot suggests the films non-Debye behavior (Idris et al., 2007).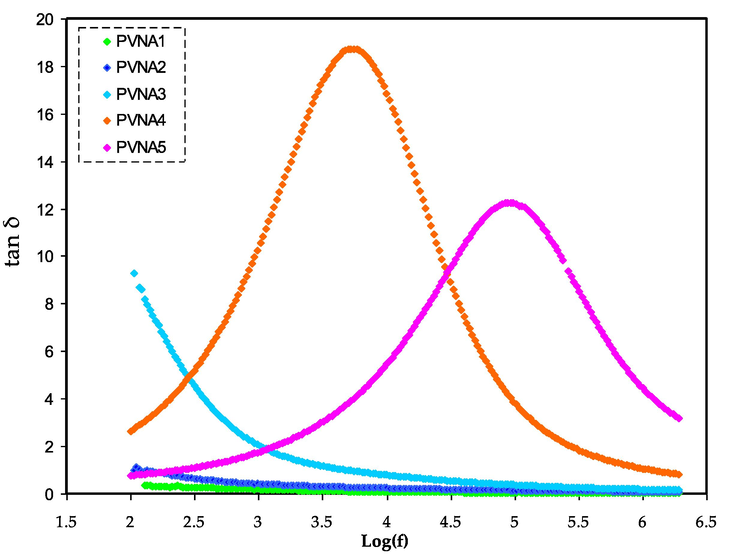
Loss tangent spectra for electrolytes at room temperature.
3.6 Electric modulus spectra analysis
The M* diagram is now widely used to investigate ionic conductivities in the context of ionic process-conductivity relaxation time relationships (Resistivity et al., 2022). The following formulae calculate the real and imaginary parts of complex electric modulus (
) by inserting the values of the real (
) and imaginary (
) component:
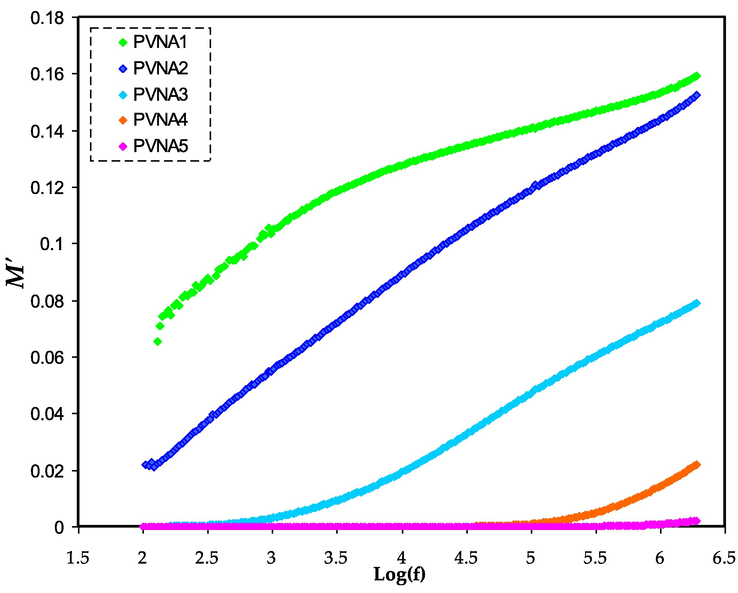
M' spectra for all polymer electrolytes.
M“ spectra of the films are shown in Fig. 11. The peak in the M” spectra corresponds to the relaxation of the conductance of the mobile ions. When a polymer chain segments move, it lowers relaxation time (τ) and boosts transport characteristics. The relaxation time can be measured by the inverse of the frequency of the relation peak (τ = 1/2πfmax) (Gondaliya et al., 2011). The relaxation peaks shifted to the higher frequency side, as seen in Fig. 11. Increasing the concentration of NaI causes an increase in relaxation time, which causes an increase in ionic conductivity. The long tail detected at low frequency proposes the capacitive behavior of the electrolytes where the strong electrode polarization occurs without any dispersion (Asnawi et al., 2021).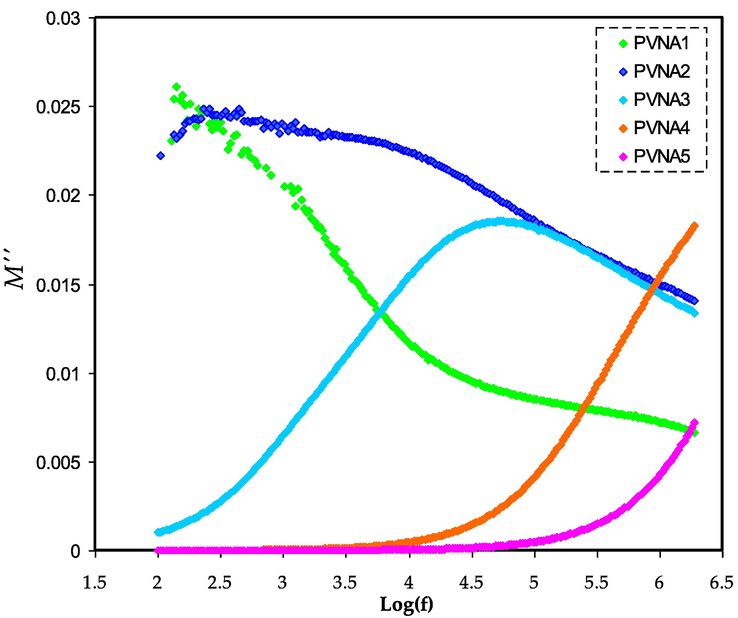
M“ for PVNA1, PVNA2, PVNA3, PVNA4, and PVNA5 films.
Fig. 12 shows the Argand plots for all samples, which shows incomplete semicircle. The Argant plots' tails began to diverge much further from their original orientation. At low frequencies, the enormous capacitance owing to electrode polarization is responsible for the lengthy tail (Aziz et al., 2017). The tails of the M''-M' for 10 and 20 wt% of NaI is close enough to real axis due to resistive (insulating) behavior of these electrolytes. For other systems (30–50 wt%) NaI the curves shifts towards the origin ascribing to resistivity decrease. In the Argand plots, non-Debye relaxation is represented by incomplete semicircular arcs. It is designed for non-interacting identical dipoles in the Debye model (Aziz, 2016). As a result, the non-Debye behavior may be attributed to the fact that there are several polarization mechanisms and many interactions between ions and dipoles in real space in actual material. The drawing diameter of the circle is well below the real axis. For differentiating between conductivity and viscoelastic relaxation processes, the Argant plot is essential. It was recently proven that the Argand plot with a perfect semicircular arc (diameter coincides or overlaps with real axis) linked with the ion relaxation process may be attributable to the conductivity relaxation or pure ionic relaxation process, in which polymer chain motion helps ion translation; that is; not coupling occurs among polymer/cation motions. Conductivity and viscoelastic relaxation processes can only be distinguished with an in-depth understanding of the Argant plot. Research has shown that the Argand plot is essential to distinguish ion relaxation process that is either caused by conductivity relaxation or by the viscoelastic relaxation process, in which polymer chain motion helps ion translation (Aziz et al., 2017; Aziz, 2016; Moreno et al., 2011; Mohomed et al., 2005).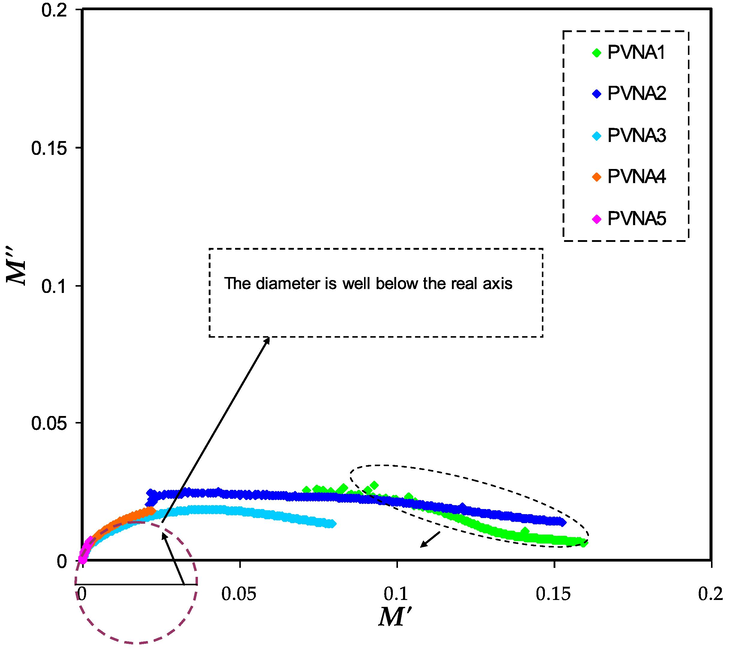
Aragnd (M'' vs M') diagram for ion condicting films.
3.7 AC conductivity study
The AC conductivity spectrum for the all membrane are shown in Fig. 13. In this study the
for all the SPE films at ambient temperature have been measured using the following equation (Aziz and Abidin, 2015):
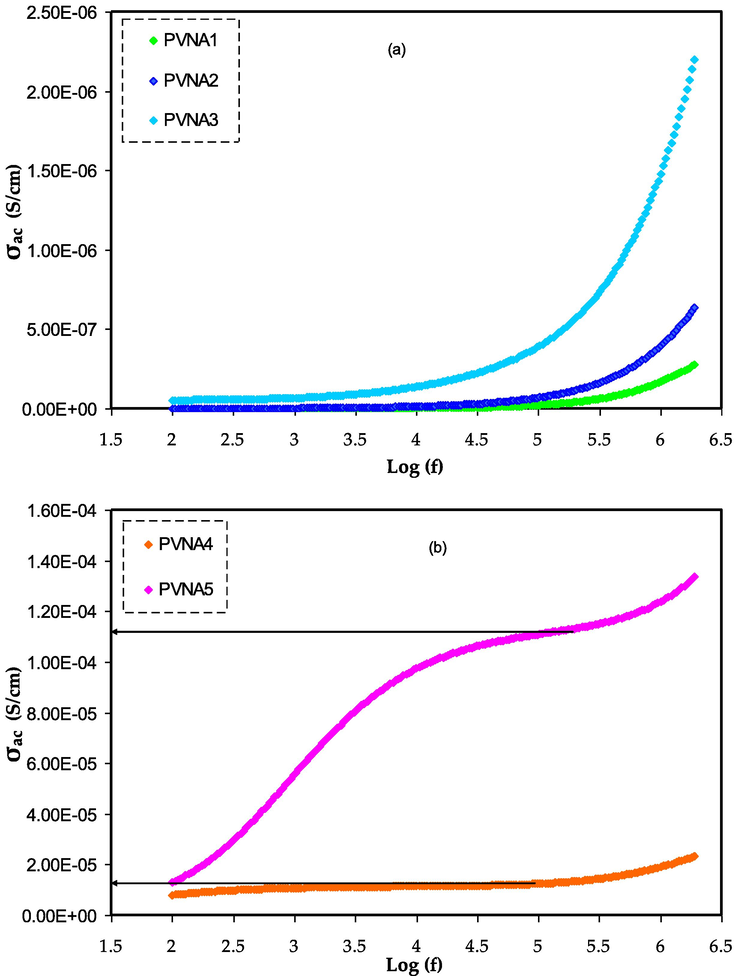
AC conductivity versus frequency for a) PVNA1, PVNA2, and PVNA3 films and b) PVNA4 and PVNA5 films.
The room temperature
trend for all the prepared SPE samples with the frequency of applied electric field at ambient temperature is shown in Fig. 13(a,b). It should be noted that, the electrical conductivity performance of the current SPE films in the frequency dependent dispersion region are following Jonscher’s power law, which is given by (Murugaraj et al., 2003; Aziz et al., 2018):
It is clear when the frequency increases caused to rise AC conductivity. This might be explained by the fact that when the applied electrical signal excites the charge carriers, their mobility increases, decreasing the relaxation period and increasing conductivity (Gondaliya et al., 2011). DC electrical conductivity may be accurately predicted by using the frequency of the applied electrical signal as a measure of AC conductivity (Aziz et al., 2017; Aziz et al., 2017; Aziz et al., 2017). The frequency dependent AC spectra allow for the separation of three distinct zones for materials with significant DC conductivity (Moreno et al., 2011).
Fig. 13 has three distinct sections. Electrode polarization (EP) is responsible for the low-frequency data, while DC conductivity is responsible for the data in the intermediate zone. The influence of electrode polarization is responsible for the conductivity spectrum's divergence from DC value (the plateau area), according to th previous research in ref. (Aziz et al., 2017). The EP region cannot be distiguished for the samples exhib semicircle only (see Fig. 13).
4 Conclusion
Casting techniques were used to prepare solid polymer electrolytes (SPEs) films. The XRD deconvolution was used to investigate the degree of crystallinity the results show that with increasing NaI the degree of crystallinity decreased. The PVNA5 film showed the lowest degree of crystallinity (2.26), meaning that it has the highest amorphous phase. The noticeable decrease of transmittance intensity and band shift in the FTIR spectra indicated the complexation and interaction between the PVA functional groups and Na cations. The impedance data were fitted with the EEC modelling to determine bulk resistance which is used to determine the DC conductivity. At ambient temperature the maximum conductivity of was obtained at room temperature. The EIS model was used to to detrmine the in transport parameters. The mobility of 6.22 × 10⁻¹⁰ cm2v−1s, diffusion coefficient of 1.6 × 10⁻¹¹ cm2s−1, and number density of ions of 2.42 × 1024 cm−3 were determined for the PVNA5 film. The regions belong to the effect of EP were distinguished form the dielectric constant and dielectric loss spectra. Due to charge carrier buildup, the dielectric constant and loss are high at the low-frequency region. Obvious peaks were emerged at the high salt concentrations in the tanδ and M“ spectra. The tanδ peaks were shifted to the high frequency region. The argand plot showed an incomplete circular arc, meaning that the distribution of relaxation time is dominant. The AC conductivity versus frequency was plotted and used to observe the DC contribution. It was found that with increasing frequency, AC conductivity increased. Regions belong to the EP and DC contributions were differentiated in the AC spectra.
Acknowledgments
We would like to acknowledge all support for this work by the University of Sulaimani, Prince Sultan University and University of Human Development. The authors express their gratitude to the support of Princess Nourah bint Abdulrahman University Researchers Supporting Project number (PNURSP2022R58), Princess Nourah bint Abdulrahman University, Riyadh, Saudi Arabia. The authors would like to acknowledge the support of Prince Sultan University for paying the Article Processing Charges (APC) of this publication and for their financial support.
Declaration of Competing Interest
The authors declare that they have no known competing financial interests or personal relationships that could have appeared to influence the work reported in this paper.
References
- Abdelghany, A.M., 2020. Antibacterial and Energy Gap Correlation of PVA/SA Biofilms Doped With Selenium Nanoparticles, vol. 10, no. 5, pp. 6236–6244.
- Structural and electrical properties of polyvinyl alcohol (PVA): Methyl cellulose (MC) based solid polymer blend electrolytes inserted with sodium iodide (NaI) salt. Arab. J. Chem.. 2021;14(11):103388.
- [CrossRef] [Google Scholar]
- Dielectric characteristics of spin-coated dielectric films using on-wafer parallel-plate capacitors at microwave frequencies. IEEE Trans. Dielectr. Electr. Insul.. 2005;12(6):1151-1161.
- [CrossRef] [Google Scholar]
- Microwave characterization of a novel, environmentally friendly, plasma polymerized organic thin film. Phys. Procedia. 2011;14:87-90.
- [CrossRef] [Google Scholar]
- Armand, M.B., Chabagno, J.M., Duclot, M.J., 1979. In: Vashishta, P., Mundy, J.N., Shenoy, G.K. (Eds.), Fast Ion Transport in Solids, NorthHolland: Amsterdam, The Netherlands, pp. 131.
- A method based on impedance spectroscopy to determine transport properties of polymer electrolytes. Phys. Chem. Chem. Phys. 2013;14(December):1856.
- [CrossRef] [Google Scholar]
- The study of plasticized sodium ion conducting polymer blend electrolyte membranes based on chitosan/dextran biopolymers: ion transport, structural, morphological and potential stability. Polymers. 2021;13(3):383.
- [Google Scholar]
- Reduced electrode polarization at electrode and analyte interface in impedance spectroscopy using carbon paste and paper. Rev. Sci. Instrum.. 2019;90(12)
- [CrossRef] [Google Scholar]
- Li+ ion conduction mechanism in poly (ε-caprolactone)-based polymer electrolyte. Iran. Polym. J. (Eng. Ed.). 2013;22(12):877-883.
- [CrossRef] [Google Scholar]
- Role of dielectric constant on ion transport: Reformulated Arrhenius equation. Adv. Mater. Sci. Eng.. 2016;2016
- [CrossRef] [Google Scholar]
- Modifying poly(vinyl alcohol) (PVA) from insulator to small-bandgap polymer: a novel approach for organic solar cells and optoelectronic devices. J. Electron. Mater.. 2016;45(1):736-745.
- [CrossRef] [Google Scholar]
- The mixed contribution of ionic and electronic carriers to conductivity in chitosan based solid electrolytes mediated by CuNt salt. J. Inorg. Organomet. Polym. Mater. 2018
- [CrossRef] [Google Scholar]
- Increase of metallic silver nanoparticles in Chitosan:AgNt based polymer electrolytes incorporated with alumina filler. Results Phys.. 2019;13(May):102326
- [CrossRef] [Google Scholar]
- New Method for the Development of Plasmonic Metal-Semiconductor Interface Layer: Polymer Composites with Reduced Energy Band Gap. J. Nanomater.. 2017;2017
- [CrossRef] [Google Scholar]
- Development of Polymer Blends Based on PVA:POZ with Low Dielectric Constant for Microelectronic Applications. Sci. Rep.. 2019;9(1):1-12.
- [CrossRef] [Google Scholar]
- The Study of Dielectric Properties and Conductivity Relaxation of Ion Conducting Chitosan : NaTf Based Solid Electrolyte. Int. J. Electrochem. Sci.. 2018;13:10274-10288.
- [CrossRef] [Google Scholar]
- Structural and electrical characteristics of PVA:NaTf based solid polymer electrolytes: role of lattice energy of salts on electrical DC conductivity. J. Mater. Sci. Mater. Electron.. 2017;28:12873-12884.
- [CrossRef] [Google Scholar]
- Crystalline and amorphous phase identification from the tanδ relaxation peaks and impedance plots in polymer blend electrolytes based on [CS:AgNt]x:PEO(x–1) (10 ≤ x ≤ 50) Electrochim. Acta. 2018;285:30-46.
- [CrossRef] [Google Scholar]
- Ion-transport study in nanocomposite solid polymer electrolytes based on chitosan: Electrical and dielectric analysis. J. Appl. Polym. Sci.. 2015;41774:1-10.
- [CrossRef] [Google Scholar]
- Influence of silver ion reduction on electrical modulus parameters of solid polymer electrolyte based on chitosansilver triflate electrolyte membrane. Express Polym. Lett.. 2010;4(5):300-310.
- [CrossRef] [Google Scholar]
- Effect of silver nanoparticles on the DC conductivity in chitosansilver triflate polymer electrolyte. Phys. B Condens. Matter. 2010;405(21):4429-4433.
- [CrossRef] [Google Scholar]
- Structural, Morphological and Electrochemical Impedance Study of CS : LiTf based Solid Polymer Electrolyte: Reformulated Arrhenius Equation for Ion Transport Study. Int. J. Electrochem. Sci.. 2016;11:9228-9244.
- [CrossRef] [Google Scholar]
- Role of ion dissociation on DC conductivity and silver nanoparticle formation in PVA: AgNt based polymer electrolytes: Deep insights to ion transport mechanism. Polymers. 2017;9:338.
- [Google Scholar]
- Effect of high salt concentration (HSC) on structural, morphological, and electrical characteristics of chitosan based solid polymer electrolytes. Polymers (Basel). 2017;9(6):187.
- [CrossRef] [Google Scholar]
- The Compatibility of Chitosan with Divalent Salts over Monovalent Salts for the Preparation of Solid Polymer Electrolytes. Res. Phys. 2018
- [CrossRef] [Google Scholar]
- Non suitability of silver ion conducting polymer electrolytes based on chitosan mediated by barium titanate (BaTiO3) for electrochemical device applications. Electrochim. Acta. 2019;296:494-507.
- [CrossRef] [Google Scholar]
- Development of polymer blend electrolyte membranes based on chitosan: Dextran with high ion transport properties for EDLC application. Int. J. Mol. Sci.. 2019;20(13)
- [CrossRef] [Google Scholar]
- ac impedance, DSC and FT-IR investigations on (x) PVAc –(1–x) PVdF blends with LiClO4. Mater. Chem. Phys.. 2006;98:55-61.
- [CrossRef] [Google Scholar]
- Structural and electrical properties of pure and NaBr doped poly (vinyl alcohol) (PVA) polymer electrolyte films for solid state battery applications. Ionics 2007:441-446.
- [CrossRef] [Google Scholar]
- Structural, Electrical and Optical Characterization of Pure and Doped Poly (Vinyl Alcohol) (PVA) Polymer Electrolyte Films. Int. J. Polym. Mater.. 2007;56(6):579-591.
- [Google Scholar]
- Structural and electrical studies of sodium iodide doped poly(vinyl alcohol) polymer electrolyte films for their application in electrochemical cells. Ionics (Kiel). 2007;13(3):173-178.
- [CrossRef] [Google Scholar]
- Investigations on electrical properties of (PVA:NaF) polymer electrolytes for electrochemical cell applications. Curr. Appl. Phys.. 2009;9(1):165-171.
- [CrossRef] [Google Scholar]
- Development and characterization of proton conducting polymer electrolyte based on PVA:Arginine: NH4SCN. AIP Conf. Proc.. 2019;2115(July)
- [CrossRef] [Google Scholar]
- Tea from the drinking to the synthesis of metal complexes and fabrication of PVA based polymer composites with controlled optical band gap. Sci. Rep. 2020:1-17.
- [CrossRef] [Google Scholar]
- “The Study of EDLC Device with High Electrochemical Performance Fabricated from Proton Ion Conducting PVA-Based Polymer Composite Electrolytes Plasticized with Glycerol. Polymers 2020:1-25.
- [Google Scholar]
- Synthesis and characterization of iota-carrageenan solid biopolymer electrolytes for electrochemical applications. Ionics 2018
- [Google Scholar]
- Preparation and characterization of polyvinyl alcohol-chitosan composite films reinforced with cellulose nanofiber. Materials (Basel). 2016;9(8):1-16.
- [CrossRef] [Google Scholar]
- Drawbacks of Low Lattice Energy Ammonium Salts for Ion-Conducting Polymer Electrolyte Preparation: Structural, Morphological and Electrical. Polymers 2020
- [Google Scholar]
- Electrolytes, B. 2022. Development of Flexible Plasticized Ion Conducting Polymer Blend Electrolytes Based on Polyvinyl Alcohol (PVA): Chitosan (CS) with High Ion Transport Parameters Close to Gel Based Electrolytes, pp. 1–23.
- Solid polymer electrolytes based on poly(vinyl alcohol) incorporated with sodium salt and ionic liquid for electrical double layer capacitor. Materi. Sci. Eng.: B. 2019;251:114468.
- [Google Scholar]
- Structural and optical characterization of PVA:KMnO4 based solid polymer electrolyte. Results Phys.. 2016;6:1103-1108.
- [CrossRef] [Google Scholar]
- Structural and Conductivity Studies of Poly(Ethylene Oxide) – Silver Triflate Polymer Electrolyte System. Mater. Sci. Appl.. 2011;02(11):1639-1643.
- [CrossRef] [Google Scholar]
- Structural and thermal studies of PVA:NH4I. J. Phys. Chem. Solids. 2009;70(7):1098-1103.
- [CrossRef] [Google Scholar]
- Study of the nanostructure of free volume and ionic conductivity of polyvinyl alcohol doped with NaI. Polym. Adv. Technol.. 2020;32(1):173-182.
- [Google Scholar]
- Effects of lithium salt on chitosan-g-PMMA based polymer electrolytes. Mater. Res. Innov.. 2011;15(SUPPL 2)
- [CrossRef] [Google Scholar]
- Effect of 1-ethyl-3-methylimidazolium nitrate on the electrical properties of starch/chitosan blend polymer electrolyte. Mater. Sci. Forum. 2016;846(3):510-516.
- [CrossRef] [Google Scholar]
- Olefin-induced dissolution of silver salts physically dispersed in inert polymers and their application to olefin/paraffin separation. J. Memb. Sci.. 2004;241(2):403-407.
- [CrossRef] [Google Scholar]
- Physicochemical and morphological evaluation of chitosan/poly(vinyl alcohol)/methylcellulose chemically cross-linked ternary blends. Polym. Bull.. 2012;68(5):1387-1393.
- [CrossRef] [Google Scholar]
- Investigation of ionic liquid-based poly(vinyl alcohol) proton conductor for electrochemical double-layer capacitor. High Perform. Polym.. 2014;26(6):632-636.
- [CrossRef] [Google Scholar]
- Electrical and structural studies of ionic liquid-based poly(vinyl alcohol) proton conductors. J. Non. Cryst. Solids. 2015;425:163-172.
- [CrossRef] [Google Scholar]
- Capacitive behavior studies on electrical double layer capacitor using poly (vinyl alcohol)-lithium perchlorate based polymer electrolyte incorporated with TiO2. Mater. Chem. Phys.. 2014;143(2):661-667.
- [CrossRef] [Google Scholar]
- AC conductivity and dielectric behavior of polyaniline/sodium metavenadate (PANI/NaVO3) composites. Phys. B Condens. Matter. 2009;404(21):4168-4172.
- [CrossRef] [Google Scholar]
- Electrical conduction and dielectric relaxation in p-type PVA/CuI polymer composite. J Adv Res.. 2013;4:531-538.
- [Google Scholar]
- Structural, thermal and electrical properties of PVA-LiCF3SO3 polymer electrolyte. J. Non. Cryst. Solids. 2010;356(43):2277-2281.
- [CrossRef] [Google Scholar]
- Structural, thermal and electrical properties of PVA – LiCF 3 SO 3 polymer electrolyte. J. Non. Cryst. Solids. 2010;356(43):2277-2281.
- [CrossRef] [Google Scholar]
- Structural, morphological, electrical and electrochemical properties of PVA: CS-Based proton-conducting polymer blend electrolytes. Membranes. 2020;10:71.
- [Google Scholar]
- Studies on ionics conduction properties of modification CMC-PVA based polymer blend electrolytes via impedance approach. Polym. Test.. 2020;81(October 2019)
- [CrossRef] [Google Scholar]
- FeRAM technology for high density applications. Microelectron. Reliab.. 2001;41(7):947-950.
- [CrossRef] [Google Scholar]
- Preparation and characterization of polyvinyl alcohol/chitosan blended membrane for alkaline direct methanol fuel cells. J. Memb. Sci.. 2012;419–420:65-71.
- [CrossRef] [Google Scholar]
- A broad spectrum analysis of the dielectric properties of poly(2-hydroxyethyl methacrylate) Polymer (Guildf). 2005;46(11):3847-3855.
- [CrossRef] [Google Scholar]
- Electrical and mechanical properties of poly(ethylene oxide)/intercalated clay polymer electrolyte. Electrochim. Acta. 2011;58(1):112-118.
- [CrossRef] [Google Scholar]
- AC conductivity and its scaling behavior in lithium and sodium bismuthate glasses. Mater. Lett.. 2003;57(11):1656-1661.
- [CrossRef] [Google Scholar]
- Preparation of composite polymer electrolytes by electron beam-induced grafting: Proton- and lithium ion-conducting membranes. Nucl. Instruments Methods Phys. Res. Sect. B Beam Interact. Mater. Atoms. 2007;265(1):168-172.
- [CrossRef] [Google Scholar]
- Improving biodegradability of polyvinyl alcohol/starch blend films for packaging applications. Int. J. Basic Appl. Sci.. 2014;3(3):263-273.
- [CrossRef] [Google Scholar]
- “Polymer composites with 0.98 transparencies and small optical energy band gap using a promising green methodology: Structural and optical properties. Polymers (Basel). 2021;13(10)
- [CrossRef] [Google Scholar]
- Dielectric constant measurements of thin films and liquids using terahertz metamaterials. RSC Adv.. 2016;6(73):69381-69386.
- [CrossRef] [Google Scholar]
- Polypropylene-graphene-a nanocomposite that can be converted into a meta-material at desired frequencies. RSC Adv.. 2014;4(85):44888-44895.
- [CrossRef] [Google Scholar]
- Effect of plasticizer on structural and electrical properties of nanocomposite solid polymer electrolytes. Ionics (Kiel). 2011;17(2):127-134.
- [CrossRef] [Google Scholar]
- Synthesis and impedance analysis of proton-conducting polymer electrolyte PVA:NH4F. Ionics (Kiel). 2013;19(10):1437-1447.
- [CrossRef] [Google Scholar]
- Solid polymer electrolytes with poly (vinyl alcohol) and piperidinium based ionic liquid for Li-ion batteries. Solid State Ionics. 2019;333(January):76-82.
- [CrossRef] [Google Scholar]
- Rasali, N.M.J., Samsudin, A.S., 2017. Ionic transport properties of protonic conducting solid biopolymer electrolytes based on enhanced carboxymethyl cellulose – NH 4 Br with glycerol.
- Resistivity, H., Dannoun, E.M.A., Al-saeedi, S.I., 2022. Impedance and Dielectric Properties of PVC: NH 4 I Solid Polymer Electrolytes (SPEs): Steps toward the Fabrication of SPEs with High Resistivity.
- Complex AC impedance, transference number and vibrational spectroscopy studies of proton conducting PVAc-NH4SCN polymer electrolytes. Phys. B Condens. Matter. 2005;357(3–4):412-419.
- [CrossRef] [Google Scholar]
- A high voltage magnesium battery based on H2SO4-doped (PVA)0.7(NaBr)0.3 solid polymer electrolyte. J. Power Sources. 2008;185(2):1509-1513.
- [CrossRef] [Google Scholar]
- Electrical characterization of corn starch-LiOAc electrolytes and application in electrochemical double layer capacitor. Electrochim. Acta. 2014;136:204-216.
- [CrossRef] [Google Scholar]
- Preparation and characterization of (PVP + NaClO4) electrolytes for battery applications. Eur. Phys. J. E. 2006;19(4):471-476.
- [CrossRef] [Google Scholar]
- Investigations on lithium acetate-doped PVA/PVP solid polymer blend electrolytes. Polym. Bull.. 2019;76(11):5577-5602.
- [CrossRef] [Google Scholar]
- Structural, thermal, vibrational, and electrochemical behavior of lithium ion conducting solid polymer electrolyte based on poly(vinyl alcohol)/poly(vinylidene fluoride) blend. Polym. Sci. - Ser. A. 2016;58(5):776-784.
- [CrossRef] [Google Scholar]
- Conductivity and dielectric studies of Li 2SnO 3. Ionics (Kiel). 2012;18(7):655-665.
- [CrossRef] [Google Scholar]
- Dielectric properties and morphology of polymer electrolyte based on poly(ε-caprolactone) and ammonium thiocyanate. Mater. Chem. Phys.. 2012;134:755-761.
- [Google Scholar]
- Br. Polym. J.. 1975;7:319.
- A sandwich-type composite polymer electrolyte for all-solid-state lithium metal batteries with high areal capacity and cycling stability. J. Memb. Sci.. 2020;596(May 2019)
- [CrossRef] [Google Scholar]
- International Journal of Polymer Analysis and Characterization on conduction properties of carboxymethyl cellulose / kappa carrageenan blend-based polymer electrolyte system. Int. J. Polym. Anal. Charact. 2018:1-10.
- [CrossRef] [Google Scholar]
- Characterization of an amorphous materials hybrid polymer electrolyte based on a LiNO3-doped, CMC-PVA blend for application in an electrical double layer capacitor. Mater. Chem. Phys. 2020
- [CrossRef] [Google Scholar]


