

Translate this page into:
The use of Bagassa guianensis aubl. forestry waste as an alternative for obtaining bioproducts and bioactive compounds
⁎Corresponding author at: Faculty of Chemical Engineering, Federal University of Pará. Augusto Corrêa Street, 01. Belém, PA. wbraamcamp@ufpa.br (W.B.S. Pinheiro)
-
Received: ,
Accepted: ,
This article was originally published by Elsevier and was migrated to Scientific Scholar after the change of Publisher.
Peer review under responsibility of King Saud University.
Abstract
The development of new products and technologies based on agro-industrial waste use has been caused by the dearth of raw materials linked to environmental factors. In this work, it was aimed at proving the potential of using Bagassa guianensis species forestry waste (MENDESS ROSS Ltda., located on Mucajaí – RR/Brazil) in obtaining bioactive compounds and the use of ethanolic extract as a bioproduct in combating oxidative stress. The chemical profile of ethyl acetate and ethanolic extracts, by HPLC, HPTLC and NMR, allowed to identify the presence of important phytochemical classes, such as fatty acids, stilbenes, moracins, flavanones and dihydroflavonols in both extracts, in addition to the identification of bioactive compounds of pharmacological and economic relevance, such as stilbenes trans-resveratrol, trans-oxyresveratrol, moracin M, moracin N and the aminosugar 1-deoxynojirimycin, their permanence in the raw material confirms the viability of using this waste even after industrial processing, which allows adding value to the species productive chain. The analysis of the antioxidant capacity showed an important action of ethanolic extract in the face of DPPḢ and ABTṠ+ radicals solutions, with IC50 23.71 and 5.79 µg/mL respectively, which suggests being related to its abundant phenolic composition, thus, indicating a possible bioproduct in the combat the effects caused by oxidative stress, in addition to its application in cosmetics, pharmaceuticals, stabilizing additives or even as a raw material for obtaining bioactive molecules in secondary processes.
Keywords
Chemical profile
Antioxidant capacity
Bioactive compounds
Stilbenes
Resveratrol
Deoxynojirimycin

- HPLC
-
High Performance Liquid Chromatography
- HPTLC
-
High Performance Thin Layer Chromatography
- NMR
-
Nuclear Magnetic Resonance
Abbreviations
1 Introduction
It is estimated that, in the Brazilian territory, in 2017, approximately 276 million m3 of roundwood were produced, 13.5% obtained from the Sustainable Forest Management Project (SFMP) and 86.5% from silviculture (Brazil, 2019). However, although this shows a great technical advance in the timber forest products chains, attention is paid to the large volume of waste generated, which may correspond to up to 60% of all raw material benefited (Couto et. al., 2020; Zau et al., 2014).
Alternatively, when associated with well-controlled production processes, the use of agro-industrial waste plays a decisive role both in minimizing environmental impacts and in adding value to the production chain, as these materials may still contain many bioactive substances that are still viable to obtain other commercial products or raw material for secondary processes (Borges et al., 2019).
In this context, among the various timber species in the Amazon region, Bagassa guianensis Aubl. (Moraceae) stands out for its wood presenting mechanical resistance and to the attack of microorganisms that promote rotting (Royer et al., 2012). It produces specimens that occur as large trees, reaching up to 35 m in height, and its wood is commonly used in industrial floors, vessels and external coatings (Royer et al., 2010). According to Sabogal (2006); Cordeiro et al., (2019), the species is used in silviculture, in which it has a good development in pure plantation, natural regeneration management and mainly in enrichment planting.
In the chemotaxonomy study carried out by Royer et al. (2010), with the ethyl acetate extract from the B. guianensis heartwood, it was possible to notice the presence of substances of pharmacological importance belonging to the flavonoids classes (steppogenin, katuranin and dihydromorin), moracins (moracin M, moracin N, moracin P, moracin Z, 6-O-methyl-moracin M and 6-O-methyl-moracin N) and stilbenes (trans-resveratrol, trans-oxyresveratrol, arachidin 2, arachidin 4, alboctalol, (-)-epialboctalol and artogomezianol) (Section S1, Fig. S1A, Supplementary material). In this context, many of these bioactives are commonly found in species of medicinal relevance, within the Moraceae family, such as those of the genus Ficus, Morus, Dorstenia, Artocarpus and Brosimum, as they have the ability to combat the oxidative cascade related to the most diverse pathologies (Bailly et al., 2021; Borges et al., 2017; Chen et al., 2021; Mumtaz et al., 2018; Peniche-Pávia et al., 2018).
B. guianensis is one of the main timber species in the Amazon. Its industrial processing generates a large amount of waste. Furthermore, it contains phenolic substances of phytochemical, pharmacological and economic relevance such as trans-resveratrol stilbene – antioxidant compounds widely used by food, cosmetics and pharmaceutical industries, besides of important phenolic compounds like steppogenin and moracin M, which were previously identified from the ethyl acetate extract from the B. guianensis heartwood (Royer et al., 2010). This study by NMR, HPLC e HPTLC, sought to characterize the metabolic classes of the substances present in the wood waste, as well as to identify the presence of important antioxidant markers such as trans-resveratrol and to evaluate the potential of its extracts in combating free radicals, considering that many of the substances metabolized by the plant may still be present in its wood waste.
2 Materials and methods
2.1 Reagents and materials
All chemical reagents and solvents used in the extractions, chromatographic and spectroscopic analysis were analytical grade and were provided by TEDIA® COMPANY (Fairfield, USA). Ultrapure water with a resistivity of 18.3 MΩ / cm3 produced in a Scholar UV UP 900 model water purification system (BIOHUMAN, Curitiba, Brazil) was used for the preparation of the alkaline and acidic solutions and in the elution system. Thin- layer chromatography (TLC) analysis was performed on SiliaPlate TLC chromatographic plates, with aluminum support, silica, 200 µm, 20 × 20 cm, F 254 (SiliCycle Inc., Quebec, Canada). Trolox, DPPH (1,1-diphenyl-2-picrylhydrazyl), and ABTS [2,2′-Azino-bis (3-ethylbenzothiazoline-6-sulfonic acid) diammonium salt were purchased from Sigma Aldrich (St Louis, MO, USA).
2.2 Collection and processing of wood waste
Wood waste (5 kg), resulting from wood processing and originated from SFMP, was collected. It was stored in sterile packaging when cutting B. guianensis logs along with the timber company MENDESS ROSS Ltda., located on Maranhão Avenue, 629. Mucajaí – RR/Brazil. georeferenced coordinates 01° 50′ 47.3″ S; 60° 50′ 3″ W, SisGen registration, number A678D8C For the waste processing, the material was initially dehydrated in a kiln with controlled temperature and humidity (t = 45 °C; H = 20%) por 72 horas until reaching constant weight. Subsequently, the dry waste was comminuted and sieved in a hammer and knife mill using a 14 Mesh sieve. In order to validate the origin of the collected waste, a chemical comparison by HPTLC of samples of native specimens collected and identified by the herbarium of EMBRAPA Eastern Amazon was carried out (exsiccate n° 186872).
2.3 Extract preparation
For the extraction of bioactive compounds described by Melo et al., (2021), an ultrasonic bath with indirect contact was used (BRANSON 2510 – Danbury, CT, USA). The equipment was adjusted to operate at a frequency of 42 KHz, power of 100 W and temperature of 27 °C. Ethyl acetate and absolute ethanol were used as extracting solvents (TEDIA® COMPANY – Fairfield, USA) with extraction time of 20 min. The obtained solutions were filtered and the solvents renewed for two more times, totaling three batches. In the extraction, a relation sample mass per solvent volume of 1:10 (1 g of sample to 10 mL of solvent) was adopted and the experiments were carried out in triplicate. The solutions of the obtained extracts were concentrated on a rotary evaporator - Syncore model (BÜCHI – Flawil, Switzerland).
2.4 Extract characterization
The extracts were characterized by adapting the methods described by Ge et al. (2018), Salomé-Abarca et al. (2018) and Wosch et al. (2017). Different analytical techniques were used to identify organic compounds: High Performance Thin Layer Chromatography (HPTLC), High Performance Liquid Chromatography (HPLC) and Nuclear Magnetic Resonance Spectroscopy (NMR).
2.4.1 Chemical and chromatographic profile by HPTLC-Densitometry
The chemical and chromatographic profile by HPTLC was developed in an automated system, composed of application modules (Automatic TLC Sample 4), elution (Automated Multiple Development AMD 2), densitometer (TLC Scanner 4) and photo-documenter (TLC Visualizer), all CAMAG brand (Muttenz, Switzerland). F-254 60 Å silica gel chromatography plates with glass support were adopted as the stationary phase (SILICYCLE, Quebec, Canada) and as mobile phase, HPLC grade solvents (TEDIA® COMPANY – Fairfield, USA) operating in gradient mode. For data processing, WinCats 1.4.6. software was used.
In spray band mode, the ethyl acetate (A) and ethanolic (E) extracts were inoculated in triplicate. It was used 25 µg/band extracts’ aliquots. Moreover, 0,1 µg/band of the standards: moracin M (MM), steppogenin (Eg) and trans-resveratrol (tR) was applied. After application, the chromatoplates were eluted in a gradient mode, consisting of 14 steps with decreasing strength of chloroform/methanol (1% formic acid)/acetone, ranging linearly from 70/15/15% to 100/0/0%, with maximum migration distances of 90 mm (12 to 90 mm) (Section S2, Table S2A, Fig. S2A, Supplementary material).
The recording of the response to UV/Visible radiation against the differential migration of chemical constituents in the chromatoplate was performed at densitometry in TLC Scanner (CAMAG), adopting the following parameters: absorption by multiple wavelengths (210, 254, 280, 310 and 366 nm), 4.00 × 0.30 mm slit, 20 mm/s scanner speed, 100 μm/step data resolution, using deuterium lamp and SAVITSKY – GOLAY 15 filter. In order to evaluate the phytochemical classes present, selective developer solutions were used for terpenes/steroids (Vanillin Sulfuric Acid 10% – VSA), phenolic compounds (Fast Blue Salt 5% – FBS) and flavonoids (2-aminoethyl-diphenylborinate and polyethylene glycol 400 – NP/PEG) (Salazar et al., 2018).
2.4.2 Chromatographic profile by HPLC
From the adaptation of the method described by Wosch et al. (2017), the chromatographic analysis by HPLC of the extracts was performed in a liquid chromatograph Prominence LC-20AT model (Shimadzu, Tokyo, Japan) with diode array detector (DAD) and Gemini C18 column (250 mm × 4.6 mm, 5 μm) (PHENOMENEX – Torrance, USA). For data processing, LC/solution 1.20 software was used 20 µL/ injection of standardized extracts were applied at 1000 ppm and eluted in a wide gradient mode of acetonitrile/water, with organic modifier ranging linearly from 5 to 100%, in 60 min and flow rate of 1 mL/min. Samples were monitored from the compounds absorbance under ultraviolet radiation, from 200 to 400 nm, and the chromatograms were compared by using the wavelength at 220 nm.
2.4.3 Spectroscopy profile by NMR
Nuclear Magnetic Resonance (NMR) spectra of 1H, 13C and the correlation maps Homonuclear Correlation Spectroscopy (HOMO-COSY), Heteronuclear Single Quantum Coherence (HSQC) and Heteronuclear Multiple Bond Coherence (HMBC), were obtained on a Bruker spectrometer, Ascend™ (Rheinstetten, Germany) model, operating at 400 and 100 MHz. The samples were prepared using 20 mg of extract solubilized in 600 µL of deuterated methanol (CD3OD). For data control and treatment, TopSpin 3.6.0 software was used, and the FIDs (Free Induction Tecay) were submitted to a Fourier transform, with LB = 0.3 Hz, pre-saturation sequences with low-power selective irradiation were used to suppress residual H2O signal. The spectra were treated manually, corrected at the baseline and calibrated using, as an internal reference, the solvent residual signal, CH3OH at 3.30 ppm (Aboulkas et al., 2017; Ferreira et al., 2020; Ge et al., 2018; Salomé-Abarca et al., 2018; Singh and Dhepe, 2018).
In order to indicate the selected peaks, chemical shift data (δ) and coupling constant (J) of one-dimensional spectra (1D) 1H e 13C were used, in addition to two-dimensional correlation maps 2D 1H 1H (HOMO-COSY), 1H 13C (HSQC) and 1H 13C (HMBC). Experimental data were compared with the respective literature signals for the compounds trans-resveratrol, trans-oxy-resveratrol, moracin N and 1-deoxynojirymicin (Castejón et al., 2016; Faleva et al., 2020; Frédérich et al., 2010; McDonnell et al., 2004; Royer et al., 2010).
2.5 In vitro evaluation of antioxidant capacity
2.5.1 HPTLC screening for antioxidants direct bioautography (HPTLC-DB)
The chromatoplate with 50 µg/band inoculants of ethyl acetate and ethanol extracts, in addition to 1 µg/band of positive control moracin M (MM), Steppogenin (Eg) and trans-resveratrol (tR), was developed according to item 2.3.1. Then, it was sprayed with a 0.5% solution of DPPḢ (1,1-diphenyl-2-picryl-hydrazil) in methanol and stored for 60 min protected from light and oxygen. The chromatoplate was photo-documented in Visualizer under visible radiation, with bioactive compounds appearing with yellow-white coloring (Załuski et al., 2018).
2.5.2 DPPḢ assay
The ability of the extracts constituents to sequester DPPḢ radicals (1,1-diphenyl-2-picryl-hydrazil) was determined using the method of Sridhar and Charles (2019). Quantification was performed by spectrophotometry, by using the ELISA EspectraMax i3 reader (Molecular Devices Inc. - Sunnyvale, CA, USA), in a 96-well microplate. The effects of ethyl acetate and ethanol extracts, in concentrations of 5, 25, 50, 100, 150 and 200 µg/mL, under solution of DPPḢ at 60 µg/mL adjusted to absorbance to 0.866 were evaluated. The ELISA plate was incubated for 30 min in the dark and at room temperature (25 °C). After the incubation period, the absorbance of the solutions was obtained by adopting a wavelength of 517 nm. The results were expressed by the effective concentration for sequestering half of the free radicals (IC50). The experiments were carried out in triplicate and the trolox was used as a positive control (Sigma Aldrich – St Louis, MO, USA).
2.5.3 ABTṠ+ assay
The capture activity of ABTṠ+ radical cations from B. guianensis waste extracts was determined by spectrophotometry by using ELISA EspectraMax i3 reader (Molecular Devices Inc. - Sunnyvale, CA, USA) and by the method described Sridhar and Charles (2019). A stock solution of ABTṠ+ was produced by reacting the aqueous solution of 2,2′-Azino-bis(3-ethylbenzothiazoline-6-sulfonic acid) diammonium salt – ABTS (7 mM) with 140 mM aqueous solution of potassium persulfate in ratio of 5 mL of ABTS to 88 µL of potassium persulfate. After 16 h of reaction, the solution was diluted and adjusted to absorbance of 0.510 ± 0.01 at 734 nm. The extracts antioxidant capacity was determined from the absorbance decay compared to extracts at concentrations of 5, 25, 50, 100, 150 and 200 µg/mL. The mixture was incubated in the dark for 10 min and its absorbances were determined at a wavelength of 734 nm. Similar to the test with DPPḢ, item 2.4.2., the results were expressed with the effective concentration for the sequestration of 50% of free radicals present in solution (IC50) and carried out in triplicate.
2.6 Statistical analysis
All determinations were performed in triplicate and data obtained were subjected to statistical analysis by using GraphPad Prism® software version 8.0.1 (GraphPad Software Inc. – San Diego, CA, USA). Data were treated by non-linear regression, adopting a logistic equation with 5 parameters and the result plotted according to the dose response inhibition of the extracts antioxidant activity. Data were analyzed for statistical differences between treatment groups and estimated by the Spearman correlation (δ). The values are given as mean ± SD (n = 3) and all statistical tests were performed with level significance with p < 0,05.
3 Results and discussion
3.1 Characterization and extraction of the raw material
In the waste preliminary analysis, there was an absence of particulate impurities such as the remains of other plants, sand and boulders, as well as of biological nature, such as the formation of colonies of microorganisms, among others. Kiln drying with forced air circulation and temperature control made it possible to determine the average waste moisture content of 6.72% ±0.33 (Section S5, Fig. S5A, Supplementary material).
Antagonistic to the studies carried out by Royer et al. (2010), in which ethyl acetate was selected as extraction solvent, the extraction of B. guianensis metabolites assisted by ultrasound evidenced the greater extraction capacity of ethanol in relation to ethyl acetate, in which it presented a mass yield six times higher, 3.16% ±0.38 and 0.51% ±0.06 respectively.
3.2 Chemical and chromatographic profile by HPTLC-Densitometry
The analysis of the chromatographic profile by HPTLC of the obtained extracts allowed to evaluate the diversified nature in terms of their chemical composition. The developed elution method presented ample selectivity and resolution for both extract constituents. It allowed their separation along the chromatographic path, as shown in Fig. 1. The chromatoplate photodocumetation under ultraviolet (UV) radiation allowed the visualization of chromophoric compounds with physical properties of absorption and fluorescence under a wavelength of 254 nm (Fig. 1a) and 366 nm (Fig. 1b), respectively. According to Cardozo et al. (2015) stilbenes are associated with an intense absorption capacity and fluorescence of chromophoric compounds, as seen in the blue color fluorescence of the trans-resveratrol (tR) and moracin M (MM) standards, in addition to most of the metabolites present in all B. guianensis waste extracts (Fig. 1b), which indicate the strong presence of this class in them.
Developed chromatoplates, visualized under 254 and 366 nm UV radiation. (a) chromatoplate visualized under UV 254 nm radiation; (b) chromatoplate visualized under UV 366 nn radiation; moracin M (MM); steppogenin (Eg); trans-resveratrol (tR); Ethyl acetate extract - replicate I (A1); Ethyl acetate extract - replicate II (A2); Ethyl acetate extract - replicate III (A3); Ethanolic extract - replicate I (E1); Ethanolic extract - replicate II (E2) and Ethanolic extract - replicate III (E3).
In the densitometric analysis of the extracts (Fig. 2), as well as of the chromatoplates under UV radiation (Fig. 1), the reproducibility of the extractions was verified in all replicates, as well as in their chemical compositions when the qualitative aspect was evaluated. Both the extracts obtained by ethyl acetate and those obtained by ethanol presented in their chemical composition basically the same constituents, represented by the repetitions of the peaks in the densitogram or bands in the chromatoplates with the same retention factors (Rf), distinguishing only in the quantitative aspect , in which the peak areas related to ethanolic extracts were larger than those obtained with ethyl acetate, which indicates a greater abundance of these compounds in the ethanolic (Fig. 2).
3D densitogram of developed chromatoplates. (a) densitogram obtained at UV 210 nm; (b) densitogram obtained at UV 310 nm; moracin M (MM); steppogenin (Eg); trans-resveratrol (tR); Ethyl acetate extract - replicate I (A1); Ethyl acetate extract - replicate II (A2); Ethyl acetate extract - replicate III (A3); Ethanolic extract - replicate I (E1); Ethanolic extract - replicate II (E2) and Ethanolic extract - replicate III (E3).
Densitometry made it possible to obtain the chromatograms of the extracts and standards used, allowing them to be compared with each other from the retention factors of each of the constituents, as well as performing the identification of the standards used in ethyl acetate extracts (A1, A2 and A3) and ethanol (E1, E2 and E3) – fingerprinting (Fig. 3). For the stilbene trans-resveratrol (tR) and the stilbene moracin M (MM) derivative standards, the fingerprinting indicated the presence of these compounds in all analyzed extracts and also made it possible to determine the best ethanol extraction capacity compared to these stilbenes, with greater relative areas of the respective peaks in ethanolic extracts (tR 21.51 ± 0.38%; MM 6.31 ± 0.82%) than in ethyl acetate (tR 18.78 ± 0.51%; MM 3.16 ± 0.61%) (Fig. 3 and Table 1). In addition, in the fingerprinting by HPTLC, when comparing the peak or band retention factor of the flavanone steppogenin standard with the respective constituents of the extracts, it was not possible to identify the presence of this bioactive in any of the studied extracts (Fig. 3). * Note: The values were expressed by the standardization of the peak areas observed in the chromatograms; All experiments showed significance with p < 0.05.
Chromatograms of extracts under 210 nm UV radiation. (a) moracin M; (b) steppogenin; (c) trans-resveratrol; (d) ethyl acetate extract; (e) ethanolic extract.
Extract
Trans-Resveratrol (tR)
Moracin M (MM)
Peak area
Relative area (%)
Peak area
Relative area (%)
Ethyl acetate
4415.8 ± 162.8
18.78 ± 0.51
740.0 ± 14.5
3.16 ± 0.61
Ethanolic
14751.8 ± 131.8
21.51 ± 0.38
4283.3 ± 132.8
6.31 ± 0.82
The phytochemical profile obtained by HPTLC, following the methods described by Salazar et al. (2018), Wagner and Bladt (2001), which used selective chemical developers, made it possible to evaluate phytochemical diversity and identification of important metabolic classes such as terpenes/steroids, phenolic compounds and flavonoids in both extracts. When vanillin in 10% sulfuric acid (VSA) solution was used, it was observed the majority formation of bands with red coloring, typical of phenolic compounds, as observed in the standards used (tR, MM and Eg) (Fig. 4a), being confirmed by derivatizing the plate with fast blue salt solution (FBS), which promoted the formation of bands with brown coloring in the same retention factors of the red bands visualized with VSA (Fig. 4a and 4b). By analyzing the derivatized plate with VSA, it was possible to observe the formation of a purple band with retention factor of 0.74, characteristic of terpene/steroids (Fig. 4a), a fact that corroborates the research carried out by Royer et al. (2010) that led to steroid β-sitosterol isolation.
Extracts phytochemical profile. Moracin M (MM); steppogenin (Eg); trans-resveratrol (tR); Ethyl acetate extract - replicate I (A1); Ethyl acetate extract - replicate II (A2); Ethyl acetate extract - replicate III (A3); Ethanolic extract - replicate I (E1); Ethanolic extract - replicate II (E2) and Ethanolic extract - replicate III (E3). Chromatoplates derivatized with VAS (a), FBS (b) and NP/PEG (c) solution.
Through the use of NP/PEG reagent and visualization of the chromatoplate under 366 nm UV radiation, it was possible to infer that many of the phenolic compounds visualized with VSA and FBS belong to the flavonoid class because, as well as the adopted standard – steppogenin (Eg), several compounds present in the extracts, especially those of greater polarity with retention factor below 0.50, showed green coloring in the ultraviolet (366 nm), typical of this class (Fig. 4c).
3.3 Chromatographic profile by HPLC-DAD
The chromatographic comparison of the extracts obtained from B. guianensis waste, based on the adaptation of the method described by Wosch et al. (2017), by using HPLC coupled to the diode array detector, allowed to confirm the qualitative similarity of the studied extracts by overlapping the chromatograms of ethyl acetate and ethanolic extracts. As they present identical sample treatments, the method also allowed to differentiate the extracts as to the quantitative aspect, in which chromophor compounds, under 220 nm UV radiation, showed higher peak intensity/area in the ethanolic extract, thus, ratifying the greater ethanol extraction capacity compared to secondary metabolites of B. guianensis waste, as already discussed in item 3.2. This quantitative difference is also shown in Fig. S3A, Supplementary material.
3.4 Metabolic profiling by nuclear magnetic resonance (NMR) spectroscopy
The presence of substances classes, as well as relevant biocomposites, was determined by comparing NMR spectral data with data from the literature for fatty acid, stilbenes, moracin and flavonoid (Frédérich et al., 2004; Royer et al., 2010; Singh and Dhepe, 2018).
3.4.1 One dimensional (1H and 13C) NMR
Some differences between ethyl acetate and ethanolic extracts of B. guianensis waste were observed in NMR 1H spectra, mainly regarding the aspect of abundance (integral area) of functional groups hydrogens and their respective chemical shifts, in which the standardization of all signals allowed to differentiate their chemical composition (Table 2; Section S4, Fig. S4A, Supplementary material). In the ethyl acetate extract, the region of δH 0.5 to 1.5 stood out with the highest percentage area, which comprises the signs of hydrogens of methyl (—CH3), methylene (—CH2) and metinic (—CH) groups, typical of alkyl groups, with approximately 68.41% of the total area of its spectrum, while the ethanolic extract presented only 24.78% of area for these same signals. The region of the δH 1.5 to 3.0 spectra, typical of —CH3/—CH2/—CH hydrogens bound to unsaturated carbon (CH3-C⚌C/CH2—C⚌C/CH—C⚌C), to ketone carbonyl or aldehyde (CH3—COR/CH2—COR/CH—COR), to carboxyl (CH3—COOR/CH2—COOR/CH—COOR), to nitrogen atoms (CH3—N/CH2—N/CH—N) or directly linked to aromatic ring (CH3—Ph/CH2—Ph/CH—Ph) shows similarity between the extracts, with ethyl acetate having a percentage area of 20.05% and ethanol, 17.77%. For the δH 3.0 to 4.5 region corresponding to the hydrogen signs linked to oxidized carbons (CH2—OH/CH—OH) or to alkoxy, phenoxy and acylate groups (PhO—CH3/PhO—CH2/RCOO—CH3/RCOO—CH2/RCOO—CH), the ethanolic extract showed greater intensity of signals with approximately 32.17%, compared to the 4.48% found for the ethyl acetate extract, while in the region of hydrogens of olefinic groups δH 4.5 to 6.0 (CH2⚌CH—R/R—CH⚌CH—R), the ethanolic and ethyl acetate extracts presented close integrals, 1.50% and 2.01%, respectively. Another region of great differentiation between the extracts, corresponds to the signs of hydrogens linked to aromatic carbons (Ph—H) or to vicinal olefinic carbons to aromatic ring (Ph—CH⚌CH—R), which showed a higher content of aromatic hydrogens for ethanol extract (23.70%) than for ethyl acetate (5.02%). Legend: Ethyl acetate extract (A1); Ethanolic extract (E1); n = number of hydrogens, in which 1 ≤ n ≤ 3 *Aboulkas et al. (2017); Singh and Dhepe (2018); Ferreira et al. (2020); Silva da Costa et al. (2020).
Chemical shift (ppm)*
Assignments
Area (%) A1
Area (%) E1
0.5–1.5
C—CHn
68.41
24.78
1.5–3.0
CHn—C⚌C; CHn—COR; CHn—COOR; CHn—N; CHn—Ph
20.05
17.77
3.0–4.5
CHn—OH; PhO—CHn; RCOO—CHn; CH2—NHCOR
4.48
32.17
4.5–6.0
CHn⚌CH
2.01
1.50
6.0–9.0
Ph—H; Ph—CH⚌CH—R
5.02
23.70
9.0–10.0
HCOR
0.02
0.08
The NMR 13C spectra of ethyl acetate and ethanol extracts (Section S4, Fig. S4B, Supplementary material) were obtained to corroborate with the information evidenced in the NMR 1H spectra, and the presence, in both extracts, of aliphatic carbon signals was confirmed (—CH3, —CH2—, —CH—, CH3—CO—, —CH2—NH2) in the spectral region between δC 10.0–50.0, and for the ethyl acetate extract, this region concentrated the highest signal intensity, which confirms the high content of aliphatic groups (—CH3, —CH2—, —CH—) indicated in the NMR 1H spectrum. The region δC 50.0–90.0, typical of oxidized aliphatic carbons of ether and alcohol (—C—O—C— or —C—OH), was the one that showed the greatest distinction between the extracts analyzed, with the ethyl acetate extract showing only signs of low intensity, between δC 50.0–72.0, while the ethanolic extract showed, for this same region, much more intense signs, which is in in line with what was observed in the NMR 1H spectrum (δH 3.0–4.5). For the region of aromatic and olefinic carbons, δC 100.0–140.0, there was, again, a qualitative similarity of signals presented in the spectra of both extracts, with the dissimilarity remaining regarding the quantitative aspect, that is, the ethanolic extract spectrum showed more intense signals, which suggests a higher content of phenolic compounds.
3.4.2 Two-dimensional (COSY, HSQC & HMBC) NMR spectra
Analysis of two dimensional NMR spectra (COSY, HSQC and HMBC) carried out with ethyl acetate and ethanolic extracts from B. guianensis waste, allowed to identify their phytochemical diversity, through the observation of correlations 1H/1H (2,3JH,H), 1H/13C (1JC,H) and 1H/13C (2,3JC,H) as those typical of bonds and sub-structural fractions present in stilbenes (Ar—CHα⚌CHβ—Ar’), moracins (Ar—CH⚌CO), flavanones (OCHα—CH2α,βCO), dihydroflavonols (OCHa—CHaOHCO) and fatty acids (HOOC—CH2—(CH2)n—CH3) (Table 3 and Section S4, Fig. S4, Supplementary material). These analyses also made it possible to identify four secondary metabolites: trans-resveratrol, trans-oxyresveratrol, moracin N and 1-deoxynojirimycin. * The spectra were obtained in deuterated methanol. ** NMR data were compared with those described by McDonnell et al. (2004), Castejón et al. (2016), Royer et al. (2010) and Faleva et al. (2020).
ID
Compounds
Groups
δ 1H (J/Hz)
δ 13C
Correlations
COSY
HMBC
1
Saturated fatty acid
–CH3
0.88 (t 6.8)
14.4
1.27
23.7

-(CH2)n-
1.27 (m)
23.7
0.88; 1.58
14.4; 26.1
βCH2-
1.58 (q 7.1)
26.1
1.27; 2.28
35.2
αCH2-
2.28 (t 7.1)
35.2
1.58
26.1; 177.7
–COOH
–
177.7
–
35.2
2
Unsaturated fatty acid
–CH3
0.84 (t 6.9)
12.3
1.27
23.7

-(CH2)n-
1.27 (m)
23.7
0.84; 1.58; 2.03
12.3; 26.1; 28.1
–CH = CH–
5.33 (t 4.6)
122.4
2.03
28.1
Csp2-αCH2-
2.03 (m)
28.1
1.27; 5.33
23.7; 122.4
HO2C-βCH2-
1.58 (q 7.1)
26.1
1.27; 2.28
23.7; 35.2
HO2C-αCH2-
2.28 (t 7.1)
35.2
1.58
26.1; 177.7
–COOH
–
177.7
–
35.2
3
trans-Resveratrol
1-C
–
130.8
–
–

2-CH
7.34 (d 8.2)
128.6
6.74
128.8; 130.8
3-CH
6.74 (d 8.2)
116.5
7.34
130.8; 158.1
4-C
–
158.1
–
–
5-CH
6.74 (d 8.2)
116.5
6.74
130.8; 158.1
6-CH
7.34 (d 8.2)
128.6
7.34
128.8; 130.8
α-CH
6.95 (d 16.0)
128.8
6.78
130.8; 139.9
β-CH
6.78 (d 16.0)
126.5
6.95
139.9
1′-C
–
139.9
–
–
2′-CH
6.44 (d 2.1)
104.4
6.13
159.2
3′-C
–
159.2
–
–
4′-CH
6.13 (t 2.1)
102.3
6.44
159.2
5′-C
–
159.2
–
–
6′-CH
6.44 (d 2.1)
104.4
6.13
159.2
4
trans-Oxyresveratrol
1-C
–
128.4
–
–
2-C
–
157.3
–
–
3-CH
6.30 (d 2.2)
103.4
6.31
157.3; 159.9
4-C
–
159.9
–
–
5-CH
6.31 (dd 2.2; 9.0)
103.6
6.30; 7.31
159.9
6-CH
7.31 (d 9.0)
128.3
6.31
124.8; 157.3
α-CH
7.25 (d 16.2)
124.8
6.80
142.1
β-CH
6.80 (d 16.2)
126.5
7.25
128.4
1′-C
–
142.1
–
–
2′-CH
6.43 (d 2.1)
105.6
6.13
159.5
3′-C
–
159.5
–
–
4′-CH
6.13 (t 2.1)
102.3
6.43
159.5
5′-C
–
159.5
–
–
6′-CH
6.43 (d 2.1)
105.6
6.13
159.5
–
–
–
–
–
56
Flavanone
2-CH
5.60 (dd 2.9; 13.1)
75.9
2.70; 3.10
43.1

3-CH2a
3.10 (dd 13.1; 16.8)
43.1
2.70; 5.60
75.9
3-CH2b
2.70 (dd 2.9; 16.8)
43.1
3.10; 5.60
Dihydroflavonol
2-CHa
5.38 (d 11.8)
78.2
4.78
70.6

3-CHa
4.78 (d 11.8)
70.6
5.38
78.2
7
Moracin N
2-C
–
156.8
–
–

3-CH
6.88 (sl)
102.3
7.07; 7.22
156.8
4-CH
7.22 (sl)
121.8
6.88; 7.06
123.0; 157.3
5-C
–
128.3
–
–
6-C
–
157.3
–
–
7-CH
7.07 (sl)
94.6
6.88; 7.22
157.3
8-C
–
155.8
–
–
9-C
–
123.0
–
–
1′-C
–
133.9
–
–
2′-CH
6.75 (d 1.8)
103.9
6.24
133.9; 159.6
3′-C
–
159.6
–
–
4′-CH
6.24 (t 1.8)
103.4
6.75
159.6
5′-C
–
159.6
–
–
6′-CH
6.75 (d 1.8)
103.9
6.24
133.9; 159.6
1″CH2
3.33 (d 7.4)
28.1
5.32
124.2; 128.3
2″-CH
5.32 (m)
124.2
3.33; 1.71; 1.73
28.1; 17.8
3″-C
–
132.1
–
–
4″-CH3
1.73 (s)
17.9
3.33
124.2
5″-CH3
1.71 (s)
17.8
3.33
124.2
8
1-Deoxynojirimycin
2-CH
3.64 (m)
68.9
2.82; 3.30; 3.34
47.8; 78.5

3-CH
3.34 (t 9.3)
78.5
3.46; 3.64
68.9; 69.8
4-CH
3.46 (t 9.3)
69.8
3.00; 3.34
61.9; 78.5
5-CH
3.00 (m)
61.9
3.46; 3.80; 3.89
59.4; 69.8
6-CH2a
3.80 (dd 5.5; 11.7)
59.4
3.00; 3.89
61.9
6-CHb
3.89 (dd 3.2; 11.7)
59.4
3.00; 3.80
61.9
1′-CH2a
3.30 (dd 5.7; 11.2)
47.8
2.82; 3.64
68.9
1′-CH2b
2.82 (t 11.2)
47.8
3.30; 3.64
68.9
Despite the qualitative similarity between the extracts observed by NMR, in the region of hydrogens and carbons of oxidized aliphatic chain (δH/δC 3.0–4.5/50–90) there was exclusive presence of these signs in the ethanolic extract. In the HSQC spectrum, correlations between the signs in δH/δC 3.64 (m)/68.9, 3.34 (t 9.3)/78.5, 3.46 (t 9.3)/69.8, 3.0 (m)/61.9, 3.80 (dd 5.5; 11.7)/59.4, 3.89 (dd 5.5; 11.7)/59.4, 3.30 (dd 5.7; 11.2)/47.8 and 2.82 (t 11.2)/47.8 were highlighted. These data were confirmed with the analysis of COSY 1H/1H (2,3JH,H) and HMBC 1H/13C (2,3JC,H) spectra, in addition to the comparison with literature data (McDonnell et al., 2004), which allowed to attribute to the structure of 1-deoxynojirimycin piperidine aminosugar, identified for the first time in B. guianensis species, but occurring in the Moraceae family (Dewick, 2009) (Table 3 and Fig. S4). According to Gao et al. (2016), 1-deoxynojirimycin is a natural biologically active compound present in Morus alba (Moraceae) leaves and roots and it has significant antihyperglycemic, anti-obesity and antiviral activity.b.
The ethyl acetate extract differed from ethanolic not only in the absence of aminosugar 1-deoxynojirimycin, but also, in the quantitative aspect, since approximately 68,41% of the total area of the signals recorded by RMN 1H (Table 1 and Fig. S4A) corresponded to the region of methyl and methylene hydrogens (δH 0.5–1.5). Furthermore, in the analysis of HSQC and COSY spectra, correlations were found in δH/δC 0.88 (t 6.8)/14.4, 1.27 (m)/23.7, which are typical of hydrogens and carbons of –CH3, -(CH2)n- groups of saturated fatty acids, and also correlations by HMBC, of the signals in δH/δC 1.58 (q 7.1)/26.1 (βCH2-) and 2.28 (t 7.1)/35.2 (αCH2-) with the carboxyl signal in δC 177.7. In the HSQC, it was also found a set of correlated signals in δH/δC 0.84 (t 6.9)/12.3, 1.27 (m)/23.7, 2.03 (m)/28.1, 1.58 (q 7.1)/26.1, 2.28 (t 7.1)/35.2, in addition to the typical –CH signal of olefinic hydrogen in cis 5.33 (t 4.6)/122.4 coupling, that allowed to indicate the presence of unsaturated fatty acids (Castejón et al., 2016). In the ethanolic extract spectrum, the region that corresponds to the grease chain signals showed a lower integration than that of ethyl acetate, with about 24.78% of the total area. However, in the region of aromatic hydrogens, the ethanolic extract showed a greater abundance in the signals integration, with approximately 23.70% of the total, thus, indicating a higher content of phenolic compounds, since, the ethyl acetate extract presented only 5.02%.
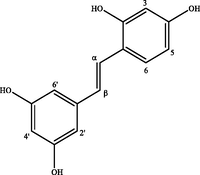
In the region of hydrogens and aromatic carbons, COSY and HSQC spectra indicated important correlations, as the ortho doublet pair δH/δC 7.34 (d 8.2)/128.6 and 6.74 (d 8.2)/116.5, a triplet 6.13 (t 2.1)/102.3 in meta coupling with doublet in 6.44 (d 2.1)/104.4, typical of two aromatic rings, one 1,4-disubstituted and another 1,3,5-tri-substituted, respectively. In the spectrum of HMBC 1H/13C (2,3JC, H), it was observed the correlation of two olefinic doublets in trans coupling in δH 6.95 (d 16.0) and 6.78 (d 16.0) with aromatic carbons fully replaced in δC 130.8 and 139.9. Yet, NMR spectra showed another set of typical signals of 1,2,4-tri-substituted aromatic rings [δH/δC 6.30 (d 2.2)/103.4, 6.31 (dd 2.2; 9.0)/103.6 and 7.31 (d 9.0) / 128.3] and 1,3,5-tri-substituted [δH/δC 6.43 (d 2.1)/105.6 and 6.13 (t 2.1)/102.3] in long-distance correlation (HMBC) with two olefinic doublets in trans δH 6.78 (d 16.2) and 7.25 (d 16.2) coupling. After comparison with spectral data described by Royer et al. (2010), it was determined that the signal sets found in the spectra correspond, respectively, to trans-resveratrol and trans-oxyresveratrol stilbenes, previously isolated in the ethyl acetate extract from the B. guianensis heartwood. According to Reinisalo et al. (2015), these stilbenes stand out for their cardiovascular, chemopreventive, antiobesity, antidiabetic and neuroprotective properties, they are also used as food preservative additives and in the pharmaceutical and cosmetics industry due to their antioxidant and anti-aging properties (Krambeck et al., 2020; Medrano-Padial et al., 2020).
The flavonoids substructural moieties usually show signs in the aromatic H/C region, commonly attributed to ring A 1,2,3,5-tetrasubstituted and ring B 1,4-disubstituted, in addition to ring C, the main point of differentiation between its flavonoid subclasses. In the COSY and HSQC spectra, it was possible to identify substructural moieties referring to the C ring of flavanones, in which a double doublet correlation was observed in δH/δC 5.60 (dd 2.9; 13.1)/75.9, characteristic of oxymetinic hydrogen in trans-diaxial and axial-equatorial coupling, with two double doublets of twin hydrogens in δH/δC 3.10 (dd 13.1; 16.8)/43.1 and 2.70 (dd 2.9; 16.8)/43.1, characteristic of H-2, H-3α and H-3β of flavanones C ring. The spectra also showed a doublet correlation in 5.38 (d 11.8)/78.2 with another doublet in 4.78 (d 11.8)/70.6 typical of oxymetinic hydrogens in dihydroflavonol C ring trans-diaxial coupling (Table 3 and Fig. S4) (Faleva et al., 2020). Compounds from these subclasses were previously isolated by Royer et al. (2010) in the ethyl acetate extract from the B. guianensis heartwood, such as dihydroflavonols, katuranin and dihydromorin, besides flavanone and steppogenin.
Several sub-structural fractions of moracins have been identified in the ethyl acetate and ethanolic extracts, based on the observation of the set of signals, being broad singlets between δH 6.80 and 7.30, characteristic of the hydrogens H-3, H-4 and H-7 of condensed benzofuran ring, in addition to the indicative correlations of 1,3,5-tri-substituted aromatic rings. 2D spectra allowed, together with the comparison with literature data (Royer et al., 2010), relate the signals in δH/δC 6.88 (sl)/102.3, 7.22 (sl)/121.8, 7.07 (sl)/94.6, 6.75 (d 1.8)/103.9, 3.33 (d 7.4)/28.1, 5.32 (m)/124.2, 1.73 (s)/17.9 and 1.71 (s)/17.8 as being of the structure of a bioactive moracin, moracin N. According to Naik et al. (2015), moracin N is an important antioxidant with photoprotective action present in cosmetics, food and it has activity of inhibiting tyrosinase, aromatase and α-glucosidase enzymes.
3.5 HPTLC – Db
The antioxidant assay of B. guianensis forestry waste by bioautography made it possible to evaluate, in situ, the capacity of ethyl acetate and ethanolic extracts constituents in sequestering free radicals DDPH• (2,2-diphenyl-1-picryl-hydrazil) (purple color) making them 2,2-diphenyl-picryl-hydrazine stable molecules (yellow color, indicative of antioxidant activity). The use of the same chromatographic parameters adopted in item 3.2 made it possible to relate phytochemical classes identified with their respective antioxidant capacities, as observed in standards used for moracin, flavonoid and stilbene. A similar behavior was observed in the inocula of all ethyl acetate (A1, A2 and A3) and ethanolic (E1, E2 and E3) extracts replicates, which showed yellow bands throughout the chromatographic path, coinciding with the same Rf observed for phenolic compounds, flavonoids, moracins and stilbenes identified in the phytochemical profile (Figs. 4 and 5). The yellow tint of the chromatographic bands formed is proportional to the amount of free radicals sequestered, thus, it can be inferred that the ethanolic extract had an antioxidant capacity superior to ethyl acetate, a result in accordance with those obtained in the standardization of the signals area from the NMR 1H spectrum and in the phytochemical profile by HPTLC, with the ethanolic extract showing a greater abundance of phenolic compounds compared to ethyl acetate.
HPTLC screening for antioxidants direct bioautography. Moracin M (MM); steppogenin (Eg); trans-resveratrol (tR); Ethyl acetate extract - replicate I (A1); Ethyl acetate extract - replicate II (A2); Ethyl acetate extract - replicate III (A3); Ethanolic extract - replicate I (E1); Ethanolic extract - replicate II (E2) and Ethanolic extract - replicate III (E3). Chromatoplate derivatized with DPPH• radical solution.
3.6 Antioxidant capacity of B. Guianensis waste extracts
The antioxidant potential of B. guianensis forestry waste extracts were quantified by spectroscopy from the absorption decay of DPPḢ and ABTṠ+ solutions and the values obtained are summarized in Fig. 6 and Table 4. It was observed that the ethanolic extract showed a greater antioxidant potential both with solutions of DPPḢ radicals and ABTṠ+ radicals. It presented a minimum inhibitory concentration for the sequestration of 50% of these radicals - IC50, of 23.71 and 5.79 µg/mL, respectively (Table 4), in contrast, the ethyl acetate extract showed IC50 of 119.9 and 18.55 µg/m, under the same analysis conditions. The better performance of the ethanolic extract is justified by the higher concentration of bioactive compounds, such as flavonoids, stilbenes and moracins, evidenced in the chromatographic and spectroscopic profiles. The results also indicated, for the ethanolic extract, an antioxidant potential close to the results found with the Trolox positive control when it comes to the DPPḢ 7.28 µg/mL solution, and similar when using the ABTṠ+ 5.74 µg/mL solution, differing only, in DPPḢ solution in concentrations below 100 µg/mL (Table 4 and Fig. 6). * Note: The values were expressed by the concentration required for the decay of 50% of free radicals; All experiments showed significance with p < 0.05.
Free radicals inhibition percentage, via DPPH• and ABTS+• sequester. Inhibition of free radicals from concentrations of 5, 25, 50, 100, 150 and 200 µg/mL of ethyl acetate and ethanolic extracts of B. guianensis waste.
Sample
DPPḢ IC50 (µg/mL)
ABTṠ+ IC50 (µg/mL)
Ethyl acetate Extract
119.9 ± 1.07
18.55 ± 0.44
Ethanolic Extract
23.71 ± 0.69
5.79 ± 0.29
Trolox
7.28 ± 0.19
5.74 ± 0.43
Antioxidant tests via ABTṠ+ radical sequestration presented, for many analytes, a sensitivity 100 times greater than that found in the analysis by DPPḢ radical sequestration since the reaction mechanism using ABTṠ+ radicals has a lower steric impediment, once the unpaired electron of the ABTṠ+ radical is found in the lateral portion of the chain. This behavior was evidenced in the ethyl acetate extract analysis, which presented IC50 of 119.9 µg/mL for the DPPḢ radical and 18.55 µg/mL with ABTṠ+, indicating a greater selectivity of constituents of this extract with the ABTṠ+ radicals sequestration. This behavior is suggestive that the long grease chain causes a certain steric impediment to stabilize the radical DPPḢ (Table 1, Fig. 2) (Prior et al., 2005).
Results obtained show an important performance of the ethanolic extract for use as a bioproduct with natural antioxidant properties, with potential to be used in different industries, such as food, cosmetic and pharmaceutical. Morus (Mulberry) genus species, widely used by these sectors, also present similar bioactive compounds in their metabolism, as shown by studies developed by Royer et al. (2010), and this is understandable by the fact that B. guianensis species is in the Moreae tribe as the species of Morus genus. This highlights the potential for using B. guianensis timber waste, since several species, such as M. alba (white mulberry), M. nigra (black mulberry) and M. rubra (red mulberry) present several applications, such as medicinal plants, in agriculture, in food, cosmetics and pharmaceutical industries, as they present a wide range of bioactive compounds with anti-inflammatory, anti-glycemic, antiviral, antimicrobial and anti-cancer activities (Hussain et al., 2017).
4 Conclusion
The results obtained allow us to add value to the production chain of the species B. guianensis, because through the analytical techniques HPLC, HPTLC and NMR it was possible to identify the presence of bioactive compounds of pharmacological and economic relevance, such as stilbenes trans-resveratrol, trans-oxyresveratrol, moracin M, moracin N and the amino sugar 1-deoxynojirimycin, indicating the permanence of these bioactive substances in the raw material, even after industrial processing. The ultrasound-assisted extraction of the metabolites present in the matrix showed a greater capacity of ethanol in relation to ethyl acetate, which presented a mass yield six times higher, 3.16% ± 0.38 and 0.51% ± 0.06, respectively. In vitro analyses indicated a significant ability of the ethanol extract to combat DPPḢ and ABTṠ+ radicals, when compared to the ethyl acetate extract, which suggests that it is related to its abundant phenolic composition. The antioxidant results obtained for the ethanolic extract are similar to those of the trolox standard, which together with the results that point to the high composition of bioactive compounds, allow us to point out the potential of the wood residue of B. guianensis to generate bioproducts that act to combat the effects caused by oxidative stress, in addition to its application in cosmetics, pharmaceuticals, stabilizing additives or even as raw material for obtaining bioactive molecules in secondary processes.
Acknowledgements
The authors would like to thank CNPq and PROPESP/UFPA for granting a scholarship and financial support. And the MENDES ROSS timber company for making the raw material feasible.
References
- Valorization of algal waste via pyrolysis in a fixed-bed reactor: Production and characterization of bio-oil and bio-char. Bioresour. Technol.. 2017;243:400-408.
- [CrossRef] [Google Scholar]
- Anticancer mechanism of artonin E and related prenylated flavonoids from the medicinal plant Artocarpus elasticus. Asian J. Nat. Prod. Biochem.. 2021;19:44-56.
- [Google Scholar]
- Evaluation of antibacterial activity of the bark and leaf extracts of Brosimum gaudichaudii Trécul against multidrug resistant strains. Nat. Prod. Res.. 2017;6419:2931-2935.
- [CrossRef] [Google Scholar]
- Mosquiticidal and repellent potential of formulations containing wood residue extracts of a Neotropical plant, Tabebuia heptaphylla. Ind. Crops Prod.. 2019;129:424-433.
- [CrossRef] [Google Scholar]
- Livestock and Food Supplly. Brasilia: Brazilian Forests at a glance; 2019.
- Absorption and fluorescence spectra of poly(p-phenylenevinylene) (PPV) oligomers: An ab initio simulation. J. Phys. Chem. A. 2015;119:1787-1795.
- [CrossRef] [Google Scholar]
- Automatic 1H-NMR screening of fatty acid composition in edible oils. Nutrients.. 2016;8:93.
- [CrossRef] [Google Scholar]
- Morus alba L. Plant: Bioactive Compounds and Potential as a Functional Food Ingredient. Foods.. 2021;10:689.
- [CrossRef] [Google Scholar]
- Timber species performance in secondary forests with over used soils in Eastern Amazonia. Nat. Sin.. 2019;7:800-806.
- [Google Scholar]
- Painel MDP com resina poliuretana à base de óleo de mamona com adição de cimento. Ambient. Constr.. 2020;20:661-669.
- [CrossRef] [Google Scholar]
- Medicinal Natural Products: A Biosynthetic Approach (3rd ed.). England. ISBN: 978-0-470-74168-9; 2009.
- A fast and efficient preparative method for separation and purification of main bioactive xanthones from the waste of Garcinia mangostana L. by high-speed countercurrent chromatography. Arab. J. Chem.. 2021;14:103252
- [CrossRef] [Google Scholar]
- Structural characteristics of different softwood lignins according to 1D and 2D NMR spectroscopy. J. Wood Chem. Technol.. 2020;40:178-189.
- [CrossRef] [Google Scholar]
- Generation of biofuels by slow pyrolysis of palm empty fruit bunches: Optimization of process variables and characterization of physical-chemical products. Biomass Bioenergy. 2020;140:105707
- [CrossRef] [Google Scholar]
- Metabolomic analysis of Strychnos nux-vomica, Strychnos icaja and Strychnos ignatii extracts by 1H nuclear magnetic resonance spectrometry and multivariate analysis techniques. Phytochemistry. 2004;65:1993-2001.
- [CrossRef] [Google Scholar]
- Metabolomic Analysis of Echinacea spp. by 1H Nuclear Magnetic Resonance Spectrometry and Multivariate Data Analysis Technique. Phytochem. Anal.. 2010;21:61-65.
- [CrossRef] [Google Scholar]
- 1-Deoxynojirimycin: Occurrence, extraction, chemistry, oral pharmacokinetics, biological activities and in silico target fishing. Molecules. 2016;21:11.
- [CrossRef] [Google Scholar]
- Investigation of species and environmental effects on rhubarb roots metabolome using 1H NMR combined with high performance thin layer chromatography. Metabolomics. 2018;14:137.
- [CrossRef] [Google Scholar]
- Phytopharmacological potential of different species of Morus alba and their bioactive phytochemicals: A review. Asian Pac. J. Trop. Biomed.. 2017;7:950-956.
- [CrossRef] [Google Scholar]
- Identification and quantification of stilbenes (Piceatannol and resveratrol) in passiflora edulis by-products. Pharmaceuticals. 2020;13
- [CrossRef] [Google Scholar]
- Cytotoxicity studies of a stilbene extract and its main components intended to be used as preservative in the wine industry. Food Res. Int.. 2020;137:109738
- [CrossRef] [Google Scholar]
- Metabolite profiling and inhibitory properties of leaf extracts of Ficus benjamina towards α-glucosidase and α-amylase. Int. J. Food Proper.. 2018;21:1560-1574.
- [CrossRef] [Google Scholar]
- Bioactive benzofuran derivatives: Moracins A-Z in medicinal chemistry. Eur. J. Med. Chem.. 2015;90:379-393.
- [CrossRef] [Google Scholar]
- Phytochemical and Pharmacological Studies on Species of Dorstenia Genus (2000–2016) J. Mex. Chem. Soc.. 2018;62:9-23.
- [Google Scholar]
- Standardized methods for the determination of antioxidant capacity and phenolics in foods and dietary supplements. J. Agric. Food Chem.. 2005;53:4290-4302.
- [CrossRef] [Google Scholar]
- Polyphenol stilbenes: Molecular mechanisms of defence against oxidative stress and aging-related diseases. Oxid. Med. Cell. Longev.. 2015;340520:1-24.
- [CrossRef] [Google Scholar]
- Secondary metabolites of Bagassa guianensis Aubl. wood : A study of the chemotaxonomy of the Moraceae family. Phytochemistry. 2010;71:1708-1713.
- [CrossRef] [Google Scholar]
- Efficacy of Bagassa guianensis Aubl. extract against wood decay and human pathogenic fungi. Int. Biodeterior. Biodegradation. 2012;70:55-59.
- [CrossRef] [Google Scholar]
- Silvicultura na Amazônia Brasileira: Avaliação de experiências e recomendações para implementação e melhoria dos sistemas (1 ed.). Belém, Pará: Cifor; 2006. https://doi.org/10.13140/2.1.3330.0161
- Chemical composition, antioxidant activity, neuroprotective and anti-inflammatory effects of cipó-pucá (Cissus sicyoides L.) extracts obtained from supercritical extraction. J. Supercrit. Fluids. 2018;138:36-45.
- [CrossRef] [Google Scholar]
- Metabolic discrimination of pine resins using multiple analytical platforms. Phytochemistry. 2018;155:37-44.
- [CrossRef] [Google Scholar]
- Thermoanalytical and phytochemical study of the cupuassu (Theobroma grandiflorum Schum.) seed by-product in different processing stages. J. Therm. Anal. Calorim.. 2020;29:1-10.
- [CrossRef] [Google Scholar]
- Experimental evidences for existence of varying moieties and functional groups in assorted crop waste derived organosolv lignins. Ind. Crops Prod.. 2018;119:144-151.
- [CrossRef] [Google Scholar]
- In vitro antioxidant activity of Kyoho grape extracts in DPPH [rad] and ABTS [rad] assays: Estimation methods for EC50 using advanced statistical programs. Food Chem.. 2019;275:41-49.
- [CrossRef] [Google Scholar]
- Plant Drug Analysis (2nd editio. ed.). Munchen, Germany: Springer; 2001.
- Comparative study of Passiflora taxa leaves: Ii. A chromatographic profile. Brazilian J. Pharmacogn.. 2017;27:40-49.
- [CrossRef] [Google Scholar]
- HPTLC-profiling of eleutherosides, mechanism of antioxidative action of eleutheroside E1, the PAMPA test with LC/MS detection and the structure–activity relationship. Saudi J. Biol. Sci.. 2018;25:520-528.
- [CrossRef] [Google Scholar]
- Avaliação das Propriedades Química, Física e Mecânica de Painéis Aglomerados Produzidos com Resíduo de Madeira da Amazônia - Cumaru (Dipteryx Odorata) e Resina Poliuretana à Base de Óleo de Mamona. Polímeros. 2014;24:726-732.
- [Google Scholar]
Appendix A
Supplementary material
Supplementary data to this article can be found online at https://doi.org/10.1016/j.arabjc.2022.103813.
Appendix A
Supplementary material
The following are the Supplementary data to this article:Supplementary data 1
Supplementary data 1


