

Translate this page into:
The use of HPTLC and Direct Analysis in Real Time-Of-Flight Mass Spectrometry (DART-TOF-MS) for rapid analysis of degradation by oxidation and sonication of an azo dye
⁎Corresponding author. Tel.: +33 2 99 05 88 00; fax: +33 2 99 05 88 09. hayetdjelal@ecole-eme.com (Hayet Djelal)
-
Received: ,
Accepted: ,
This article was originally published by Elsevier and was migrated to Scientific Scholar after the change of Publisher.
Peer review under responsibility of King Saud University.

Abstract
Advanced oxidation processes are efficient for the removal of recalcitrant compounds, like azo-dyes. However, the intermediates produced during their degradation can be more toxic than the parent compounds. Improving the knowledge concerning the degradation pathways may be therefore helpful to optimize the process. In this aim, HPTLC and Direct Analysis in Real Time-Of-Flight Mass Spectrometry (DART-TOF-MS) were considered and applied to analyze the sono-oxidation of an azo dye, methyl red sodium salt (MRSS) as a model compound. Initial and final UV–vis spectra showed a clear disappearance of the maximum absorption peak, but shows limit since it cannot allow by-products’ identification. MRSS degradation was confirmed by HPTLC, which also confirmed that MRSS degradation was mainly due to oxidation, while in the considered experimental conditions the sonication effect appeared negligible. The analysis by DART-TOF-MS of the MRSS is characterized by a peak at m/z = 279.137. Three major peaks were observed after the MRSS oxidation: m/z = 139.002, m/z = 223.073 and m/z = 279.137. Relative abundance of m/z = 139.002, which was much higher after oxidation, tends to prove that a large proportion of initial oxydized MRSS was fragmented. The MRSS m/z = 270.078. The coupling of HPTLC and DART-TOF-MS may be subsequently considered to identify the oxidation reaction products.
Keywords
HPTLC
DART-TOF-MS
Azo dyes
MRSS
Sono-oxidation

1 Introduction
Organic dyes constitute one of the larger groups of pollutants in wastewater. These effluents may cause environmental, visual and chemical pollution. Amongst the 106 tons per year of dyes annually produced, about 60–70% were azo-dyes (Neamtu et al., 2002), which constitute therefore the largest group of dyes used in industry, and about 15% are released into the environment. This class of dyes is characterized by an azo linkage N⚌N, a visible light chromophore. They are potentially toxic, as well as their by-products, including aromatic amines (Arslan et al., 2000; Dominguez et al., 2005); they can also perturb aquatic life since some azo-dyes and their degradation products are highly carcinogenic (Brown and De Vito, 1993). For instance, the anionic dye, methyl red, is used in paper printing and textile dyeing (Lachheb et al., 2002), as well as in the food industry (Muthuraman and Teng, 2009; Kucharska and Grabka, 2010); its impact on human health is irritation of the eye, skin and digestive tract if inhaled or swallowed (Robinson et al., 2001).
Physical techniques can be used to remove these recalcitrant pollutants (Vandevivere et al., 1998; Chaudhuri and Sur, 2000) among them: adsorption, flocculation, electro-flocculation, reverse osmosis, ultrafiltration, and coagulation have been applied. The main drawback is the frequent need for expensive regeneration and post-treatment processes, owing to the non destructive characteristic of these processes. Indeed, the pollutant is only transferred to another phase (Arslan et al., 2000; Stock et al., 2000; Comninellis et al., 2008). Advanced oxidation processes (AOP) appear as an interesting way for the treatment of this pollution (Bizani et al., 2006; Brosillon et al., 2008; Chebli et al., 2010; Kayan et al., 2010). An alternative method is the sonocatalytic degradation in the presence of (Grcic et al., 2010) or in the presence of CeO2/TiO2 (Wang et al., 2010).
Several analytical methods have been published for the determination of azo-dyes and their degradation by-products based on UV (Brosillon et al., 2008; Muthuraman and Teng, 2009), HPLC (Scarpi et al., 1998; Kucharska and Grabka, 2010; Kayan et al., 2010), capillary electrophoresis (Borros et al., 1999) and HPTLC (Kucharska and Grabka, 2010).
Thin layer chromatography technique is the easiest one, because there is no need for expensive and complex apparatus (Somsen, 1995; Lavastre et al., 2003). HPTLC is a powerful analytical technique because of its reliability, simplicity, reproducibility and rapid measurement. This method is economical as it requires small amounts of solvents with minimum sample clean up, and its main advantage is that a large number of samples can be simultaneously analyzed (Kotiyan and Vavia, 2000; Neamtu et al., 2002; Chopra et al., 2006). Choosing the appropriate mobile and stationary phases is the sole difficultness of the method. For a qualitative determination of a mixture of dyes, the TLC method is the best solution (Kucharska and Grabka, 2010).
High performance thin-layer chromatography is a derivative of TLC. This method is based on the use of appropriate plates, which ensures a better separation of the analyzed compounds, leading to satisfactory results on the shortest developing distance.
In addition, Direct Analysis in Real Time-Of-Flight Mass Spectrometry (DART-TOF-MS) was introduced in 2005 (Cody et al., 2005). This method is interesting because of its ability to analyze very different samples with minimal destructive sampling and without sample preparation and chromatography (Hajslova and Zrostlikova, 2003; Morlock and Ueda, 2007; Cajka et al., 2008; Curtis et al., 2009). DART-MS technique is an emerging tool for diverse application, as food quality and safety control (Hajslova et al., 2011; Kim et al., 2011; Chernetsova and Morlock, 2012), biological fluids and tissues, drugs, narcotics (Cody et al., 2005; Navare et al., 2010; Chernetsova et al., 2011; Zeng et al., 2012; Shena et al., 2012), printing and writing paper (Adams, 2011) and phtalic acid ester in poly(vinyl chloride) samples (Kuki et al., 2011). The results show DART-MS to be a very promising tool for the rapid analysis of important markers in crude products (Shena et al., 2012).
The aim of the present work was to use HPTLC and Direct Analysis in Real Time (DART) to study the chemical degradation of organic compounds. HPTLC and DART were considered and applied to analyze the sono-oxidation of an azo dye, methyl red sodium salt (MRSS) as a model compound. Like for other oxidative processes, the intermediates produced during the photocatalytic degradation of dyes with or without addition of H2O2 and K2S2O8 can be more toxic than the parent compounds (Bizani et al., 2006). Improving the knowledge concerning the degradation pathways may be therefore helpful to optimize the process by identification of the by-products and hence help in the determination of the metabolic degradation pathways.
2 Materials and methods
2.1 Chemicals and reagents
The chosen azo dye, methyl red sodium salt (MRSS) (Colour Index Number 13020), was purchased from Sigma Aldrich (Isle d’Abeau Chesnes, France) and used without further purification, owing to its high purity, at least 99%. The molecular structure of the dye is given in Fig. 1. Purified water (Elix Millipore equipment, Guyancourt, France) was used to prepare the colored solution.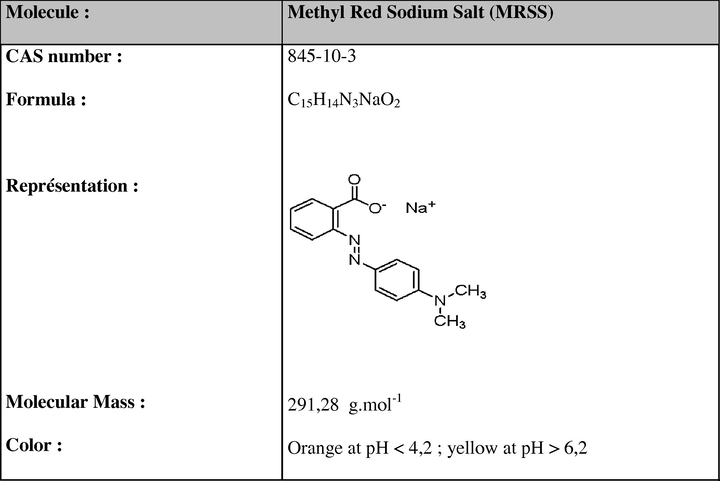
Chemical structure of the methyl red sodium salt.
Hydrogen peroxide 100 volumes and potassium peroxydisulfate were purchased from Merck (Darmstadt, Germany) and VWR (Fontenay sous Bois, France), respectively.
Dichlormethane, ethyle acetate, acetonitrile, toluene, heptane, n-hexane, chloroform, 1,4-dioxane and methanol were of analytical-reagent grade. Plate prewashing was performed with methanol of HPLC-grade (Carlo Erba, Val de Reuil, France).
As stationary phases, the following plate (Merck) was used: silica gel glass HPTLC plate 60 F254 (10 × 10 cm).
2.2 Sono-oxidation
Ultrasonic apparatus (Vibra cell, Sonics & Materials Inc., Danbury, CT., USA) was adopted to irradiate the MRSS solution. It was carried out at an ultrasonic frequency of 20 kHz and an output power of 40 W through manual adjustment according to the available related literature (Hajslova et al., 2011); pH (Eutech Instruments, Thermo-Fisher Scientific, Illkirch, France) and temperature were monitored during experiments.
Dye solutions were prepared at 100 mg L−1 and stored at 4 °C, in the dark. The sonocatalytic degradation of MRSS (100 mL) was performed using hydrogen peroxide (30% w/w) and potassium peroxydisulfate, each at 10 mmol L−1 final concentration for 2 h at room temperature under magnetic stirring (250 rpm). Before analysis, oxidation samples were filtered through a Millipore filter (Millex®-HV–0.45 μm) to avoid particles entering the analytical apparatus.
The study is based on four conditions: MRSS in ultrapure water (condition n°1), MRSS in ultrapure water after sonication treatment (condition n°2), MRSS with K2S2O8 + H2O2 before sonication treatment (condition n°3) and MRSS with K2S2O8 + H2O2 after treatment by sonication (condition n°4).
2.3 Sample analysis
2.3.1 Spectrophotometer
MRSS oxidation was followed by means of a UV–vis Thermospectronic Helios 8 spectrophotometer (Bioblock scientific, Illkirch, France) at the maximum absorption or isobestic wavelength of MRSS.
2.3.2 HPTLC
HPTLC plates were prewashed with methanol and dried in a current air under the extractor hood for 20 min.
Narrow bands of 8 mm in length were sprayed using the Automatic TLC sampler 4 (ATS4, CAMAG). Pre-recorded application parameters for water and nozzle temperature of 40 °C were employed.
Fifteen μL of each MRSS conditions was sprayed on the plate. After drying the starting zones for 1 min, the silica gel plate was developed with each solvent according to the CAMAG method, in order to find the best eluent. Development was performed in the Twin Trough Chamber (TTC 20 × 10 cm, CAMAG) up to a migration distance of 70 mm measured from the lower plate edge. After drying for 10 min, densitometry was performed via absorbance measurement at wavelength 466 nm corresponding to the isobestic point, the point at which the spectra recorded for various pHs cross each other, and wavelength 501 nm corresponding to the maximum absorbance, with TLC Scanner 3 (CAMAG); evaluation was performed via peak height. Owing to the pH effect on the absorbance previously observed for MRSS (Chebli et al., 2010), the isobestic point was mainly considered in this work instead of the maximum absorption point.
For digital documentation, the Digistore 2 Documentation System (CAMAG) consisting of illuminator Reprostar 3 with digital camera Baumer optronic DXA252 was applied in the reflectance mode at UV 254 nm. Exposure time was set for 400 ms and gain at 1. Data obtained were processed with WinCATS software, version 1.4.2 (CAMAG). The exact zone positions were marked.
For calibration curves of MRSS, two solutions of MRSS (0.1 μg μL−1 and 1 μg μL−1) were prepared in ultrapure water. Different volumes of the two stock solutions were sprayed on three HPTLC plates to obtain masses of 0.1, 0.5, 1.5, 10, 15, 20, and 25 μg spot−1 of MRSS. The data of peak areas at 466 nm plotted against the corresponding concentrations were treated by a polynomial analysis.
2.3.3 DART-MS
Samples were automatically introduced into the excited gas stream of DART (IonSense, Danvers, MA, USA) which was installed on a JMS-T100LC (AccuTOF-LC) [Jeol (Europe), Croissy sur Seine, France]. Helium was used as gas with a flow rate of 2.5 L/min and the gas heater was set to 250 °C. The distance between the first orifice lens and the exit of the DART gas flow was fixed to 15 mm. The needle voltage of the dart was 2 kV. For positive-ion detection the potentials of the second perforated electrode and the grid electrode were biased to positive potentials of 11 V and 250 V, respectively. The first orifice lens, that is, the interface for atmospheric pressure state, was set to 35 V, the spectra recording interval was 0.5 s. The mixture solution of polyethylene glycol PEG 600 was used as calibrant for the mass scale. The resolution of mass spectrometer (AccuTOF CS) was 6000 DA at full width of the peak at half its maximum height. For the data acquisition and processing, MassCenter 1.3 software was used. When a sample was introduced in the DART gas stream, the peaks of the target compound appeared immediately on the TIC or mass chromatograms.
3 Results and discussion
3.1 Oxidation study of MRSS by UV–vis absorption spectra
MRSS UV–vis spectrum is displayed in Fig. 2. As shown, maximum absorption wavelength was observed at 501 nm, in agreement with a previous report (Chebli et al., 2010).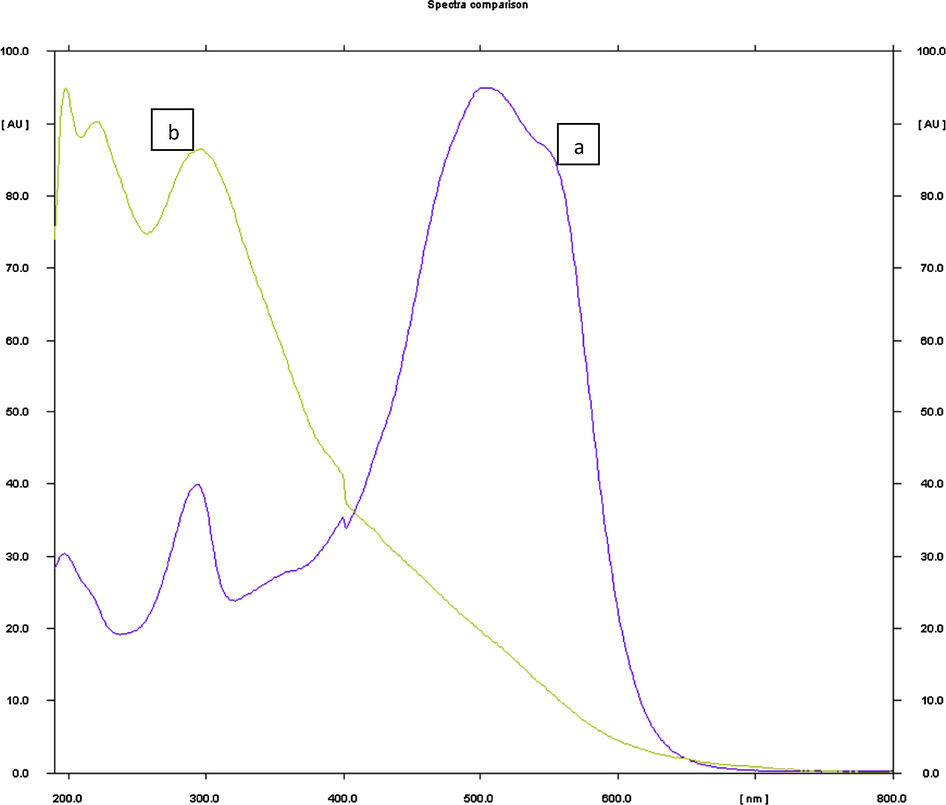
UV–vis spectroscopic analysis of the MRSS solutions before (a) and after oxidation using H2O2 and
(b).
Both sonication and oxidation, as well as their combination, were tested for MRSS degradation.
Ultrasound has been therefore combined to oxidation involving H2O2 and . Dye sono-oxidation was carried out for 2 h, but did not allow to improving the degradation yield (30%) at 501 nm, if compared to the direct oxidation. Initial and final UV–vis spectra showed a clear disappearance of the maximum absorption peak, at 501 nm (Fig. 2), which corresponded most likely to the main chromophore, the azo-linkage. The peak recorded at 300 nm corresponded most likely to the naphthalene ring, as well as the benzene ring peak observed at 221 nm (Chebli et al., 2010) (Fig. 2).
3.2 Oxidation study of MRSS by HPTLC
The spectrophotometric method (UV–vis) shows limit, since it cannot allow by-products’ identification. To improve the identification of sono-oxidation by-products, more fine analytical techniques should be considered. In this aim HPTLC has been considered.
3.2.1 Development of the optimum mobile phase
The first step consisted of the development of the method. The HPTLC procedure was optimized according to the “Camag method”. It consists of developing plates with each pure solvent. The most appropriate protocol is to test one or two solvents from eight classes of the Snyder triangle. The solvents that move the compounds onto the plate were selected; and then mixtures of solvents were tested until the best eluent was found.
Fifteen μL of the MRSS dye (condition n°1) was sprayed on fourteen silica gel HPTLC plates and they were developed with the following solvents (Table 1). Finally, the mobile phase consisting of chloroform (100%) gave a sharp and well-defined peak at Rf = 0.10 (Fig. 3). Well-defined spots were obtained when the chamber was saturated with the mobile phase for 30 min at room temperature. Diffuse spots were obtained with other solvents. (See Fig. 4)
Eluant
Number of spots
Rf
Dichloromethane 100%
Start + 1 spot
0.01
Ethyl acetate 100%
Start + 1 spot
0.47
Acetonitrile 100%
Start + 1 spot
0.65
Toluene 100%
Start
0
n-Heptane 100%
Start + 1 spot
0.74
Hexane 100%
Start
0
Chloroform 100%
Start + 2 spots
0.03 and 0.10
1,4-Dioxane 100%
Start + 1 spot
0.59
Ethanol 100%
Start + 1 spot
0.61
Methanol 100%
Start + 2 spots
0.71 and 0.86
Chloroform/ethyl acetate 50/50 V/V
Start + 2 spots
0.41 and 0.47
Chloroform/acetonitrile 50/50 V/V
Start + 1 spot
0.76
Chloroform/methanol 50/50 V/V
Start + 1 spot
0.75
Chloroform/ethanol 50/50 V/V
Start + 1 spot
0.80
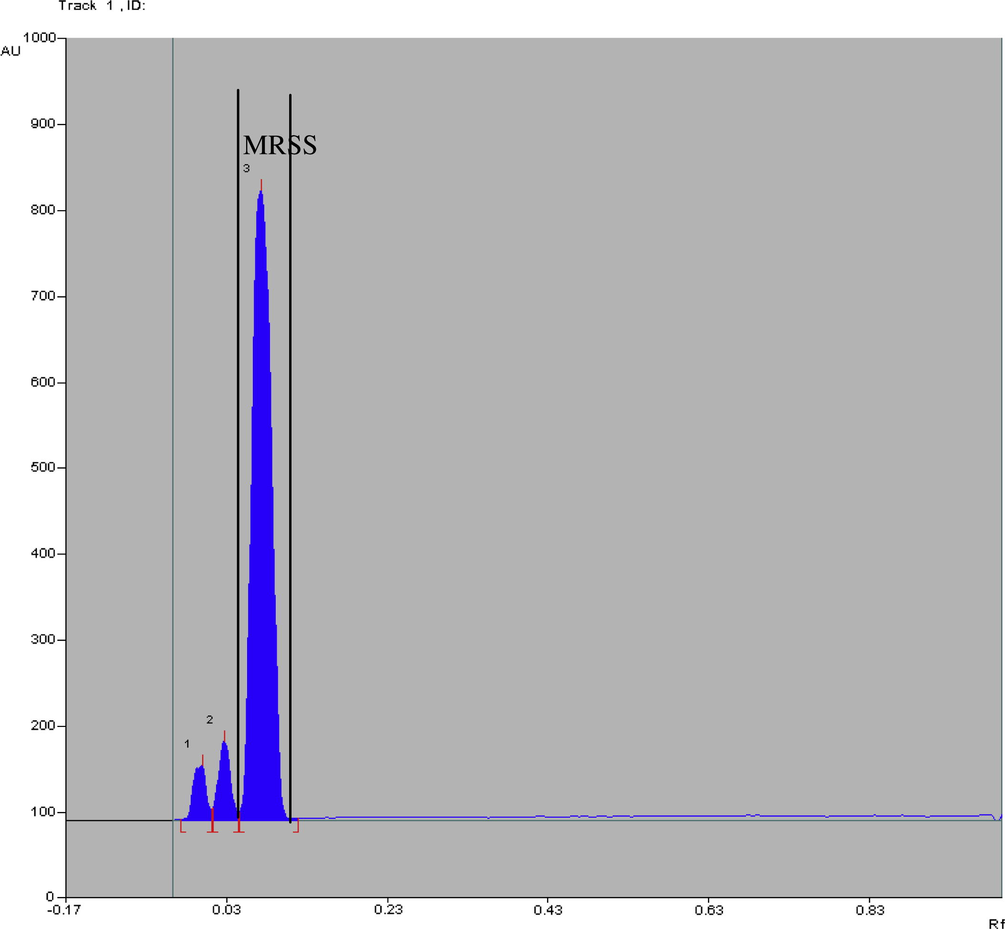
Chromatogram of MRSS (15 μL i.e. 1.5 μg): peak 3 (Rf = 0.09 ± 0.03) mobile phase: chloroform 100%; detection wavelength: 466 nm, silica gel glass HPTLC plate 60 F254 (10 × 10 cm).
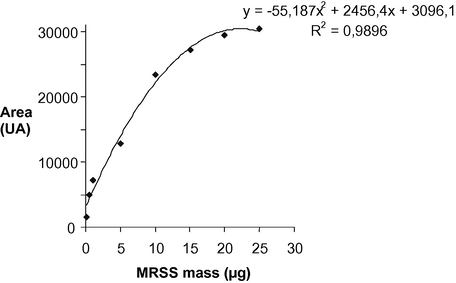
Calibration curve for pure MRSS.
3.2.2 Calibration curves
The developed HPTLC method for the determination of MRSS showed a correlation coefficient r2 = 0.9896 in a mass range of 0.1–25 μg spot−1 with respect to the peak area at 466 nm (Fig. 5), showing an easy and quantitative monitoring of the target compound removal.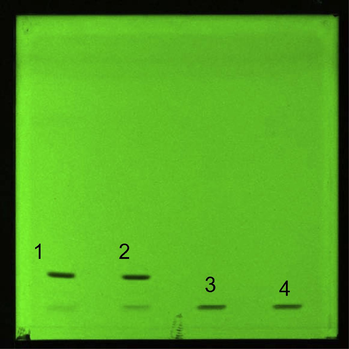
HPTLC plate of sonication and sono-oxidation of MRSS, mobile phase: chloroform 100%; detection wavelength: 466 nm, silica gel glass HPTLC plate 60 F254 (10 × 10 cm). Legend: 1: condition n° 1, 2: condition n° 2, 3: condition n° 3, 4: condition n° 4.
3.3 Oxidation study of MRSS
In the first step, 15 μL of the MRSS dye was also sprayed (condition n°3 – MRSS with oxidants before sonication) on the same type of plates in order to confirm if 100% chloroform is an appropriate eluent in both conditions. Unfortunately, MRSS dye (condition n°3) did not migrate with chloroform 100%. Therefore, the same pure solvents were tested in order to select the most appropriate eluent for this experimental condition. However, none of the tested solvents appear really relevant; and hence chloroform 100% was considered for the four experimental conditions.
In a second step, the four conditions were sprayed on the HPTLC plate, showing that the sonication had no effect on the MRSS dye. Indeed, on one hand pure MRSS (condition n°1) and sonicated (condition n°2) led to similar spots (Fig. 5), while on the other hand MRSS oxidated (condition n°3) and sono-oxidated (condition n°4) led to similar spots (Fig. 5). Two conditions were then considered: MRSS in ultrapure water (condition n°1) and MRSS with K2S2O8 + H2O2 (condition n°3). HPTLC analysis allowed to characterize MRSS degradation after the addition of K2S2O8 + H2O2. Indeed, the Rf value for the condition n°1 was 0.10, while no migration was shown for the plate corresponding to the condition n°3, which stayed at the start zone.
The above results clearly showed that in our experimental conditions, there is no clear impact of the sonication, which was also confirmed for decreasing working volumes (in the range 100 to 25 mL – data not shown). Indeed, to remain economically relevant low output power (40 W) and frequency (20 kHz) was considered. In addition, a partial degradation may be expected from the use of a low energy level, leading to a significant residual organic content available for a subsequent biological treatment (Chebli et al., 2010). Obviously in these conditions, there is no acoustic cavitation or the short lifetime of •OH radicals did not allow to react with polar organic compounds like the considered azo dye; a large fraction of the formed radicals recombine at the interface of the bubble before reacting with hydrophilic substances (Torres et al., 2008). Some authors advocate the combination of sonication and advanced oxidation processes (Stock et al., 2000; Grcic et al., 2010; Wang et al., 2010). In this early study, to avoid a too complex and energy consuming process, only oxidants (Grcic et al., 2010) were added in combination with sonolysis.
3.4 Oxidation study of MRSS by DART-TOF-MS
The use of DART-TOF-MS appears as a first insight to the MS analysis of the phenomena occurring during experiments. Indeed, the DART method allows an easy check of target compound degradation owing to its direct, rapid and gentle characteristics (Morlock and Ueda, 2007; Navare et al., 2010; Chernetsova et al., 2011). The purpose was to assess this analytic method for the monitoring of any modification occurring during sonication and/or oxidation of MRSS; at this stage of the study the objective was not to present a comprehensive scheme of the reaction or the fragmentation induced by the method. Preliminary results are presented here, and further study will be subsequently conducted.
We considered as a reference the spectrum of MRSS in water, which is presented in Fig. 6a. We got only one peak of high intensity at m/z = 270.078, and a lower one at m/z = 271.074. The molecular weight of MRSS is 291.28 g.mol−1, but since the salt was dissolved in water, Na+ cation cannot be considered in DART; indeed, alkali metal cation attachments are never observed by this method (NIST Mass Spectrometry Data Center Collection, 2008). Hence the molecular weight to take into account was 268.29 g.mol−1. Our peak at 270.069 could consequently be interpreted as [M + 2H]. After sonication, the spectrum remains almost unchanged, which may mean that the sonication did not provoke any major fragmentation of MRSS (data not shown), in agreement with the above results recorded by means of UV and HPTLC analysis.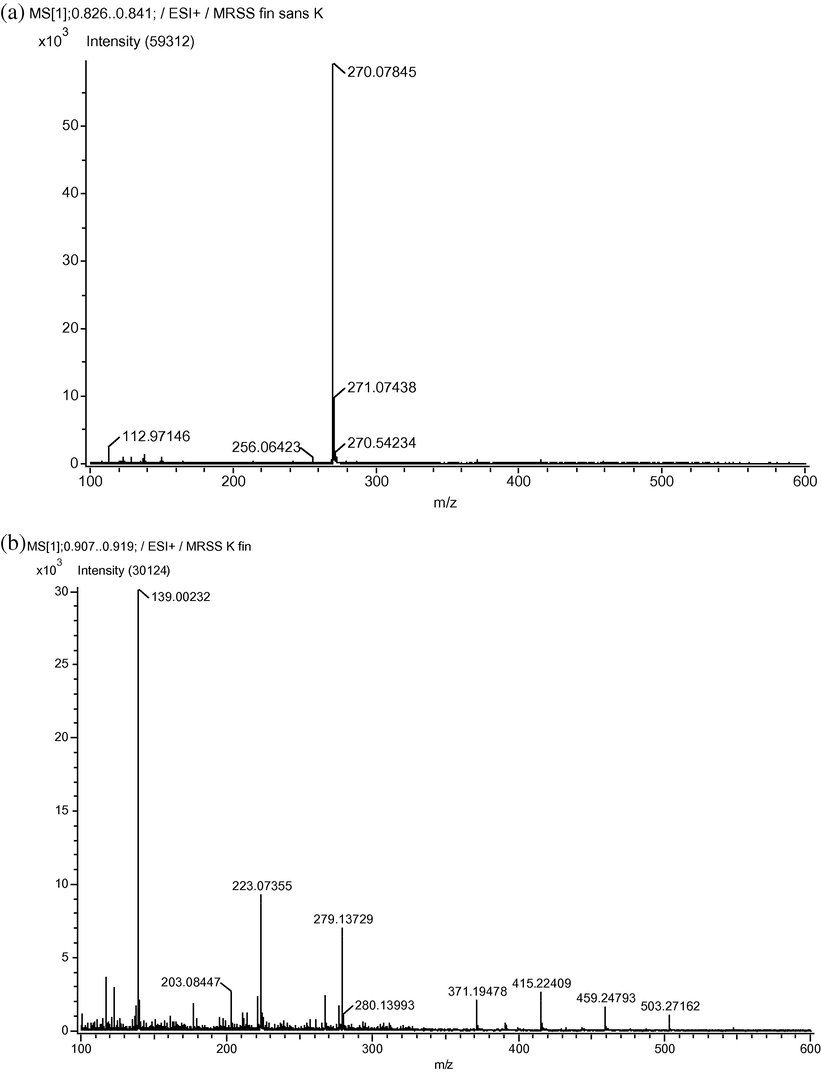
Spectra obtained by direct analysis in real time-of-flight mass spectrometry (DART-TOF-MS) of the MRSS before (a) and after oxidation using H2O2 and
(b).
Concerning the spectra obtained from oxidized MRSS, the scheme is totally different; it confirmed that MRSS was not any more in its original state after oxidation, even without sonication. Indeed, the three major peaks observed, m/z = 139.002, m/z = 223.064 and m/z = 279.127, respectively, (Fig. 6b) do not lead to obvious assignation neither regarding MRSS structure nor the products of the oxidation reaction. Relative abundance of m/z = 139.002, which was much higher after sono-oxidation, tends to prove that a large proportion of initial oxidized MRSS was fragmented. However, sonication seems to increase the recombination process within the solution or induced by the DART ionization method. That may be an interpretation for the high m/z peaks exhibited by sono-oxidated MRSS (m/z = 371.19, m/z = 415.224, m/z = 459.248 and m/z = 503.272, respectively). Indeed, the results recorded by the DART method differ significantly from other ionization processes, like electron ionization (EI-MS) for instance. Examination of the spectrum of methyl red (i.e. MRSS with bonding hydrogen instead of the Na+ counterion) obtained by EI (NIST Mass Spectrometry Data Center Collection, 2008) leads to two remarks (Fig. 7): the spectrum possesses a larger number of peaks and most of these peaks match the masses of fragments classically observed in MS, as shown in Table 2![Methyl red spectrum obtained by electron ionization-mass spectrometry method (NIST – [36]).](/content/184/2017/10/2_suppl/img/10.1016_j.arabjc.2013.06.003-fig7.png)
Methyl red spectrum obtained by electron ionization-mass spectrometry method (NIST – [36]).
m/z measured in EI-MS
Corresponding fragments
269
M+•
253
[M–O]+
224
148
120
105
77
42
Unassigned peak
Sonication induces radical formation as follows (Sivasankar and Moholkar, 2009):
In this aim, hydrogen peroxide and potassium peroxydisulfate have been tested as oxidants for direct azo-dye degradation or in advanced oxidation process (Kayan et al., 2010). The main purpose was to combine two oxidants in order to achieve better mineralization extent due to consequent generation of various non-selective radicals, like OH•, and (Huang et al., 2002; Bizani et al., 2006; Grcic et al., 2010; Kayan et al., 2010).
The persulfate has a high oxidation potential as seen in Eq. (4); however, the reaction is irreversible and proceeds at a low rate.
Hydrogen peroxide has a smaller oxidation potential than persulfate (E = 1.77 eV versus NHE).
Free radicals are formed in aqueous solution after heating the persulfate solution:
The pH of MRSS in ultrapure water was 6.0, while in the presence of oxidative reactants, namely K2S2O8 and H2O2, it decreased to 3.8. Indeed, in agreement with the following relations (7,8), the addition of these oxidants causes a significant pH decrease (Kayan et al., 2010):
To complete this study using DART-TOF-MS, further investigations are needed which are in progress to fully understand the consequences of the sono-oxidation process and that of the ionization method, and to discriminate between both. However, at this stage, we can only conclude that effects of none of the two processes can be neglected.
To complete this study using DART-TOF-MS, further investigations are needed which are in progress to fully understand the consequences of the sono-oxidation process and that of the ionization method, and to discriminate between both. However, at this stage, we can only conclude that effects of none of the two processes can be neglected.
4 Conclusions
The above results showed that in the tested experimental conditions there was no clear impact of the sonication; the azo-dye degradation resulted mainly from oxidation after the addition of H2O2 and K2S2O8. Indeed, pure and sonicate MRSS led to similar results on one hand, while oxidated and sono-oxidated MRSS led to similar results on the other hand, as confirmed from UV spectra and HPTLC analysis.
These results were confirmed by DART-TOF-MS analysis, since three major peaks were observed after MRSS oxidation, m/z = 139.002, m/z = 223.073 and m/z = 279.137, while pure MRSS led to a peak at m/z = 270.078. The results show DART-MS to be a very promising tool for the rapid analysis. Further experiments are however needed to identify the fragments and propose a degradation pathway.
This work showed that the considered analytical tools appeared relevant for a fast control and monitoring of target compounds’ degradation; this would be especially helpful in case of experiments on real effluents.
References
- Analysis of printing and writing papers by using direct analysis in real time mass spectrometry. Int. J. Mass Spectrom.. 2011;301:109-126.
- [Google Scholar]
- H2O2/UV-C and Fe2+/H2O2/UV-C versus TiO2/UV-A treatment for reactive dye wastewater. J. Environ. Eng.. 2000;126:903-911.
- [Google Scholar]
- Photocatalytic decolorization and degradation of dye solutions and wastewaters in the presence of titanium dioxide. J. Hazard. Mater.. 2006;136:85-94.
- [Google Scholar]
- Innovative integrated process for the treatment of azo dyes: coupling of photocatalysis and biological treatment. Desalination. 2008;22:331-339.
- [Google Scholar]
- The use of capillary electrophorèse to study the formation of carcinogenic aryl amines in azo dyes. Dyes Pigm.. 1999;43:189-196.
- [Google Scholar]
- Rapid analysis of multiple pesticide residues in fruit-based baby food using programmed temperature vaporiser injection–low-pressure gas chromatography–high-resolution time-of-flight mass spectrometry. J. Chromatogr. A. 2008;1186:281-294.
- [Google Scholar]
- Oxidative decolorization of reactive dye solution using fly ash as catalyst. J. Environ. Eng.. 2000;126:583-594.
- [Google Scholar]
- Supported photocatalysis as a pre-treatment prior to biological degradation for the removal of some dyes from aqueous solutions, acid red 183; Biebrich Scarlet; methyl red sodium salt; orange II. Chem. Technol. Biotechnol.. 2010;85:555-563.
- [Google Scholar]
- The use of DART mass spectrometry for express confirmation of empirical formulas of heterocyclic compounds. Russ. Chem. Bull.. 2011;59:2014-2015.
- [Google Scholar]
- Assessing the capabilities of direct analysis in real time mass spectrometry for 5-hydroxymethylfurfural quantitation in honey. Int. J. Mass Spectrom.. 2012;314:22-32.
- [Google Scholar]
- Validation high-performance thin-layer chromatography method for determination of trigonelline in herbal extract and pharmaceutical dosage form. Anal. Chim. Acta. 2006;577:46-51.
- [Google Scholar]
- Versatile new ion source for the analysis of materials in open air under ambient conditions. Anal. Chem.. 2005;77:2297-2302.
- [Google Scholar]
- Advanced oxidation processes for water treatment. J. Chem. Technol. Biotechnol.. 2008;83:769-776.
- [Google Scholar]
- Determination of the presence or absence of sulfur materials in drywall using direct analysis in real time in conjunction with an accurate-mass time-of-flight mass spectrometer. J. Am. Soc. Mass Spectrom.. 2009;20:2082-2086.
- [Google Scholar]
- Synthetic polymer delivery system. Sustained release of persulfate during the photo-oxidation of an azo-dye. J. Photochem. Photobiol.. 2000;136:125-131.
- [Google Scholar]
- Vis and UV photocatalytic detoxification methods (using TiO2, TiO2/H2O2, TiO2/O3, , O3, H2O2, , and ) for dyes treatment. Catal. Today. 2005;101:389-395.
- [Google Scholar]
- A review of chromatographic methods for determination of synthetic food dyes. Talanta. 2010;80:1045-1051.
- [Google Scholar]
- Modeling the mineralization and discoloration in colored systems by (US) processes: A proposed degradation pathway. Chem. Eng. J.. 2010;157:35-44.
- [Google Scholar]
- Matrix effects in (ultra)trace analysis of pesticide residues in food and biotic matrices. J. Chromatogr. A. 2003;100:181-197.
- [Google Scholar]
- Challenging applications offered by direct analysis in real time (DART) in food-quality and safety analysis. Trends Anal. Chem.. 2011;30:204-218.
- [Google Scholar]
- Kinetics of heat-assisted persulfate oxidation of methyl ter-butyl ether (MTBE) Chemosphere. 2002;49:413-420.
- [Google Scholar]
- Sonophotocatalysis in advanced oxidation process: a short review. Ultrason. Sonochem.. 2009;16:583-589.
- [Google Scholar]
- Degradation of acid red 97 dye in aqueous medium using wet oxidation and electro-Fenton techniques. J. Hazard. Mater.. 2010;177:95-102.
- [Google Scholar]
- Identification of ambiguous cubeb fruit by DART-MS-based fingerprinting combined with principal component analysis. Food Chem.. 2011;129:1305-1310.
- [Google Scholar]
- Stability indicating HPTLC method for the estimation of estradiol. J. Pharm. Biomed. Anal.. 2000;22:6671-6676.
- [Google Scholar]
- Fast identification of phthalic acid esters in poly(vinyl chloride) samples by direct analysis in real time (DART) tandem mass spectrometry. Int. J. Mass Spectrom.. 2011;303:225-228.
- [Google Scholar]
- Photocatalytic degradation of various types of dyes (Alizarin S, Crocein orange G, methyl red, congo red, methylene blue) in water by UV-irradiated titania. Appl. Catal. B. 2002;39:75-90.
- [Google Scholar]
- Thin layer chromatography for the detection of unexpected reactions in organometallic combinatorial catalysis. Adv. Synth. Catal.. 2003;345:974-977.
- [Google Scholar]
- New coupling of planar chromatography with direct analysis in real time mass spectrometry. J. Chromatogr. A. 2007;1143:243-251.
- [Google Scholar]
- Extraction of methyl red from industrial wastewater using xylene as an extractant. Prog. Nat. Sci.. 2009;19:1215-1220.
- [Google Scholar]
- Rapid direct analysis in real time (DART) mass spectrometric detection of juvenile hormone III and its terpene precursors. Anal. Bioanal. Chem.. 2010;398:3005-3013.
- [Google Scholar]
- Kinetics of decolorization and mineralization of reactive azo dyes in aqueous solution by the UV/H2O2 oxidation. Dyes Pigm.. 2002;53:93-99.
- [Google Scholar]
- NIST Mass Spectrometry Data Center Collection, 2008.
- Remediation of dyes in textile effluent: a critical review on current treatment technologies with a proposed alternative. Bioresour. Technol.. 2001;77:247-255.
- [Google Scholar]
- High-performance liquid chromatography determination of direct and temporary dyes in natural hair colourings. J. Chromatogr. A. 1998;796:319-325.
- [Google Scholar]
- Rapid control of Chinese star anise fruits and teas for neurotoxic anisatin by direct analysis in real time (DART) high resolution mass spectrometry. J. Chromatogr. A 2012
- [CrossRef] [Google Scholar]
- Mechanistic approach to intensification of sonochemical degradation of phenol. Chem. Eng. J.. 2009;149:57-69.
- [Google Scholar]
- Planar chromatography coupled with spectroscopic techniques. J. Chromatogr. A. 1995;703:613-665.
- [Google Scholar]
- Influence of TiO2 concentration on the synergistic effect between photocatalysis and high-frequency ultrasound for organic pollutant mineralization in water. Appl. Catal. B. 2008;80:168-175.
- [Google Scholar]
- Combinative sonolysis and photocatalysis for textile dye degradation. Environ. Sci. Technol.. 2000;34:1747-1750.
- [Google Scholar]
- Treatment and reuse of wastewater from the textile wet-processing industry: review of emerging technologies. J. Chem. Technol. Biotechnol.. 1998;72:289-302.
- [Google Scholar]
- Sonocatalytic degradation of organic dyes and comparison of catalytic activities of CeO2/TiO2, SnO2/TiO2 and ZrO2/TiO2 composites under ultrasonic irradiation. Ultrason. Sonochem.. 2010;17:642-648.
- [Google Scholar]
- Direct analysis in real time mass spectrometry and multivariate data analysis: a novel approach to rapid identification of analytical markers for quality control of traditional Chinese medicine preparation. Anal. Chim. Acta. 2012;733:38-47.
- [Google Scholar]


