Translate this page into:
Theoretical and experimental study on Chloroquine drug solubility in supercritical carbon dioxide via the thermodynamic, multi-layer perceptron neural network (MLPNN), and molecular modeling
⁎Corresponding author. shirazians@susu.ru (Saeed Shirazian)
-
Received: ,
Accepted: ,
This article was originally published by Elsevier and was migrated to Scientific Scholar after the change of Publisher.
Peer review under responsibility of King Saud University.
Abstract
The design and development of supercritical carbon dioxide (sc-CO2) based processes for production of pharmaceutical micro/nanoparticles is one of the interesting research topics of pharmaceutical industries owing to its attractive advantages. The solubility of drugs in sc-CO2 at different temperatures and pressures is an essential parameter which should be determined for this purpose. Chloroquine as a traditional antirheumatic and antimalarial agent is approved as an effective drug for the treatment of Covid-19. Pishnamazi et al. (2021) measured the solubility of this drug in sc-CO2 at the pressure range of 120–400 bar and temperature range of 308–338 K, and correlated the obtained data using some empirical models. In this work, a comprehensive computational approach was developed to more accurately study the supercritical solubility of Chloroquine. The thermodynamic models include two equations-of-state based models (Peng-Robinson and Soave-Redlich-Kowang) and two activity coefficient-based models (modified Wilson's and UNIQUAC)), as well as, a multi-layer perceptron neural network (MLPNN)) were used for this purpose. Also, molecular modeling was performed to study the electronic structure of Chloroquine and identify the potential centers of intermolecular interactions during the dissolution process. According to the obtained results, all of the theoretical models can predict Chloroquine solubility in sc-CO2 with acceptable accuracy. Among these models, the MLPNN model possesses the highest precision with the lowest average absolute relative deviation (AARD%) of 1.76 % and the highest Radj value of 0.999.
Keywords
Drug solubility
Molecular modeling
Thermodynamics
Supercritical solvent
Nanomedicine
Nomenclature
- AARD%
-
Average absolute relative deviation
-
Energy parameter of the cubic EoS (Nm4 mol−2)
- b
-
Volume parameter for equations of state (m3 mol−1)
- f2L
-
The fugacity of the solid solute in the supercritical phase
- f2s
-
The fugacity of the solute in the solid phase
- Hf
-
Molar heat of fusion(kJ.mol−1)
- gE
-
Excess Gibbs free energy
- kij
-
Binary interaction parameters in the mixing rules
- lij
-
Binary interaction parameters in the mixing rules
- MSR
-
Mean square regression
- MSE
-
Mean square residual
- N
-
Number of data points, dimensionless
- Psub
-
Sublimation pressure (Pa)
- Q
-
Number of independent variables
- R2
-
Correlation coefficient
- Radj
-
Adjusted correlation coefficient
- S
-
Equilibrium solubility
- SSE
-
Error sum of squares
- SST
-
Total sum of squares
- SSR
-
Regression sum of squares
-
Critical temperature
- vs
-
Solid molar volume
- vdW2
-
Van der Waals mixing rule with two adjustable parameters
- y
-
Mole fraction solubility
- Z
-
Number of adjustable parameters
- r
-
Volume parameter of the UNIQUAC model
- q
-
surface area of the UNIQUAC model
- α(Tr, ω)
-
Temperature-dependent function in the attractive parameter of the EoS
- φ
-
Fugacity coefficient
- ω
-
Acentric factor
- α
-
Regressed parameters of the Wilson’s and UNIQUAC models
- β
-
Regressed parameters of the Wilson’s and UNIQUAC models
- λ′
-
Regressed parameters of Wilson’s model
-
Adjustable parameters
-
The activity coefficient of the solid solute at infinite dilution
Greek symbols
- cal
-
Calculated
- exp
-
Experimental
- i, j
-
Component
- 1
-
Supercritical carbon dioxide
- 2
-
Solid solute
Superscripts
1 Introduction
In recent decades, development of supercritical carbon dioxide (sc-CO2) based processes in the pharmaceutical industry has attracted much attention for development of advanced pharmaceutical manufacturing. Classification of sc-CO2 as a safe solvent by FDA (Kankala et al., 2017); significant decrement of required toxic solvents, production of high quality products without residual solvent, processing at low temperatures, and also adjustable solvation power as a function of pressure and temperature have led to widespread utilization of sc-CO2 in various pharmaceutical processes. Among the various proposed applications, micronization/nanonization of pharmaceutical particles (e.g., solid oral dosage formulations) with desired particle attributes is one of the most important ones. The equilibrium solubility of the pharmaceutical substances in sc-CO2 is one of the main operational parameters which should be specified for design and optimization of these processes. Accordingly, obtaining the solubility of various drug molecules in sc-CO2 to find the suitable candidates to be processed through a sc-CO2 based technique has become an interesting research topic (Ardestani et al., 2020; Morales-Díaz et al., 2021). However, experimental measurement of substances solubility in sc-CO2 over a wide range of temperatures and pressures is very time consuming and requires complex and expensive apparatuses. So, thermodynamic modelling and theoretical prediction of this parameter at different operational conditions is indispensable. For this purpose, several theoretical methods including, density-based models (empirical models), equation of state (EoS) (cubic and non-cubic) based models and expanded liquid models were presented and validated. Furthermore, smart methods (e.g. artificial neural network (ANN)) (Rezaei et al., 2022) and machine Learning Models (Najmi et al., 2022) were also used to correlate the solubility of solids in sc-CO2 with acceptable accuracy.
Empirical models were proposed for correlation of solubility data and shown to be facile methods (Faress et al., 2022). However, these models are directly interrelated with the experimental solubility data and their adjustable parameters should be determined according to experimental values (Ali Sajadian et al., 2022).
In the equation of state-based theories, supercritical carbon dioxide is considered as a condensed phase (solvent phase) and calculations is basically carried out according to the fugacity coefficient of the solute, i.e., the drug substances (Ali Sajadian et al., 2022). Equation of states are classified as, (i) cubic EoS in which the pressure can be written as a cubic function of molar volume (e.g. Peng-Robinson (PR) (Peng and Robinson, 1976) and Soave- Redlich-Kowang (SRK) (Soave, 1972), and (ii) non cubic EoS which are based on statistical associating fluid theory (SAFT) (e.g. Perturbed-Chain Polar Statistical Associating Fluid Theory (PCP-SAFT) (Gross, 2005).
Unlike these models, in expanded liquid theories such as UNIQUAC method (Nasri et al., 2012) and modified Wilson's models (Nasri, 2018), sc-CO2 is regarded as an expanded liquid, due to proximity of its density to the liquids density (Higashi et al., 2001). Accordingly, this modelling is performed according to activity coefficient of the solute. Both of equation of state and expanded liquid-based models need critical properties, molar volume and the sublimation pressure of the solute. Generally, these properties are not known for complex solute molecules and their experimental measurement is not always possible. So, various group contribution (GC) methods have been suggested for their estimation and therefore, the accuracy of the applied correlation significantly depends to the used GC method.
The artificial neural network (ANN) is a plain powerful tool to model and optimize the various processes. So, its application as a practical modelling tool in various computational engineering projects has received much attention, because of its ability for solving the complex problems. Indeed, no requirement to a mathematical model, capability in representing the complicated relation between the input and output parameters, and also learning from the experiences and interpolating the results, even for the case of incomplete inputs, are the main outstanding features of the ANN models compared to the standard computing methods (Lashkarbolooki et al., 2011; Vaferi et al., 2013).
Chloroquine (C18H26ClN3), with the chemical structure shown in Fig. 1, is a traditional antirheumatic and antimalarial agent with antivirus and anti-inflammatory effects. It has also been confirmed that Chloroquine can be prescribed as an efficient drug for the therapy of Covid-19 patients by inhibiting the replication of the corona virus and preventing it from entering into the cells (Liu et al., 2020). However, some adverse digestive problems such as dysgeusia, dyspepsia, nausea and stomach pain, as well as other side effects like headache, ocular disorder and serious heart rhythm abnormalities have been reported for this medicine (Ponticelli and Moroni, 2017). As has been proven for most of the drugs (Amani et al., 2021; Türk, 2016; Abuzar et al., 2018), reducing the Chloroquine particles size to micro/nano scale can significantly enhance its dissolution rate and bioavailability and reduce drug dosage, leading to mitigation of these complications for patients. Therefore, enhancing the solubility of Chloroquine by nanonization technique is a very attractive task.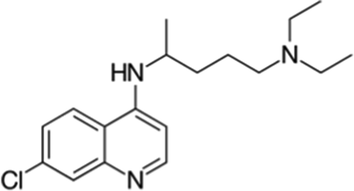
Chemical structure of Chloroquine.
Pishnamazi et al. (Pishnamazi et al., 2021) determined the solubility of Chloroquine in sc-CO2 at the various pressures of 120–400 bar and temperatures of 308–338 K. It was obtained in the range of 1.64 × 10⁻⁵ to 8.92 × 10⁻⁴ in terms of mole fraction. Also, they correlated the obtained solubility data via some empirical models (Kumar & Johnston (KJ), Mendez-Santiago-Teja (MST), Chrastil, Bartle et al., and Garlapati & Madras models).
In the present work, the ability and accuracy of other well-known theoretical models to correlate these experimental data were investigated. For this purpose, two cubic EoSs (PR and SRK), two expanded liquid models (UNIQUAC and modified Wilson's models), and the ANN model were applied. Furthermore, Chloroquine solubility in sc-CO2 was also studied by molecular-level computations to understand the interactions between the solute and solvent. Indeed, the molecular modeling was performed to study the electronic structure of Chloroquine and identify the potential centers of intermolecular interactions during the dissolution and crystal formation processes. Then, the predictability and accuracy of these methods for prediction of Chloroquine solubility in sc-CO2 was evaluated through calculating some statistical parameters such as average absolute relative deviation (AARD%), adjusted correlation coefficient (Radj) and F value. The obtained results can be used to correlate the Chloroquine solubility at different conditions and minimizing the cost and time of the experimental solubility measurement.
2 Experimental
The data used in this work are the solubility of Chloroquine in supercritical solvent (CO2) which was measured using the gravimetric method in a PVT cell. The experimental setup used in this work is schematically indicated in Fig. 2. The system of measurement is made of two separate sections including the compression of solvent and the PVT cell for measuring the solubility values. The detailed description of the measurements are reported elsewhere (Pishnamazi et al., 2021).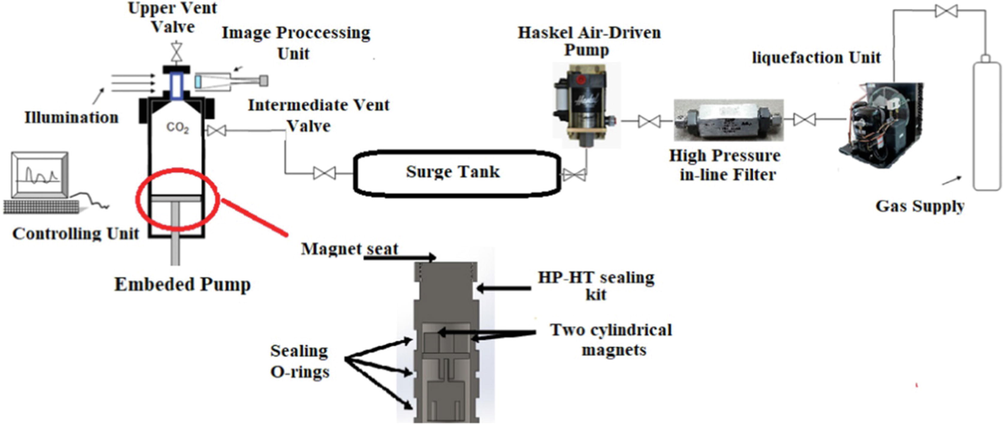
Experimental setup used for measuring Chloroquine solubility in supercritical CO2 (Pishnamazi et al., 2021). Reprinted from (Pishnamazi et al., 2020) with permission from Elsevier.
3 Thermodynamic modeling
In thermodynamic relations used for theoretical solubility prediction, sc-CO2 (solvent) and the solid solute (drug) were considered as components 1 and 2, respectively. The required physical and critical properties of the Chloroquine is not known and should be estimated by the appropriate group contribution modeling approaches. Its sublimation pressure (
), molar volume (
) and acentric factor (ω) are computed via Ambrose-Walton corresponding states method (Bruce et al., 2001), Immirzi method (Immirzi and Perini, 1977), and Constantinou-
Gani method (Constantinou and Gani, 1994), respectively. Other Chloroquine properties such as boiling point (Tb), melting point (Tm), critical temperature (Tc) and critical pressure (Pc) were calculated by Marrero and Gani contribution method (Marrero and Gani, 2001). All of these properties were reported in Table 1. In all of the considered models, R (8.314 J mol−1 K−1), T (K), Tr (T/Tc), and P (MPa) denote as the ideal gas constant, temperature, reduced temperature, and pressure, respectively. Also, solubility of the Chloroquine (solute) in sc-CO2 (solvent) was considered as its equilibrium mole fraction (y2).
Component
MW
(kg kmol−1)Tb
(K)Tm
(K)Tc
(K)
Pc
(bar)ω
vs
(cm3 mol−1)T (K)
308
318
328
338
Psub × 104 (Pa)
Chloroquine
319.87
676
370
917
16.5
0.47
209.3
3.8
11.5
32.4
84.6
3.1 Cubic equation of state (EoS) based models (SRK-EoS & PR-EoS)
The relations of these EoSs were shown in Table 2. These are the most commonly thermodynamic models applied to correlate the solubility of different materials in sc-CO2 (Saadati Ardestani et al., 2020; Coimbra et al., 2006; Chim et al., 2012). In two-phase (solid solute – solvent) equilibrium condition, the fugacity coefficient of the solute in both phases should be equal. Accordingly, the equilibrium solubility (y2) in sc-CO2 was obtained as the following (Saadati Ardestani et al., 2020):
Model
Equation of state
a(T)
b
Peng Robinson
(PR) (Peng and Robinson, 1976)
Soave–Redlich–Kwong (SRK) (Soave, 1972)
Because of the very small sublimation pressure obtained for Chloroquine (Table 1), its saturation fugacity coefficient (
) can be assumed to be one. Furthermore,
is the fugacity coefficient of the solute in sc-CO2, which in this study was computed through SRK-EoS (Soave, 1972), and PR-EoS (Peng and Robinson, 1976), via the following relationship (Saadati Ardestani et al., 2020):
3.2 Expanded liquid models (UNIQUAC and modified Wilson's models)
Equality of the solute fugacity in the solid phase
with its value in the sc-CO2 phase (liquid solvent)
is the thermodynamic criteria used for describing the equilibrium condition between the solute and sc-CO2. According to insolubility of sc-CO2 in the solid solute,
is equal to fugacity of the pure solute
. The term of
is described based on the solute activity coefficient
, as follows (Ali Sajadian et al., 2022):
3.2.1 Modified Wilson’s model
Correlating the solubility of different materials in sc-CO2 through the Wilson’s model has been previously performed by several researchers such as, Nasri (2018), Nasri et al. (2013); Pitchaiah et al. (2019), Pitchaiah et al. (2018); Narayan et al. (2015), and Reddy and Madras (2013), Reddy and Madras (2012). Wilson’s equation includes a combinatorial contribution part based on Flory’s theory, and another part based on the Gibbs excess energy
, as follows (Nasri, 2018):
Through differentiation of Eq. (5) and rearrangement of the obtained function, the term of
can be determined by the following relation (Nasri, 2018):
At the infinite dilution condition, this relation can be summarized to the form of Eq. (9) (Assael et al., 1996), in which
and
are written in reduced form, as follows (Nasri, 2018):
Finally, , , and are the parameters of the Wilson’s model specified through regression. The term of is the reduced density of the solvent (sc-CO2), in which is the critical sc-CO2 density (kg.m−3).
3.2.2 UNIQUAC model
Predicting the solubility of various components in sc-CO2 via the UNIQUAC model has been previously reported by Nasri et al. (2012), Nasri et al. (2013), Loubna et al. (2014), Zhao et al. (2020), Chang and Morrell (1985), and Sodeifian et al. (2020), Sodeifian et al. (2020). Considering the size and nature of the molecules, as well as the intermolecular forces between the solute and solvent molecules are the strengths of this model. Furthermore, it can be exploited to solutions containing small or large molecules, such as polymers (Nasri et al., 2013). In the UNIQUAC model,
includes a combinatorial contribution part to describe the main entropic contribution
, and a residual part
to indicate intermolecular forces which are cause of the mixing enthalpy (Prausnitz et al., 1998):
The term of
is a function of composition and structure of the molecules, and its determination requires only the pure component data, while the parameter of
depends to the intermolecular forces (Prausnitz et al., 1998):
To account for the influence of T and P, the parameters are expressed as (Prausnitz et al., 1998):
4 Multilayer perception neural network (MLPNN)
This model was developed based on the way of information processing in the human brain. Learning happens in an interconnected network of the brain biological neurons, which can suggest an alternative way to solve the complicated problems. The ANN model is based on repetitive, known and predictable patterns of the input data to be able to provide logical and correct answers in the output. Neural network with repetition and storage of experimental data and their complete knowledge and finally good and complete training by the experimental data can turn network inputs into correct responses with low error. For modeling using ANN, a dataset of measured data is needed to build the model (Amani, 2021).
In an ANN, a neuron executes two functions: tan-sigmoid transfer function (Tansig) and linear transfer function (purelin). In the ANN algorithm, weighted inputs and bias values are added together and uses Tansig function to quickly train the network. Then, a suitable and specific scalar output is obtained by purelin function at the output layer. The ANN is composed of neurons arranged in three layers, one input layer which receives the experimental information and parameters, one output layer, which produces the calculated values of the dependent variable, and at least one hidden layer between the previous two layers. All of these layers posse a group of computing neurons, in which the number of neurons in the input and output layers are specified by the system’s characteristics, while their number in the hidden layer is an adjustable parameter, which should be optimized (Bakhbakhi, 2012). Accordingly, the main parts of the ANN modelling include (i) determination the input values, (ii) selection the appropriate algorithm for accurate model training, (iii) specification the number of neurons in the hidden layer, and (iv) evaluating and validating the ANN model.
The connection template of each neuron to other neuron in the next layer is known as the network “architecture”. Among the various suggested architectures, multilayer perception neural network (MLPNN) structure with the back-propagation (BP) algorithm, as the training method, is the most popular ones.
The inputs to the neuron i in hidden or output layer
include the sum of its weighted input multiply of its weight
in its input parameter
and its bias
, which can be shown mathematically with the following relation (Ghoreishi and Heidari, 2013):
Adjustments of weights and biases are based on reducing the difference between the values of obtained data and the experimental ones. The BP algorithm consists of three steps: (i) assessment of the weights and biases and calculation of the output values, (ii) computation and back propagation of the relevant error, and (iii) variation the weights. Among the proposed BP algorithms, Levenberg-Marquardt algorithm (LMP) accompanied with the gradient descent technique was used in this work to minimize the sum square error (SSE) and mean square error (MSE). This algorithm quickly learns and uses Tansig and purelin functions at the hidden and output layers, respectively.
5 Assessment the precision of the thermodynamic and ANN models
The performance and precision of the mentioned methods was statistically evaluated via computing the difference between the experimental data
and the calculated one
, known as AARD% (Saadati Ardestani et al., 2020):
The Radj value is calculated by the following relationship (Saadati Ardestani et al., 2020):
6 Molecular modeling
6.1 Study of the electronic structure of Chloroquine, its crystal fragment and its complexes with CO2
Dissolution process as well as the formation of a crystal lattice, including the formation of nanoparticles, largely depends on the electronic structure of the Chloroquine. To study the electronic structure of Chloroquine and identification the potential centers of intermolecular interactions during the dissolution and crystal formation processes, AlteQ orbital-free quantum chemical method was used in this work. This method has already shown a qualitative description of the 3D electron density maps of organic and inorganic compounds, determined using high resolution low temperature X-ray diffraction analysis (Potemkin and Grishina, 2008; Grishina and Potemkin, 2019; Potemkin and Grishina, 2018). AlteQ was developed for large molecular systems, it allows the evaluation of 3D electron density maps, and this method solves a wide range of problems.
6.2 The approach for the prediction of the zones of intermolecular contacts (contact zones) using AlteQ
One of the problems is the prediction of the directions of intermolecular contacts according to the electronic structure of a molecule (molecular system). The electronic structure of Chloroquine molecule, Chloroquine crystal fragment and Chloroquine-CO2 complexes was investigated using the approach which was previously proposed by Vladimir Potemkin et al. (Potemkin and Grishina, 2021). It is based on the Valence shell electron pair repulsion (VSEPR) theory (Gillespie, 1963; Gillespie and Nyholm, 1957), which assumes that electron pairs are arranged in such a way as to minimize repulsive effects of each other. Therefore, in the terms of AlteQ 3D maps of electron density, it means the determination of space points near an atom, characterized by the minimum contribution of the electron density of covalently bound ligands of the atom in the molecule (molecular system). The set of these points forms the contact zone for potential intermolecular interactions. These contact zones determine the directions of intermolecular interactions with the environment of the molecule (receptor, solvent or other Chloroquine molecules during crystal formation), affecting the structure of the crystal or non-covalently bound complexes with the receptor or solvent.
6.3 The approach for the evaluation of the overlap zones of the molecule (ligand) with the environment using AlteQ
Another task of the AlteQ method is to determine the overlap zones of a molecule (ligand) with the environment, for example, a receptor, a solvent, or with the rest of the crystal fragment. This approach is based on the analysis of AlteQ 3D maps of electron density of receptor-ligand, solvent–solute complexes or a molecule surrounded by neighbors in the crystal fragment. The approach determines the set of m points of intermolecular space with electron density value of the molecule (ligand) and electron density value of the neighbors (receptor, solvent or the rest of the crystal fragment) at the m points (Rimac et al., 2020; Palko et al., 2021). Thus, these zones are simultaneously characterized by a significant value of the electron density of both the molecule and its environment; therefore, these zones are overlap zones of the molecule with the neighbors.
6.4 Modeling of the Chloroquine crystal fragment
For determination the structure of the Chloroquine crystal fragment, experimental data on the structure of the unit cell were found in the Cambridge Crystallographic Data Centre (CCDC) (Groom et al., 2016), with the database code of CCDC 1121749. Then, the fragment of the Chloroquine crystal was built by the Mercury software by packing elementary cells along a, b, and c axes in the amount of 2*2*2. An analysis of overlap zones was made for a molecule surrounded on all sides by neighboring molecules. The position of hydrogens was clarified using QM/MM technique based on orbital-free quantum chemical method AlteQ and MM3 force field.
6.5 Modeling of Chloroquine-CO2 complexes using MOPS algorithm
The simulation of the complexes was carried out using the MOPS algorithm also based on the QM/MM technique (Shchelokov et al., Langmuir 2019). This algorithm is based on the assumption that all changes in the structure occur along the directions of atomic vibrations. Therefore, in the general case, the structure of the complex depends little on the initial arrangement of molecules in the complex relative to each other. Modeling was carried out with an explicit and a continual account of the solvent (CO2), while the mole fraction of Chloroquine and the temperature of the process varied according to the values given in Table 3. At the same time, the phased construction of Chloroquine-xCO2 complexes with values x = 1–6 was carried out.
P (bar)a
T (K)a
308 K
318 K
328 K
338 K
ρ (kg/m3)b
y2c
ρ (kg/m3)b
y2c
ρ (kg/m3)b
y2c
ρ (kg/m3)b
y2c
120
768.4
8.26 × 10⁻⁵
659.73
4.26 × 10⁻⁵
506.85
4.04 × 10⁻⁵
384.17
1.64 × 10⁻⁵
160
828.10
1.33 × 10⁻⁴
761.07
1.13 × 10⁻⁴
682.39
7.35 × 10⁻⁵
593.75
5.96 × 10⁻⁵
200
866.48
1.53 × 10⁻⁴
813.52
1.76 × 10⁻⁴
755.52
1.95 × 10⁻⁴
692.68
2.22 × 10⁻⁴
240
895.54
2.11 × 10⁻⁴
850.10
2.26 × 10⁻⁴
801.92
2.33 × 10⁻⁴
751.17
2.59 × 10⁻⁴
280
919.23
2.50 × 10⁻⁴
878.62
3.05 × 10⁻⁴
836.35
3.45 × 10⁻⁴
792.59
3.87 × 10⁻⁴
320
939.39
2.95 × 10⁻⁴
902.22
3.78 × 10⁻⁴
863.97
4.40 × 10⁻⁴
824.82
5.02 × 10⁻⁴
360
957.02
3.28 × 10⁻⁴
922.46
4.12 × 10⁻⁴
887.18
5.21 × 10⁻⁴
851.34
6.04 × 10⁻⁴
400
972.74
3.74 × 10⁻⁴
940.24
4.55 × 10⁻⁴
907.27
6.76 × 10⁻⁴
873.95
8.92 × 10⁻⁴
7 Results and discussion
In the current work, the solubility of Chloroquine in sc-CO2 was anticipated by different theoretical models (PR-EoS, SRK-EoS, Wilson’s model, UNIQUAC model, and the ANN), as well as the molecular modeling. The precision and accuracy of the theoretical models to correlate the solubility of Chloroquine were evaluated by comparison between the obtained data and the experimental ones, reported by Pishnamazi et al. (Pishnamazi et al., 2021). The reported experimental solubility data at various pressures (120 to 400 bar) and temperatures (308 to 338 K), along with the calculated sc-CO2 density was shown in Table 3.
7.1 Artificial neural network (ANN) model
To validate, test and train the ANN, the experimental solubility data of 41 pharmaceutical compounds (Pishnamazi et al., 2021; Ali Sajadian et al., 2022; Pishnamazi et al., 2020; Chim et al., 2012; Suleiman et al., 2005; Ch and Madras, 2010; Hezave et al., 2012; Zhan et al., 2014; Yamini et al., 2012; Yang et al., 2017; Pishnamazi et al., 2021; Zabihi et al., 2020; Esfandiari and Sajadian, 2022; Ciou et al., 2017; Wang et al., 2021; Zabihi et al., 2021; Xiang et al., 2019; Pishnamazi et al., 2020; Zabihi et al., 2021; Shojaee et al., 2013; Yamini and Moradi, 2011; Ardjmand et al., 2014; Asiabi et al., 2013; Khamda et al., 2013; Zeinolabedini Hezave et al., 2012; Karimi Sabet et al., 2012; Hosseini et al., 2010; Zeinolabedini Hezave and Esmaeilzadeh, 2012; Hojjati et al., 2007) were collected, shown in Table 4. 70 %, 15 %, and 15 % of these data were used for the ANN training, validation and testing of the ANN, respectively.
Component
Formula
Mw (g/mol)
T range (K)
P range (bar)
Data points
Tm (K)
Solubility range
Ref.
2-phenyl-4H-1,3-benzoxazin-4-one
C14H9NO2
223.233
308–328
100–275
23
397
0.8 × 10⁻⁴-4.5 × 10⁻⁴
(Suleiman et al., 2005)
Azodicarbonamide
C2H4N4O2
116.08
308–328
100–300
26
497
0.9 × 10⁻⁵-2.6 × 10⁻⁵
(Suleiman et al., 2005)
Propyphenazone
C14H18N2O
230.31
308–328
90–190
18
376
0.38 × 10⁻⁴-18.82 × 10⁻⁴
(Ch and Madras, 2010)
Sulindac
C20H17FO3S
356.41
308–338
160–400
28
456
1.05 × 10⁻⁴-8.69 × 10⁻³
(Van der Waals, 1873)
Thymidine
C10H14N2O5
242.23
308–328
100–275
20
460
1.2 × 10⁻⁶-8 × 10⁻⁶
(Suleiman et al., 2005)
5-Fluorouracil
C4H3FN2O2
130.077
313–323
100–200
12
555–556
1.3 × 10⁻⁶-5.25 × 10⁻⁶
(Zhan et al., 2014)
Docetaxel
C43H53NO14
285.303
318–348
120–360
45
462
0.37 × 10⁻⁴-7.02 × 10⁻⁴
(Yamini et al., 2012)
Capecitabine
C15H22FN3O6
359.35
308–348
152–354
40
362
0.32 × 10⁻⁵-15.88 × 10⁻⁵
(Yamini et al., 2012)
Lenalidomide
C13H13N3O3
259.25
308–338
120–300
28
560.65
0.02 × 10⁻⁴-1.08 × 10⁻⁴
(Ali Sajadian et al., 2022)
Silymarin
C25H22O10
482.4
308–338
80–220
32
440
0.27 × 10⁻⁵-8.01 × 10⁻⁵
(Yang et al., 2017)
Chloroquine
C18H26ClN3
319.87
308–338
120–400
28
370
1.64 × 10⁻⁵-8.92 × 10⁻⁴
(Pishnamazi et al., 2021)
Decitabine
C8H12N4O4
228.21
308–338
120–400
28
466–469
2.84 × 10⁻⁵ − 1.07 × 10⁻³
(Pishnamazi et al., 2021)
Fenoprofen
C15H14O3
242.27
308–338
120–400
28
441–444
2.01 × 10⁻⁵- 4.2 × 10⁻³
(Zabihi et al., 2020)
Glibenclamide
C23H28ClN3O5S
494
308–338
100–310
24
446
3 × 10⁻⁶- 79.2 × 10⁻⁶
(Esfandiari and Sajadian, 2022)
Warfarin
C19H16O4
308.3
308–328
100–180
15
434
1.48 × 10⁻⁶- 4.32 × 10⁻⁶
(Ciou et al., 2017)
Gliclazide
C15H21N3O3S
323.41
308–328
100–185
18
445.9
0.126 × 10⁻⁶- 5.01 × 10⁻⁶
(Wang et al., 2021)
Captopril
C9H15NO3S
217.28
308–328
100–185
18
382.5
0.359 × 10⁻⁵- 9.32 × 10⁻⁵
(Wang et al., 2021)
Salsalate
C14H10O5
258.23
308–338
120–400
28
420
3.77 × 10⁻⁵- 3.88 × 10⁻³
(Zabihi et al., 2021)
Busulfan
C6H14O6S2
246.304
308–338
120–400
28
387–390
3.27 × 10⁻⁵- 8.65 × 10⁻⁴
(Pishnamazi et al., 2020)
Gambogic Acid
C38H44O8
628.7
308–328
100–300
15
361.5
0.163 × 10⁻⁵- 2.262 × 10⁻⁵
(Xiang et al., 2019)
Tamoxifen
C26H29NO
371.51
308–338
120–400
28
370–371
1.88 × 10⁻⁵- 8.29 × 10⁻⁴
(Pishnamazi et al., 2020)
Temozolomide
C6H6N6O2
194.1
308–338
120–400
28
485
4.3 × 10⁻⁴- 5.28 × 10⁻³
(Zabihi et al., 2021)
Piroxicam
C15H13N3O4S
331.35
308–338
160–400
28
473
1.17 × 10⁻⁵- 5.12 × 10⁻⁴
(Shojaee et al., 2013)
Ketoconazole
C26H28Cl2N4O4
531
308–348
122–355
45
423
0.05 × 10⁻⁵- 17.45 × 10⁻⁵
(Yamini and Moradi, 2011)
Clotrimazole
C22H17ClN2
344
308–348
122–355
45
418
0.02 × 10⁻⁵- 10.66 × 10⁻⁵
(Yamini and Moradi, 2011)
Ibuprofen
C13H18O2
206.28
308–318
80–130
31
349
0.015 × 10⁻³ to 3.261 × 10⁻³
(Ardjmand et al., 2014)
Desoxycorticosterone acetate
C23H32O4
372.497
308–348
122–355
45
430
0.09 × 10⁻⁵ to 13.93 × 10⁻⁵
(Asiabi et al., 2013)
Clobetasole propionate
C25H32ClFO5
466.97
308–348
122–355
45
466.97
0.01 × 10⁻⁵ to 0.35 × 10⁻⁵
(Asiabi et al., 2013)
Cefixime trihydrate
C16H15N5O7S2·3H2O
507.5
308–328
183–355
18
491–498
1.6 × 10⁻⁷–3.02 × 10⁻⁷
(Khamda et al., 2013)
Oxymetholone
C21H32O3
332.5
308–328
183–355
18
445–453
1.6 × 10⁻⁵–1.49 × 10⁻⁴
(Khamda et al., 2013)
Mefenamic acid
C15H15NO2
241.29
308–338
160–400
28
503–504
8.31 × 10⁻⁵–5.98 × 10⁻³
(Zeinolabedini Hezave et al., 2012)
Acetaminophen
C8H9NO2
151.16
313–343
100–250
12
443
0.66 × 10⁻⁶–9.66 × 10⁻⁶
(Karimi Sabet et al., 2012)
Clozapine
C18H19ClN4
326.83
318–348
121.6–354
36
456
3.6 × 10⁻⁶ − 4.2 × 10⁻⁵
(Hosseini et al., 2010)
Lamotrigine
C9H7Cl2N5
256.938
318–348
121.6–354
36
491
1 × 10⁻⁶ − 6 × 10⁻⁵
(Hosseini et al., 2010)
Diclofenac Acid
C14H11Cl2NO2
296.14
308–338
120–400
32
471–473
2.34 × 10⁻⁵–1.98 × 10⁻³
(Zeinolabedini Hezave and Esmaeilzadeh, 2012)
Dexamethasone
C22H29FO5
392.5
308–328
151–357
15
533–537
1.25 × 10⁻⁶–2.81 × 10⁻⁶
(Chim et al., 2012)
Rosuvastatin
C22H28FN3O6S
481.5
308–348
121.6–354.6
45
435
0.03 × 10⁻⁴–2.44 × 10⁻⁴
(Hojjati et al., 2007)
Simvastatin
C25H38O5
418.5
308–348
121.6–354.6
45
408–411
0.02 × 10⁻⁴–5.35 × 10⁻⁴
(Hojjati et al., 2007)
Atorvastatin
C33H33FN2O4
540.6
308–348
121.6–354.6
45
432.2–463.7
0.01 × 10⁻⁴–14.46 × 10⁻⁴
(Hojjati et al., 2007)
Fluvastatin
C24H26FNO4
411.4
308–348
121.6–354.6
45
467–470
0.05 × 10⁻⁴–6.01 × 10⁻⁴
(Hojjati et al., 2007)
Lovastatin
C24H36O5
404.5
308–348
121.6–354.6
45
447.5
0.11 × 10⁻⁴–1.14 × 10⁻⁴
(Hojjati et al., 2007)
The schematic of the used MLPNN structure to predict the Chloroquine solubility in sc-CO2 is shown in Fig. 3. In the current work, the input matrix (1200 × 3) was arranged with 7 parameters of pressure, temperature, molecular weight, melting point and density, and the output matrix (1200 × 1) was arranged with one variable includes the Chloroquine solubility in terms of its mole fraction.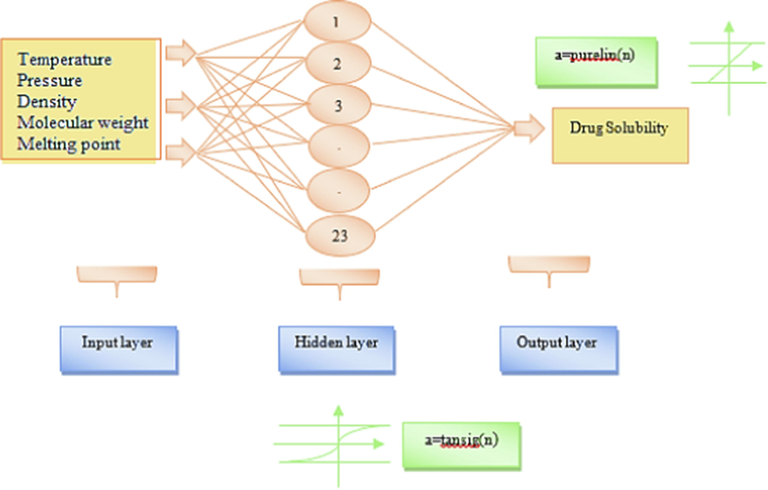
The schematics of the used MLPNN structure for prediction of Chloroquine solubility in sc-CO2.
To find the optimum number of neurons for training the network, different number of neurons were tested (23 neurons). Then, various transfer functions were tried for training the network with the optimum number of neurons in the hidden layer (Amani, 2021). The outputs illustrated that the (LMP) algorithm would propose the best results to train the ANN with 23 neurons in the hidden layer. According to Fig. 4, the best validation performance was obtained at epoch 147, which was corresponds to a MSE value of 1.2855e-05.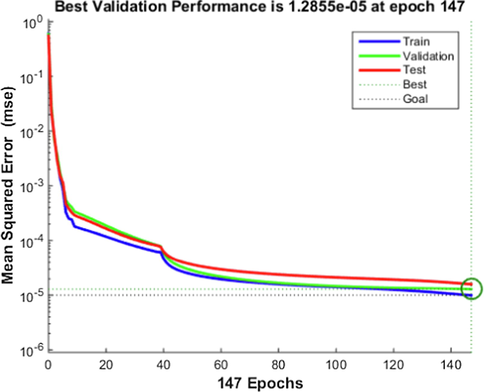
Variations of the MSE with epoch during the different steps of the ANN.
Due to the dependence of the ANN performance on the initial weights that are randomly selected in the training step, the best network is characterized with the number of the iterations on this step. The final/adjusted weights matrix and the associated biases from the optimum condition are determined and the neural network (ANN) is run. So, by using a large amount of experimental data in the network, the network is well trained and has provided acceptable and appropriate results.
Fig. 5 shows the scatter diagrams compare the experimental data (target) with the ANN computed results in each step including training, validation and testing. As can be seen, the predicted solubility values are well consistent with the experimental data for all steps. The correlation coefficients (R2) were found to be 0.99955, 0.99951, 0.99911 and 0.99955 for training, validation, testing and all data, respectively, which are totally satisfactory and acceptable. The optimal operational conditions in terms of pressure, temperature and density to obtain the maximum Chloroquine solubility in sc-CO2 were determined with the ANN model coupled with the genetic algorithm (GA). According to the obtained results, maximum solubility of Chloroquine in terms of its equilibrium mole fraction (y = 8.00 × 10⁻⁴) was obtained at 338 K and 400 bar, which is in agreement with the experimental reported one (y = 8.92 × 10⁻⁴) (Pishnamazi et al., 2021).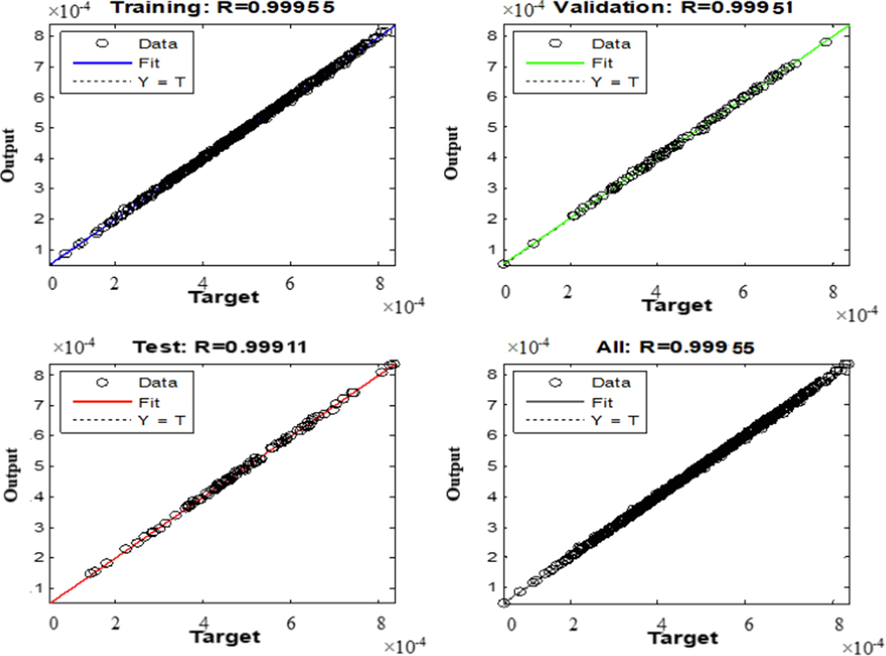
Comparison between the experimental values and the output data of the ANN model during the different steps of the ANN.
7.2 Thermodynamic modeling
7.2.1 Cubic equation of states (SRK-EoS and PR-EoS)
These two cubic equation of states were frequently applied to correlate the solubility of different drugs in sc-CO2. Also, the van der Waals (vdW) mixing rule with two binary interaction parameters (lij and kij) is the most well-known mixing rule proposed for definition the terms of a(T) and b of these EoSs (Table 2), as follows (Kennedy, 2011):
The simulated annealing (SA) algorithm (Sodeifian et al., 2020) was used to determine the optimum values of the lij and kij parameters, through minimizing the AARD% value. These parameters are linear descending functions of temperature whose slope and intercept are determined by the linear regression analysis. Obtained lij and kij functions for the PR-EoS and SRK-EoS are in the form of Eq. (21) and Eq. (22), respectively. Also, these linear functions with the negative slope were indicated in Fig. 6:
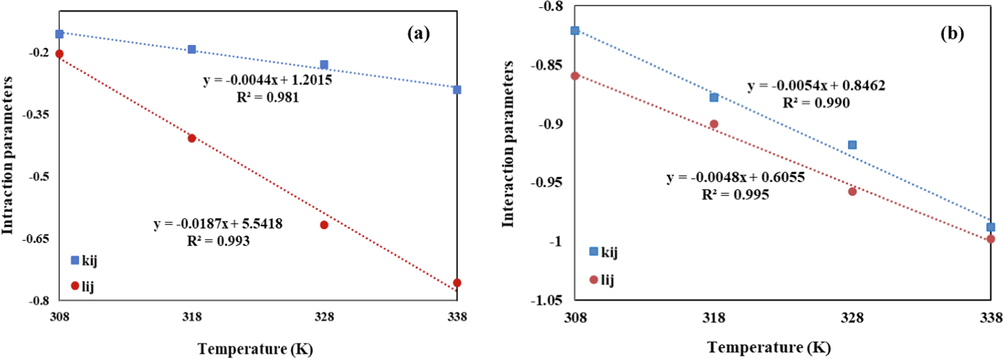
Linear function of lij and kij versus the temperature (a) PR-EoS, and (b) SRK-EoS.
The optimized lij and kij parameters of the Chloroquine /sc-CO2 system, along with the statistical parameters (AARD%, Radj and F-value) of the SRK-EoS and PR-EoS were reported in Table 5.
Model
Parameter
T = 308 K
T = 318 K
T = 328 K
T = 338 K
PR- vdW2
−0.150
−0.194
−0.238
−0.282
−0.218
−0.405
−0.592
−0.779
AARD %
6.628
4.404
13.771
15.187
F value
4745.7
7808.9
1963
416.2298
Radj
0.998
0.999
0.996
0.981
SRK- vdW2
−0.817
−0.871
−0.925
−0.979
−0.873
−0.921
−0.969
−1.017
AARD %
7.28
5.20
14.12
16.21
F value
16.9
107.0
50.3
13.7
Radj
0.92
0.99
0.97
0.90
Furthermore, the correlated and experimental solubility values at different temperatures (308, 318, 328 and 338 K) were shown in Fig. 7. As can be seen, both of the models can provide acceptable results at all the considered temperatures. However, according to the average of the obtained AARD% values (9.99 for PR-EoS and 10.7 for SRK-EoS) and Radj values (0.993 for PR-EoS and 0.945 for SRK-EoS), it can be concluded that PR-EoS can more accurately correlate the solubility of Chloroquine in sc-CO2. For better comparison, the parity plots of the experimental solubility data versus the correlated ones at 308 K and 338 K were also demonstrated in Fig. 7. Higher precision of the PR-EoS model for correlation of the Chloroquine solubility is quite evident. Moreover, according to the obtained determination coefficients (R2) of these plots, it is completely obvious that the accuracy of the correlation via both of the models reduces with increasing the temperature.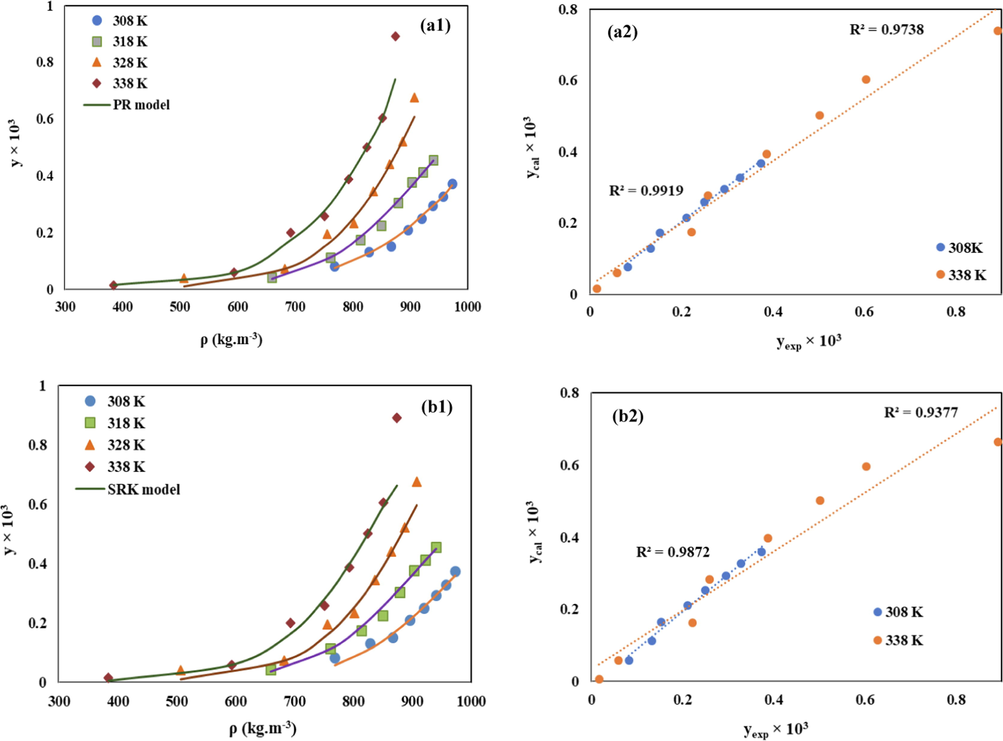
Comparison of experimental (points) and calculated (line) solubility of Chloroquine in sc-CO2,(left column) along with the related parity plot (right column), based on (a) PR-EoS, and (b) SRK-EoS models.
7.2.2 Expanded liquid theory (Modified Wilson’s and UNIQUAC models)
For correlation of the Chloroquine solubility in sc-CO2 based on the expanded liquid theory, its activity coefficient was determined via the modified Wilson’s and UNIQUAC models. The capability of the modified Wilson’s and UNIQUAC models to correlate the Chloroquine solubility was illustrated in Fig. 8 and Fig. 9, respectively.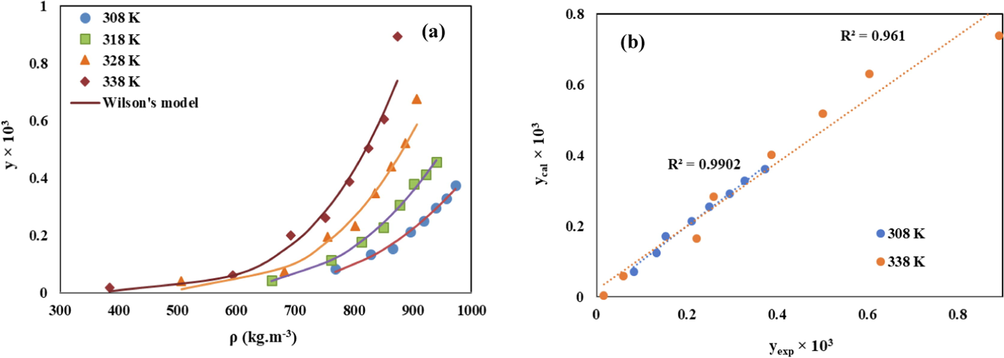
(a) Comparison of experimental (points) and calculated (line) solubility of Chloroquine in sc-CO2 based on the modified Wilson’s model, (b) The related parity plot.
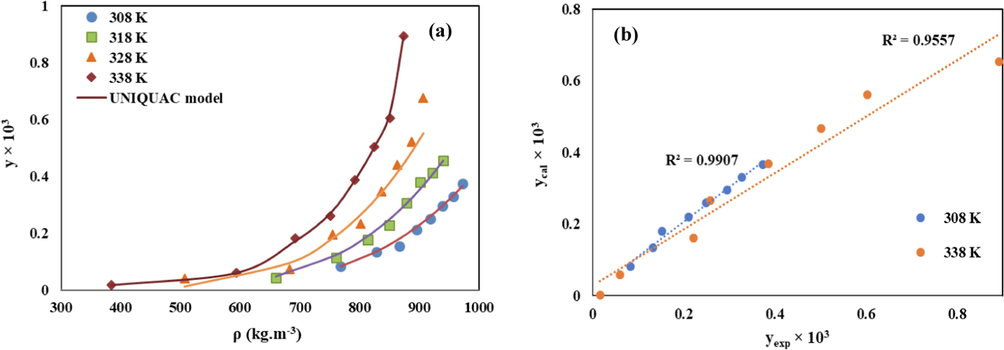
(a) Comparison of experimental (points) and calculated (line) solubility of Chloroquine in sc-CO2 based on the UNIQUAC model, (b) The related parity plot.
Also, optimized regressed parameters of the modified Wilson’s model (α, β, λ'12 and λ'21) and UNIQUAC model (α12, α21, β12 and β21,), along with the obtained statistical parameters (AARD%, Radj, and F-value) of each model for the Chloroquine /sc-CO2 binary system were reported in Table 6 and Table 7, respectively. The volume (r), and surface area (q) parameters of the UNIQUAC model were obtained as 13.089 and 10.117 for Chloroquine, and 1.296 and 1.261 for CO2, respectively. Additionally, the interaction parameters of the Wilson’s model (
and
were calculated for each data point of Chloroquine /sc-CO2 system. The values
and
parameters were calculated that, significant difference between these two parameters and higher value of
parameter in comparison with
, have been previously reported for complex solute molecules [13, 14, 82].
Model
α
β
λ'12
λ'21
AARD %
F value
Radj
Modified Wilson
−5.09 × 10⁻⁵
2.85 × 10⁻⁴
−1.38
18.49
10.33
254
0.97
Model
α12
α21
β 12
β 21
AARD %
F value
Radj
UNIQUAC
41.88
13.93
−0.45
−9.20
12.30
91.02
0.96
Low AARD% values (10.33 for Wilson and 12.3 for UNIQUAC models) and high Radj values (0.97 for Wilson and 0.96 for UNIQUAC models), confirm the satisfactory precision of these models to correlate the Chloroquine solubility data. Good consistency between the calculated solubility values by the modified Wilson’s and the UNIQUAC models and the reported experimental ones was also shown in the related parity plots shown in Fig. 8 and Fig. 9, respectively.
7.3 Comparison between the mentioned theoretical models and the empirical models used by Ponticelli and Moroni (2017)
As described in pervious sections, Pishnamazi et al. (2021) determined the supercritical solubility of Chloroquine and correlated the obtained experimental data via some empirical models (Kumar & Johnston (KJ), Mendez-Santiago-Teja (MST), Chrastil, Bartle et al., and Garlapati &Madras models). In the continuation of this research, some thermodynamic models (PR-EOS, SRK-EoS, UNIQUAC, modified Wilson's models), and the ANN model were used in this work to correlate the supercritical solubility data of Chloroquine, reported by Ponticelli and Moroni (2017). Table 8 shows the comparison of these models in terms of their AARD% values.
Model
AARD%
Empirical models
(reported by Pishnamazi et al. (Pishnamazi et al., 2021)Kumar & Johnston (K-J)
12.3
Mendez-Santiago-Teja (MST)
12.0
Chrastil
13.3
Bartle et al
13.0
Garlapati &Madras
13.6
Cubic EoS- based models
PR-EoS
9.98
SRK-EoS
10.70
Expanded liquid models
UNIQUAC
12.30
Modified Wilson's
10.33
Intelligent model
Artificial neural network (ANN)
1.76
As can be seen, the precision of the ANN model to correlate the Chloroquine supercritical solubility data is significantly more than the other ones. Also, despite the simplicity of the empirical models, their accuracy to fit the experimental Chloroquine solubility data is lower than the thermodynamic and intelligent models used in this work.
7.4 Molecular modeling
7.4.1 Estimated contact zones of Chloroquine
An analysis of the contact zones of Chloroquine showed that the most effective among them are the zones located near the N atom of pyridine and the hydrogen atom of the NH fragment. Therefore, it can be assumed that these atoms participate in the formation of a hydrogen bond during the formation of intermolecular contacts. The next in terms of the efficiency of contact formation, despite the low polarity, are the hydrogen atoms of the quinoline ring and the hydrogen atoms of the alkyl CH, CH2, and CH3 fragments. We may suggest the formation of lipophilic contacts of the groups with nonpolar atoms.
Indeed, consideration of the crystal fragment showed that the formation of a crystal is carried out with the participation of these fragments of the molecule. Fig. 10 shows the contact zones determined using the principles of VSEPR theory and 3D maps of Chloroquine electron density, estimated by the AlteQ orbital-free quantum chemical method.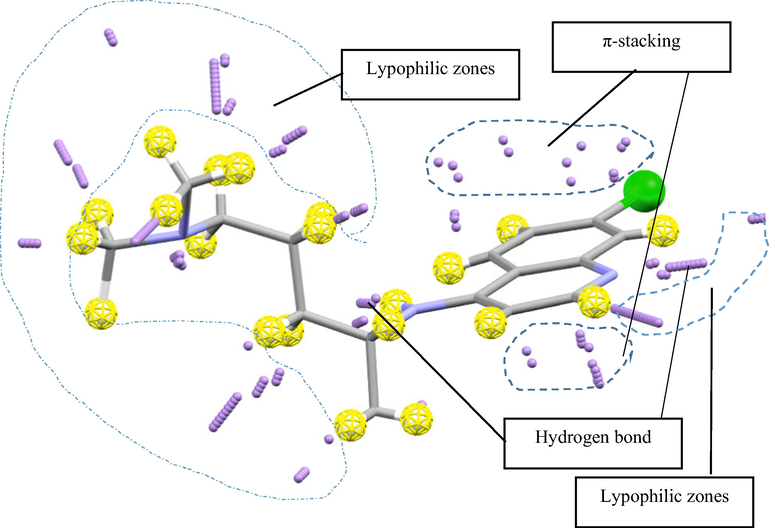
Contact zones determined using principles of VSEPR theory and 3D maps of Chloroquine electron density estimated using AlteQ orbital-free quantum chemical method.
7.4.2 Overlap zones and topological analysis of electron density of Chloroquine crystal fragment
Fig. 11a demonstrates the overlap zones of a molecule with the neighbors in a crystal fragment. Fig. 11b demonstrates the same zones in the molecule taken from the crystal fragment.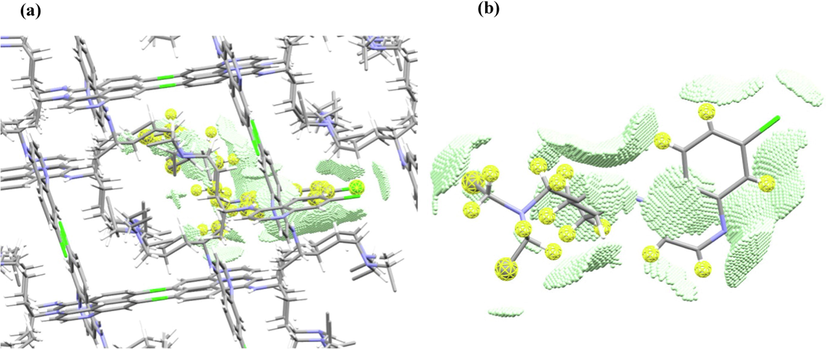
Overlap zones of Chloroquine (a) a single molecule in the crystal fragment, and (b) a single molecule extracted from the crystal.
Indeed, the N of the pyridine forms a hydrogen bond with H of NH group, and the lipophilic nonpolar CH, CH2, CH3 fragments, as well as quinoline hydrogens, form intermolecular van der Waals interactions with each other (Fig. 11).
The topological analysis of the electron density of the crystal fragment showed that for the Chloroquine molecule, the formation of a significant number of weak lipophilic H…H and C…H contacts with neighboring molecules with an electron density of (e/Bohr3) and a.u. respectively in (3,-1) bond critical points is observed. These intermolecular interactions are localized near the alkyl fragments, namely, near the CH, CH2, CH3 groups (Fig. 11b). In addition, one of the CH3 groups is located near the pyridine ring of the quinoline fragment (Fig. 11b) with the electron density of . Weak π-stacking interactions are absent. Chlorine is in contact with the carbon atom of the pyridine ring, the value of the electron density at the critical point (3,-1) is low There are 4 N…H contacts, but they do not have a hydrogen-bonded character, because hydrogens belong to CH3 groups, and moderate electron density values of are also observed in such N…H (3,-1) bond critical points. Only 2 N…H contacts, namely N(pyridine)…H—N(amine) and N—H(amine)…N(pyridine) contacts are typical hydrogen bonds with .
Thus, the compound dissolved in carbon dioxide crystallizes with the formation of intermolecular contacts due to the most pronounced contact zones which determine crystal structure. First of all, the N(pyridine)…H(NH fragment) hydrogen bond is formed; in addition, less effective lipophilic interactions of alkyl fragments are generated. Obviously, upon dissolution, the destruction of the crystal will be due to more vulnerable lipophilic interactions, and then by the destruction of the hydrogen N(pyridine)…H(NH fragment) bond.
7.4.3 Overlap zones and topological analysis of electron density of Chloroquine-CO2 complexes
Overlap zones of Chloroquine-CO2 complexes also in a good agreement with the predicted contact zones of the Chloroquine. It was found that, regardless of the mole fraction, the location of one CO2 molecule is necessarily carried out near the H(NH) fragment, due to the formation of a O…H(NH) hydrogen bond (Fig. 12 a,b). The electron density value at the critical point doesn’t exceed
0.0690 a.u (the distance is 2.421 Å). In addition, the CO2 carbon atom forms intermolecular interactions with the hydrogen atom of the benzene ring and the hydrogen atom of the CH2 group (Fig. 12 a,b). The values of electron densities are not high, for example, in the complex with 1:1 composition and 1.64·10-5 mol fraction, the values
0.0285 a.u. and 0.0321 a.u. (the distances are 2.973 Å and 2.985 Å). The increase of the pressure and the number of CO2 molecules increases the number of lypophilic contacts of C(CO2) with hydrogens of CH,CH2,CH3 groups (Fig. 12b). Then, the increase of number of explicit CO2 molecules shows that the formation of π-stacking interactions of the CO2 π -system and the quinoline ring with low electron density values of
0.0166–0.0234 a.u. is possible (Fig. 12b).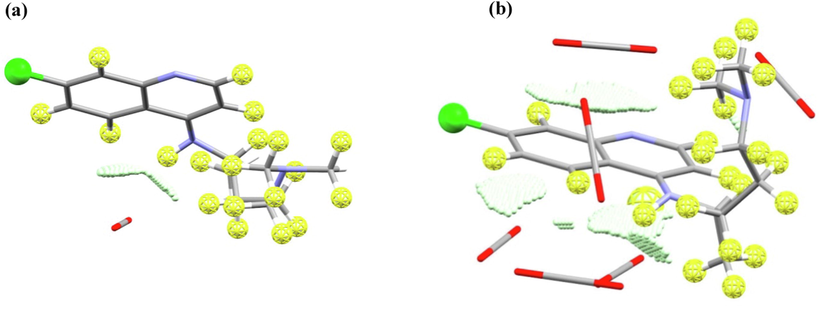
Overlap zones of Chloroquine with CO2 in their complexes obtained using MOPS algorithm, compositions are, (a) 1:1 (mole fraction is 1.64 10-5), and (b) 1:6 (mole fraction is 8.92 10-4).
Thus, the values at critical points show a less efficient interaction of CO2 with Chloroquine, compared with interactions in the crystal, so the crystallization of Chloroquine from solution is simplified and in this case, the formation of a Chloroquine-CO2 cocrystal is unlikely, which leads to the production of pure Chloroquine upon crystallization from a solution in CO2.
8 Conclusion
It has been approved that pharmaceutical particles in micro/nano scale possess higher bioavailability and fewer side effects. Supercritical fluid (especially supercritical carbon dioxide (sc-CO2) based processes are the novel and update approaches for this purpose. For design an efficient sc-CO2 based process, the solubility of pharmaceutical substance should be measured at a wide range of temperatures and pressures. However, experimental solubility determination is costly, time consuming and complex process. Therefore, various theoretical methods have been developed for prediction the solubility of different components in sc-CO2.
Chloroquine is a traditional antimalarial and antivirus medicine which is also prescribed for treatment the COVID-19 patients. Pishnamazi research team measured the Chloroquine solubility in sc-CO2 in the range of 1.64 × 10⁻⁵ to 8.92 × 10⁻⁴ (in terms of mole fraction) at different pressures (120–400 bar) and temperatures (308–338 K). Also, they correlated the obtained solubility data via some commonly used empirical models (Kumar & Johnston (KJ), Mendez-Santiago-Teja (MST), Chrastil, Bartle et al., and Garlapati &Madras models).
In the present study, two equation of states based models (Peng-Robinson (PR-EoS) and Soave-Redlich-Kowang (SRK-EoS)), two activity coefficient based models (modified Wilson's and UNIQUAC), and artificial neural network (ANN) model were applied for prediction the solubility of Chloroquine in sc-CO2. Then, the predictability and accuracy of these methods was evaluated through calculating some statistical parameters such as average absolute relative deviation (AARD%), adjusted correlation coefficient (Radj) and F-value. According to the obtained results, all of these models show acceptable accuracy for predicting the Chloroquine solubility in sc-CO2. Among them, the ANN model is the most accurate with the lowest AARD% value of 1.76 % and the highest Radj value of 0.999. The predicted solubility values by the ANN model are in the highest consistency with the experimental ones. Moreover, molecular modeling was performed to study the electronic structure of Chloroquine and identify the potential centers of intermolecular interactions during the dissolution process.
Acknowledgements
This work was supported by Ministry of Science and Higher Education of Russia (grant FENU-2020-0019).
Declaration of Competing Interest
The authors declare that they have no known competing financial interests or personal relationships that could have appeared to influence the work reported in this paper.
References
- Enhancing the solubility and bioavailability of poorly water-soluble drugs using supercritical antisolvent (SAS) process. Int. J. Pharm.. 2018;538:1-13.
- [Google Scholar]
- Experimental Analysis and Thermodynamic Modelling of Lenalidomide Solubility in Supercritical Carbon Dioxide. Arabian J. Chem. 2022:103821.
- [Google Scholar]
- Experimental Optimization and Modeling of Supercritical Fluid Extraction of Oil from Pinus gerardiana. Chemical Engineering & Technology. 2021;44(4):578-588.
- [CrossRef] [Google Scholar]
- Utilization of supercritical CO2 gas antisolvent (GAS) for production of Capecitabine nanoparticles as anti-cancer drug: Analysis and optimization of the process conditions. J. CO2 Util.. 2021;46:101465.
- [Google Scholar]
- Experimental Measurement and Thermodynamic Modeling of Capecitabine (an Anticancer Drug) Solubility in Supercritical Carbon Dioxide in a Ternary System: Effect of Different Cosolvents. J. Chem. Eng. Data. 2020;65:4762-4779.
- [Google Scholar]
- Measurement and Correlation of Solid Drugs Solubility in Supercritical Systems. Chin. J. Chem. Eng.. 2014;22:549-558.
- [Google Scholar]
- Measurement and correlation of the solubility of two steroid drugs in supercritical carbon dioxide using semi empirical models. J. Supercrit. Fluids. 2013;78:28-33.
- [Google Scholar]
- Thermophysical properties of fluids: an introduction to their prediction. World Scientific; 1996.
- Neural network modeling of ternary solubilities of 2-naphthol in supercritical CO2: A comparative study. Mathematical and Computer Modelling. 2012;55(7):1932-1941.
- [CrossRef] [Google Scholar]
- Properties of Gases and Liquids (fifth ed). McGraw-Hill Education; 2001.
- An association model for the solubilities of pharmaceuticals in supercritical carbon dioxide. Thermochim Acta. 2010;507–508:99-105.
- [Google Scholar]
- Solubilities of methoxy-1-tetralone and methyl nitrobenzoate isomers and their mixtures in supercritical carbon dioxide. J. Chem. Eng. Data. 1985;30:74-78.
- [Google Scholar]
- Solubility of Dexamethasone in Supercritical Carbon Dioxide. J. Chem. Eng. Data. 2012;57:3756-3760.
- [Google Scholar]
- Measurement of solid solubility of warfarin in supercritical carbon dioxide and recrystallization study using supercritical antisolvent process. Adv. Powder Technol.. 2017;29
- [Google Scholar]
- Cubic equation-of-state correlation of the solubility of some anti-inflammatory drugs in supercritical carbon dioxide. Fluid Phase Equilibria. 2006;239:188-199.
- [Google Scholar]
- New group contribution method for estimating properties of pure compounds. AIChE J.. 1994;40:1697-1710.
- [Google Scholar]
- Experimental and modeling investigation of Glibenclamide solubility in supercritical carbon dioxide. Fluid Phase Equilib.. 2022;556:113408.
- [Google Scholar]
- Developing an accurate empirical correlation for predicting anti-cancer drugs’ dissolution in supercritical carbon dioxide. Sci. Rep.. 2022;12:9380.
- [Google Scholar]
- Extraction of Epigallocatechin-3-gallate from green tea via supercritical fluid technology: Neural network modeling and response surface optimization. J. Supercrit. Fluids. 2013;74:128-136.
- [Google Scholar]
- The valence-shell electron-pair repulsion (VSEPR) theory of directed valency. J. Chem. Educ.. 1963;40:295.
- [Google Scholar]
- Topological Analysis of Electron Density in Large Biomolecular Systems. Curr. Drug Discov. Technol.. 2019;16:437-448.
- [Google Scholar]
- An equation-of-state contribution for polar components: Quadrupolar molecules. AIChE J.. 2005;51:2556-2568.
- [Google Scholar]
- Solubility of sulindac in the supercritical carbon dioxide: Experimental and modeling approach. J. Supercrit. Fluids. 2012;68:39-44.
- [Google Scholar]
- Solubilities and diffusion coefficients of high boiling compounds in supercritical carbon dioxide. Chem. Eng. Sci.. 2001;56:3027-3044.
- [Google Scholar]
- Solubility of some statin drugs in supercritical carbon dioxide and representing the solute solubility data with several density-based correlations. J. Supercrit. Fluids. 2007;41:187-194.
- [Google Scholar]
- Solubility analysis of clozapine and lamotrigine in supercritical carbon dioxide using static system. J. Supercrit. Fluids. 2010;52:30-35.
- [Google Scholar]
- Prediction of density in organic crystals. Acta Crystallographica Section A. 1977;33:216-218.
- [Google Scholar]
- Supercritical Fluid Technology: An Emphasis on Drug Delivery and Related Biomedical Applications. Adv. Healthcare Mater.. 2017;6
- [Google Scholar]
- Solubilities of acetaminophen in supercritical carbon dioxide with and without menthol cosolvent: Measurement and correlation. Scientia Iranica. 2012;19:619-625.
- [Google Scholar]
- Particle swarm optimization, Encyclopedia of machine learning. Springer; 2011. p. :760-766.
- Measurement and correlation solubility of cefixime trihydrate and oxymetholone in supercritical carbon dioxide (CO2) J. Supercrit. Fluids. 2013;73:130-137.
- [Google Scholar]
- Comparison the capability of artificial neural network (ANN) and EOS for prediction of solid solubilities in supercritical carbon dioxide. Fluid Phase Equilib.. 2011;308:35-43.
- [Google Scholar]
- Hydroxychloroquine, a less toxic derivative of chloroquine, is effective in inhibiting SARS-CoV-2 infection in vitro. Cell Discovery. 2020;6:16.
- [Google Scholar]
- Modeling the Solubility of Dihydroxybenzoic Acid and Methylbenzoic Acid Isomers in Supercritical Carbon Dioxide. Int. J. Thermodyn.. 2014;17
- [Google Scholar]
- Group-contribution based estimation of pure component properties. Fluid Phase Equilibr. 2001;183–184:183-208.
- [Google Scholar]
- Modelling of solubility of vitamin K3 derivatives in supercritical carbon dioxide using cubic and SAFT equations of state. J. Supercrit. Fluids. 2021;167:105040.
- [Google Scholar]
- Estimating the Dissolution of Anticancer Drugs in Supercritical Carbon Dioxide with a Stacked Machine Learning Model. Pharmaceutics. 2022;14:1632.
- [Google Scholar]
- Experimental determination and theoretical correlation for the solubilities of dicarboxylic acid esters in supercritical carbon dioxide. J. Supercrit. Fluids. 2015;101:87-94.
- [Google Scholar]
- Modified Wilson's Model for Correlating Solubilities in Supercritical Fluids of Some Polycyclic Aromatic Solutes. Polycyclic Aromat. Compd.. 2018;38:244-256.
- [Google Scholar]
- Correlation of the Solubility of Some Organic Aromatic Pollutants in Supercritical Carbon Dioxide Based on the UNIQUAC Equation. Energy Procedia. 2012;18:1261-1270.
- [Google Scholar]
- Correlation and Prediction of the Solubility of Solid Solutes in Chemically Diverse Supercritical Fluids Based on the Expanded Liquid Theory. Adv. Chem. Eng. Sci.. 2013;3:255.
- [Google Scholar]
- Electron Density Analysis of SARS-CoV-2 RNA-Dependent RNA Polymerase Complexes. Molecules (Basel, Switzerland). 2021;26
- [Google Scholar]
- Thermodynamic modelling and experimental validation of pharmaceutical solubility in supercritical solvent. J. Mol. Liq.. 2020;319:114120.
- [Google Scholar]
- Measuring solubility of a chemotherapy-anti cancer drug (busulfan) in supercritical carbon dioxide. J. Mol. Liq.. 2020;317:113954.
- [Google Scholar]
- Experimental and thermodynamic modeling decitabine anti cancer drug solubility in supercritical carbon dioxide. Sci. Rep.. 2021;11:1075.
- [Google Scholar]
- Chloroquine (antimalaria medication with anti SARS-CoV activity) solubility in supercritical carbon dioxide. J. Mol. Liq.. 2021;322:114539.
- [Google Scholar]
- Solubility of trioctylmethylammonium chloride in supercritical carbon dioxide and the influence of co-solvents on the solubility behavior. J. Supercrit. Fluids. 2018;138:102-114.
- [Google Scholar]
- Experimental measurements and correlation of the solubility of N, N-dialkylamides in supercritical carbon dioxide. J. Supercrit. Fluids. 2019;143:162-170.
- [Google Scholar]
- Hydroxychloroquine in systemic lupus erythematosus (SLE) Expert Opin. Drug Safety. 2017;16:411-419.
- [Google Scholar]
- A new paradigm for pattern recognition of drugs. J. Comput. Aided Mol. Des.. 2008;22:489-505.
- [Google Scholar]
- Electron-based descriptors in the study of physicochemical properties of compounds. Comput. Theor. Chem.. 2018;1123:1-10.
- [Google Scholar]
- The Complementarity Principle-One More Step towards Analytical Docking on the Example of Dihydrofolate Reductase Complexes. Life (Basel). 2021;11
- [Google Scholar]
- Molecular thermodynamics of fluid-phase equilibria. Pearson Education; 1998.
- An association and Wilson activity coefficient model for solubilities of aromatic solid pollutants in supercritical carbon dioxide. Thermochim Acta. 2012;541:49-56.
- [Google Scholar]
- Experimental determination and activity coefficient based models for mixture solubilities of nitrophenol isomers in supercritical carbon dioxide. J. Supercrit. Fluids. 2013;79:2-10.
- [Google Scholar]
- A universal methodology for reliable predicting the non-steroidal anti-inflammatory drug solubility in supercritical carbon dioxide. Sci. Rep.. 2022;12:1043.
- [Google Scholar]
- Electron density analysis of CDK complexes using the AlteQ method, Future. Med. Chem.. 2020;12:1387-1397.
- [Google Scholar]
- Determination of Anthraquinone Violet 3RN solubility in supercritical carbon dioxide with/without co-solvent: Experimental data and modeling (empirical and thermodynamic models) Chem. Eng. Res. Des.. 2020;159:529-542.
- [Google Scholar]
- Adsorption of Native Amino Acids on Nanocrystalline TiO2: Physical Chemistry, QSPR, and Theoretical Modeling. Langmuir. 2019;35:538-550.
- [Google Scholar]
- Experimental measurement and correlation for solubility of piroxicam (a non-steroidal anti-inflammatory drugs (NSAIDs)) in supercritical carbon dioxide. J. Supercrit. Fluids. 2013;80:38-43.
- [Google Scholar]
- Equilibrium constants from a modified Redlich-Kwong equation of state. Chem. Eng. Sci.. 1972;27:1197-1203.
- [Google Scholar]
- Experimental and thermodynamic analyses of supercritical CO2-Solubility of minoxidil as an antihypertensive drug. Fluid Phase Equilibr. 2020;522
- [Google Scholar]
- Experimental and thermodynamic analyses of supercritical CO2-Solubility of minoxidil as an antihypertensive drug. Fluid Phase Equilib.. 2020;522:112745.
- [Google Scholar]
- Experimental data and thermodynamic modeling of solubility of Azathioprine, as an immunosuppressive and anti-cancer drug, in supercritical carbon dioxide. J. Mol. Liq.. 2020;299:112179.
- [Google Scholar]
- Solubility of anti-inflammatory, anti-cancer, and anti-HIV drugs in supercritical carbon dioxide. J. Chem. Eng. Data. 2005;50:1234-1241.
- [Google Scholar]
- Polymorphic properties of micronized Mefenamic acid, Nabumetone, Paracetamol and Tolbutamide produced by Rapid Expansion of Supercritical Solutions (RESS) J. Supercrit. Fluids. 2016;116
- [Google Scholar]
- Comparison between the artificial neural network, SAFT and PRSV approach in obtaining the solubility of solid aromatic compounds in supercritical carbon dioxide. J. Supercrit. Fluids. 2013;77:44-51.
- [Google Scholar]
- Over de Continuiteit van den Gas-en Vloeistoftoestand (On the Continuity of the Gas and Liquid State). University of Leiden; 1873.
- Measurement and modeling of solubility of gliclazide (hypoglycemic drug) and captopril (antihypertension drug) in supercritical carbon dioxide. J. Supercrit. Fluids. 2021;174:105244.
- [Google Scholar]
- Solubility measurement and RESOLV-assisted nanonization of gambogic acid in supercritical carbon dioxide for cancer therapy. J. Supercrit. Fluids. 2019;150:147-155.
- [Google Scholar]
- Solubility of capecitabine and docetaxel in supercritical carbon dioxide: Data and the best correlation. Thermochim Acta. 2012;549:95-101.
- [Google Scholar]
- Measurement and correlation of antifungal drugs solubility in pure supercritical CO2 using semiempirical models. J. Chem. Thermodyn.. 2011;43:1091-1096.
- [Google Scholar]
- Measurement and correlation study of silymarin solubility in supercritical carbon dioxide with and without a cosolvent using semi-empirical models and back-propagation artificial neural networks. Asian J. Pharm. Sci.. 2017;12:456-463.
- [Google Scholar]
- Experimental Solubility Measurements of Fenoprofen in Supercritical Carbon Dioxide. J. Chem. Eng. Data. 2020;65:1425-1434.
- [Google Scholar]
- Thermodynamic study on solubility of brain tumor drug in supercritical solvent: Temozolomide case study. J. Mol. Liq.. 2021;321:114926.
- [Google Scholar]
- Measuring salsalate solubility in supercritical carbon dioxide: Experimental and thermodynamic modelling. J. Chem. Thermodyn.. 2021;152:106271.
- [Google Scholar]
- Solubility Measurement of Diclofenac Acid in the Supercritical CO2. J. Chem. Eng. Data. 2012;57:1659-1664.
- [Google Scholar]
- Measurement and modeling of mefenamic acid solubility in supercritical carbon dioxide. Fluid Phase Equilib.. 2012;313:140-147.
- [Google Scholar]
- Solubility and Partition Coefficients of 5-Fluorouracil in ScCO2 and ScCO2/Poly(l-lactic acid) J. Chem. Eng. Data. 2014;59:1158-1164.
- [Google Scholar]
- Density-based UNIFAC model for solubility prediction of solid solutes in supercritical fluids. Fluid Phase Equilib.. 2020;506:112376.
- [Google Scholar]


