Translate this page into:
Therapeutic effect of total flavonoids of Sargentodoxa cuneata on ulcerative colitis in mice by correcting gut dysbiosis
⁎Corresponding author at: College of Pharmacy Guizhou University of Traditional Chinese Medicine, Huaxi District, Guiyang City, Guizhou Province, Guiyang 550025, China. xf333666999@sina.com (Feng Xu)
-
Received: ,
Accepted: ,
This article was originally published by Elsevier and was migrated to Scientific Scholar after the change of Publisher.
Abstract
Sargentodoxa cuneata is a traditional Chinese herb commonly used for the treatment of ulcerative colitis (UC) in clinical practice. However, the effects of total flavonoids of Sargentodoxa cuneata (TFSc) remain unclear. In this study, we explored the effects and mechanisms of action of TFSc in mice with dextran sulfate sodium-induced UC. The TFSc components were identified using liquid chromatography-tandem mass spectrometry. Mice with UC were orally administered TFSc to evaluate its effects on colon and liver damage. Changes in gut microbiota were analyzed using 16S rRNA gene sequencing. Moreover, the levels of short-chain fatty acids (SCFAs) and few organic acids in the intestinal contents were measured. Furthermore, the correlation amongst gut flora, SCFAs, and organic acids was studied. A total of 304 compounds were identified. TFSc alleviated the symptoms of UC in mice, inhibited weight loss, reduced the disease activity index, and improved colon shortening along with cardiac and hepatic indices. Furthermore, TFSc mitigated pathological changes in the colon and liver, and reduced the TNF-α levels in colon tissues of mice with UC. TFSc also modulated intestinal flora disorders, increased the levels of four SCFAs (isocaproic acid, 3-hydroxyisovaleric acid, isobutyric acid, and ethylmethylacetic acid), and decreased the levels of two organic acids (malonic acid and succinic acid). The differential regulation of SCFAs and organic acids by TFSc was strongly associated with specific gut flora. TFSc showed potential for improving colon and liver injury in mice with UC by regulating the intestinal flora and associated metabolites (SCFAs and organic acids). These findings provide new evidence for developing TFSc as a drug for treating UC and UC-related liver injuries.
Keywords
Total flavonoids of Sargentodoxa cuneata
Ulcerative colitis
Ulcerative colitis-related liver injury
Gut microbiota
Short-chain fatty acids
Organic acids
1 Introduction
Ulcerative colitis (UC) is a refractory diseases, as classified by the World Health Organization (Le Berre et al., 2023). In China, UC is one of the most common diseases of the digestive system, and is characterized by easy carcinogenesis and recurrent episodes (Cleveland et al., 2022). The morbidity and mortality rates of colorectal cancer caused by UC are extremely high, making it a serious threat to people's live and health (Le Berre et al., 2023). Clinical treatment of UC can only alleviate, but not cure the disease. The main therapeutic drugs for the inflammation of intestinal tract in the active stage of UC include aminosalicylic acid preparations, glucocorticosteroids, immunosuppressants, and biologics; however, there are shortcomings, such as poor therapeutic efficacy, more adverse reactions, and ease of recurrent after discontinuation of the drugs (Chen et al., 2022). Clinical findings on Chinese medicine for UC have shown that it has comprehensive efficacy in controlling intestinal inflammation, reducing complications, preventing disease recurrence after medication discontinuation, and improving patients' quality of life and prognosis (Liu et al., 2022).
According to Miao medicine, “poison is the source of all diseases” and “poison” staying in the gastrointestinal tract for a long time will affect the intestinal function and lead to organic lesions, such as inflammation, erosion, and ulcers. Sargentodoxa cuneata [the vine stem of Sargentodoxa cuneata (Oliv.) Rehd. et Wils.] belonging to the family Moutonaceae, also known as Da Xue Teng, has been used to treat gastrointestinal disorders. It reportedly detoxifies carbuncles, activates blood circulation, and relieves pain. Moreover, it also clears the heat, wind, and dampness poisons, and has a good therapeutic effect on UC (Zhang et al., 2021; Wang et al., 2023b). Furthermore, it has been elucidated that the ethyl acetate extract from decoction of Sargentodoxa cuneata, which is rich in total flavonoids, has a good therapeutic effect on UC (Yu et al., 2023b). Total flavonoids have antioxidant, anti-inflammatory, anticancer, and antiviral properties, and are one of the reported active components of traditional Chinese medicine against UC (Xue et al., 2023). Whether total flavonoids of Sargentodoxa cuneata (TFSc) is the active part of Sargentodoxa cuneata against UC remains unknow. Moreover, it would be interesting to know whether TFSc can also ameliorate the liver injury complicated by UC. However, the mechanism of action of TFSc in UC remains unclear and warrants further exploration.
In recent years, intestinal flora has been found to be involved in the pathogenesis and treatment of UC (Cheng et al., 2022). The microbial diversity in the intestinal tract of patients with UC is reduced in comparison to that of normal individuals. The abundance of bad bacteria increases and that of good bacteria decreases in the intestinal tract of patients with UC (Wang et al., 2023a). Intestinal flora and microbial metabolites are important for maintaining the intestinal health (Upadhyay et al., 2023). Therefore, changes in the composition of intestinal microbiota have a significant impact on the onset and treatment of UC. Regulation of disorders of the intestinal flora is an important way to treat diseases using herbal medicines (Wang et al., 2023a). After oral administration, the flavonoid components of Traditional Chinese Medicine either act directly on the intestinal flora or are absorbed into the bloodstream to exert a therapeutic effect (Cheng et al., 2023). Therefore, TFSc likely regulates gut dysbiosis caused by UC and ameliorates colonic and hepatic injuries in mice with UC.
In this study, the effects of TFSc on colon and liver injury in a mouse model of UC were assessed in the context of intestinal flora and its metabolites, such as short-chain fatty acids (SCFAs) and organic acids. The findings of our study will provide new ideas for elucidating the pharmacological mechanism of TFSc in the improvement of colon and liver injuries in UC, which would be conducive for the further development and utilization of TFSc.
2 Materials and methods
2.1 Chemicals and reagents
The 36–50 kDa dextran sulfate sodium (DSS) was obtained from MP Biomedical (Illkirch, France). Reagents (methanol and acetonitrile) used for chromatography were provided by Thermo-Fisher Scientific (FairLawn, NJ, USA). Formic acid and standards of SCFAs and organic acids (≥99.9 % purity) were purchased from Sigma-Aldrich (St. Louis, MO, USA).
2.2 Preparation and composition of TFSc
The herbs used in this study were identified by Prof. Wang Xiangpei of the Guizhou Minzu University. An aqueous extract of Sargentodoxa cuneata was obtained by decocting with water, followed by filtration and concentration (Yu et al., 2023b). Briefly, the Sargentodoxa cuneata herb was weighted, and water was added to submerge the herbs 2–3 cm, soaked for 15 min, boiled over high heat, and then decocted over low heat for 15 min. The mixture was filtered and water was added water, followed by decoction. This procedure was repeated thrice. Finally, the filtrate was combined and concentrated using rotary evaporator. The extract was placed on a D101 macroporous resin column and eluted using different ethanol concentrations (5, 10, 20, 30, 40, 50, 70, and 95 %). After detection by sodium nitrite-aluminum nitrate colorimetric assay, 20 % and 40 % ethanol elution sites enriched in flavonoid components were combined, concentrated to no alcohol and dried to obtain TFSc.
An Agilent SB-C18 column (100 × 2.1 mm, 1.8 μm) was used to analyze the ingredients of TFSc at 40 °C. The mobile phase comprised 0.1 % formic acid aqueous solution (solvent A) and 0.1 % formic acid acetonitrile (solvent B) at 0.35 mL/min. The time program for gradient elution was as follows: 0–9 min, 5–95 % B, 9–10 min; 95 % B, 10–11.10 min; 95–5 % B, 11.10–14 min; 5 % B. Injection volume was 4 μL. A triple quadrupole-linear ion trap mass spectrometer was used to identify the composition of TFSc in positive and negative ion modes. Source temperature of electrospray ionization detector (ESI) was set at 500 °C, and ion spray voltage was set at 5500 V using positive ion mode and at −4500 V using negative ion mode. Instrument tuning and mass calibration were performed in triple quadrupole (QQQ) and LIT modes, respectively. A specific set of multiple-reaction monitoring (MRM) transitions was monitored for each period according to the metabolites eluted within that period. Based on the self-constructed local metabolic database of Biomarker Technologies (Beijing, China), the TFSc compounds were analyzed qualitatively and quantitatively using mass spectrometry.
2.3 Animals
Male C57BL/6 mice (18–22 g) were provided by SPF (Beijing) Biotechnology Co., Ltd (Beijing, China). All animals were kept in rooms maintained at 22–26 °C with a 12 h light, 12 h dark cycle. All animals were treated kindly and provided food and water ad libitum. Experiments were conducted in accordance with the requirements of the Animal Ethics Committee of Guizhou University of Traditional Chinese Medicine (N0. 20220046).
2.4 Mice with DSS-induced UC and drug administration
UC mouse models were constructed in accordance with the well-established methods (Fig. 2a). A total of 28 mice were randomly divided into control, UC, high-dose TFSc (39.02 mg/kg), and low-dose TFSc (19.51 mg/kg) groups. A 19.51 mg/kg dose of TFSc was equivalent to a human clinical dose of 0.25 g/kg of Sargentodoxa cuneata. Except for the animals in control group, which drank pure water, animals in other groups were giving water containing 2 % DSS for seven consecutive days, followed by pure water for another seven days. From days 1–14, the TFSc groups were administered TFSc at two different concentrations by intragastric gavage, whereas the control and UC groups were administered normal water.
2.5 Disease activity index (DAI) scoring and sampling
The animals were weighed every third days and on the last day. DAI was assessed on days 7, 10, and 13; and DAI scores included weight loss, stool consistency, and rectal bleeding scores. Weight loss was scored as 0–0 %, 1–1 %–5%, 2–5 %–10 %, 3–10 %–20 %, 4–>20 %, stool consistency as (0–negative; 1–malleable stool; 2–semi-sloppy stool; 3–loose stool; 4–severe loose stool); and rectal bleeding as (0–negative; 1–bloody stool visible to the naked eye (+); 2–++; 3–+++; 4–>+++). On day 14, animals of all the groups were sacrificed by cervical dislocation and the length of the colon tissue was measured. Moreover, the organ indices of heart, liver, spleen, lung, kidney, and thymus were also calculated. The colon and liver tissues were immobilized in 4 % paraformaldehyde solution, and the intestinal contents were collected for further experiments.
2.6 Histological evaluation
Colon and liver tissues were fixed with 4 % paraformaldehyde, processed, and stained using hematoxylin and eosin (HE) staining. Colon tissue damage index (TDI) scores comprised ulcer depth, degree of inflammatory cell infiltration, and depth of inflammatory cell infiltration scores. The following scores were allocated to the different damage parameters: depth of the ulcer (0, negative; 1, epithelium; 2, mucosal lamina propria; 3, mucosal muscularis propria), degree of inflammatory cell infiltration (0, negative; 1, mild; 2, moderate; 3, severe), and depth of inflammatory cell infiltration (0, negative; 1, mucosal layer; 2, mucosa and submucosa; 3, whole colon). Liver TDI scores consisted of cellular enlargement, cytoplasmic vacuolation, and narrowing of the hepatic sinusoids scores. The following scores were allocated to the different TDI parameters of liver: cellular enlargement (0, negative; 1, mild; 2, moderate; 3, severe), cytoplasmic vacuolation (0, negative; 1, mild; 2, moderate; 3, severe), narrowing of hepatic sinusoids (0, negative; 1, mild; 2, moderate; 3, severe).
2.7 Immunohistochemistry (IHC)
A wax block of colon tissue was taken and after deparaffinized using conventional methods and antigen was repaired with a citrate buffer solution. The sections were then incubated in 3 % hydrogen peroxide solution (hydrogen peroxide: purified water = 1:9) for 15 min at room temperature in dark to block endogenous peroxidase activity. The endogenous peroxidase activity was blocked by using 5 % goat serum for containment, and antibodies against tumor necrosis factor (TNF)-α (1:200, Affinity, Jiangsu, China) were added dropwise to the sections and incubated at 4 °C overnight. Next, secondary antibodies were added and incubated at 37℃ for 30 min, color developed using diaminobenzidine (DAB), restrained with Harris hematoxylin, and the sections were prepared for image acquisition. Hematoxylin-stained nuclei were blue, and positive staining with DAB appeared brownish-yellow.
2.8 16S rRNA gene sequencing of the intestinal flora
The genomic DNA of each group was extracted from the fecal samples and prepared for PCR amplification of selected genes in specific regions of the primer using specific primers containing barcodes. Fluorescence was quantified using a Quant-iT PicoGreen dsDNA assay kit and a microplate reader as the fluorescence quantification instrument. (BioTek, FLx800, USA). Amplicon library size and quantity were assessed using Agilent Bioanalyzer (Agilent, United States), and sequencing was performed on Illumina platform. NovaSeq 6000 SP kit reagent was used for sequencing. The raw sequences were de-primed, quality-filtered, de-noised, spliced, and de-chimerised using the Divisive Amplicon Denoising Algorithm 2 (DADA2) in FASTQ format. Operational taxonomic unit (OTU) analysis was performed with >97 % similarity. The abundance information, α- and β-diversity, along with community structure and species composition of the samples were analyzed using multivariate analysis. Furthermore, differences in biologically relevant taxonomic biomarkers among the groups were analyzed using linear discriminant analysis effect size (LEfSe).
2.9 Measurement of SCFAs and organic acids in intestinal contents
The intestinal content sample was accurately weighed, water was added, and the sample was homogenized for 3 min using zirconia beads (B B24, Next Advance, Inc., NY, USA). The sample was then treated with methanol, and standard internal substances were added. After centrifugation, the supernatant was analyzed using Biomek 4000 workstation (California, USA). The samples were centrifuged and subjected to UPLC-MS/MS analysis. UPLC-Xevo TQ-S system (MA, USA) was used for analysis. A Waters ACQUITY UPLC BEH C18 column (2.1 × 100 mm, 1.7 µM) was used for separation at 40 °C. Gradient elution program [0–1 min, 12 % B; 1–2.8 min, 12–16.5 % B; 2.8–4.2 min, 16.5–24 % B; 4.2–5.6 min, 24–30 % B; 5.6–8.5 min, 30–100 % B; 8.5–10 min, 100 % B; 10–11 min, 100–1 % B; and 11–12 min, 1–12 % B (solvent A, 0.1 % formic acid; solvent B, acetonitrile)] was performed at 0.4 mL/min for the whole analytic process. Injection volume was 5 µL. The ESI ion source temperature was set at 150 ℃ using negative ion mode and the target ions were monitored.
2.10 Correlation analysis of intestinal microbiota with SCFAs and organic acids
SCFAs and organic acids have been found to be closely related to the intestinal flora and are important metabolites of intestinal flora (Lee et al., 2020). Spearman’s correlation coefficients were calculated to identify bacteria-metabolite correlations.
2.11 Statistical analysis
For analysis of pharmacodynamic indicators, intestinal microbiota, SCFA, and organic acids, data were presented as mean ± standard deviation (SD). One-way ANOVA and least significant difference (LSD) test was used to analyze the results among the groups using SPSS 20.0 software (Chicago, Illinois, USA). The α-diversity differences between samples of different groups were analyzed using Wilcoxon's rank-order analysis. P < 0.05 represented a statistical difference, while P < 0.01 indicated more significant statistical difference.
3 Results
3.1 Analysis of the chemical constituents of TFSc using UPLC-MS
Broad-targeted metabolomic analysis identified 304 flavonoid components from TFSc. The major flavonoid components included flavanols, flavonols, flavones, dihydroflavonoids, dihydroflavonols, proanthocyanidins, chalcones, and isoflavones (Fig. 1, Table S1). The top 100 compounds in terms of metabolic abundance of the identified components are shown in Table 1. All the components were validated based on their accuracy and fragments. Components namely rutin, proanthocyanidin B2, epicatechin, catechin and quercetin have been reported previously (Lai, 2019, Zhang et al., 2021, Zhan et al., 2022). *means that the component may have isomers.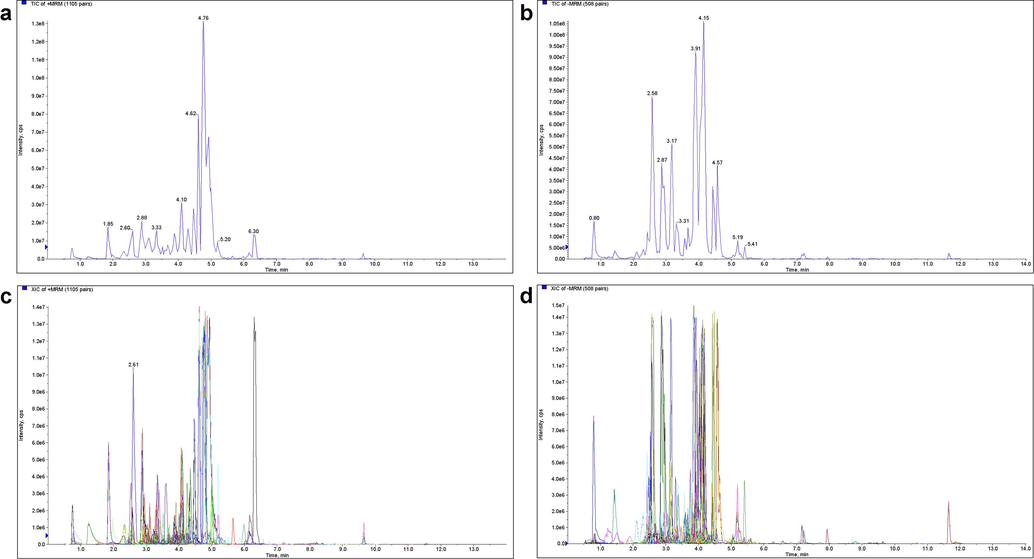
Total ion chromatogram (TIC) and multiple-reaction monitoring (MRM) detection of multimodal maps of total flavonoids of Sargentodoxa cuneata (TFSc). (a) TIC in positive ion mode for TFSc sample. (b) TIC in negative ion mode for TFSc sample. (c) Positive ion mode for TFSc sample. (d) Negative ion mode for TFSc sample.
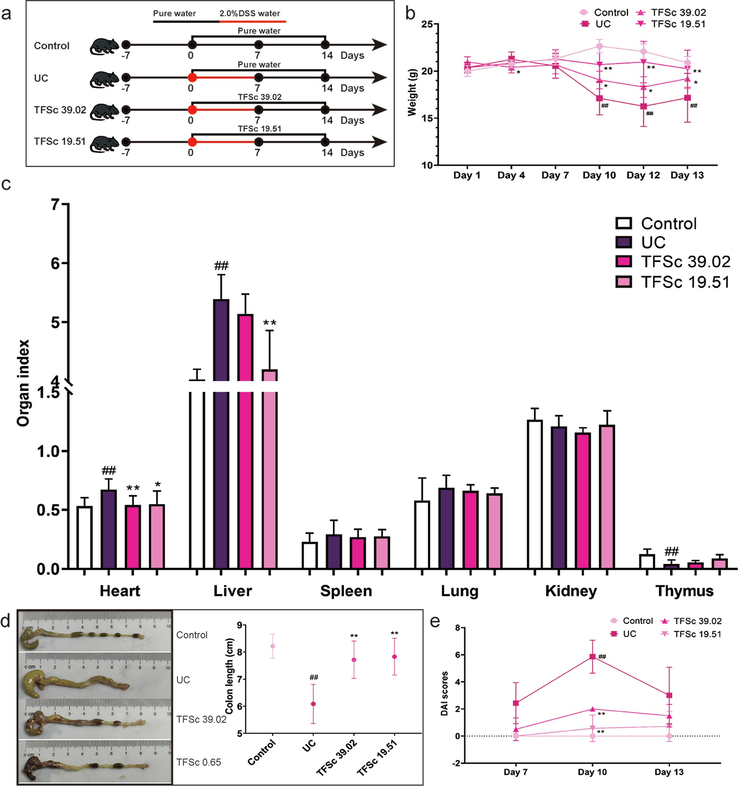
Total flavonoids of Sargentodoxa cuneata (TFSc) improved the manifestations of mice with UC. (a) The process of this animal experiment. (b) Body weight changes. (c) Effects of TFSc on heart, liver, spleen, lung, kidney and thymus index scores. (d) The colon tissue and length. (e) DAI scores. Data are presented as mean ± SD (n = 7 per group). #P < 0.05 vs. the control group, ##P < 0.01 vs. the control group, *P < 0.05 vs. the UC group, **P < 0.01 vs. the UC group.
name
metabolite abundance
Formula
Molecular weight (Da)
Ionization model
Q1 (Da)
Class II
Catechin-(7,8-bc)-4α-(3,4-dihydroxyphenyl)-dihydro-2-(3H)-one
49998364.67
C24H20O9
452.1107
[M−H]-
451.1045
Flavanols
Cinchonain Id
45048595.01
C24H20O9
452.1107
[M−H]-
451.1045
Flavanols
Cinchonain Ic
7806603.636
C24H20O9
452.1107
[M−H]-
451.1033
Flavanols
Quercetin
7187682.949
C15H10O7
302.0427
[M + H]+
303.0518
Flavonols
Isobavachalcone glucoside
4585041.257
C26H30O9
486.189
[M + H]+
487.1911
Chalcones
Chrysoeriol-7-O-glucoside
3034536.541
C22H22O11
462.1162
[M−H]-
461.1084
Flavones
Quercetin-3-O-neohesperidoside*
2799344.01
C27H30O16
610.1534
[M + H]+
611.1594
Flavonols
Aromadendrin-7-O-glucoside
2594921.849
C21H22O11
450.1162
[M−H]-
449.1081
Flavanonols
Epicatechin
2509557.779
C15H14O6
290.079
[M + H]+
291.0859
Flavanols
Quercetin-3-O-glucoside-7-O-rhamnoside*
2506390.498
C27H30O16
610.1534
[M + H]+
611.1594
Flavonols
Hesperetin-7-O-(6′'-malonyl)glucoside
2447186.468
C25H26O14
550.1323
[M−H]-
549.1247
Flavanones
Rutin*
2309914.321
C27H30O16
610.1534
[M + H]+
611.1591
Flavonols
Diosmetin-7-O-galactoside
1835744.129
C22H22O11
462.1162
[M + H]+
463.1232
Flavones
Homoplantaginin
1805320.246
C22H22O11
462.1162
[M + H]+
463.1232
Flavones
Quercetin-5-O-β-D-glucoside*
1748991.25
C21H20O12
464.0955
[M + H]+
465.104
Flavonols
Luteolin-8-C-arabinoside
1657264.21
C20H18O10
418.09
[M + H]+
419.0871
Flavones
6-C-MethylKaempferol-3-glucoside
1541284.5
C22H22O11
462.1162
[M + H]+
463.1232
Flavones
Naringenin-7-O-Rutinoside-4′-O-glucoside
1466638.281
C33H42O19
742.232
[M−H]-
741.231
Flavanones
Isohyperoside*
1,439,398
C21H20O12
464.0955
[M + H]+
465.102
Flavonols
6-C-Glucosyl-2-Hydroxynaringenin
1404154.322
C21H22O11
450.1162
[M−H]-
449.1094
Flavanones
Hesperetin-5-O-glucoside
1377354.268
C22H24O11
464.1319
[M−H]-
463.1241
Flavanones
Luteolin-3′-O-glucoside*
1321991.5
C21H20O11
448.1006
[M + H]+
449.1017
Flavones
Quercetin-3-O-robinobioside
1237069.255
C27H30O16
610.1534
[M−H]-
609.149
Flavonols
Hyperin
1170914.132
C21H20O12
464.0955
[M−H]-
463.0876
Flavonols
Luteolin-4′-O-glucoside*
1109268.5
C21H20O11
448.1006
[M + H]+
449.0985
Flavones
Quercetin-7-O-glucoside*
1087301.026
C21H20O12
464.0955
[M−H]-
463.0876
Flavonols
Spiraeoside*
1051313.626
C21H20O12
464.0955
[M−H]-
463.0876
Flavonols
Eriodictyol-8-C-glucoside
997562.653
C21H22O11
450.1162
[M−H]-
449.1086
Flavanones
Cynaroside*
732526.25
C21H20O11
448.1006
[M + H]+
449.1071
Flavones
Isoquercitrin
705213.947
C21H20O12
464.0955
[M−H]-
463.0876
Flavonols
Cinchonain Ia
629669.302
C24H20O9
452.1107
[M + H]+
453.1189
Flavanols
Chrysoeriol-7-O-(2′'-O-glucuronyl)glucoside
596928.25
C28H30O17
638.1483
[M + H]+
639.1562
Flavones
Chrysoeriol-5-O-glucoside
549181.737
C22H22O11
462.1162
[M−H]-
461.1086
Flavones
Morin
548929.585
C15H10O7
302.0427
[M−H]-
301.0347
Flavonols
Quercetin-3,7-Di-O-glucoside
504937.626
C27H30O17
626.1483
[M + H]+
627.144
Flavonols
6-Hydroxykaempferol-3,6-O-Diglucoside
496,929
C27H30O17
626.1483
[M + H]+
627.1557
Flavonols
Procyanidin B1
489811.637
C30H26O12
578.1424
[M−H]-
577.1389
Proanthocyanidins
Trifolin
470898.384
C21H20O11
448.1006
[M−H]-
447.0955
Flavonols
6-Hydroxykaempferol-7,6-O-Diglucoside
461,937
C27H30O17
626.1483
[M + H]+
627.1562
Flavonols
Nepetin-7-O-alloside*
455715.75
C22H22O12
478.1111
[M + H]+
479.1202
Flavones
Neodiosmin*
440,225
C28H32O15
608.1741
[M + H]+
609.1825
Flavones
Nepitrin*
409857.5
C22H22O12
478.1111
[M + H]+
479.12
Flavones
4′-Methoxyflavone
403186.449
C16H12O3
252.0786443
[M−H]-
251.071
Flavones
6-C-Methylquercetin-3-O-rutinoside
397080.5
C28H32O16
624.169
[M + H]+
625.1765
Flavonols
Isorhamnetin-3-O-neohesperidoside
389677.5
C28H32O16
624.169
[M + H]+
625.1763
Flavonols
Sexangularetin-3-O-glucoside-7-O-rhamnoside
384112.5
C28H32O16
624.169
[M + H]+
625.1763
Flavonols
Sieboldin
344911.655
C21H24O11
452.1319
[M−H]-
451.1232
Chalcones
3,4,2′,4′,6′-Pentahydroxychalcone-4′-O-glucoside
326019.713
C21H22O11
450.1162
[M−H]-
449.1093
Chalcones
Diosmin*
307902.5
C28H32O15
608.1741
[M + H]+
609.1825
Flavones
8-Methoxykaempferol-7-O-rhamnoside
291909.008
C22H22O11
462.1162
[M−H]-
461.1095
Flavonols
Dihydromarein
276681.341
C21H24O11
452.1319
[M−H]-
451.1277
Chalcones
Calycosin-7-O-glucoside
263,752
C22H22O10
446.1213
[M + H]+
447.1285
Isoflavones
Tricetiflavan
254585.618
C15H14O6
290.079
[M−H]-
289.0738
Flavanols
Myricetin-3,7,3′-trimethyl ether
245411.196
C18H16O8
360.0845
[M−H]-
359.0774
Flavonols
6-Hydroxykaempferol-7-O-glucoside
245147.25
C21H20O12
464.0955
[M + H]+
465.1031
Flavonols
Vitexin-2′'-O-galactoside
243922.5
C27H30O15
594.1585
[M + H]+
595.1678
Flavones
Isoorientin
240083.436
C21H20O11
448.1006
[M−H]-
447.0928
Flavones
5,7,3′-Trihydroxy-4,6,5′-trimethoxyxanthone
233613.128
C17H14O8
346.0689
[M−H]-
345.0608
Other Flavonoids
Kaempferol-3-O-(6′'-Acetyl)glucosyl-(1 → 3)-Galactoside
215384.976
C29H32O17
652.1639
[M−H]-
651.1586
Flavonols
Prunin
210995.971
C21H22O10
434.1213
[M−H]-
433.1168
Flavanones
catechin-4-β-D-galactopyranoside*
199780.725
C21H24O11
452.1319
[M−H]-
451.125
Flavanols
Procyanidin B2
199226.75
C30H26O12
578.1424
[M + H]+
579.1507
Proanthocyanidins
3,3′-O-Dimethylellagic Acid
198507.964
C16H10O8
330.0376
[M + H]+
331.0442
Tannin
Epicatechin-3′-O-β-D-glucopyranoside*
186447.536
C21H24O11
452.1319
[M−H]-
451.1252
Flavanols
Procyanidin B5
185176.446
C30H26O12
578.1424
[M + H]+
579.1491
Proanthocyanidins
7-Benzyloxy-5-hydroxy-3′,4′-methylenedioxyflavonoid
183644.789
C23H16O6
388.0947
[M−H]-
387.1648
Flavones
Genistein-7-O-galactoside
182978.5
C21H20O10
432.1056
[M + H]+
433.1129
Isoflavones
Lonicerin*
165518.25
C27H30O15
594.1585
[M + H]+
595.1674
Flavones
Procyanidin B3
164833.316
C30H26O12
578.1424
[M−H]-
577.1347
Proanthocyanidins
Cosmosiin
163955.198
C21H20O10
432.1056
[M−H]-
431.098
Flavones
Calycosin
163702.704
C16H12O5
284.0685
[M + H]+
285.0763
Isoflavones
3′-O-Methyltricetin-7-O-glucoside
160,313
C22H22O12
478.1111
[M + H]+
479.119
Flavones
7-hydroxy-3-(2-methoxyphenyl)-4H-chromen-4-one
158899.877
C16H12O4
268.0735589
[M−H]-
267.066
Isoflavones
Kaempferol-3-O-neohesperidoside*
157957.5
C27H30O15
594.1585
[M + H]+
595.1636
Flavonols
5,7,3′,4′-Tetrahydroxy-6,8-dimethoxyflavone
146806.09
C17H14O8
346.0688675
[M−H]-
345.0613
Flavones
Epicatechin-4′-O-β-D-glucopyranoside*
140626.183
C21H24O11
452.1319
[M−H]-
451.1271
Flavanols
Mearnsetin-3-O-glucoside
138879.864
C22H22O13
494.106
[M−H]-
493.0963
Flavones
2-(3,4-dihydroxyphenyl)-4h-chromene-3,5,7-triol-glucoside
137,199
C21H22O11
450.1162
[M + H]+
451.1232
Flavanols
Dihydrocharcone-4′-O-glucoside
136175.142
C21H24O10
436.1369
[M−H]-
435.1301
Chalcones
Nicotiflorin*
134912.25
C27H30O15
594.1585
[M + H]+
595.1622
Flavonols
Procyanidin C2
133610.953
C45H38O18
866.2058
[M−H]-
865.2063
Proanthocyanidins
Kaempferol-3-O-glucoside-7-O-rhamnoside*
132801.25
C27H30O15
594.1585
[M + H]+
595.1658
Flavonols
Chrysoeriol-6-C-glucoside-4′-O-glucoside
127653.5
C28H32O16
624.169
[M + H]+
625.1764
Flavones
Epicatechin glucoside*
125615.677
C21H24O11
452.1319
[M−H]-
451.1244
Flavanols
Quercetin-3-O-(6′'-O-galloyl)glucoside
123596.5
C28H24O16
616.1064
[M + H]+
617.1132
Flavonols
Naringenin (5,7,4′-Trihydroxyflavanone)
118345.369
C15H12O5
272.0685
[M−H]-
271.0625
Flavanones
Dihydrokaempferol-3-O-glucoside
115,411
C21H22O11
450.1162
[M + H]+
451.1211
Flavanonols
saffloquinoside A
111233.972
C27H30O15
594.1585
[M + H]+
595.1663
Chalcones
Quercetin-3-O-(2′'-O-galloyl)galactoside
104888.75
C28H24O16
616.1064
[M + H]+
617.1181
Flavonols
6-Hydroxyluteolin
103606.898
C15H10O7
302.0427
[M−H]-
301.0351
Flavones
Luteolin-6-C-arabinoside-7-O-glucoside
100,717
C26H28O15
580.1428
[M + H]+
581.1526
Flavones
5-hydroxy-7,8,3′,4′-tetramethoxyflavone glucoside
100372.75
C25H28O12
520.1581
[M + H]+
521.1636
Flavones
Marein
99,473
C21H22O11
450.1162
[M + H]+
451.1243
Chalcones
O-MethylNaringenin-8-C-arabinoside
98706.25
C21H22O9
418.1264
[M + H]+
419.1343
Flavanones
Eriodictyol-3′-O-glucoside
94354.043
C21H22O11
450.1162
[M−H]-
449.109
Flavanones
4′-O-Glucosylvitexin
92921.75
C27H30O15
594.1585
[M + H]+
595.1671
Flavones
6-Hydroxyluteolin 5-glucoside
92842.759
C21H20O12
464.0955
[M−H]-
463.0889
Flavones
Naringenin chalcone; 2′,4,4′,6′-Tetrahydroxychalcone
89625.035
C15H12O5
272.0685
[M + H]+
273.0769
Chalcones
Neohesperidin
88453.066
C28H34O15
610.1898
[M−H]-
609.182
Flavanones
Quercetin-3-O-(6′'-O-p-Coumaroyl)glucoside
87003.509
C30H26O14
610.1323
[M + H]+
611.1382
Flavonols
3.2 TFSc ameliorated colon and liver injury in mice with DSS-induced UC
Mice in the UC group experienced dramatic weight loss during days 10–13 (Fig. 2b). TFSc (39.02 and 19.51 mg/kg) inhibited weight loss in mice (Fig. 2b). Unexpectedly, TFSc significantly decreased the DAI scores on day 3 (Fig. 2e). However, on day 13, TFSc only demonstrated a statistically insignificant reduction in DAI scores, suggesting that the animals were already in the recovery phase of UC. DSS significantly shortened the colon length compared to that in the control animals (P < 0.01) (Fig. 2d). TFSc (39.02 and 19.51 mg/kg) improved the colon length. To preliminarily examine the effects of TFSc on the major organs of mice with UC, we measured the organ indices in each group of mice. TFSc (39.02 and 19.51 mg/kg) decreased the heart index of mice with UC, and 19.51 mg/kg TFSc also significantly decreased the liver index. TFSc showed some improvement in the immune organs (spleen and thymus), but the difference was not statistically significant. Moreover, improvements were also seen in the lung and kidney (Fig. 2c).
HE staining revealed that the mucosal, submucosal, muscular, and outer membranes of the colon were disrupted and infiltrated with inflammatory cells in mice with UC (Fig. 3). TFSc (39.02 and 19.51 mg/kg) reduced colonic tissue damage and inflammatory cell infiltration, as well as the colon TDI score (P < 0.05) (Fig. 3). In addition, cellular enlargement, cytoplasmic vacuolation, narrowing of the hepatic sinusoids, and slight inflammatory infiltrates were observed in mice with UC. This is consistent with the literature reporting that UC causes liver damage (Guan et al., 2022). TFSc improved the aforementioned pathological changes and decreased the liver TDI scores. These results indicate that TFSc ameliorated both colon and liver injuries in mice with UC.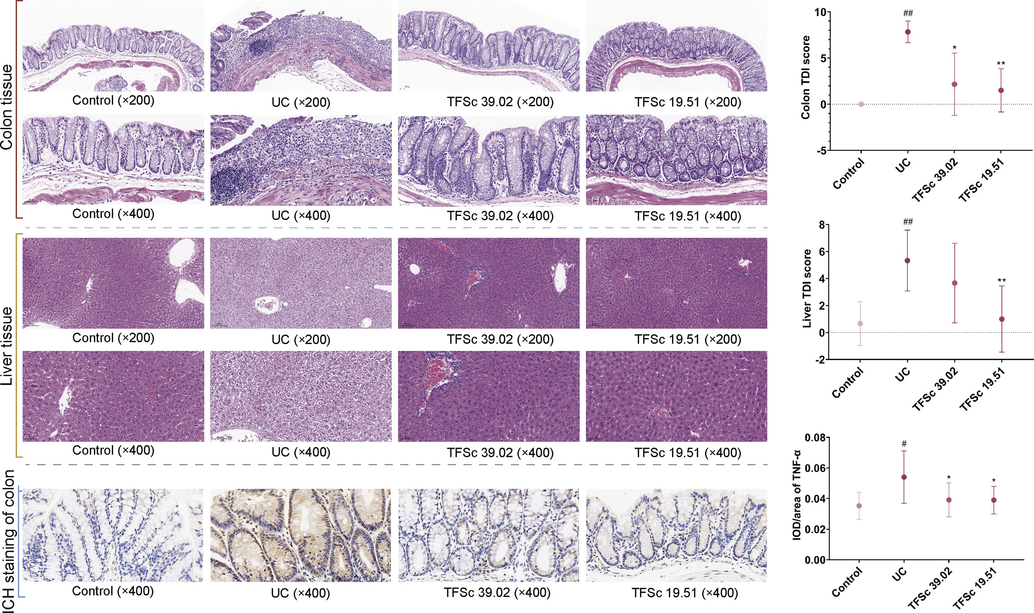
Representative HE and IHC histological sections, TDI scores of colons and livers (200 × and 400 × magnification), and the integrated optical density (IOD)/area values of TNF-α in the colons (400 × magnification). Data are presented as mean ± SD (n = 6 per group). #P < 0.05 vs. the control group, ##P < 0.01 vs. the control group, *P < 0.05 vs. the UC group, **P < 0.01 vs. the UC group.
3.3 TFSc decreased the levels of TNF-α in the colon tissues in mice with UC
After induction by DSS, the levels of TNF-α in the mouse colon increased significantly (P ≤ 0.05), indicating the presence of immunoinflammatory injury in the mouse colon tissues. After treatment with TFSc, the levels of TNF-α in the colon of the animals reduced significantly, indicating that TFSc has a favorable anti-inflammatory protective effect on mice with UC (Fig. 3).
3.4 TFSc regulated gut microbiota dysbiosis in mice with UC
16S rRNA gene sequencing demonstrated that DSS treatment reduced the Chao1 (Fig. 4a), Simpson (Fig. 4b), and Shannon (Fig. 4c) indices. The TFSc dose of 39.02 mg/kg increased the Simpson and Shannon indices, suggesting recovery of intestinal microbial richness and diversity. However, the 19.51 mg/kg TFSc dose had less effect on intestinal microbial richness and diversity. Furthermore, PCoA plot of the groups revealed that the control, UC, and TFSc-treated groups were distributed across different spatial regions (Fig. 4d). The Venn graph and number of taxa in the gut microbiota are shown in Fig. 4e. These results suggest that TFSc modulates the diversity and relative abundance of intestinal flora in mice with UC.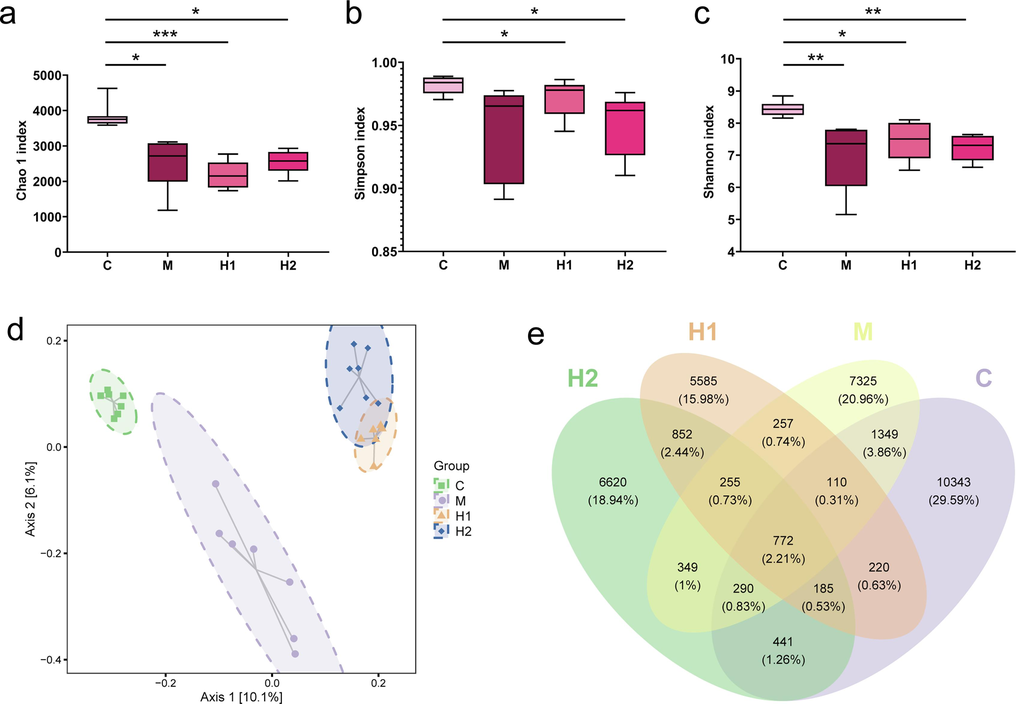
Total flavonoids of Sargentodoxa cuneata (TFSc) affected the intestinal flora in mice with UC. (a) chao1 index. (b) Simpson index. (b) Shannon index. (d) PCoA analysis results of control group (C), UC group (M), and high- (H1) and low-dose (H2) TFSc groups. (e) The Venn graph. (n = 7 per group). *P < 0.05 vs. the control group, **P < 0.01 vs. the control group, and ***P < 0.001 vs. the control group.
The heatmap shows that the flora significantly altered by TFSc intervention primarily included Anaeroplasma, Turicibacter, Parabacteroides, Anaerotruncus, Mucispirillum, Corynebacterium, Odoribacter, Staphylococcus, Akkermansia, Streptococcus, Shigella, Proteus, Prevotella, and Lactobacillus (Fig. 5a). Fig. 5b and c show the bar plots of the gut microbiota at family and genus levels, respectively. TFSc significantly affected abundance of Bacteroides, Shigella, Allobaculum, Lactobacillus, Ruminococcus, Prevotella, and [Prevotella] at the genus level.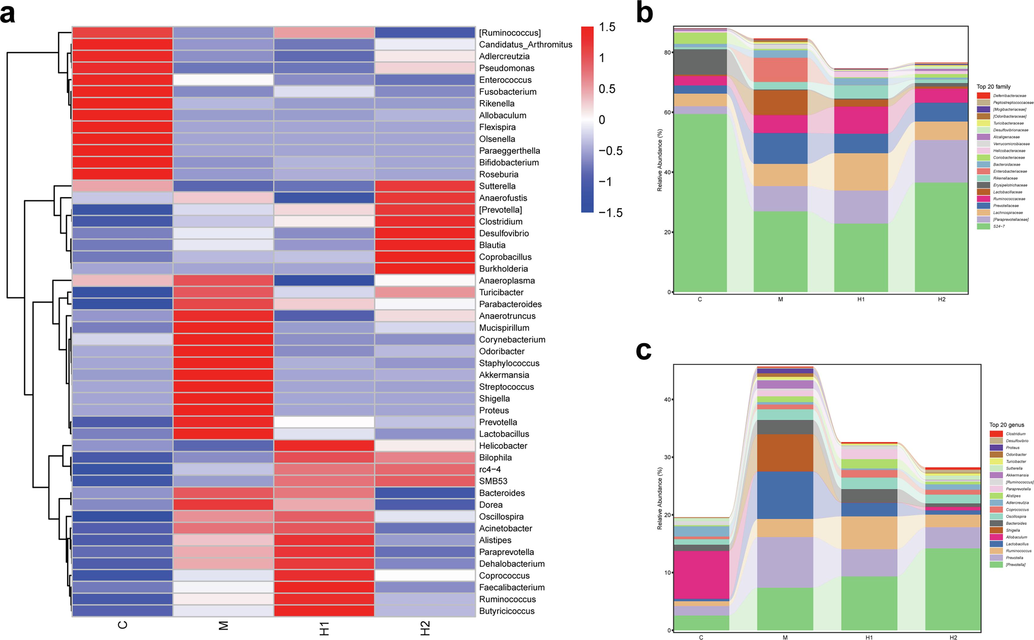
Total flavonoids of Sargentodoxa cuneata (TFSc) affected the relative abundance of intestinal flora in mice with UC. (a) The heatmap analysis. (b, c) The relative abundance of intestinal flora at the family and genus levels. The control group: C, UC group: M, high-dose TFSc group (H1), and low-dose TFSc group (H2) (n = 7 per group).
Furthermore, LEfSe analysis was used to determine the differential intestinal flora in each group. A total of 81 taxa were identified from phylum to genus, including 25 taxa in the control group, 26 in the UC group, 11 in the high-dose TFSc group, and 19 in the low-dose TFSc group (Fig. 6). Differential flora in the 39.02 mg/kg TFSc group included Dehalobacterium, Peptococcaceae, Epsilonproteobacteria, Helicobacteraceae, Campylobacterales, Faecalibacterium, Rikenellaceae, Ruminococcus, Clostridiales, Clostridia, and Dehalobacteriaceae. Differential flora in the 19.51 mg/kg TFSc group included [Paraprevotellaceae], Alphaproteobacteria, RF32, YS2, 4C0d_2, Erysipelotrichaceae, Clostridium, Peptostreptococcaceae, rc4_4, Desulfovibrio, Sutterella, Alcaligenaceae, Desulfovibrionales, Desulfovibrionaceae, Deltaproteobacteria, Betaproteobacteria, Burkholderiales, RF3, ML615J_28, and [Prevotella] (Fig. 6b).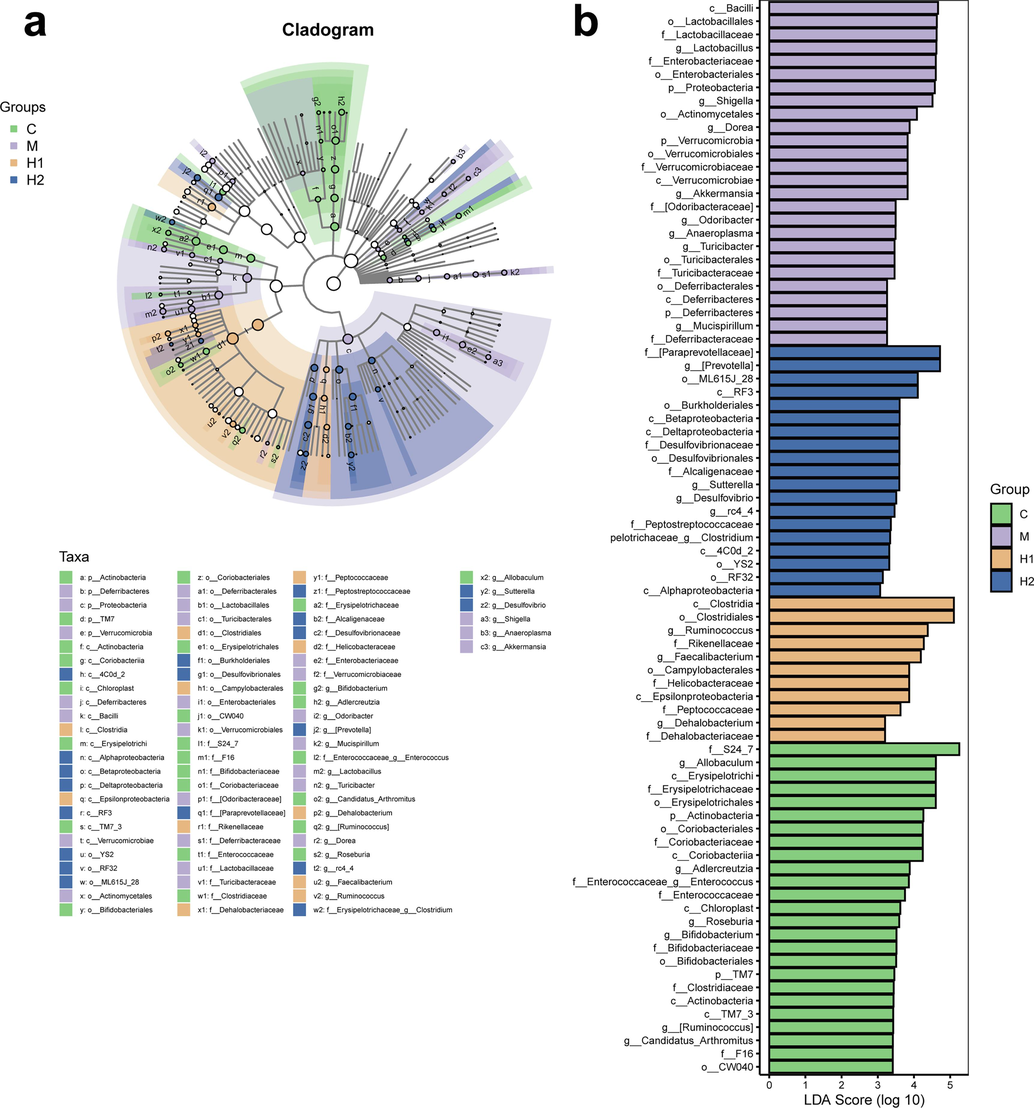
The results of LEfSe analysis. (a) The cladogram results. (b) The LDA score (log 10) of each group. The control group: C, UC group: M, high-dose TFSc group (H1), and low-dose TFSc group (H2) (n = 7 per group).
3.5 TFSc affected the levels of SCFAs and organic acids, and results of Spearman’s correlation analysis
Compared to the control group, isobutyric acid, ethylmethylacetic acid, and succinic acid levels were reduced (P < 0.01), while malonic acid levels were increased in mice with UC (P < 0.05). The 39.02 mg/kg TFSc group demonstrated increased levels of isocaproic acid, 3-hydroxyisovaleric acid, and glutaric acid levels (P < 0.05) in the intestines. The 19.51 mg/kg TFSc group exhibited significantly increased levels of isobutyric acid and ethylmethylacetic acid (P < 0.01). Further, TFSc (39.02 and 19.51 mg/kg) significantly decreased the levels of malonic acid and succinic acid (P < 0.05) in the intestinal contents (Fig. 7).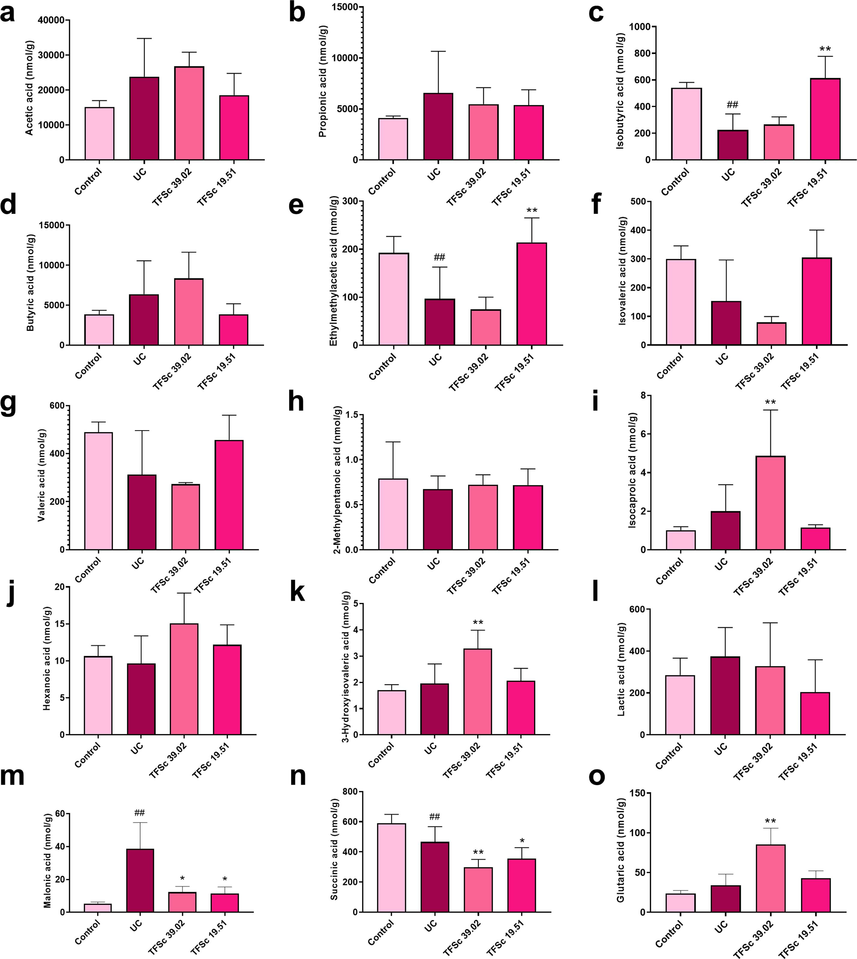
Total flavonoids of Sargentodoxa cuneata (TFSc) affected the levels of SCFAs and few organic acids in the intestinal contents in mice with UC. The data are represented as mean ± SD (n = 6–7 per group). #P < 0.05 vs. the control group, ##P < 0.01 vs. the control group, *P < 0.05 vs. the UC group, **P < 0.01 vs. the UC group.
Moreover, a significant correlation of intestinal flora with differential SCFAs and organic acids was observed in each group at family (Fig. 8a, c, e) and genus levels (Fig. 8b, d, f). Spearman’s correlation analysis suggested that malonic acid, valeric acid, ethylmethylacetic acid, and isobutyric acid were associated with different gut flora (Fig. 8a, b). Succinic acid, hexanoic acid, glutaric acid, 3-hydroxyisovaleric acid, and isocaproic acid in high-dose TFSc group were associated with Bifidobacteriaceae, Peptococcaceae, Helicobacteraceae, Corynebacteriaceae, [Odoribacteraceae], Deferribacteraceae, Anaeroplasmataceae, Bifidobacterium, Proteus, Candidatus_Arthromitus, Anaeroplasma, Corynebacterium, Odoribacter, Rikenella, and Mucispirillum (Fig. 8c, d). Differential SCFAs and organic acids in the low-dose TFSc group were also found to be strongly associated with the intestinal flora (Fig. 8e, f).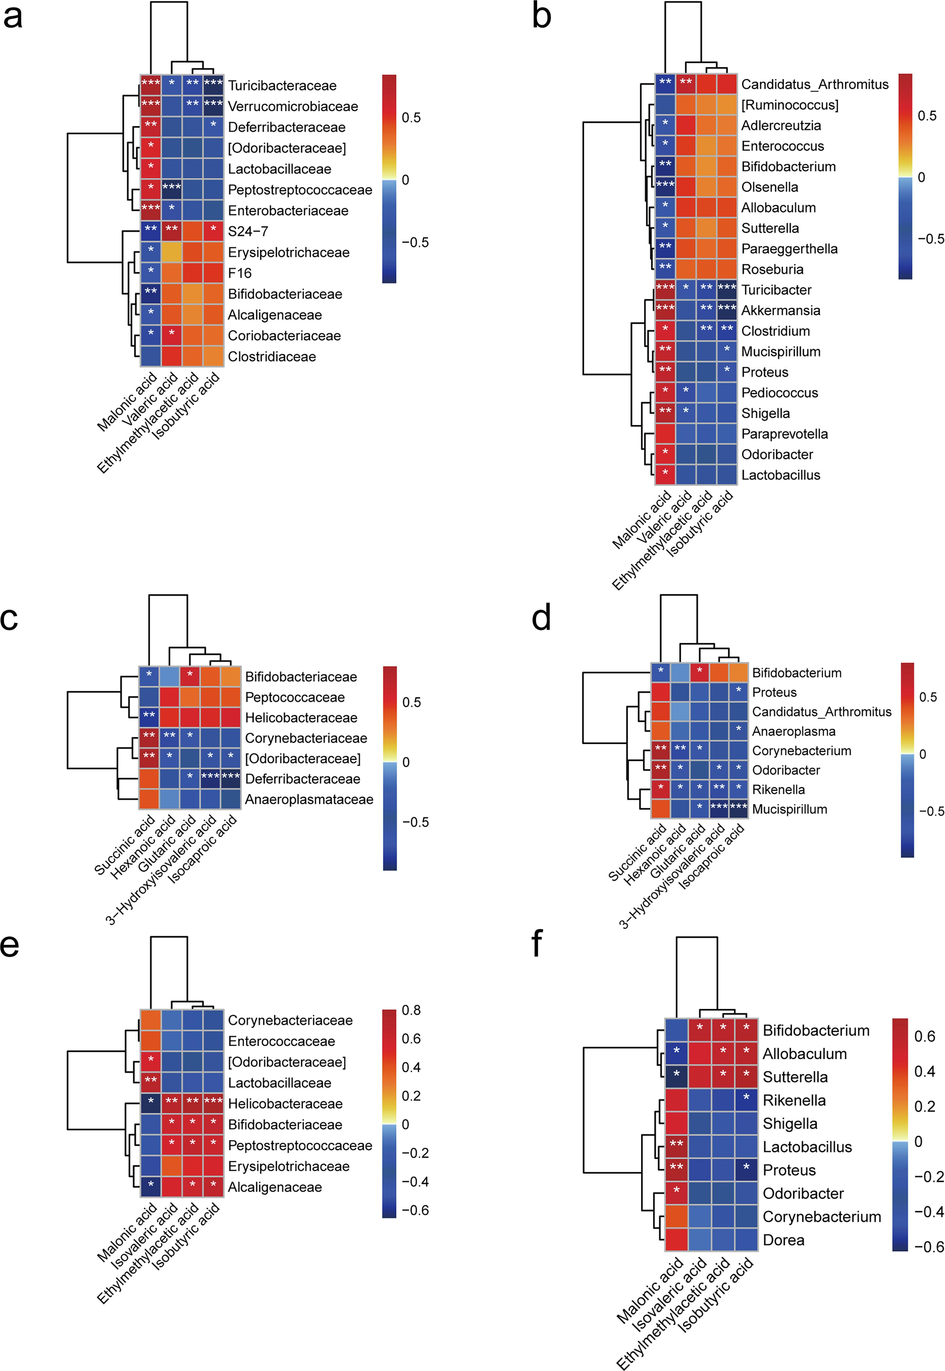
Correlation analysis results. (a, b) The correlation analysis between the intestinal flora and SCFAs and few organic acids levels in the UC group at the family and genus levels. (c, d) The correlation analysis between the intestinal flora and SCFAs and few organic acids levels in the high-dose TFSc group at the family and genus levels. (e, f) The correlation analysis between the intestinal flora and SCFAs and few organic acids levels in the low-dose TFSc group at the family and genus levels. Significant differences were indicated at *P < 0.05, **P < 0.01 and ***P < 0.001.
Comparing the results of high- and low-dose TFSc groups (Fig. 8) demonstrated that TFSc exerts ameliorative effects on colon and liver injuries by modulating Bifidobacteriaceae, Helicobacteraceae, Corynebacteriaceae, [Odoribacteraceae], Bifidobacterium, Proteus, Corynebacterium, Odoribacter, and Rikenella, thereby affecting SCFAs and organic acids.
4 Discussion
UC is a serious threat to human health and is accompanied by economic and psychological burden, which affects their long-term quality of survival (Ghosh et al., 2021). UC also causes liver injury, arthritis, skin and mucous membrane diseases, intestinal perforation, toxic megacolon, intestinal obstruction, colorectal cancer and other complications that pose serious threats to human health (Eder et al., 2023). UC is related to genetics, diet, immuno-inflammation, and intestinal flora; and intestinal flora is an important factor in the development of UC (Huang et al., 2023). Total flavonoids have been proved to be one of the main active components in Chinese herbs used to treat UC (Li et al., 2022a), which guides the direction of identifying the effective site of Sargentodoxa cuneata for the treatment of UC. In this study, we found that TFSc significantly ameliorated weight loss, reduced DAI score, improved colon length in mice induced by DSS, and significantly reduced cardiac and hepatic indices, suggesting that TFSc has a favorable protective effect on mice with UC. It can also be deduced that TFSc may be used to provide protection against liver and heart injuries. Furthermore, the results of HE staining showed that TFSc had a good ameliorating effect on both colon and liver injuries in mice with UC. TFSc also decreased the TNF-α levels in colon tissues. Notably, our study found that the gut microbiota is an important pathway through which TFSc improves colon and liver damage in mice with UC. Spearman’s correlation analysis revealed that SCFAs and few organic acids may be the direct performers of TFSc in regulating the intestinal flora for treatment of UC.
The human gut is richly colonized by microorganisms that are important for maintaining the integrity of gastrointestinal mucosa, homeostasis of immune system, and regulation of host energy metabolism (Lavelle and Sokol, 2020). Clinical disorders of the intestinal flora have been identified in the intestines of patients with UC and are characterized by a reduction in beneficial bacteria and an increase in pathogenic bacteria (Schierová et al., 2020). Mucus and mucin secreted by the intestinal flora together form a mucus layer on the surface of intestinal epithelial cells (Fang et al., 2021). Dysbiosis of the gut microflora can lead to inflammation and abnormal intestinal function, with the intestinal mucosal barrier being the primary challenge (van der Post et al., 2019). A compromised intestinal mucosal barrier will not be able to block the translocation of intestinal parasitic flora and their toxins to tissues and organs outside the intestinal lumen, leading to the exposure of the organism to endogenous microorganisms and their toxins (Philips et al., 2020). Liver, the largest detoxification organ in an organism, is damaged when endotoxin levels are too high (Liu et al., 2020). It has been found that intestinal flora is also closely associated with liver injury, and the gut–liver axis is a crucial pathway for UC treatment (Li et al., 2022b). In the present study, we found that TFSc ameliorated both colon and liver injuries in mice with UC. Moreover, a good protective effect of TFSc on the structural integrity of colonic mucosa was observed in HE staining, suggesting that intestinal flora mediate the amelioration of colon and liver injuries in mice with UC.
Changes in the relative abundance and diversity of the intestinal flora can reflect to some extent the effect of drugs on the intestinal flora (Niu et al., 2022). Simpson and Shannon indices, PCoA analysis, Venn graph, heatmap, and relative abundance analysis showed that TFSc had a modulating effect on the intestinal flora of mice with UC. As shown in Fig. 5b, TFSc ameliorated the changes in the relative abundance of S24-7, Prevotellaceae, [Odoribacteraceae], Enterobacteriaceae, Bacteroidaceae, Coriobacteriaceae, Helicobacteraceae, Verrucomicrobiaceae, Turicibacteraceae, and Deferribacteraceae. In addition, TFSc increased the relative abundance of [Paraprevotellaceae], Lachnospiraceae, and Ruminococcaceae.
As shown in Fig. 5c, TFSc ameliorated the changes in the relative abundance of Prevotella, Lactobacillus, Shigella, Bacteroides, Adlercreutzia, [Ruminococcus], Akkermansia, Turicibacter, Odoribacter, and Proteus. Moreover, TFSc increased the relative abundance of [Prevotella], Ruminococcus, Coprococcus, Alistipes, and Clostridium. TFSc increased the relative abundance of beneficial bacteria Coriobacteriaceae (Pittayanon et al., 2020), Adlercreutzia (Galipeau et al., 2021), [Ruminococcus] (Xu et al., 2021), [Prevotella] (Jiang et al., 2023), Coprococcus (Xu et al., 2021), Alistipes (Yuan et al., 2020), and Clostridium (Ma et al., 2022); and decreased the relative abundance of pathogenic bacteria Enterobacteriaceae (Dong et al., 2022), Turicibacteraceae (He et al., 2022), Deferribacteraceae (Yu et al., 2023a), Shigella (Jialing et al., 2020), and Turicibacter (Dong et al., 2022). Lefse analysis is commonly used to identify differential marker flora, which facilitates the understanding of drug modulation in the gut flora (Zhao et al., 2023). After TFSc modulation, mice with UC showed a differential flora of both beneficial and pathogenic bacteria, suggesting that these may be the primary intestinal flora of TFSc against UC, which could be the focus of future in-depth studies.
Both SCFAs and organic acids are metabolites of the intestinal flora. Among these, SCFAs are valuable for maintaining the intestinal immune microenvironment and mucosal barrier (Kaczmarczyk et al., 2021, Kotla and Rochev, 2023). Modern research has shown that high levels of SCFAs have a positive effect on the treatment of UC (Li et al., 2022c). Organic acids in the intestinal microenvironment of healthy humans are also maintained in a relatively stable range, and an excess of harmful organic acids can take their toll on the intestine (Cao et al., 2022). We found a significant decrease in the levels of isobutyric acid, ethylmethylacetic acid, and succinic acid, which is consistent with previous reports (Zhang et al., 2022). However, there was a significant increase in malonic acid levels. Notably, TFSc corrected these changes in the intestinal contents. Furthermore, high-dose (39.02 mg/kg) TFSc increased the levels of 3-hydroxyisovaleric acid and glutaric acid. Glutamic acid can be metabolized from amino acids such as lysine and tryptophan (Bernstein et al., 2020). This suggests that TFSc plays a regulatory role in amino acid metabolism.
Interestingly, using a correlation analysis, we identified the intestinal flora associated with differential SCFAs and organic acids. Bifidobacteriaceae, Helicobacteraceae, Corynebacteriaceae, [Odoribacteraceae], Bifidobacterium, Proteus, Corynebacterium, Odoribacter, and Rikenella were the same groups of bacteria associated with differential SCFAs or organic acids in the high- and low-dose TFSc groups. Bifidobacteriaceae have been reported as SCFA-producing intestinal flora (Lee et al., 2020), However, whether other analyzed flora are SCFA-producing has not been reported in the literature, and further studies are needed.
Our study had a few limitations that need consideration. First, the effect of TFSc on the intestinal mucosal barrier was illustrated only by HE-stained sections and no directly related proteins were tested for validation. Second, the effect of TFSc on the intestinal flora of mice with UC was studied only up to the genus level and not specifically which bacteria were altered, which can be addressed in later studies. Finally, no evidence was provided regarding whether TFSc affected other metabolites in the gut flora and further studies are needed.
5 Conclusion
TFSc has a beneficial effect on colon and liver injuries in mice with UC. Its associated pharmacological mechanism of action may be related to correcting intestinal flora disorders, elevating the levels of SCFAs (isocaproic acid, 3-hydroxyisovaleric acid, isobutyric acid, and ethylmethylacetic acid), lowering the levels of organic acids (malonic acid and succinic acid), and protecting the integrity of the intestinal mucosa. TFSc may affect SCFAs and organic acid levels by regulating Bifidobacteriaceae, Helicobacteraceae, Corynebacteriaceae, [Odoribacteraceae], Bifidobacterium, Proteus, Corynebacterium, Odoribacter, and Rikenella, which in turn protects the intestinal mucosal barrier (Fig. 9).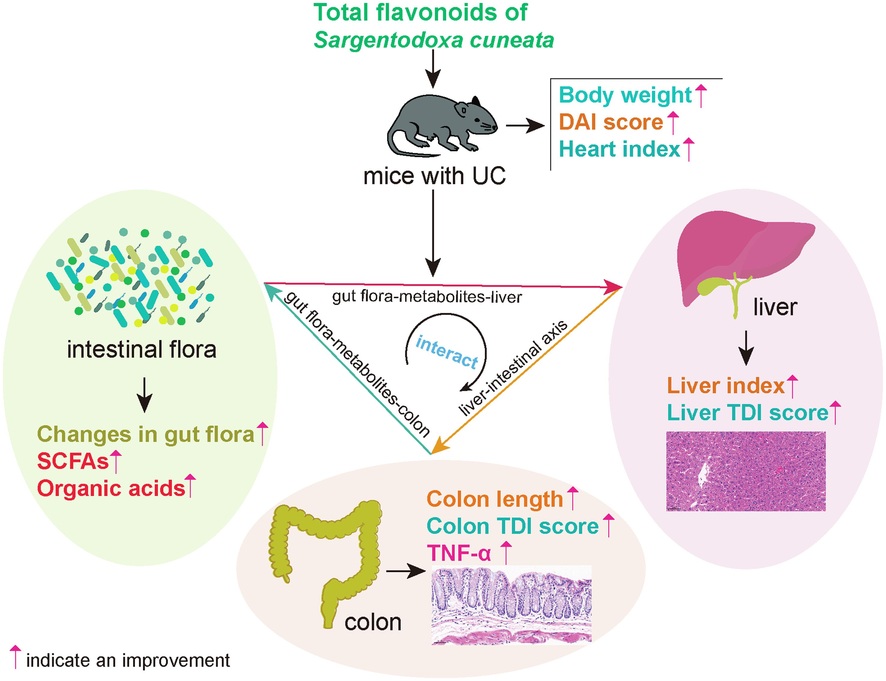
The potential mechanisms of total flavonoids of Sargentodoxa cuneata (TFSc) against UC.
CRediT authorship contribution statement
Feng Xu: Writing – original draft, Funding acquisition, Validation, Investigation, Methodology, Supervision, Conceptualization, Writing – review & editing. Piao Yu: Investigation. Hongmei Wu: Methodology, Supervision. Xiangpei Wang: Methodology, Supervision. Mei Liu: Investigation. Hongyun Liu: Investigation. Qian Zeng: Investigation. Dengli Wu: Investigation.
Acknowledgments
We would like to thank grants from Guizhou Provincial Basic Research Program (Natural Science) (Qian Kehe Foundation ZK [2022] General 497), Guizhou University of Traditional Chinese Medicine 2021 National Natural Science Foundation of China Post-subsidy Fund Scientific Research Innovation Exploration Special Project (2018YFC170810-505), and the Scholarship Fund from the China Scholarship Council (No. 202208520056).
Declaration of competing interest
The authors declare that they have no known competing financial interests or personal relationships that could have appeared to influence the work reported in this paper.
References
- Inconsistencies in the nutrition management of glutaric aciduria type 1: An international survey. Nutrients. 2020;12:3162.
- [Google Scholar]
- Impact of Lycium barbarum arabinogalactan on the fecal metabolome in a DSS-induced chronic colitis mouse model. Food Funct.. 2022;13:8703-8716.
- [Google Scholar]
- Comparison of effects of aminosalicylic acid, glucocorticoids and immunosuppressive agents on the expression of multidrug-resistant genes in ulcerative colitis. Sci. Rep.. 2022;12:20656.
- [Google Scholar]
- Gut microbiota, bile acids, and nature compounds. Phytother. Res.. 2022;36:3102-3119.
- [Google Scholar]
- Interactions between gut microbiota and polyphenols: A mechanistic and metabolomic review. Phytomedicine. 2023;154979
- [Google Scholar]
- What does disease progression look like in ulcerative colitis, and how might it be prevented? Gastroenterology. 2022;162:1396-1408.
- [Google Scholar]
- Anti-inflammatory effect of Rhein on ulcerative colitis via inhibiting PI3K/Akt/mTOR signaling pathway and regulating gut microbiota. Phytother. Res.. 2022;36:2081-2094.
- [Google Scholar]
- Guidelines for the management of ulcerative colitis. Recommendations of the Polish Society of Gastroenterology and the Polish National Consultant in Gastroenterology. Gastroenterol. Rev./przegląd Gastroenterologiczny. 2023;18
- [Google Scholar]
- Slimy partners: The mucus barrier and gut microbiome in ulcerative colitis. Exp. Mol. Med.. 2021;53:772-787.
- [Google Scholar]
- Novel fecal biomarkers that precede clinical diagnosis of ulcerative colitis. Gastroenterology. 2021;160:1532-1545.
- [Google Scholar]
- Upadacitinib treatment improves symptoms of bowel urgency and abdominal pain, and correlates with quality of life improvements in patients with moderate to severe ulcerative colitis. J. Crohns Colitis. 2021;15:2022-2030.
- [Google Scholar]
- Andrographolide sodium bisulfite ameliorates dextran sulfate sodium-induced colitis and liver injury in mice via inhibiting macrophage proinflammatory polarization from the gut-liver axis. Int Immunopharmacol. 2022;110:109007
- [Google Scholar]
- Orally administered diosgenin alleviates colitis in mice induced by dextran sulfate sodium through gut microbiota modulation and short-chain fatty acid generation. J. Med. Food. 2022;25:261-271.
- [Google Scholar]
- Probiotics for the treatment of ulcerative colitis: a review of experimental research from 2018 to 2022. Front. Microbiol.. 2023;14
- [Google Scholar]
- Changes in serum inflammatory cytokine levels and intestinal flora in a self-healing dextran sodium sulfate-induced ulcerative colitis murine model. Life Sci.. 2020;263:118587
- [Google Scholar]
- Tamarind seed polysaccharide hydrolysate ameliorates dextran sulfate sodium-induced ulcerative colitis via regulating the gut microbiota. Pharmaceuticals. 2023;16:1133.
- [Google Scholar]
- Fecal levels of lactic, succinic and short-chain fatty acids in patients with ulcerative colitis and crohn disease: A pilot study. J. Clin. Med.. 2021;10:4701.
- [Google Scholar]
- IBD disease-modifying therapies: insights from emerging therapeutics. Trends Mol. Med. 2023
- [Google Scholar]
- Lai, S., 2019. Study on the chemical constituents of Sargentodoxa cuneata and Helvella leucopus 硕士, Shanxi Normal Universty.
- Gut microbiota-derived metabolites as key actors in inflammatory bowel disease. Nat. Rev. Gastroenterol. Hepatol.. 2020;17:223-237.
- [Google Scholar]
- Gut microbiota–derived short-chain fatty acids promote poststroke recovery in aged mice. Circ. Res.. 2020;127:453-465.
- [Google Scholar]
- Live Lactobacillus acidophilus alleviates ulcerative colitis via the SCFAs/mitophagy/NLRP3 inflammasome axis. Food Funct.. 2022;13:2985-2997.
- [Google Scholar]
- Lonicera rupicola Hook. f. et Thoms flavonoids ameliorated dysregulated inflammatory responses, intestinal barrier, and gut microbiome in ulcerative colitis via PI3K/AKT pathway. Phytomedicine. 2022;104:154284
- [Google Scholar]
- Sanhuang xiexin decoction ameliorates secondary liver injury in DSS-induced colitis involve regulating inflammation and bile acid metabolism. J. Ethnopharmacol.. 2022;299:115682
- [Google Scholar]
- β-patchoulene simultaneously ameliorated dextran sulfate sodium-induced colitis and secondary liver injury in mice via suppressing colonic leakage and flora imbalance. Biochem. Pharmacol.. 2020;182:114260
- [Google Scholar]
- Potential activity of traditional Chinese medicine against ulcerative colitis: a review. J. Ethnopharmacol.. 2022;289:115084
- [Google Scholar]
- Clostridium butyricum and its derived extracellular vesicles modulate gut homeostasis and ameliorate acute experimental colitis. Microbiol. Spectrum. 2022;10:e01368.
- [Google Scholar]
- The combination of sodium alginate and chlorogenic acid enhances the therapeutic effect on ulcerative colitis by the regulation of inflammation and the intestinal flora. Food Funct.. 2022;13:10710-10723.
- [Google Scholar]
- Modulating the intestinal microbiota: therapeutic opportunities in liver disease. J. Clin. Transl. Hepatol.. 2020;8:87.
- [Google Scholar]
- Differences in gut microbiota in patients with vs without inflammatory bowel diseases: a systematic review. Gastroenterology. 2020;158(930–946):e931.
- [Google Scholar]
- Gut microbiome changes in patients with active left-sided ulcerative colitis after fecal microbiome transplantation and topical 5-aminosalicylic acid therapy. Cells. 2020;9:2283.
- [Google Scholar]
- Microbiome and metabolome in inflammatory bowel disease. J. Gastroenterol. Hepatol.. 2023;38:34-43.
- [CrossRef] [Google Scholar]
- Structural weakening of the colonic mucus barrier is an early event in ulcerative colitis pathogenesis. Gut. 2019;68:2142-2151.
- [Google Scholar]
- Traditional Chinese Medicine: a promising strategy to regulate the imbalance of bacterial flora, impaired intestinal barrier and immune function attributed to ulcerative colitis through intestinal microecology. J. Ethnopharmacol.. 2023;318:116879
- [CrossRef] [Google Scholar]
- The traditional herb Sargentodoxa cuneata alleviates DSS-induced colitis by attenuating epithelial barrier damage via blocking necroptotic signaling. J. Ethnopharmacol.. 2023;117373
- [Google Scholar]
- Changes in intestinal microbiota and correlation with TLRs in ulcerative colitis in the coastal area of northern China. Microb. Pathog.. 2021;150:104707
- [Google Scholar]
- The role and mechanism of flavonoid herbal natural products in ulcerative colitis. Biomed Pharmacother. 2023;158:114086
- [CrossRef] [Google Scholar]
- ARF1 maintains intestinal homeostasis by modulating gut microbiota and stem cell function. Life Sci.. 2023;328:121902
- [Google Scholar]
- Anti-Ulcerative Colitis Effects and Active Ingredients in Ethyl Acetate Extract from Decoction of Sargentodoxa cuneata. Molecules. 2023;28:7663.
- [Google Scholar]
- Therapeutic effect of n-butanol fraction of Huang-lian-Jie-du Decoction on ulcerative colitis and its regulation on intestinal flora in colitis mice. Biomed. Pharmacother.. 2020;121:109638
- [Google Scholar]
- Chemical constituents from ethyl acetate extract of Sargentodoxa cuneata rattans. J Chinese Med. Mater.. 2022;45:1114-1118.
- [Google Scholar]
- Recent advances in chemistry and bioactivity of Sargentodoxa cuneata. J. Ethnopharmacol.. 2021;270:113840
- [Google Scholar]
- Regulatory role of short-chain fatty acids in inflammatory bowel disease. Cell Commun. Signal.. 2022;20:1-10.
- [Google Scholar]
- Arecoline aggravates acute ulcerative colitis in mice by affecting intestinal microbiota and serum metabolites. Front. Immunol.. 2023;14
- [Google Scholar]
Appendix A
Supplementary data
Supplementary data to this article can be found online at https://doi.org/10.1016/j.arabjc.2023.105566.
Appendix A
Supplementary data
The following are the Supplementary data to this article:Supplementary data 1
Supplementary data 1


