

Translate this page into:
Thermodynamic study for the (butyl, hexyl and octyl) acetoacetate under high pressure CO2
⁎Corresponding author. hsbyun@jnu.ac.kr (Hun-Soo Byun)
-
Received: ,
Accepted: ,
This article was originally published by Elsevier and was migrated to Scientific Scholar after the change of Publisher.
Peer review under responsibility of King Saud University.
Abstract
Understanding the phase behavior of binary liquid mixtures containing butyl acetoacetate, hexyl acetoacetate, and octyl acetoacetate under high-pressure supercritical CO2 (sc-CO2) is essential for several applications. The solubility curves for these binary mixtures have been investigated at different temperature and pressure ranges, specifically between 313.2 K and 393.2 K and 2.39 MPa to 23.83 MPa. The three systems, namely butyl acetoacetate, hexyl acetoacetate, and octyl acetoacetate in high-pressure sc-CO2, exhibit critical mixture curves and a maximum in pressure–temperature (P, T) diagrams between the critical point of butyl acetoacetate/hexyl acetoacetate/octyl acetoacetate and carbon dioxide. These characteristics of the critical mixture plot fall under the category of type-I behavior.
The Peng-Robinson equation, which utilizes van der Waals mixing rules and two interaction parameters, is employed to correlate experimental solubility curves and critical mixture curves of the aforementioned three systems. The root mean square deviation percentage (RMSD%) is calculated at each temperature (using temperature-dependent adjusted parameters) for the butyl acetoacetate + sc-CO2, hexyl acetoacetate + sc-CO2, and octyl acetoacetate + sc-CO2 systems, and it ranges from 3.11% to 5.92%, 2.09% to 3.97%, and 1.70% to 3.02%, respectively.
Keywords
Butyl acetoacetate
High pressure
Hexyl acetoacetate
Octyl acetoacetate
Phase behavior
Supercritical CO2

1 Introduction
An environmentally friendly chemical industrial technology that consumes lesser energy and produces fewer toxic residues is highly sought after (Tsoka et al., 2004; Bolm et al., 1999). One promising approach to achieving this is the use of high-pressure processing in combination with supercritical fluids (SCFs). The use of SCFs in chemical industries has been increasing since the early 1980 s due to their sustainability and environmental friendliness (Khalil, 2019; Ramsey et al., 2009; Wagare et al., 2021; Knez et al., 2014). SCFs are becoming increasingly popular as green solvents because they are potentially more affordable, non-toxic, non-flammable, and sustainable than conventional organic solvents that are harmful to the environment (Manjare and Dhingra, 2019; Calvo-Flores et al., 2018). Supercritical fluid technology has a broad scope of applications, such as separation techniques, reaction mediums, synthesis of new materials, powder formation, processing of oils and fats, thin film deposition, and more (Braga et al., 2023; Preetam et al., 2023; Liu et al., 2022; Liang et al., 2023; Agregán et al., 2023; Senyay-Oncel et al., 2023; Tran and Park, 2021; López-Hortas et al., 2022; Li and Xu, 2019; Tsai and Wang, 2019). Butyl, hexyl, and octyl acetoacetates considered in present study are versatile compounds with industrial applications such as flavorings agents and fragrances (Braunschmid et al., 2021; PubChem, n.d.; butyl acetoacetate, n.d.). Hexyl and octyl acetoacetates are used as fuel lubricity additives (Anastopoulos et al., 2001). Hexyl acetoacetate is a chemical with potential uses in polymer formation and antibacterial applications. It can cross-link in polymers, react with other compounds, and exhibits antibacterial activity against E. coli and S. aureus (FH60066, 2023). It is used in the synthesis of various compounds, such as pharmaceuticals, fragrances, and food additives. Hexyl acetoacetates is also used as a solvent in the manufacture of paints, varnishes, and adhesives (Buy Hexyl acetoacetate, 2023). Octyl acetoacetate is a versatile chemical that can serve as a solvent in organic synthesis, a reactant for the synthesis of various compounds, and a reagent in laboratory experiments. Its applications extend to the synthesis of pharmaceuticals, food additives, and fragrances. Furthermore, it can be used as a starting material for polymer synthesis and in the study of the effects of different compounds on biochemical and physiological processes in organisms (Buy Octyl acetoacetate, 2023).
Supercritical fluids (SCFs) have the unique ability to solubilized a diverse array of chemicals, making them valuable solvents in various industrial processes. Among the different SCFs, supercritical carbon dioxide (sc-CO2) is widely used and studied (Yang et al., 2022; Tabernero et al., 2022). Byun's group, has processed several polymers/monomers in sc-CO2 and analyzed the resulting solubility data (Lee et al., 2023; Ghoderao et al., 2023; Ghoderao et al., 2023; Np Ghoderao et al., 2023). Additionally, another groups have provided experimental phase equilibrium data for various hydrocarbons and sc-CO2 mixtures (Gao et al., 2021; Gao et al., 2020; Li et al., 2019). Moreover, sc-CO2 has several other applications such as materials processing and synthesis (Zhang et al., 2014), precision cleaning technique (Kohli et al., 2019), microelectronics processing (Giles et al., 1998), hydrotreating, extraction, biomass pretreatment, conversion of waste heat into power, and sterilization of medical equipment (Okolie et al., 2022). High-pressure sc-CO2 has gained significant attention and importance in separation processes due to its unique properties and several advantages over traditional solvents. Here are some key points highlighting the importance of sc-CO2 in separation processes and its advantages: 1) Tunable Properties: The density and solvation power of sc-CO2 can be easily tuned by adjusting temperature and pressure, allowing it to be tailored for specific separation tasks. This tunability makes it versatile for a wide range of applications. 2) Environmentally Friendly: sc-CO2 is considered an environmentally friendly solvent because it is non-toxic, non-flammable, and readily available. It does not contribute to environmental pollution, making it a sustainable choice compared to many traditional organic solvents (Dhamodharan et al., 2023). 3) Low Critical Temperature: Sc-CO2 has a relatively low critical temperature and critical pressure, making it suitable for processing temperature-sensitive compounds that may degrade at higher temperatures (Girardi et al., 2023). 4) Reduced Energy Consumption: Operating near or above the critical point reduces the energy required for solvent recovery because sc-CO2 can be easily depressurized and recycled. This can lead to cost savings and improved process efficiency. 5) Minimized Environmental Impact: By reducing the use of hazardous organic solvents, sc-CO2 contributes to reducing the environmental footprint of separation processes, aligning with sustainability and regulatory goals. 6) Application Diversity: Sc-CO2 finds applications in various industries, including pharmaceuticals, food and beverage, cosmetics, petrochemicals, and more. Its versatility and compatibility with different compounds make it a valuable tool for separation processes across different sectors (Balbinot Filho et al., 2023; Sodeifian et al., 2023).
This study has explored the phase behavior of binary mixtures of butyl acetoacetate, hexyl acetoacetate, and octyl acetoacetate with sc-CO2 using high pressure apparatus. The experimental isotherms for all systems are presented in (P-x) space. For the butyl acetoacetate + sc-CO2 system, experimental isotherms (313.2 K ≤ T ≤ 393.2 K) were obtained in a pressure range of 3.04 MPa ≤ P ≤ 20.43 MPa, while the pressure and temperature range for hexyl acetoacetate + sc-CO2 and octyl acetoacetate + sc-CO2 systems were 2.69 MPa ≤ P ≤ 22.18 MPa and 2.39 MPa ≤ P ≤ 23.83 MPa. The critical mixture lines in (P-T) space confirm the type-I behavior exhibited by all binary mixes, meaning that a continuous critical line exists between the sc-CO2 critical point and the critical point of the other component (butyl acetoacetate or hexyl acetoacetate or octyl acetoacetate) and no liquid–liquid critical line exists.
Another part of this work is to correlate the obtained experimental isotherms with theoretical models. The cubic equations of state are widely used tools to estimate vapor–liquid equilibria and thermodynamic properties (Ghoderao et al., 2018; Ghoderao et al., 2019; Ghoderao et al., 2019; Kristanto et al., 2023). The Peng-Robinson (P-R) equation is a simple cubic equation of state that is accepted and used extensively for various applications (Bhawangirkar et al., 2018; Anil et al., 2022; Avula et al., 2015, 2016, 2017; Joshi et al., 2012). In this study, we have employed the P-R equation utilizing the van der Waals (vdW) mixing rule to predict experimental isotherms. The properties of indiviual pure component such as molecular weight, critical properties, boiling temperature, and acentric factor of carbon dioxide, butyl acetoacetate, hexyl acetoacetate, and octyl acetoacetate are given in Table 1. The pure component properties such as critical temperature, critical pressure, and acentric factor are obtained by Joback–Lyderson group contribution method (Reid et al., 1987). The chemical structures of butyl acetoacetate, hexyl acetoacetate, and octyl acetoacetate are depicted in Fig. 1.
Compounds
Mw
Chemical Structure
Tb / K
Tc / K
pc / MPa
ω
Carbon Dioxide
44.01
O = C = O
304.2
7.38
0.225
Butyl Acetoacetate
158.20
C8H14O3
478.2 a
653.9
2.72
0.665
Hexyl Acetoacetate
186.25
C10H18O3
512.2b
681.2
2.25
0.748
Octyl Acetoacetate
214.30
C12H22O3
531.2–532.2a
690.1
1.89
0.819
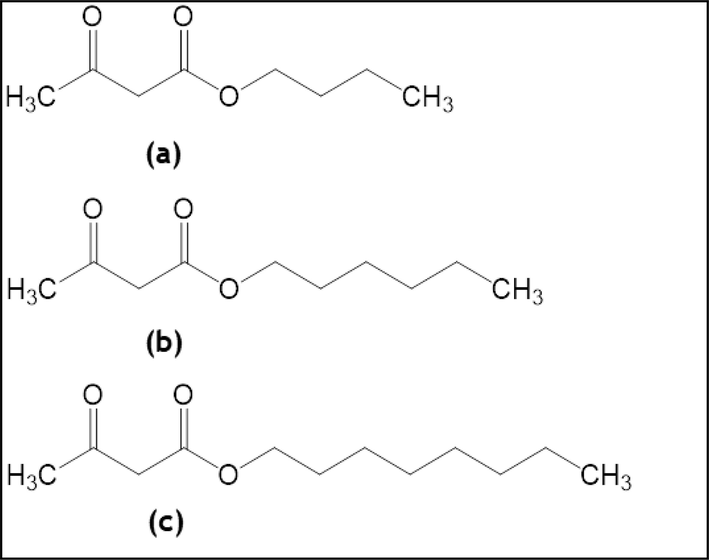
Chemical structure of (a) butyl acetoacetate (b) hexyl acetoacetate and (c) octyl acetoacetate.
2 Experimental section
2.1 Materials
Tokyo Chemical Industry Co supplied Butyl Acetoacetate (CAS RN 591-60-6), Hexyl Acetoacetate (CAS RN 13562-84-0), and Octyl Acetoacetate (CAS RN 16436-00-3) with purities greater than 0.98, 0.95, and 0.95, respectively. Deok Yang Gases Co supplied pure carbon dioxide with a purity of greater than 0.999. Table 2 presents detailed specifications of the compounds used. All substances were used in their original form.
Chemical Name
Source
Mass Fraction Puritya
Purification Method
Analysis Methoda
Carbon dioxide
Deok Yang Co.
>0.999
None
–
Butyl acetoacetate
Tokyo Chemical Industry Co.
>0.98
None
GCb
Hexyl acetoacetate
Tokyo Chemical Industry Co.
>0.95
None
GCb
Octyl acetoacetate
Tokyo Chemical Industry Co.
>0.95
None
GCb
3 Experimental apparatus and procedure
High-pressure instruments were utilized to measure the phase behavior, as discussed in previous studies (Baek and Byun, 2016). The detailed information regarding the procedures used to obtain the solubility curves in the described experiment as follows:
Equipment: The equipment used for obtaining solubility curves in this study includes:
High-Pressure Equipment (Fig. 2): The primary instrument used to measure phase behavior under high-pressure conditions is detailed below: (1) Pump Generator: A pump generator, specifically Model 37–5.75–60 (HIP), is employed in the setup. This pump generator is responsible for generating high-pressure conditions within the system. (2) Piston and Heise Gauge: The pump generator is connected to a piston with a diameter of 2.54 cm. The pressure generated by the piston movement is recorded using a Heise gauge, Model CM-53920 (Dresser Ind), with a standard uncertainty of 0.03 MPa. (3) View Cell: A flexible volume view cell is a crucial component of the setup. It has specific characteristics, including a volume capacity of 28 cm3 (inside diameter − 1.59 cm; outside diameter − 6.4 cm). This view cell is designed to withstand pressures up to 70 MPa. (4) Transparent Glass Window: To enable the observation of mixture phase transitions, a transparent glass window is attached to the front portion of the view cell. This window has a thickness of 1.9 cm and a diameter of 1.9 cm. (5) Camera and Monitor: A video monitor is used in conjunction with a camera connected to an Olympus Corp borescope (Model - F100-038–000-50) positioned against the glass window to observe the mixture.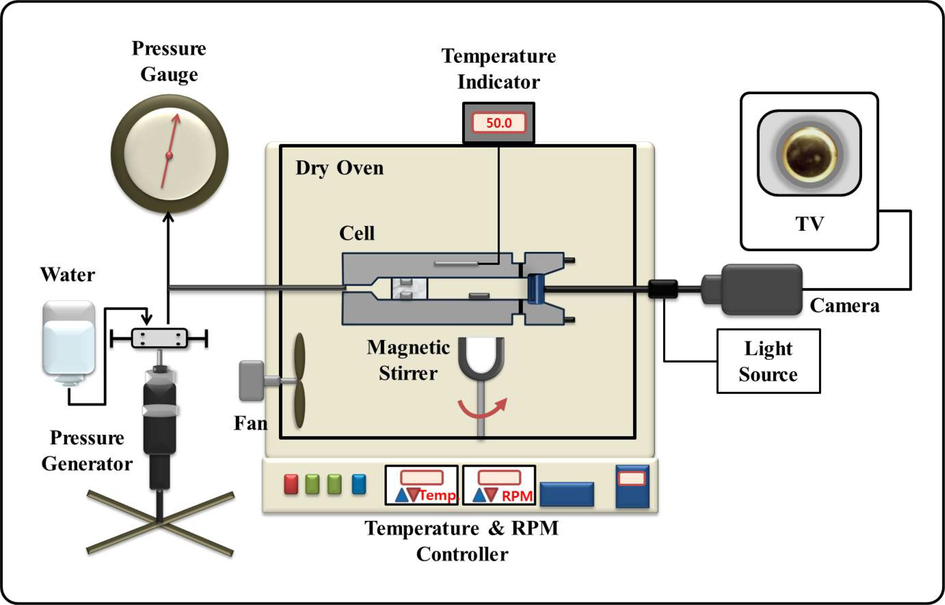
Schematic diagram of high-pressure apparatus.
The procedure for obtaining solubility curves involves the following steps: (1) Initial Purging: To eliminate any residual air and organic materials, the view cell is initially purged with nitrogen (N2) and sc-CO2. Sc-CO2 is introduced into the view cell using a pressure bomb with an uncertainty of 0.002 g. (2) Mixture Preparation: A specimen of the binary mixture is prepared and inserted into the view cell using a syringe with an uncertainty of 0.0002 g. The precise composition of this mixture is determined based on the experimental objectives. (3) Pressurization and Equilibration: The binary mixture in the view cell is pressurized and maintained at a constant phase for a duration of thirty minutes. This is achieved by regulating the piston to attain the desired pressure level and temperature, which are then held constant. After thirty minutes, it is assumed that phase equilibrium has been achieved inside the cell. (4) Solubility Measurement: The pressure is gradually decreased to observe different phases. The appearance of small bubbles or a fine mist inside the view cell with varying pressure is recorded as a bubble point (I) or dew point (III), respectively. The critical point (II) of the mixture is noted when opalescence is observed with equal gas and liquid volume. (5) Repetition: Each measurement is repeated at least three times to ensure accuracy and reproducibility.
4 Results and discussion
The article presents an investigation into the binary systems of sc-CO2 with butyl acetoacetate, hexyl acetoacetate, and octyl acetoacetate. The study reports the isotherms in (P, x) space, where P denotes pressure and × signifies mole fraction. The standard uncertainties (σ) associated with the measurement of pressure, temperature, and mole fraction were found to be σ (P): 0.2 MPa, σ (T): 0.2 K, and σ (x): 0.0008, respectively. The experimental isotherms of the sc-CO2 + butyl acetoacetate binary system were reported in Table 3 for the pressure range of 3.04 MPa to 20.43 MPa and temperature array of 313.2 K to 393.2 K. The phase equilibrium behaviour of the sc-CO2 + hexyl acetoacetate solution was shown in Table 4 for the pressure range of 2.69 MPa to 22.18 MPa and temperature array of 313.2 K to 393.2 K. Similarly, the phase characteristics of the sc-CO2 + octyl acetoacetate system were demonstrated in Table 5 for the pressure range of 2.39 MPa to 23.83 MPa and temperature range of 313.2 K to 393.2 K.
Butyl Acetoacetate
Mole Fraction
pa / MPa
Transitionb and Phasec
Ta / K = 313.2
0.0450
8.62
I (L → LV)
0.0661
8.68
I (L → LV)
0.0756
8.69
I (L → LV)
0.0968
8.62
I (L → LV)
0.1068
8.55
I (L → LV)
0.1196
8.50
I (L → LV)
0.1576
8.28
I (L → LV)
0.2142
7.92
I (L → LV)
0.3110
7.31
I (L → LV)
0.4271
6.41
I (L → LV)
0.5180
5.51
I (L → LV)
0.6116
4.72
I (L → LV)
0.7545
3.55
I (L → LV)
0.8239
3.04
I (L → LV)
T / K = 333.2
0.0450
12.03
III(V → VL)
0.0661
12.12
I (L → LV)
0.0756
12.03
I (L → LV)
0.0968
11.83
I (L → LV)
0.1068
11.72
I (L → LV)
0.1196
11.48
I (L → LV)
0.1576
11.03
I (L → LV)
0.2142
10.40
I (L → LV)
0.3110
9.18
I (L → LV)
0.4271
7.94
I (L → LV)
0.5180
6.69
I (L → LV)
0.6116
5.76
I (L → LV)
0.7545
4.07
I (L → LV)
0.8239
3.36
I (L → LV)
T / K = 353.2
0.0450
15.21
III(V → VL)
0.0661
15.33
II(LV)
0.0756
15.27
I (L → LV)
0.0968
15.04
I (L → LV)
0.1068
14.79
I (L → LV)
0.1196
14.55
I (L → LV)
0.1576
14.04
I (L → LV)
0.2142
13.04
I (L → LV)
0.3110
11.10
I (L → LV)
0.4271
9.42
I (L → LV)
0.5180
7.79
I (L → LV)
0.6116
6.76
I (L → LV)
0.7545
4.35
I (L → LV)
0.8239
3.66
I (L → LV)
T / K = 373.2
0.0450
17.86
III(V → VL)
0.0661
18.14
III(V → VL)
0.0756
18.21
II(LV)
0.0968
18.06
I (L → LV)
0.1068
17.96
I (L → LV)
0.1196
17.75
I (L → LV)
0.1576
17.07
I (L → LV)
0.2142
15.68
I (L → LV)
0.3110
13.37
I (L → LV)
0.4271
11.24
I (L → LV)
0.5180
8.86
I (L → LV)
0.6116
7.48
I (L → LV)
0.7545
4.55
I (L → LV)
0.8239
3.90
I (L → LV)
T / K = 393.2
0.0450
19.55
III(V → VL)
0.0661
20.24
III(V → VL)
0.0756
20.43
III(V → VL)
0.0968
20.37
I (L → LV)
0.1068
20.34
I (L → LV)
0.1196
20.21
I (L → LV)
0.1576
19.73
I (L → LV)
0.2142
17.93
I (L → LV)
0.3110
15.33
I (L → LV)
0.4271
12.41
I (L → LV)
0.5180
10.14
I (L → LV)
0.6116
8.07
I (L → LV)
0.7545
4.83
I (L → LV)
0.8239
4.04
I (L → LV)
Hexyl Acetoacetate
Mole Fraction
pa / MPa
Transitionb and Phasec
Ta / K = 313.2
0.0548
8.76
I (L → LV)
0.0690
8.72
I (L → LV)
0.0980
8.66
I (L → LV)
0.1222
8.49
I (L → LV)
0.1418
8.39
I (L → LV)
0.1875
7.99
I (L → LV)
0.2497
7.42
I (L → LV)
0.3297
6.77
I (L → LV)
0.4030
6.21
I (L → LV)
0.4797
5.42
I (L → LV)
0.5472
4.90
I (L → LV)
0.6545
3.98
I (L → LV)
0.6815
3.63
I (L → LV)
0.7620
2.69
I (L → LV)
T / K = 333.2
0.0548
12.56
I (L → LV)
0.0690
12.45
I (L → LV)
0.0980
12.26
I (L → LV)
0.1222
11.89
I (L → LV)
0.1418
11.59
I (L → LV)
0.1875
11.10
I (L → LV)
0.2497
10.09
I (L → LV)
0.3297
8.88
I (L → LV)
0.4030
7.91
I (L → LV)
0.4797
6.90
I (L → LV)
0.5472
6.07
I (L → LV)
0.6545
4.87
I (L → LV)
0.6815
4.52
I (L → LV)
0.7620
3.17
I (L → LV)
T / K = 353.2
0.0548
15.97
III(V → VL)
0.0690
16.17
II(LV)
0.0980
16.04
I (L → LV)
0.1222
15.52
I (L → LV)
0.1418
14.97
I (L → LV)
0.1875
13.73
I (L → LV)
0.2497
12.67
I (L → LV)
0.3297
11.00
I (L → LV)
0.4030
9.59
I (L → LV)
0.4797
8.35
I (L → LV)
0.5472
7.10
I (L → LV)
0.6545
5.63
I (L → LV)
0.6815
5.17
I (L → LV)
0.7620
3.68
I (L → LV)
T / K = 373.2
0.0548
19.32
III(V → VL)
0.0690
19.41
III(V → VL)
0.0980
19.29
I (L → LV)
0.1222
19.03
I (L → LV)
0.1418
18.45
I (L → LV)
0.1875
17.29
I (L → LV)
0.2497
15.66
I (L → LV)
0.3297
13.31
I (L → LV)
0.4030
11.10
I (L → LV)
0.4797
9.52
I (L → LV)
0.5472
7.96
I (L → LV)
0.6545
6.28
I (L → LV)
0.6815
5.66
I (L → LV)
0.7620
4.05
I (L → LV)
T / K = 393.2
0.0548
21.86
III(V → VL)
0.0690
22.18
III(V → VL)
0.0980
21.97
I (L → LV)
0.1222
21.52
I (L → LV)
0.1418
20.93
I (L → LV)
0.1875
19.91
I (L → LV)
0.2497
17.92
I (L → LV)
0.3297
15.31
I (L → LV)
0.4030
12.85
I (L → LV)
0.4797
11.03
I (L → LV)
0.5472
9.21
I (L → LV)
0.6545
6.90
I (L → LV)
0.6815
6.10
I (L → LV)
0.7620
4.15
I (L → LV)
Octyl Acetoacetate
Mole Fraction
pa / MPa
Transitionb and Phasec
Ta / K = 313.2
0.0405
9.38
I (L → LV)
0.0750
9.45
I (L → LV)
0.0784
9.38
I (L → LV)
0.1039
9.30
I (L → LV)
0.1253
9.17
I (L → LV)
0.1540
8.86
I (L → LV)
0.1755
8.72
I (L → LV)
0.2897
7.49
I (L → LV)
0.3540
6.94
I (L → LV)
0.4010
6.43
I (L → LV)
0.5154
5.14
I (L → LV)
0.6176
4.07
I (L → LV)
0.7221
3.08
I (L → LV)
0.7948
2.39
I (L → LV)
T / K = 333.2
0.0405
13.76
III(V → VL)
0.0750
13.80
I (L → LV)
0.0784
13.87
I (L → LV)
0.1039
13.59
I (L → LV)
0.1253
13.08
I (L → LV)
0.1540
12.41
I (L → LV)
0.1755
12.18
I (L → LV)
0.2897
10.21
I (L → LV)
0.3540
9.28
I (L → LV)
0.4010
8.46
I (L → LV)
0.5154
6.44
I (L → LV)
0.6176
5.18
I (L → LV)
0.7221
3.80
I (L → LV)
0.7948
2.90
I (L → LV)
T / K = 353.2
0.0405
17.86
III(V → VL)
0.0750
18.06
II(VL)
0.0784
18.03
I (L → LV)
0.1039
17.48
I (L → LV)
0.1253
17.22
I (L → LV)
0.1540
16.48
I (L → LV)
0.1755
15.90
I (L → LV)
0.2897
12.52
I (L → LV)
0.3540
11.28
I (L → LV)
0.4010
10.06
I (L → LV)
0.5154
7.68
I (L → LV)
0.6176
6.06
I (L → LV)
0.7221
4.43
I (L → LV)
0.7948
3.20
I (L → LV)
T / K = 373.2
0.0405
20.90
III(V → VL)
0.0750
21.24
III(V → VL)
0.0784
21.35
I (L → LV)
0.1039
20.83
I (L → LV)
0.1253
20.43
I (L → LV)
0.1540
19.90
I (L → LV)
0.1755
19.32
I (L → LV)
0.2897
15.17
I (L → LV)
0.3540
13.52
I (L → LV)
0.4010
11.48
I (L → LV)
0.5154
8.78
I (L → LV)
0.6176
6.75
I (L → LV)
0.7221
4.88
I (L → LV)
0.7948
3.51
I (L → LV)
T / K = 393.2
0.0405
23.32
III(V → VL)
0.0750
23.73
III(V → VL)
0.0784
23.83
II(VL)
0.1039
23.48
I (L → LV)
0.1253
23.18
I (L → LV)
0.1540
22.39
I (L → LV)
0.1755
21.77
I (L → LV)
0.2897
17.17
I (L → LV)
0.3540
15.31
I (L → LV)
0.4010
13.33
I (L → LV)
0.5154
10.11
I (L → LV)
0.6176
7.64
I (L → LV)
0.7221
5.72
I (L → LV)
0.7948
3.85
I (L → LV)
Fig. 3 (a-c) in this study compare experimental isotherms with computed isotherms using the P-R equation for the sc-CO2 + butyl acetoacetate, sc-CO2 + hexyl acetoacetate, and Sc-CO2 + octyl acetoacetate mixtures at a temperature of 353.2 K. T = 353.2 K is an intermediate temperature in the range of temperatures measured. The experimental results indicate that a vapor–liquid equilibrium region is observed beneath each isotherm, while a single-phase region is reported above every isotherm. Furthermore, no three-phase region was detected at any of the five temperatures that were investigated. The fitted interaction two-parameters (ITPs) for the 353.2 K isotherm are shown as a red solid line, with kij and ηij values of 0.015 and −0.055 for butyl acetoacetate + sc-CO2 (using 14 data points), 0.020 and −0.040 for hexyl acetoacetate + sc-CO2 (using 14 data points), and 0.050 and −0.025 for octyl acetoacetate + sc-CO2 (using 14 data points). In contrast, the results with ITPs set to zero (kij = 0.0 and ηij = 0.0) are shown as a solid blue line. The RMSD% (root mean square relative deviation percentage) was calculated at 353.2 K for each system, and the values were 3.24%, 2.09%, and 1.70% for butyl acetoacetate + sc-CO2, hexyl acetoacetate + sc-CO2, and octyl acetoacetate + sc-CO2, respectively. The figures clearly show that the isotherms predicted with zero ITPs significantly deviate from the experimental values. Therefore, the other isotherms were calculated using non-zero ITPs. It is important to note that the ITPs calculated for the 353.2 K isotherms were used to calculate the other isotherms in present case.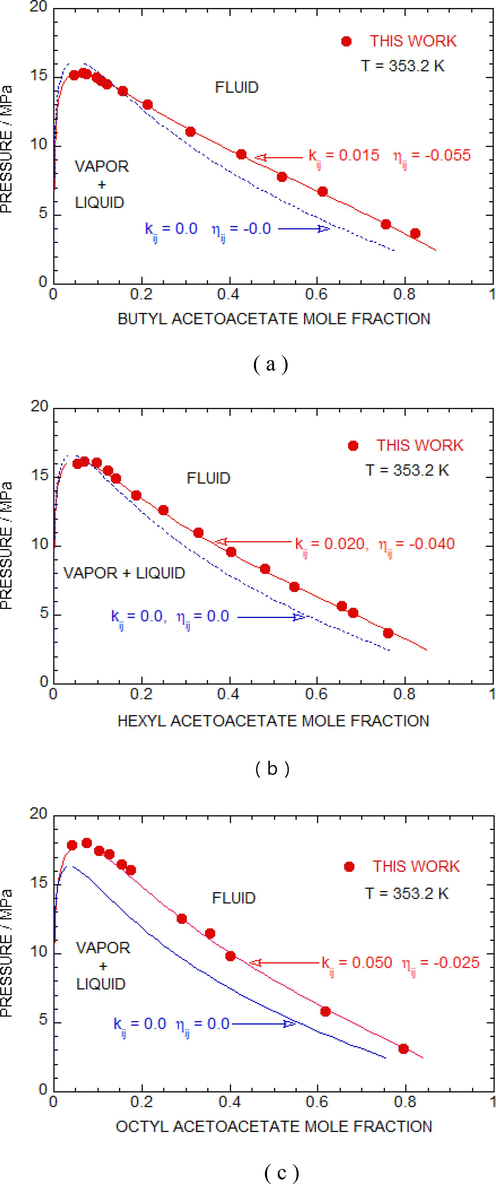
Pressure vs mole fraction plot (a) butyl acetoacetate + sc-CO2 (b) hexyl acetoacetate + sc-CO2 and (c) octyl acetoacetate + sc-CO2 systems with calculations obtained from PR EOS at 353.2 K. Blue broken and red solid line represent results with zero and non-zero interaction parameters (kij and ηij) respectively.
The van der Waals mixing rules with ITPs are as given below:
The optimization of the objective function in equation (5) to obtain ITPs was carried out using the least square method in Python programming.
The ITPs obtained in studies of binary mixtures have significant physical significance and are related to the molecular interactions occurring within these mixtures. These parameters are often used to describe and understand the non-ideal behavior of binary systems, where the interactions between molecules are not simply additive. Here's the physical significance of these parameters and their relation to molecular interactions: (1) Deviation from Ideal Behavior: Binary interaction parameters, often denoted as binary interaction coefficients (e.g., kij or ηij), quantify the deviation of a binary mixture from ideal behavior. Ideal behavior assumes that the mixture's properties can be calculated as weighted averages of the pure component properties. When the binary interaction parameter is zero (kij = 0), the mixture follows ideal behavior. Positive or negative values of kij indicate deviations from ideality. (2) Attractive and Repulsive Interactions: The sign of the binary interaction parameter indicates the nature of molecular interactions between the components. Positive kij: Indicates repulsive interactions between molecules. In such mixtures, the molecules tend to avoid each other, a positive deviation from Raoult's law. Negative kij: Suggests attractive interactions between molecules. In these mixtures, molecules tend to be more attracted to each other, which can lead to a negative deviation from Raoult's law.
Fig. 4 (a) presents evaluating agreement between the empirical measurements data and the predicted values using (P, x) data for the sc-CO2 + butyl acetoacetate solution. To obtain solubility isotherms, the kij and ηij values are optimized for each temperature spanned from 313.2 K to 393.2 K. The vapor + liquid equilibria data determined in this study was in good agreement and fitted well into the P-R equation for the sc-CO2 + butyl acetoacetate mixture. The RMSD% (Table 6) of the sc-CO2 + butyl acetoacetate solution was calculated for five different temperatures using the two parameters (kij, ηij) obtained at each temperature.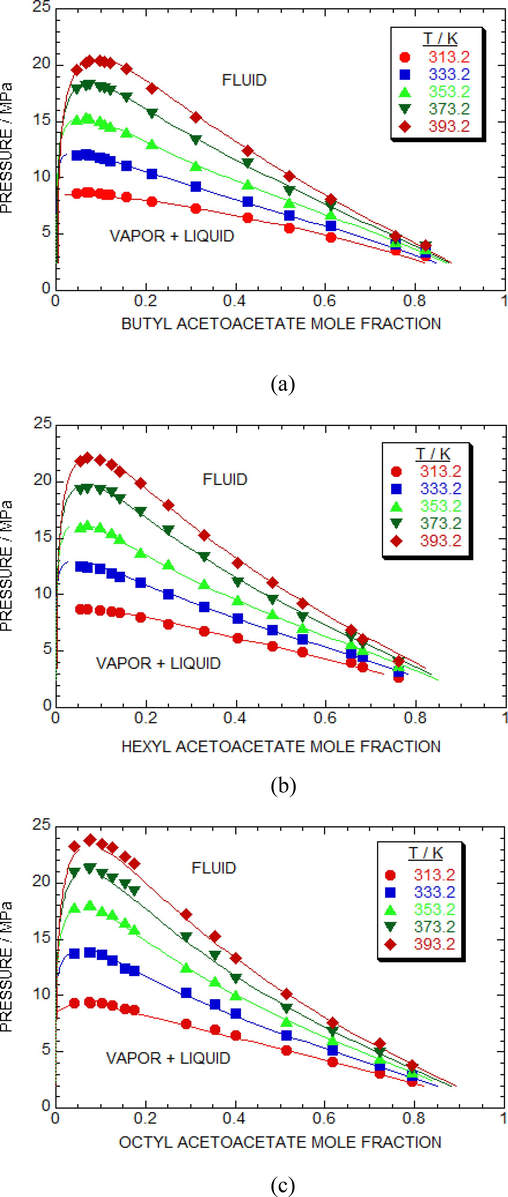
Experimental and predicted isotherms of (a) butyl acetoacetate + sc-CO2 (b) hexyl acetoacetate + sc-CO2 and (c) octyl acetoacetate + sc-CO2 systems by optimum parameters (kij, ηij) at each temperature. Symbols denotes experimental data points at various temperature. Solid lines are predicted isotherms using PR EOS.
Systems
T / K
kij
ηij
RMSD(%)
SC-CO2 + Butyl acetoacetate
313.2
0.055
−0.045
5.92
333.2
0.030
−0.050
5.07
353.2
0.015
−0.055
3.24
373.2
0.015
−0.045
3.39
393.2
0.015
−0.035
3.11
SC-CO2 + Hexyl acetoacetate
313.2
0.050
−0.030
2.44
333.2
0.035
−0.035
2.72
353.2
0.020
−0.040
2.09
373.2
0.025
−0.030
2.30
393.2
0.025
−0.025
3.97
SC-CO2 + Octyl acetoacetate
313.2
0.058
−0.028
2.29
333.2
0.054
−0.026
2.57
353.2
0.050
−0.025
1.70
373.2
0.048
−0.020
2.53
393.2
0.046
−0.018
3.02
Fig. 4 (b) shows the experimental and calculated curves obtained from the P-R equation using the optimized two parameters obtained at each temperature for the sc-CO2 + hexyl acetoacetate solution. In this study, we evaluated the RMSDs at five different temperatures varied between (313.2 K to 393.2 K, interval 20 K) for the sc-CO2 + hexyl acetoacetate solution using the P-R equation with optimized two parameters (Table 6).
Fig. 4 (c) depicts a comparison between the equilibria data and the estimated results of the (P, x) isotherms at temperatures ranging from 313.2 K to 393.2 K for the sc-CO2 + octyl acetoacetate system. The adjusted kij and ηij values (Table 6) were obtained at each temperature, which were 0.058 and −0.028 for T = 313.2 K, 0.054 and −0.026 for T = 333.2 K, 0.050 and −0.025 for T = 353.2 K, 0.048 and −0.020 for T = 373.2 K, and 0.046 and −0.018 for T = 393.2 K.
In Fig. 5 (a-c), mixture critical curves of experimental data were compared with the predicted results from the P-R equation for the sc-CO2 + butyl acetoacetate (a), sc-CO2 + hexyl acetoacetate (b) and sc-CO2 + octyl acetoacetate (c) solutions. The projected mixture-critical lines showed a type-I curve, as mentioned before. The red solid lines represented the saturated vapor pressure for individual pure sc-CO2, butyl acetoacetate, hexyl acetoacetate, and octyl acetoacetate estimated by the Lee-Kesler method (Poling et al., 2001). The red closed circles represented the critical-point for pure sc-CO2, butyl acetoacetate, hexyl acetoacetate and octyl acetoacetate. Region above the blue dashed curves is in the 1-phase, while below part is in the 2-phase. The dashed curve represented the calculated results determined by the P-R equation, with kij and ηij values of 0.015 and −0.055 (for butyl acetoacetate), 0.020 and −0.040 (for hexyl acetoacetate), and 0.050 and −0.025 (for octyl acetoacetate). The blue closed squares represented the mixture-critical point obtained from the isotherms measured in the experiment.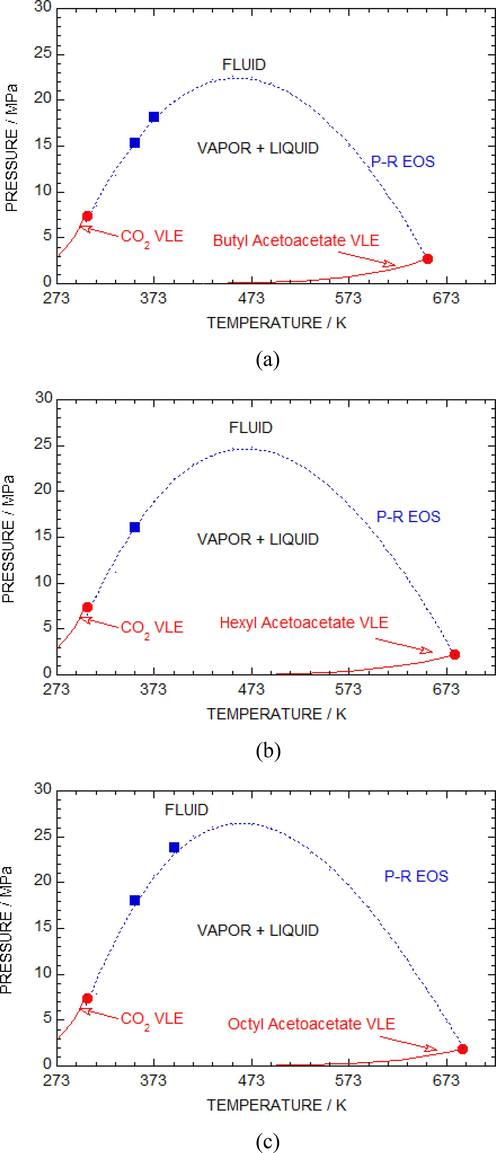
Diagram in (P vs T) space for the (a) butyl acetoacetate + sc-CO2 (b) hexyl acetoacetate + sc-CO2 and (c) octyl acetoacetate + sc-CO2 systems. The critical-point of pure components (sc-CO2 or butyl acetoacetate or hexyl acetoacetate or octyl acetoacetate) is represented by red closed circles. Red solid curves are vapor + liquid equilibrium curves. Squares denotes critical points of a mixture taken from experimental isotherms. Black and blue curves show calculations by P-R equation with zero and non-zero interaction parameters.
5 Conclusion
The equilibrium data of the sc-CO2 + butyl acetoacetate, sc-CO2 + hexyl acetoacetate, and sc-CO2 + octyl acetoacetate systems were obtained at pressures of P ≤ 23.83 MPa and temperatures extending from 313.2 K to 393.2 K. It was observed that the binary mixtures of sc-CO2 + butyl acetoacetate, sc-CO2 + hexyl acetoacetate, and sc-CO2 + octyl acetoacetate exhibited type-I curves and did not display a three-phase region.
To model the experimental equilibria data from the sc-CO2 + butyl acetoacetate, sc-CO2 + hexyl acetoacetate, and sc-CO2 + octyl acetoacetate solutions, the P-R equation was used with adjustable temperature dependent two-parameters, kij and ηij. The overall RMSD% values for the sc-CO2 + butyl acetoacetate, sc-CO2 + hexyl acetoacetate, and sc-CO2 + octyl acetoacetate solutions were found to be 4.15 %, 2.7 %, and 2.42 %, respectively. These findings suggest that the P-R equation with adjustable two-parameters (kij and ηij) can effectively model the equilibrium data of the sc-CO2 + butyl acetoacetate, sc-CO2 + hexyl acetoacetate, and sc-CO2 + octyl acetoacetate systems.
The experimental findings and successful application of the Peng-Robinson equation with adjustable parameters (kij and ηij) to model equilibrium data for sc-CO2 with various acetoacetate compounds have significant practical implications for process design and optimization in separation processes. This research provides valuable insights into the phase behavior of these systems, aiding in the development of selective extraction processes, optimizing temperature and pressure conditions, and potentially reducing the environmental impact through the use of environmentally friendly sc-CO2 as a solvent. Additionally, the modeling approach's success suggests its applicability to industrial-scale processes, promising more efficient and sustainable separation techniques across industries.
CRediT authorship contribution statement
Hun-Soo Byun: Conceptualization, Validation, Visualization, Supervision, Project administration, Funding acquisition, Writing – original draft. Pradnya NP Ghoderao: Conceptualization, Methodology, Formal analysis, Data curation, Software, Investigation. Hyun-Seok Lee: Methodology, Data curation, Investigation. Min-Soo Park: Methodology, Data curation, Investigation.
Acknowledgements
This work was supported by the National Research Foundation of Korea (NRF) grant funded by the Korea government (MSIT) (No. 2021R1A2C2006888).
Declaration of competing interest
The authors declare that they have no known competing financial interests or personal relationships that could have appeared to influence the work reported in this paper.
References
- Green technologies for sustainable food production and preservation: supercritical fluids. In: Reference Module in Food Science. Elsevier; 2023.
- [CrossRef] [Google Scholar]
- Influence of aceto acetic esters and di-carboxylic acid esters on diesel fuel lubricity. Tribol. Int.. 2001;34:749-755.
- [CrossRef] [Google Scholar]
- Effect of guest-dependent reference hydrate vapor pressure in thermodynamic modeling of gas hydrate phase equilibria, with various combinations of equations of state and activity coefficient models. Fluid Phase Equilib.. 2022;556:113356
- [Google Scholar]
- An efficient model for the prediction of CO2 hydrate phase stability conditions in the presence of inhibitors and their mixtures. J. Chem. Thermodyn.. 2015;85:163-170.
- [Google Scholar]
- A robust model for the phase stability of clathrate hydrate of methane in an aqueous systems of TBAB, TBAB þ NaCl and THF suitable for storage and transportation of natural gas. J. Nat. Gas Sci. Eng.. 2016;33:509-517.
- [Google Scholar]
- Thermodynamic modeling of phase equilibrium of carbon dioxide clathrate hydrate in aqueous solutions of promoters and inhibitors suitable for gas separation. Asia-Pac. J. Chem. Eng.. 2017;12:709-722.
- [Google Scholar]
- Bubble-point measurement for the binary mixture of propargyl acrylate and propargyl methacrylate in supercritical carbon dioxide. J. Chem. Thermodyn.. 2016;92:191-197.
- [CrossRef] [Google Scholar]
- High-pressure phase equilibrium data of carbon dioxide/food-relevant systems (2011–2022): experimental methods, multiphase behavior, thermodynamic modeling, and applications. Fluid Phase Equilib.. 2023;572:113851
- [CrossRef] [Google Scholar]
- Thermodynamic modeling of phase equilibria of clathrate hydrates formed from CH4, CO2, C2H6, N2 and C3H8, with different equations of state. J. Chem. Thermodynamics.. 2018;117:180-192.
- [Google Scholar]
- The search for new environmentally friendly chemical processes. Angew. Chem. Int. Ed.. 1999;38:907-909.
- [CrossRef] [Google Scholar]
- Supercritical fluid technology for agrifood materials processing. Curr. Opin. Food Sci.. 2023;50:100983
- [CrossRef] [Google Scholar]
- Floral scent and pollinators of cypripedium calceolus L. at different latitudes. Diversity. 2021;13:5.
- [CrossRef] [Google Scholar]
- butyl acetoacetate, 591-60-6, n.d. http://www.thegoodscentscompany.com/data/rw1013081.html (accessed May 5, 2023).
- Buy Hexyl acetoacetate – 13562-84-0 | BenchChem, n.d. https://www.benchchem.com/product/b078972 (accessed September 18, 2023).
- Buy Octyl acetoacetate – 16436-00-3 | BenchChem, n.d. https://www.benchchem.com/product/b098030 (accessed September 18, 2023).
- High-pressure phase equilibrium of the binary systems CO2 + 355-TMHA and CO2 + 335-TMCHMA. New J. Chem.. 2023;47:4043-4051.
- [CrossRef] [Google Scholar]
- FH60066 | 13562-84-0 | Hexyl Acetoacetate | Biosynth, n.d. https://www.biosynth.com/p/FH60066/13562-84-0-hexyl-acetoacetate (accessed September 18, 2023).
- Estimation and correlation of phase equilibrium of CO2–hydrocarbon systems with PRMHV2-UNIFAC and PRMHV2-NRTL models. J. Chem. Eng. Data.. 2020;65:655-663.
- [CrossRef] [Google Scholar]
- The solubility of CO2 in (hexane + cyclohexane) and (cyclopentane + ethylbenzene) and (toluene + undecane) systems at high pressures. J. Chem. Thermodyn.. 2021;154:106324
- [CrossRef] [Google Scholar]
- A four-parameter cubic equation of state for pure compounds and mixtures. Chem. Eng. Sci.. 2018;190:173-189.
- [Google Scholar]
- A four parameter cubic equation of state with temperature dependent covolume parameter. Chin. J. Chem. Eng.. 2019;27:1132-1148.
- [CrossRef] [Google Scholar]
- A five-parameter cubic equation of state for pure fluids and mixtures. Chem. Eng. Sci.: X.. 2019;3:100026
- [CrossRef] [Google Scholar]
- Phase behavior for the poly(2-ethyl-2-oxazoline) + supercritical DME + alcohol and carbon dioxide + 2-ethyl-2-oxazoline mixtures at high pressure. Chem. Eng. Sci.. 2023;270:118566
- [CrossRef] [Google Scholar]
- Phase behavior investigation of the vinyl toluene and poly (vinyl toluene) + co-solvents in supercritical CO2. J. Ind. Eng. Chem.. 2023;121:92-99.
- [CrossRef] [Google Scholar]
- 8 - Precision Cleaning With Supercritical Fluid: A Case Study. In: McHardy J., Sawan S.P., eds. Supercritical Fluid Cleaning. Westwood, NJ: William Andrew Publishing; 1998. p. :195-219.
- [CrossRef] [Google Scholar]
- High pressure phase behavior and thermodynamic modeling of the carbon dioxide + chloroform + globalide system. Fluid Phase Equilib.. 2023;572:113831
- [CrossRef] [Google Scholar]
- Modeling phase equilibria of semiclathrate hydrates of CH4, CO2 and N2 in aqueous solution of tetra-n-butyl ammonium bromide. J. Nat. Gas Chem.. 2012;21:459-465.
- [Google Scholar]
- Sustainability assessment of solvolysis using supercritical fluids for carbon fiber reinforced polymers waste management. Sustain. Prod. Consum.. 2019;17:74-84.
- [CrossRef] [Google Scholar]
- Industrial applications of supercritical fluids: A review. Energy. 2014;77:235-243.
- [CrossRef] [Google Scholar]
- Chapter 6 - Applications of Supercritical Carbon Dioxide for Removal of Surface Contaminants. In: Kohli R., Mittal K.L., eds. Developments in Surface Contamination and Cleaning: Applications of Cleaning Techniques. Elsevier; 2019. p. :209-249.
- [CrossRef] [Google Scholar]
- Vapor-liquid equilibrium phase behavior of binary systems of carbon dioxide with dimethyl adipate or monomethyl adipate. J. Supercrit. Fluids. 2023;194:105856
- [CrossRef] [Google Scholar]
- Phase equilibria for the two-component systems of allyl acetoacetate, methyl acetoacetate and ethyl acetoacetate under high-pressure CO2. J. Mol. Liq.. 2023;387:122651
- [CrossRef] [Google Scholar]
- Calculation of the Phase Equilibrium of CO2–Hydrocarbon Binary Mixtures by PR-BM EOS and PR EOS. Trans. Tianjin Univ.. 2019;25:540-548.
- [CrossRef] [Google Scholar]
- A review of current progress of supercritical fluid technologies for e-waste treatment. J. Clean. Prod.. 2019;227:794-809.
- [CrossRef] [Google Scholar]
- Formulation of nitrendipine/hydroxypropyl-β-cyclodextrin inclusion complex as a drug delivery system to enhance the solubility and bioavailability by supercritical fluid technology. Eur. Polym. J.. 2023;187:111880
- [CrossRef] [Google Scholar]
- Graphene-based materials prepared by supercritical fluid technology and its application in energy storage. J. Supercrit. Fluids.. 2022;188:105672
- [CrossRef] [Google Scholar]
- Supercritical fluid extraction as a suitable technology to recover bioactive compounds from flowers. J. Supercrit. Fluids.. 2022;188:105652
- [CrossRef] [Google Scholar]
- Supercritical fluids in separation and purification: a review. Mater. Sci. Energy Technol.. 2019;2:463-484.
- [CrossRef] [Google Scholar]
- Binary systems for the trimethylolpropane triacrylate and trimethylolpropane trimethacrylate in supercritical carbon dioxide: experiment and modeling. J. Mol. Liq.. 2023;372:121206
- [CrossRef] [Google Scholar]
- Chapter 9 - Advances in the industrial applications of supercritical carbon dioxide. In: Nanda S., Vo D.-V.N., Nguyen V.-H., eds. Carbon Dioxide Capture and Conversion. Elsevier; 2022. p. :237-256.
- [CrossRef] [Google Scholar]
- The Properties of Gases and Liquids (fifth ed.). New York: McGraw-Hill; 2001.
- Supercritical fluid technology – an eco-friendly approach for resource recovery from e-waste and plastic waste: a review. Sep. Purif. Technol.. 2023;304:122314
- [CrossRef] [Google Scholar]
- PubChem, Butyl acetoacetate, n.d. https://pubchem.ncbi.nlm.nih.gov/compound/11576 (accessed May 5, 2023).
- Mini-review: green sustainable processes using supercritical fluid carbon dioxide. J. Environ. Sci.. 2009;21:720-726.
- [Google Scholar]
- The Properties of Gases & Liquids (fourth ed.). New York: McGraw-Hill Inc; 1987.
- New developments in supercritical fluids as a green technology: Processing of β-glucanase with sub- and supercritical carbon dioxide. Biochem. Eng. J.. 2023;195:108934
- [CrossRef] [Google Scholar]
- Solubility of buprenorphine hydrochloride in supercritical carbon dioxide: study on experimental measuring and thermodynamic modeling. Arab. J. Chem.. 2023;16:105196
- [CrossRef] [Google Scholar]
- Supercritical carbon dioxide and biomedicine: opening the doors towards biocompatibility. Chem. Eng. J.. 2022;444:136615
- [CrossRef] [Google Scholar]
- Application of supercritical fluid technology for solid dispersion to enhance solubility and bioavailability of poorly water-soluble drugs. Int. J. Pharm.. 2021;610:121247
- [CrossRef] [Google Scholar]
- Progress of supercritical fluid technology in polymerization and its applications in biomedical engineering. Prog. Polym. Sci.. 2019;98:101161
- [CrossRef] [Google Scholar]
- Towards sustainability and green chemical engineering: tools and technology requirements. Green Chem.. 2004;6:401-406.
- [CrossRef] [Google Scholar]
- Sustainable solvents in chemical synthesis: a review. Environ. Chem. Lett.. 2021;19:3263-3282.
- [Google Scholar]
- Fundamental study and utilization on supercritical CO2 fracturing developing unconventional resources: current status, challenge and future perspectives. Pet. Sci.. 2022;19:2757-2780.
- [CrossRef] [Google Scholar]
- Applications of supercritical carbon dioxide in materials processing and synthesis. RSC Adv.. 2014;4:61137-61152.
- [CrossRef] [Google Scholar]


