

Translate this page into:
Three new turn-on fluorescent sensors for the selective detection of Zn2+: Synthesis, properties and DFT studies
⁎Corresponding author at: Chemistry Department, King Fahd University of Petroleum and Minerals, Dhahran 31261, Saudi Arabia. nullah@kfupm.edu.sa (Nisar Ullah)
-
Received: ,
Accepted: ,
This article was originally published by Elsevier and was migrated to Scientific Scholar after the change of Publisher.
Peer review under responsibility of King Saud University.
Abstract
The design and synthesis of three new 1,8-naphthalimide-based fluorescent sensors (1–3) for the detection of Zn2+ in aqueous solution is described. The structural architect of these sensors contains 1,8-naphthalimide scaffold as a fluorophore attached to 2,2′-dipicolylamine (DPA) and bis(2-quinolinylmethyl)amine (DQA) receptors through an amide linkage. The addition of Zn2+ to the solutions of sensors (1–3) led to enhanced fluorescence intensity, ranging between 2.5 and 14 folds. At physiological pH (pH = 7.4), these sensors exhibited high selectivities for Zn2+ over a wide range of competing metal cations, displaying high sensitivities with a limit of detections of 120, 81.7 and 79.2 nM, respectively. This suggests that these sensors can detect chronic Zn2+ concentration for freshwater (>1.84 μM), designated by the U.S. Environmental Protection Agency. DFT simulations performed on the more stable stacked conformations of unbound and Zn2+ bounded states suggested that the latter display higher density of excited states than the unbound sensors. Moreover, the stacked conformer of sensor 3 was significantly more stable as compared to sensors 1 and 2, which was attributed to a stronger Van Der Waals (VDW) interaction between DQA and 1,8-naphthalimide. The Zn2+ binding leads to enhanced electronic coupling between the HOMOs and LUMOs, making excited states more populated which then undergoes geometric relaxation before emitting light and relaxing back to the ground states. The lower energy separation (5.0 eV) between the HOMO and the first Zn2+ d-orbital in sensor 3 as compared to sensors 1 and 2 results in enhanced density of the generated states and subsequently higher intensity upon binding with Zn2+.
Keywords
Fluorescent sensor
1,8-naphthalimide
Zinc ion
2,2′-dipicolylamine
Bis(2-quinolinylmethyl)amine
DFT calculation

1 Introduction
Zinc ion (Zn2+) is one of the essential metals that plays crucial roles in human physiology and environment (Waheed et al., 2020b, 2020a). After iron ions, Zn2+ is the most abundant transition metal ions, mostly found inside cells. Zinc plays an important function in various biological processes including pathology, brain function (Berg and Shi, 1996), immune function (Sun and Jeng, 1999), gene transcription (Kim et al., 2020), mammalian reproduction (Tsai et al., 2020), DNA binding, apoptosis (An et al., 2016; Mandal et al., 2018) and muscle contraction (Kay, 2006). Moreover, the activation of approximately more than three hundred enzymes is dependent upon Zn2+ (Chasapis et al., 2012). Although zinc is non-toxic at its normal level (∼12 μM), its imbalance in the human body is associated with Alzheimer's disease, epileptic seizures, Parkinson's disease (Waheed et al., 2020a, 2020b), amyotrophic lateral sclerosis (Weiss et al., 2000), infantile diarrhea, ischemic stroke, epileptic seizures (Xu et al., 2010), breast cancer and types 1 and 2 diabetes (Bedwal and Bahuguna, 1994). Similarly, the excess amount of zinc leads to disruption of the immune system that results in the eye lesions and gastrointestinal disorders (Shi et al., 2018; Zhang et al., 2019). The level of zinc in the environment increases mainly from the discharge of oxide filler, batteries, alloys and steel protecting industries. Sludge and fertilizer also contribute to increased levels of zinc in the soil. Moreover, the higher level of zinc suppresses the microbial activity and thereby lowers soil fertility (Bedwal and Bahuguna, 1994). Therefore, selective tracking of Zn2+ in the biological and environmental samples is of great significance and importance. Nevertheless, the detection of Zn2+ is perplexing and problematic because it is spectroscopically and magnetically inactive due to its d10 electronic configuration. Numerous analytical techniques for Zn2+ detection have been developed. Among them, inductively coupled plasma mass spectrometry (ICP-MS), atomic absorption spectroscopy (AAS), X-ray fluorescence (XRF), electrochemical techniques and atomic emission spectroscopy (AES) are commonly used for Zn2+ analysis (Waheed et al., 2020a). Nevertheless, these techniques are unable to discriminate between the unbound and bioavailable zinc from that of bound and less toxic zinc (Waheed et al., 2020b). Moreover, these methods require high cost instruments, time-consuming procedures and laborious sample preparation (Waheed et al., 2020a).
Recently, organic dye-based fluorescent probes have received a widespread interest in the detection of Zn2+ due to their high sensitivity, quick-response, operational simplicity, and reproducibility (Waheed et al., 2020b). In the past decades, a wide range of fluorescent probes based on a variety of fluorophores including BODIPY (Boens et al., 2012), fluorescein (Wang et al., 2014), anthracene (Lee et al., 2014), quinolone (Liu et al., 2016), coumarin (Arvas et al., 2021) and naphthalimide (El-Safty et al., 2012; Li et al., 2011) have been developed. Although the tracking ability of these probes is impressive, they still suffer from limitations such as low selectivity, complicated synthesis and poor selectivity for Zn2+ over Cd2+. Therefore, the development of fluorescent sensors for the selective and sensitive detection of Zn2+ is an ongoing research endeavor.
In general, the define coordination pattern of the probe’s receptor containing confined binding ‘cavity’ is crucial for host–guest chemistry. This, in turn, may play an important role for Zn2+ selectivity over other heavy and transition metal ions (Waheed et al., 2020b). Therefore, the selection of a receptor that can specifically and favorably binds Zn2+ is important for an improved selective detection. The DPA moiety has been frequently used because of its specificity for Zn2+ over alkali and alkaline-earth metal ions present in much higher concentrations in biological samples (Xu et al., 2010). Similarly, DQA scaffold has been widely used for the detection of Zn2+ due to its high solubility in water and superior selectivity for Zn2+, with a considerable fluorescence enhancement (Aulsebrook et al., 2014; Chae et al., 2019; Kasirajan et al., 2017; Velmurugan et al., 2015). On the other hand, 1,8-naphthalimide derivatives are extensively used as environmentally sensitive fluorophore in several fields of science and technology (Ma et al., 2010). Owing to their good photostability and strong yellow-green fluorescence, 1,8-naphthalimide derivatives have been employed in fluorescence sensing of metals and other ions (Georgiev and Bojinov, 2012; Li et al., 2012; Liu et al., 2019; Yang et al., 2012).
It is well documented that transition metal ions can decrease the fluorescence of the fluorophore by either redox activity, magnetic perturbations or single electron transfer (SET) from the singlet excited state of fluorophore to metal ion (Ghosh et al., 1996). To overcome this problem, an amide linkage was installed in between the DPA and naphthalimide fluorophore in order to increase the inflexibility or impose conformational restrain of the receptor or rigidity of the ligand scaffold which may develop a specific topology or right coordination geometry for the receptor for enhanced Zn2+ selectivity. Moreover, after anticipated coordination of the carbonyl oxygen of the amide function, in conjunction of DPA, with Zn2+ may block Zn2+ from sterically interacting with the naphthalimide. This in turn will help preventing Zn2+ from the close proximity of the fluorophore. In addition, amide function may also act as a sacrificial donor by participating in SET process with the Zn2+ instead of SET by the fluorophore, which in turn can reduce fluorescence quenching (Deng et al., 2019).
In the light of above, we have designed three fluorescent sensors (1–3) that contains 1,8-naphthalimide and its derivative 4-nitro-1,8-naphthalimide as fluorophore attached to DPA and DQA receptors through an amide linkage. The amide-DPA and amide-DQA receptors were anticipated to display high binding affinity and excellent selectivity for Zn2+ over other competitive metal ions through the coordination of carbonyl oxygen of amide function in conjunction with the DPA and DQA receptors (Fig. 1).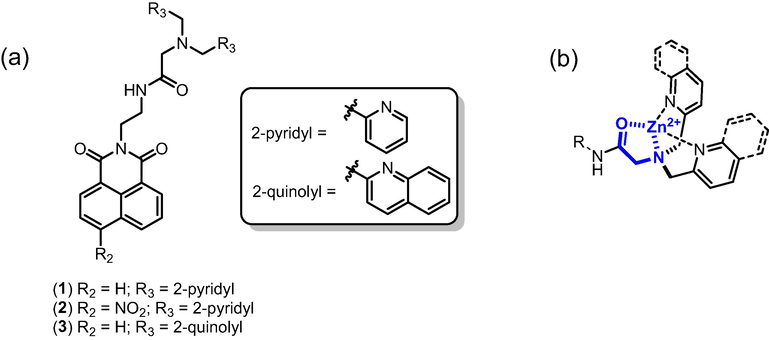
a) Chemical structures of chemosensors 1–3. b) Anticipated high affinity and selectivity for Zn2+.
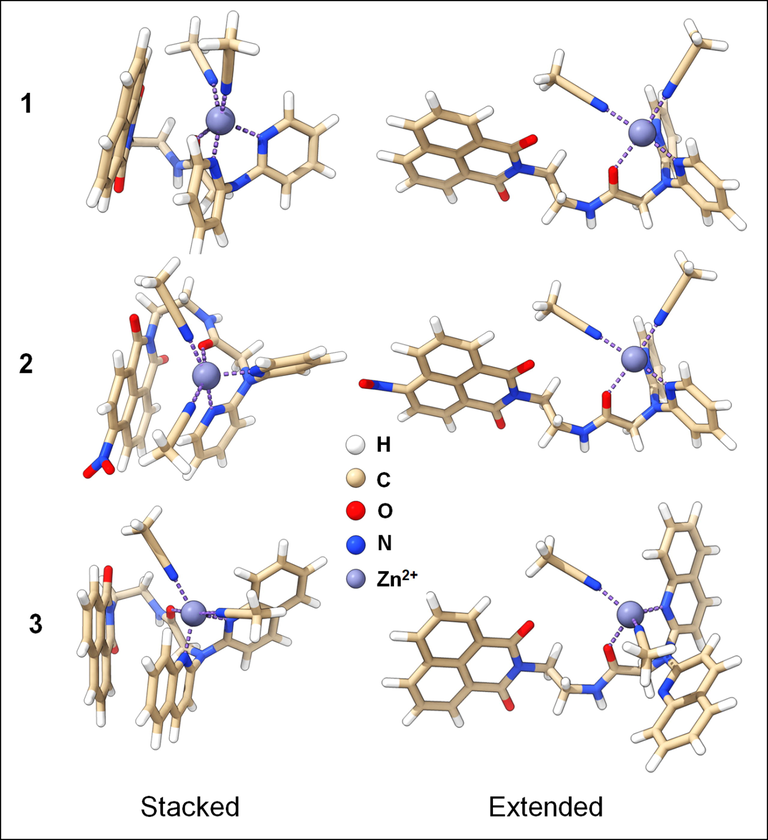
Optimized structures of the three chemosensors complexed with Zn2+ in the extended and stacked conformations. The stacked conformations are predicted as the most stable conformer generated by the CREST code.
An extensive DFT modeling studies on these sensors 1–3 in the unbound and Zn2+-bound states for the more stable stacked conformer were performed. The absorbance spectra are reproduced well and are in good agreement with the experimental data.
2 Materials and methods
2.1 Materials
The details about the materials are given in the supplementary file.
2.2 Computational details
Density functional theory (DFT) calculations were performed on chemosensors 1–3, depicted in Figs. 2 and S1, to underline the effect of Zn2+ ions on the spectra of the three sensors. The geometrical optimization and spectra calculations were performed by wB97xd (Chai and Head-Gordon, 2008; Dill and Pople, 1975; Grimme, 2006; Rassolov et al., 1998) levels of theory. All the stationary points were verified minimum by frequency calculations and confirmed by all positive frequencies. The solvent environment was taken into account using the PCM model (Scalmani and Frisch, 2010), as implemented in Gaussian 16 (Frisch et al., 2016). Two acetonitrile molecules were included to complete the Zn2+ coordination sphere. Prior DFT calculations, conformational sampling of chemosensors 1–3 were performed and then selecting the most stable one for the binding and spectra calculations. These calculations were conducted by a cheaper and very efficient semi-empirical method GFN2-xTB, recently developed by Grimme (Bannwarth et al., 2019). The GFN2-xTB method along with the extended tight-binding Hamiltonian (Bannwarth et al., 2021; Pracht et al., 2019) was used, as implemented in XTB code. The iMTD-GC algorithm (Pracht et al., 2020) was employed to generate the conformer/rotamer ensemble by an extensive metadynamics sampling (MTD) (Grimme, 2019) and genetic z-matrix crossing (GC), as implemented in Conformer–Rotamer Ensemble Sampling Tool (CREST) code (Perdew et al., 1996a). Such workflow is challenging for the DFT method (Perdew et al., 1996b). The empirical parameters used in the GFN2-xTB method were fitted to reproduce the results of DFT (B97-3c) (Brandenburg et al., 2018). The metal binding free energies and spectra calculations were calculated on the most stable conformer generated by CREST, using equation (1) after further geometrical optimization by using wB97xd1,2/6–31 + G(d,p) level of theory as mentioned above.
The contribution of the solvation free energy to the total metal-binding free energy was calculated from equation (2).
Using the counterpoise method, all binding free energies were corrected for the basis set superposition (Werner et al., 2007).
2.3 Synthesis of intermediates and chemosensors
2.3.1 Synthesis of tert-butyl (2-(1,3-dioxo-1H-benzo[de]isoquinolin-2(3H)-yl)ethyl)carbamate (8)
A solution of compounds 5 (0.90 g, 5.5 mmol) and 6 (1.0 g, 5.0 mmol) in EtOH (20 mL) was refluxed for 8 h. Upon completion of the reaction (TLC analysis), the reaction was concentrated under reduced pressure and the obtained solid was washed thrice with diethyl ether (5 mL) to render the desired 8 as a light brown solid (1.57 g, 92%), m.p. 187–189 °C. IR (KBr): 3504, 3390, 2981, 1710, 1692, 1657, 1623, 1590, 1501, 1492, 1346, 1241.8, 1164, 1054, 1026, 785 cm−1. 1H NMR (400 MHz, CDCl3): δ 8.59 (d, 2H, J = 7.2 Hz), 8.20 (d, 2H, J = 8.0 Hz), 7.36 (t, 2H, J = 7.6 Hz), 5.00 (br. s, 1H), 4.35 (t, 2H, J = 5.6, Hz), 3.52 (br. s, 2H) and 1.28 (s, 9H); 13C NMR (125.7 MHz, CDCl3): δ 164.8, 162.0, 134.0, 131.3, 127.0, 122.5, 39.8, 34.4, 28.4, 28.1. Anal. Calcd for C19H20N2O4: C 67.05, H 5.92, N 8.23. Found: C 67.00, H 5.96, N 8.17.
2.3.2 Synthesis of tert-butyl (2-(6-nitro-1,3-dioxo-1H-benzo[de]isoquinolin-2(3H)-yl)ethyl)carbamate (9)
Following the same procedure adopted for the synthesis of compound 8, the titled compound 9 was obtained from the reaction of compound 5 (1.0 g, 6.2 mmol) and 7 (1.37 g, 5.6 mmol) as a brown solid (2.03 g, 90%), m.p. 184–185 °C (Loving and Imperiali, 2009).
2.3.3 Synthesis of 2-(1,3-dioxo-1H-benzo[de]isoquinolin-2(3H)-yl)ethan-1-aminium TFA salt (10)
To a solution compound 8 (0.50 g, 1.4 mmol) in CH2Cl2 (8 mL) was added trifluoroacetic acid (8.0 mL) dropwise at room temperature. The mixture was stirred overnight and volatiles were then evaporated under reduced pressure to obtain a brown thick oil, which was crystallized from diethyl ether to produce the desired 10 as a white solid (0.46 g, 92%), m.p. 212–213 °C. IR (KBr): 3439, 3064, 2923, 1685, 1659, 1594, 1514, 1438, 1387, 1350, 1249, 1204, 1174, 1141, 1092, 1027, 894, 841, 782, 722 cm−1. 1H NMR (400 MHz, d6-DMSO): δ 8.48–8.44 (m, 4H), 7.96 (s, 2H), 7.86 (t, 2H, J = 8.0 Hz), 4.31 (s, 2H), 3.39 (br. s, 1H), 3.16 (s, 2H); 13C NMR (125.7 MHz, d6-DMSO): δ 167.5, 163.1, 139.3, 134.9, 132.2, 128.3, 122.2, 73.8, 71.6. Anal. Calcd for C16H13F3N2O4: C 54.24, H 3.70, N 7.91. Found: C 54.17, H 3.77, N 7.80.
2.3.4 2-(2-aminoethyl)-6-nitro-1H-benzo[de]isoquinoline-1,3(2H)-dione TFA salt (11)
The title compound was synthesized according to the synthesis of procedure of compound 10. Brown solid (0.55 g, 91%), m.p. 211–212 °C (Yoon et al., 2021).
2.3.5 Synthesis of bis(quinolin-2-ylmethyl)carbamic acid (14)
Ester 13 (0.6 g, 1.68 mmol) was dissolved in a mixture of methanol and water (1:2 v/v, 12 mL) and 1 M sodium hydroxide (10 mL, 10.0 mmol) was added at room temperature. The reaction was allowed to stir for overnight. Upon completion of the reaction, the solvent was evaporated, and crude was purified through column chromatography, eluting with methanol-chloroform (5:95). Dark black oil (0.48 g, 84.0%), IR (KBr): 3429, 3064, 2372, 1961, 1729, 1647, 1597, 1505, 1466, 1505, 1466, 1427, 1376, 1211, 1144, 1114, 1045, 964, 876, 836, 755, 624 and 525 cm−1. 1H NMR (400 MHz, CDCl3): δ 8.16 (d, 2H, J = 8.4 Hz), 8.06 (d, 2H, J = 8.4 Hz), 7.72 (q, 4H, J = 8.5 Hz), 7.51 (t, 4H, J = 7.0), 4.27 (s, 4H), 3.2 (s, 2H); 13C NMR (125.7 MHz, CDCl3): δ 174.3, 157.4, 146.6, 137.6, 131.1, 128.1, 127.6, 126.8, 121.0, 59.7, 50.6. Anal. Calcd for C22H19N3O2: C, 73.93; H, 5.36; N, 11.76; O, 8.95. Found: C 54.17, H 3.77, N 7.80.
2.3.6 Synthesis of chemosensor (1)
To a stirred solution of mixture of compound 10 (0.20 g, 0.83 mmol) and 12 (0.19 g, 0.73 mmol) in DMF (10 mL) was sequentially added hydroxybenzotriazole (0.17 g, 1.2 mmol), N-(3-dimethylaminopropyl)-N′-ethylcarbodiimide hydrochloride (0.32 g, 1.6 mmol) and N,N-diisopropylethylamine (1.3 mL, 6.6 mmol) dropwise and the reaction was then stirred overnight at room temperature. The reaction mixture was diluted with ethyl acetate (10 mL) and washed with H2O (10 mL) and brine (3 × 10 mL). The organic layer was dried over Na2SO4 and evaporated under reduced pressure to obtain a light brown residue, which was resolved over silica column eluting with 2:98 (methanol:chloroform) to obtain the desired product 1 as a dark brown gummy oil (0.30, 86%). IR (KBr): 3428, 2924, 5823, 1696, 1658, 1590, 1438, 1383, 1346, 1237, 1184, 1093, 1051, 850, 780 cm−1. 1H NMR (400 MHz, CDCl3): δ 9.30 (d, 1H), 8.39 (d, 2H, J = 7.2 Hz), 8.19 (d, 2H, J = 4.4 Hz), 8.09 (d, 2H, J = 8 Hz), 7.61 (t, 3H, J = 8 Hz), 7.35 (t, 2H, J = 7.6 Hz), 7.12 (d, 2H, J = 7.6 Hz), 6.82 (t, 2H, J = 5.6 Hz), 4.41 (t, 2H, J = 4.8 Hz), 3.76 (br. s, 6H), 3.30 (s, 2H); 13C NMR (125.7 MHz, CDCl3): δ 171.7, 164.3, 157.7, 148.3, 136.8, 133.7, 131.4, 130.9, 127.9, 126.7, 123.2, 122.5, 122.0, 59.8, 58.1, 39.8, 37.7. Anal. Calcd for C28H25N5O3: C 70.13, H 5.26, N 14.60. Found: C 70.02, H 5.35, N 14.50.
2.3.7 Synthesis of chemosensor (2)
Chemosensor 2 was synthesized from the reaction of compounds 11 and 12, according to the procedure adopted for the synthesis of 1. Dark brown gum (0.29 g, 79%). IR (KBr): 3437, 2924, 2853, 1658, 1531, 1438, 1382, 1344, 1235, 1094, 728 cm−1. 1H NMR (400 MHz, CDCl3): δ 9.30 (d, 1H), 8.39 (d, 2H, J = 7.2 Hz), 8.19 (d, 2H, J = 4.4 Hz), 8.09 (d, 2H, J = 8.0 Hz), 7.61 (t, 3H, J = 8.0 Hz), 7.35 (t, 2H, J = 7.6 Hz), 7.12 (d, 2H, J = 7.6 Hz), 6.82 (t, 2H, J = 5.6 Hz), 4.41 (t, 2H, J = 4.8 Hz), 3.76 (br. s, 6H), 3.30 (s, 2H); 13C NMR (125.7 MHz, CDCl3): δ 172.0, 158.5, 148.8, 137.3, 132.3, 130.4, 129.9, 129.4, 127.5, 124.4, 123.6, 122.6, 59.8, 54.9, 54.3, 40.2, 37.5. Anal. Calcd for C28H24N6O5: C 64.12, H 4.61, N 16.02. Found: C 64.06, H 4.67, N 16.95.
2.3.8 Synthesis of chemosensor (3)
Chemosensor 3 was synthesized from the reaction of compounds 10 and 13, according to the procedure adopted for the synthesis of 1. Dark brown gum (0.35 g, 83%). IR (KBr): 3433, 2924, 2854, 1964, 1656, 1591, 1504, 1436, 1383, 1344, 1234, 1182, 1113, 1051, 842, 779, 726 cm−1. 1H NMR (400 MHz, CDCl3): δ 10.08 (t, 1H, J = 5.6 Hz), 8.09 (d, 2H, J = 7.2 Hz), 7.84 (t, 4H, J = 8.8 Hz), 7.60 (d, 2H, J = 8.4 Hz), 7.45 (t, 2H, J = 2.4 Hz), 7.41 (t, 4H, J = 8.8 Hz), 7.285 (t, 4H, 6.4 Hz), 7.14 (d, 2H, J = 8.4 Hz), 4.42 (d, 2H, J = 4.8 Hz), 4.04 (s, 4H), 3.90 (d, 2H, J = 4 Hz) and 3.53 (s, 2H); 13C NMR (125.7 MHz, CDCl3): δ 171.4, 164.3, 157.6, 139.3, 138.7, 134.1, 133.4, 131.4, 131.2 131.0, 130.6, 129.6, 129.0, 128.1, 127.8, 127.4, 127.0, 126.8, 12.5, 125.9, 122.0, 121.5, 119.4, 59.5, 59.1, 45.8, 40.0, 39.5, 38.1. Anal. Calcd for C36H29N5O3: C 74.59, H 5.04, N 12.08. Found: C 74.52, H 5.11, N 12.00.
3 Results and discussion
3.1 Synthesis of chemosensors
The synthesis of the designed chemosensors commenced with the N-Boc protection of hydrazine 1 to yield 2, which was subsequently condensed with 1,8-naphthalic anhydride 6 and 7 under refluxing ethanol to produce intermediates 8 (Devi and Sarma, 2017) and 9 (Loving and Imperiali, 2009), respectively, in high yields. Exposure of intermediates 8 and 9 to trifluoroacetic acid in dichloromethane then furnished the desired key intermediates 10 (Devi and Sarma, 2017) and 11 (Shen et al., 2018), respectively. Next, amidation of intermediate 10 with acids 12 (Waheed et al., 2020a) and 14 rendered fluorescent probes 1 and 3, respectively, in high yields. Likewise, amidation of intermediate 11 with acid 10 under standard conditions readily provided probe 2 in 79%. (Scheme 1).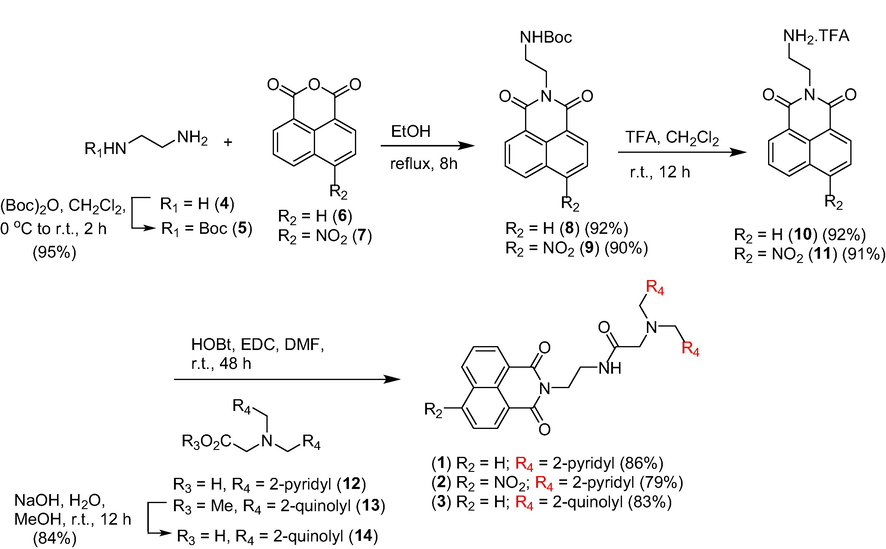
Synthesis of intermediates and chemosensors 1–3.
3.2 Characterization of chemosensors (1–3) as Zn2+ sensor
Initially, responses of sensors 1–3 to different concentrations of Zn2+ were screened in both DMSO and CH3CN, due to their solubilities in these solvents. Nevertheless, responses of sensors 1–3 to the addition of 1 equiv. of Zn2+ in either DMSO or CH3CN were almost similar. Therefore, CH3CN was chosen as a solvent medium for further sensing studies. The sensors responses to different zinc ions concentrations were measured by zinc titration experiments in the CH3CN medium. The absorption spectra of the neat sensors 1–3 exhibited intense and sharp bands at around 220, 230, and 219 nm, respectively. The absorption spectrum of 1 displayed very weak and broad absorption bands at 263 and 332 nm. Similalrly, absorption spectra of 2 and 3 showed weak and broad bands at around 345 and 329 nm, respectively (Figs. S2-S4). However, upon gradual addition of Zn2+ (0.0–2.0 equiv.) to the solutions of 1–3 led to increase in the absorption’s maxima until the addition of 1.0 equiv. of Zn2+. Afterwards, no appreciable alteration in the absorption intensity was realized up to the addition of 2.0 equiv. of Zn2+. These observations suggested that addition of Zn2+ to the solutions of sensors 1–3 resulted in the formation of new species through the coordination of Zn2+ to the receptor, which led to the electron rearrangement in sensors 1–3 (Figs. S2-S4) (Waheed et al., 2020b). The sensing performance of these sensors was also invistigated by studying their flourescence properties in CH3CN/HEPES (1:1, v/v) (Fig. 3). The neat 1 (50 µM in CH3CN) displayed two weak emission bands at around 392 nm and 550 nm when excited at 350 nm. However, upon gradual addition of Zn2+ (0.0–2.0 equiv.) (50 µM in HEPES buffer, pH = 7.4), the band around at 550 nm was gradually disappeard whereas the intensity of emission bands at 392 nm was kept increasing with increase in Zn2+ concentration. A 3-fold enhancement in the fluorescence intensity was realized until saturation i.e., addition of 1.0 equiv. Zn2+ (Fig. 3a). However, the fluorescence intensity was remained almost plateaued after the addition of >1.0 equiv. of Zn2+ (Fig. S5). Similarly, Zn2+ sensing performance of sensors 2 and 3 was also investigated. The emission spectrum of neat 2 displayed band at around 394 nm, whereas neat 3 showed bands at around 392 and 428 nm. The fluorescence intensity of these bands gradually increased with increase in Zn2+ concentration (Fig. 3b & b).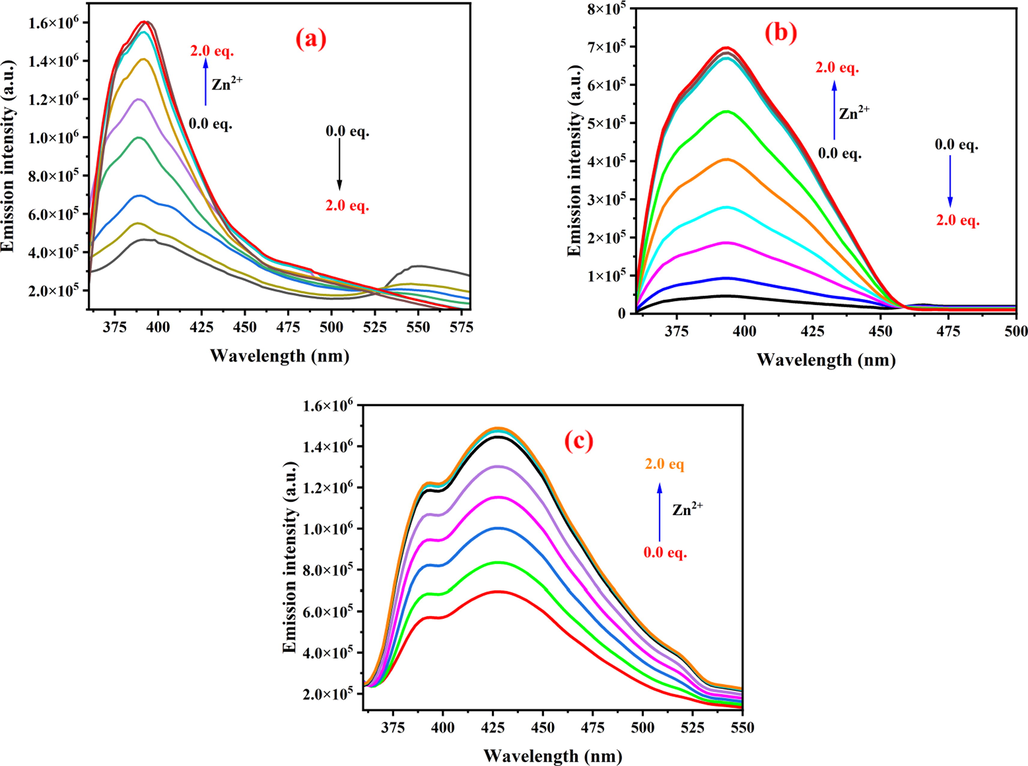
The emission spectra of sensors 1–3 (50 µM in CH3CN): a) 1 (λex = 350 nm), b) 2 (λex = 350 nm), and c) 3 (λex = 350 nm) upon addition of 0.0–2.0 equiv. of Zn2+ (50 µM in HEPES buffer, pH = 7.4).
The titration experiment revealed a 14-folds and 2.5-folds enhancement in the fluorescence emission when 1.0 equiv. of Zn2+ was added to the solutions of 2 and 3, respectively (Figs. S6 & S7). Any further addition of Zn2+ did not lead to any appreciable increase in the intensity of the emission bands of sensors 2 and 3. The above observations suggested that the fluorescence of sensors 1–3 quenched due to the photoinduced electron transfer (PET) from the electron donor to the excited fluorophore. Nevertheless, addition of increasing Zn2+ concentration caused the formation of sensor/ Zn2+ complex, which in turn prevented PET from occurring (Waheed et al., 2020b). By employing IUPAC method (Boali et al., 2018), the limit of detection (LOD) of sensors 1–3 was calculated to be 120, 81.7 and 79.2 nM, respectively. Likewise, the limits of quantification (LOQ) for 1–3 was found to be 370, 247.5 and 239.9 nM, respectively (Figs. S8-S10).
The fluorescence behavior of sensors 1–3 towards various metal ions (Cu2+, Cd2+, Mg2+, Mn2+, Pb2+, K1+, Fe3+, Co2+ and Cr2+) was monitored in HEPES buffer at pH = 7.4. As evident from Fig. 4, although addition of Zn2+ to the solutions of 1–3 caused significant fluorescence enhancements, the addition of other metal ions under identical conditions resulted in no fluorescence spectral changes or minor fluorescence enhancements. Apart from sensor 1 that displayed minor fluorescence enhancement upon addition of Cd2+, fluorescent sensors 2 and 3 were found to be insensitive to the studied other metals ions (Fig. 4).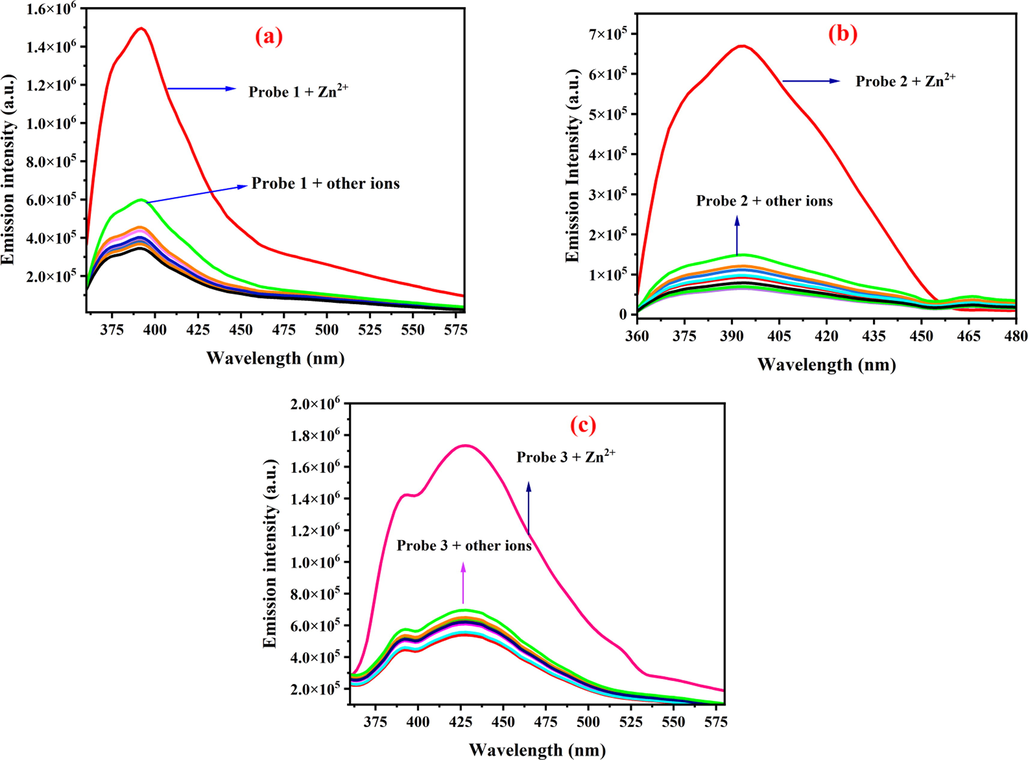
The fluorescence response of sensors 1–3 (50 µM in CH3CN): a) 1 (λex = 350 nm), b) 2 (λex = 350 nm), and c) 3 (λex = 350 nm) upon addition of various individual metal ions (50 µM) and Zn2+ (50 µM) in HEPES buffer, pH = 7.4.
To determine the selectivity of fluorescent sensors 1–3 for Zn2+ over other coexisting competitive metal ions, competitive fluorescence experiments were performed. Initially, the fluorescence response of sensors 1–3 (50 µM) with various metal cations (1.0 equiv., 50 µM) was studied. The black bars in Fig. 5 represent the relative fluorescence response of sensors 1–3 mixed with other metal cations. As evident, either no significant or minor fluorescence enhancements was observed. Thereafter, addition of Zn2+ (1.0 equiv., 50 µM) to the solutions of fluorescent sensors 1–3 in the presence of other ions resulted in enhanced emission intensities, a similar pattern to that of with Zn2+ alone. These results suggested that amide-DPA and amide-DQA receptors of sensors 1–3 exhibited high selectivity for the detection of Zn2+over other competitive metal ions in aqueous solution (Fig. 5).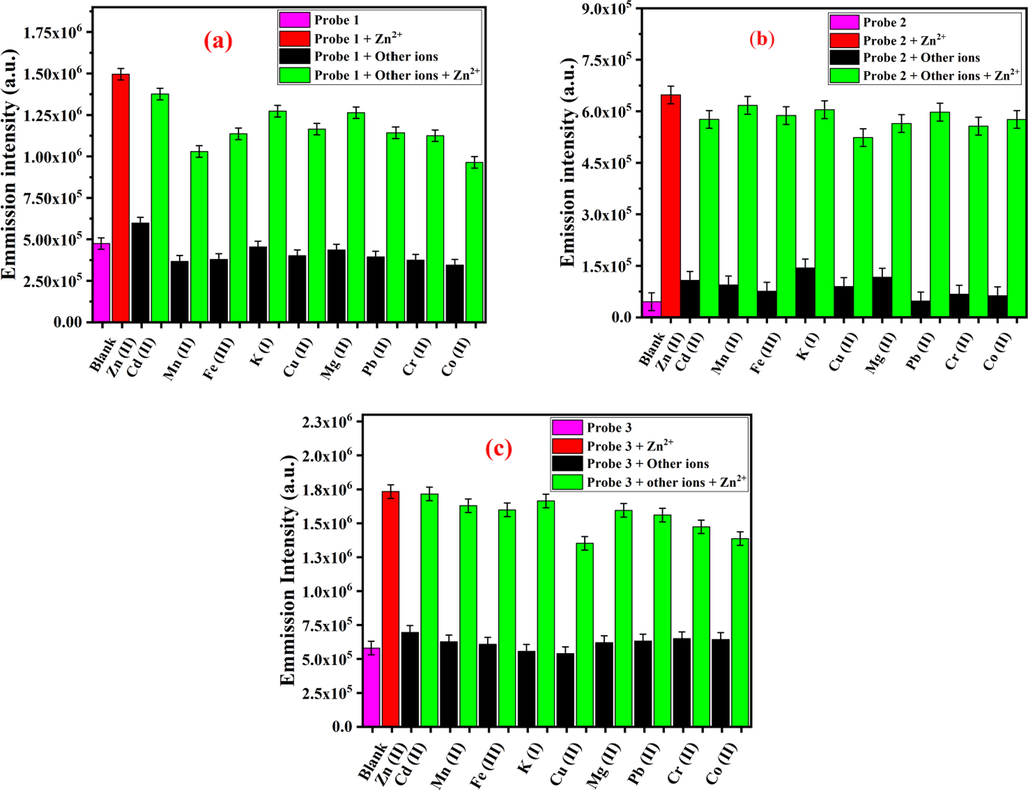
The fluorescence response of sensors 1–3 (50 µM in CH3CN): a) 1 (λex = 350 nm), b) 2 (λex = 350 nm), and c) 3 (λex = 350 nm) upon addition of various individual metal ions (50 µM) and Zn2+ (50 µM) in HEPES buffer, pH = 7.4.
In addition, the effect of pH on the fluorescence emission of sensors-Zn2+ complexes were studied in CH3CN/HEPES (1:1 v/v). The pH of solutions was varied from 3.5 to 10.5, using hydrochloric acid or sodium hydroxide to achieve the desired pH values. Over the pH range tested, the fluorescence intensity of sensors-Zn2+ complexes indicated strong pH dependence (Fig. S11). In the basic medium, the fluorescent intensity was substantially lowered, suggesting resumption of PET process from the electron donor (DPA and DQA) to the excited fluorophore (1,8-naphthalimide) owing to the conceivable generation of Zn2+ hydroxide (Waheed et al., 2020b). Likewise, relatively reasonable enhancement in the fluorescence intensity in acid medium (pH < 5) could be attributed to the protonation of DPA and DQA, which inhibited the PET process and thus resulting in the recovery of fluorescence of fluorophore. Moreover, sensors-Zn2+ complexes displayed relatively stable enhanced fluorescence intensity in the pH range of 6.5 to 8.0, suggesting the effective binding of sensors 1–3 with Zn2+ (Waheed et al., 2020b).
The stoichiometry and binding behavior sensors-Zn2+ complexes were studied by fluorescence titration test of sensors 1–3 with different Zn2+ concentrations in CH3CN/HEPES buffer (50:50, v/v) solution. The total concentration of sensors and Zn2+ at 50 µM. The Job’s plot analysis displayed a maximum emission at the 0.5 M fraction of Zn2+, suggesting 1:1 binding ratio between Zn2+ and the sensors 1–3 (Fig. S12). The binding behavior of sensors 1–3 with Zn2+ was also substantiated by monitoring through 1H NMR titration experiments. The 1H NMR spectra of neat 3 and sensor 3-Zn2+ complex in CD3CN revealed marked downfield shift of pyridine protons of DPA along with methylene protons attached to tertiary N (Fig. 6). This observation suggested that the N atoms of DPA and tertiary N atom were involved in Zn2+ coordination, which led to downfield shifts of the said signals owing to the deshielding effect of the metal ion. In a similar fashion, 1H NMR spectra of sensors 1 and 2 complexed with Zn2+ also revealed distinct variations in the resonance peaks for the pyridine protons of DPA as well as methylene protons attached to tertiary N (Fig. S13-S14).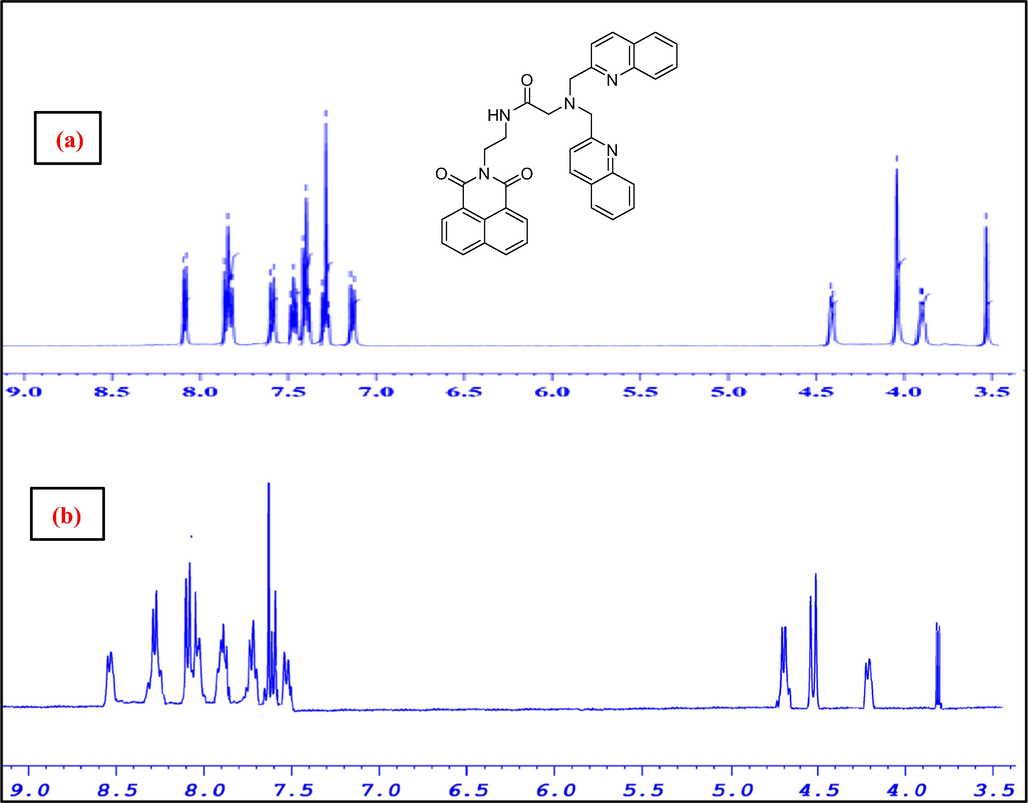
1H NMR (400 MHz, acetonitrile‑d3 of a) sensor 3 and b) sensor-3/Zn2+ complex from 3.4 to 9.1 ppm.
The PET mechanism of sensors 1–3 with Zn2+ can be explained as depicted in Fig. 7. In the absence of Zn2+, the HOMO of the unbound receptors (DPA and DQA) contains higher energy than the HOMO of the excited fluorophore. As a result, electron transfer from the receptor to the excited fluorophore readily occurs, which in turn quenches the fluorescence and thus resulting in weak fluorescence. Contrary, when DPA and DQA moieties bound to Zn2+, the HOMO of receptors gets lower in energy than the HOMO of excited fluorophore, which makes electron transfer energetically unfavorable and hence leading to the fluorescence “switch on”.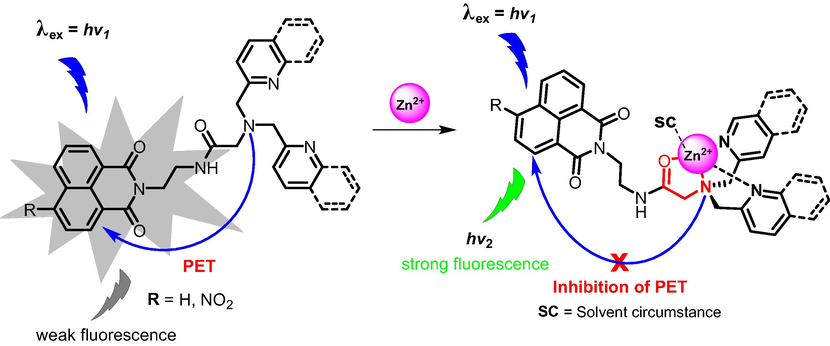
PET mechanism of sensors 1–3 with Zn2+.
Based on computational studies, coordination of amide function to Zn2+ through carbonyl oxygen instead of NH group was found to be more favorable. This was linked presumably due to the positively polarized H attached to N, which results in unfavorable repulsion with the positively charged Zn2+.
3.3 Computational studies
3.3.1 Zn2+ recognition and the frontier molecular orbitals (FMO)
DFT simulations were employed to elucidate the impact of Zn2+ on the fluorescence of the three new synthetized sensors. Seeking the most stable structures of the three sensors, we explored the conformational space using the GFN2-xTB method and the iMTD-GC algorithm implemented in the CREST code. Further geometrical optimizations were carried out on the extended (optimization without the CREST) and the stacked structures (predicted as the most stable conformer by CREST), using wB97xd1,2/6–31 + G(d,p) method. The stacked structures (Figs. 2 & 8) are predicted to be more stable than the extended ones.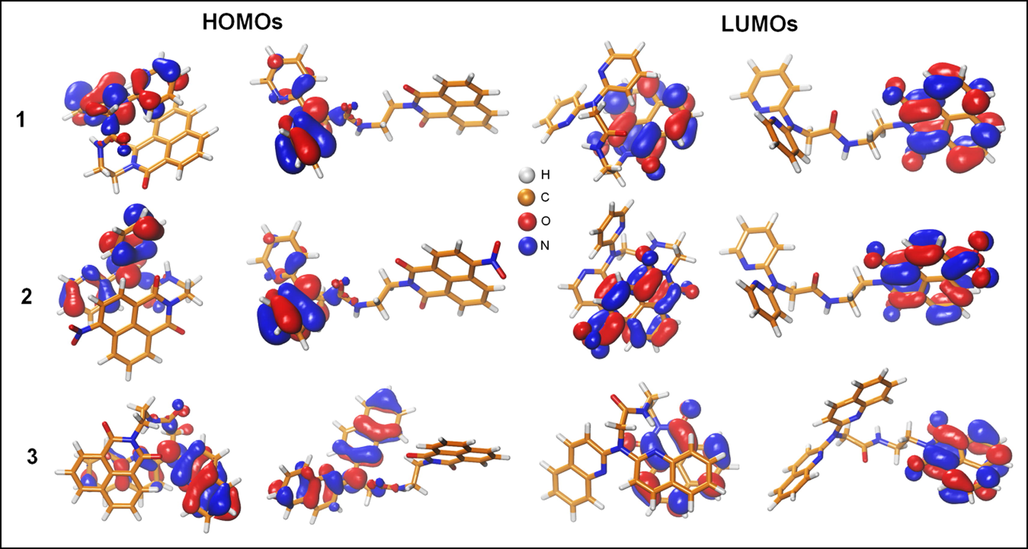
The frontier molecular orbitals (HOMOs & LUMOs) of chemosensors (1–3) considered in our molecular modeling study for the stacked and extended conformations. The isosurfaces of the FMO's electron density represented at 0.03 e/Å3 of resolution.
The relative free energies of the three sensors (1–3) were found to be −7.42, −7.62, and −11.10 kcal/mol, respectively. The stacked structure's stability is mainly due to the strong Van Der Waals (VDW) interactions between 1,8-naphthalimide and 4-nitro-1,8-naphthalimide with DPA and DQA moieties. Moreover, the presence of the NO2 group does not affect the stability of the stacked structure of sensor 2. However, 2-quinolyl groups in DQA further stabilize the stacked form in sensor 3. The FMO of these structures were examined to investigate the impact of the conformational changes on the electronic structure of these sensors. Within the FMOs of the three sensors, the electronic density of the highest occupied molecular orbital (HOMO) was found to be localized on DPA and DQA moieties whereas the density of the lowest unoccupied molecular orbitals (LUMOs) were localized on the 1,8-naphthalimide and 4-nitro-1,8-naphthalimide (Fig. 8). In addition, the bandgap of the sensors 1–3 did not change significantly upon the conformational changes from the extended to the stacked (compact) structures or by the chemical modifications from 1 to 3. Indeed, the bandgaps of sensors 1–3 for the extended form were determined to be 6.85, 6.20, 6.71 eV and for the stacked form were 6.82, 6.11, and 6.81 eV, respectively (Fig. 8).
Zn2+ binding energies were studies on both the stacked and extended structures. Zn2+ is pentacoordinate in the three complexes, four nitrogen atoms (two are solvent molecules) and one oxygen. The average bond distance was about 2.0 Å in both sacked and extended form structures. The metal binding energy calculations indicated significant preference to the favorable binding of Zn2+ by stacked conformation, especially in case of sensors 1 and 3 (Table 1).
Δ Egas
Δ ESol.
Δ ETotal.
1
−451.6 (−439.9)
357.0 (359.2)
−94.6 (−80.7)
2
−430.2 (−434.2)
348.0 (353.8)
−82.2 (−80.4)
3
−440.2 (−425.2)
358.8 (360.3)
−81.4 (−64.9)
FMOs of the Zn2+-sensor complexes were also examined to investigate the impact of Zn2+ on the FMOs of the three molecules. The electron density of HOMOs and LUMOs in the presence of Zn2+ was localized onto 1,8-naphthalimide and 4-nitro-1,8-naphthalimide and there was no contribution from DPA nor DQA except for the HOMO of complex 3 in the extended form. However, the HOMO-1 was completely localized on 1,8-naphthalimide and was found to be slightly more stable than the HOMO (the energy difference was only 0.19 eV, Fig. S16). Similarly, the bandgap does not change upon the conformational transition from the extended to the stacked form. Further, Zn+2 slightly increases the bandgap in sensor-Zn+2 complexes as compared to the free state due to stabilizing the HOMOs (Fig. 9). The bandgaps of the stacked complexes were found to be 7.50, 7.24, 7.40 eV and whereas for the extended they were determined to 7.51, 7.29, and 7.32 eV.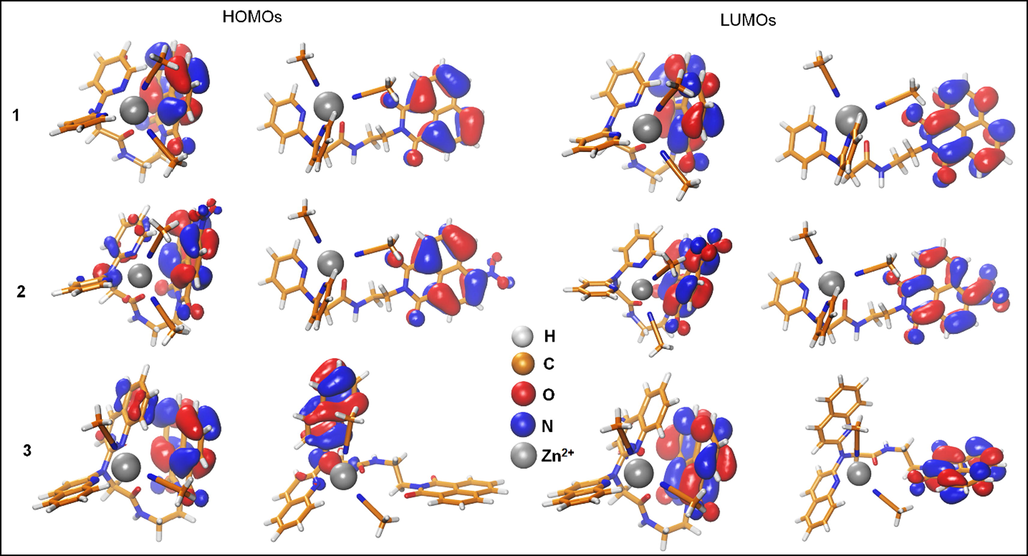
The frontier molecular orbitals (HOMOs & LUMOs) of the three Zn2+-chemosensors complexes in the two conformations (stacked and extended). The isosurfaces of the FMO's electron density are shown at 0.03 e/Å3.
3.3.2 The effect of Zn2+-binding on the UV–visible spectra
Time-dependent DFT (TDDFT) calculations were performed on the free sensors 1–3 and sensors-Zn2+ complexes to investigate their UV–visible absorbance spectra. The simulation of the UV–visible spectra was limited to the stacked conformations since they are more stable and exhibit higher binding preference for Zn2+. Thirty excited states altogether were calculated in the TD-DFT simulations. The calculated spectra of sensors 1–3 in the UV–visible range and the oscillator strength of different excited states are shown in Fig. 10. Sensors 1–3 displayed a broadband absorption in the range of 200–350 nm; the sensors displayed ƛmax at 214, 217, and 218 nm, respectively (Fig. 10a). The transitions originated from the intra-charge transfer of π → π* and π → π* types. Moreover, the electron withdrawing NO2 group does not affect the spectra of sensor 2. On the other hand, the spectra of free sensors (unbound) did not show any appreciable changes except the intensity of peak at 270 nm in the spectrum of sensor 3 was decreased. Furthermore, a shoulder peak at 246 nm was also appeared. There are no changes in the spectra of the three sensors in the unbound state except at 270 nm of the peak intensity of sensor 3 is decreased. However, a shoulder peak at 246 nm was also appeared (Fig. 10a). The effect of Zn2+-binding on the probability of transition at each excited state was also studied (Fig. 10b). The oscillator strength (ƒ) is a dimensionless factor that expresses the probability of the light absorbance upon electronic transitions at specific peak. In the unbound states, sensor 1 has important absorbance probabilities at 269.6, (0.37), 223.5, (0.14), 220.9, (0.31), and 209.4 nm (0.31) (Fig. 10b).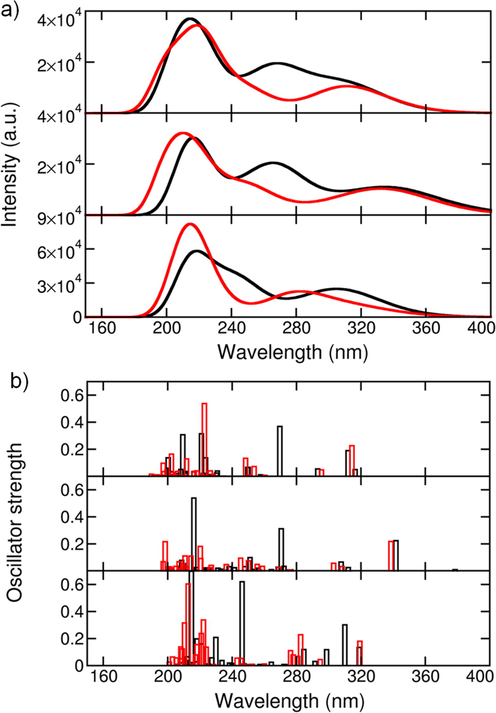
a) The UV–visible absorbance spectra of the three sensors in the unbound-(black) and Zn2+-bound states (red) and the stacked conformation, b) The oscillator strength of the different excited states of the three sensors.
The peaks at 220.9 and 209.4 nm involved the electronic transitions from the top valence and deep valence orbitals (HOMO-1, HOMO-2, HOMO-9, HOMO-10, HOMO-11, and HOMO-13) to the LUMO, and LUMO + 2 (Table S1). The densities of the LUMO and LUMO + 2 were either localized on 1,8-naphthalimide or delocalized over the entire molecule. The densities of the involved HOMOs in these transitions were mainly localized on 1,8-naphthalimide (Table S1). The highest ƒ values for sensor 2 were 0.54, located at 216.2 nm, and 0.31 located at 270.5 nm. The absorbance at 216.2 nm was mainly due to the multiple transitions with major contributions from HOMO-1, HOMO-5, and HOMO-10 to LUMO + 1, LUMO + 2, and LUMO + 4, respectively. The orbitals involved in these transitions were mainly localized on the 1,8-naphthalimide group, the peptide linker with very limited contributions from DPA, which explains the similarity between sensors 1 and 2 spectra (Table S1 & S3). Sensor 3 displayed a significant ƒ factor (0.62, ƛmax = 246.2 nm), mainly due to the transition from HOMO-1, HOMO-2, HOMO-3, HOMO-4 to LUMO + 1 LUMO + 2, LUMO + 5, respectively (Table S5). The HOMOs of this transition were localized on 1,8-naphthalimide (HOMO-1 & HOMO-2) and DQA (HOMO-3 & HOMO-4), while LUMOs are all localized on DQA. The latter provided more degenerate states that enhanced the probability of the electronic transitions compared to sensors 1 and 2. The energy separations from HOMO-1 to HOMO-4 was only 0.6 eV, and from LUMO + 1 to LUMO + 5 was 1.1 eV. Adding more π-electron density in sensor 3 increased the energy of HOMOs and lowers the energy of the LUMOs. The highest ƒ values of sensor 3 was found to be 0.70 at 214.7 nm, which involved mainly the electronic transitions from the HOMO to LUMO + 6. The HOMO was localized on 1,8-naphthalimide, whereas the LUMO + 6 was localized on DQA (Table S5). The main DQA contributions in the spectra of sensor 3 was significant compared to DPA in sensors 1 and 2.
Regarding the Zn2+-bound states, a slight blue-shift in the absorbance spectra of sensors 1–3 was observed, with a maximum shift in sensor 2 (Fig. 10a). The intensity of the absorbance peak at 269 nm was decreased in sensors 1 and 2 whereas red-shifted in sensor 3 to 280 nm. The notable impact of Zn2+ on the sensors spectra was evidenced by the generation of more excited states (Fig. 10b). The presence of Zn2+ leads to stabilizing the HOMOs and LUMOs states compared to the unbound states; the effect was persisting in all sensors (Fig. S17). However, the effect was more pronounced in the LUMOs energy levels. The energy differences between the LUMOs were squeezed compared to the unbound states (Fig. S17b). Focusing on sensor 1; the highest plausible excited state was located at ƛmax of 222.8 nm (ƒ = 0.54), with contributions from HOMO, HOMO-2, and deep valence HOMO-7 to LUMO and LUMO + 4 (Table S2). The densities of HOMO and HOMO-2 were localized on the 1,8-naphthalimide, while the HOMO-7 was delocalized on 1,8-naphthalimide and DPA. The LUMOs of this transition were also localized on 1,8-naphthalimide with minimum contributions from DPA. Upon Zn2+ binding, DPA started to contribute to the density of the HOMOs involved in the electronic transitions, which was presumably the reason for the improved intensities upon Zn2+-binding. Another important note was that the binding of Zn2+ led to electronic transitions from higher valence HOMOs (HOMO-7) compared to from the highly deep orbitals in the unbound state (HOMO-13). Similarly, in Zn2+-bound states, higher LUMOs (LUMO + 4) were involved in the electronic transition than in the unbound state (LUMO + 2).
In sensor 2, binding to Zn2+ increased the number of possible excited states with an average probability of ƒ = 0.2; however, the probabilities were lower than the unbound state. Focusing on the excited state at ƛmax of 220.2 nm, this transition involved HOMO, HOMO-1, and HOMO-4 to LUMO + 4, LUMO + 6, and LUMO + 2, respectively (Table S4). The transition from HOMO → LUMO + 4 mainly localized on 1,8-naphthalimide with a small contribution from one 2-pyridyl group. HOMO-1 → LUMO + 6 transition in which the entire molecule is involved. The transition HOMO-4 → LUMO + 6 was localized on DPA. A similar observation was applied in sensor 2; upon Zn2+ binding, higher HOMOs and LUMOs contributed to the electronic transitions. Also, DPA contributed to the electronic transition, which was very limited in the unbound state.
In sensor 3, the Zn2+-bound state exhibited more excited states with significant probabilities as compared sensors 1 and 2, which was mainly due to more π-electrons added to the system via the 2-quinolyl compared as compared to the 2-pyridyl group. Focusing on the state with the highest probability (ƒ = 0.60) at 212.9 nm, it involved the transitions HOMO → LUMO + 3/LUMO + 5, HOMO-1 → LUMO + 4, HOMO-2 → LUMO + 4, and HOMO-3 → LUMO + 3 (Table S6). The first transition was from PQA to 1,8-naphthalimide, and the remaining transitions were localized on the PQA. Inversely to the unbound state in which the LUMOs of the excited states were localized on DQA. Insertion of DQA with Zn2+ binding resulted in higher density of excited states with higher electronic coupling. A comparative analysis of sensors 1-3 with literature known chemosensors (Table 2) demonstrates the superiority of their sensing performance.
Sensor
LOD
Optimum reaction conditions
Sample
Ref.
Water soluble polymer
0.2 µM
Tris-HCl buffer solution (pH = 7.0)
Zebrafish and mice
(Wei et al., 2020)
Polyoxometalate based ionic salt [Himi]4 [SiMo12O40]
0.15 µM
DMSO-H2O (1:10, v/v)
---
(Sabarinathan et al., 2021)
Imino phenols based
16 µM
MeOH-H2O (99:01)
HeLa cells
(Tayade et al., 2014)
SMSB
0.5 µM
HEPES buffer with pH = 7.2 in CH3CN-H2O
Breast cancer cells
(Rahman et al., 2015)
AuNCs/Zn-MOF
660 µM
Hac-NaAc buffer pH = 6.5
Human serum, ZnSO4 syrup, tap water and milk
(Li et al., 2018)
MSNPs-base-IPTMS-hpbts
2.55 µM
Ethanolic solution
HEK293cell line
(Erami et al., 2018)
Bi/GO/GCE
6 µM
ASV in 0.10 mol L−1 acetate buffer solution at pH 5.00.
Human Seminal Fluid
(Seanghirun et al., 2020)
3-D printed carbon
8.6 µM
applied potential of −2.9 V (vs. C)
Tap Water
(Honeychurch et al., 2018)
BDDE
0.13 µM
Cyclic voltammetry using acetate buffer and H2SO4 as the supporting electrolytes
Pharmaceutical
(Oliveira et al., 2016)
Pyridyl/phenolic/benzothiazole functionalized ligand
0.357 µM
Ethanol-Water
(pH = 8.0)Bi-distilled water
(Panunzi et al., 2019)
1,8-napthylamide based
120 nM
81.7 nM and 79.2 nMHEPES buffer in CH3CN-H2O (1, 2 and 3)
Aqueous solution
This work
4 Conclusion
In conclusion, we have synthesized three new fluorescent sensors (1–3) for the detection of Zn2+ in aqueous solution. Addition of Zn2+ led to up to 14-fold enhancement in the fluorescence intensity due to the inhibition of PET process. At physiological pH, these sensors exhibited high sensitivity and selectivity for Zn2+ over other competing cations, with LODs of 120, 81.7 and 79.2 nM, respectively. This implies that sensors (1–3) could be used for the detection of chronic Zn2+ concentration for freshwater (>1.84 μM), designated by the U.S. Environmental Protection. DFT calculation performed on the stacked conformations of unbound and Zn2+ bounded sensors revealed that the latter exhibited a better binding preference for Zn2+. Moreover, it displayed a higher density of excited states than the unbound sensors. The Zn2+ binding leads to FMO stabilizations that results in enhancing the electronic coupling between the HOMOs and LUMOs, which makes excited states more populated. These excited states then undergo geometric relaxation before emitting light and relaxing back to the ground states. In addition, the Zn2+ orbitals are localized deep in the energy levels; the energy separation between the HOMO and the first Zn2+ d-orbital in sensors 1–3 were determined to be 5.0 eV, 6.6 eV, and 6.9 eV, respectively. It was observed that the closer the Zn2+ orbitals to the FMO, the significant was its impact on the spectra. Indeed, in sensor 3, the density of the generated states and the intensity upon Zn2+ binding was higher than as compared to in sensors 1 and 2, without almost notable changes in the bandgaps. Further, the insertion of DQA contributes significantly to the spectra upon binding with Zn2+.
Acknowledgements
The financial support from KFUPM project # DF181029 is gratefully acknowledged.
Declaration of Competing Interest
The authors declare that they have no known competing financial interests or personal relationships that could have appeared to influence the work reported in this paper.
References
- Fluorescence sensor for sequential detection of zinc and phosphate ions. Spectrochim. Acta - Part A Mol. Biomol. Spectrosc.. 2016;169:87-94.
- [CrossRef] [Google Scholar]
- A new coumarin based Schiff base fluorescence probe for zinc ion. Tetrahedron. 2021;88:132127
- [CrossRef] [Google Scholar]
- The synthesis of luminescent lanthanide-based chemosensors for the detection of zinc ions. Tetrahedron. 2014;70:4367-4372.
- [CrossRef] [Google Scholar]
- Extended tight-binding quantum chemistry methods. Wiley Interdiscip. Rev. Comput. Mol. Sci.. 2021;11:e1493
- [CrossRef] [Google Scholar]
- GFN2-xTB - An accurate and broadly parametrized self-consistent tight-binding quantum chemical method with multipole electrostatics and density-dependent dispersion contributions. J. Chem. Theory Comput.. 2019;15:1652-1671.
- [CrossRef] [Google Scholar]
- Zinc, copper and selenium in reproduction. Experientia. 1994;50:626-640.
- [CrossRef] [Google Scholar]
- The galvanization of biology: A growing appreciation for the roles of zinc. Science 1996
- [CrossRef] [Google Scholar]
- Synthesis and selective colorimetric detection of iodide ion by novel 1,5-naphthyridine-based conjugated polymers. J. Taiwan Inst. Chem. Eng.. 2018;91:420-426.
- [CrossRef] [Google Scholar]
- Fluorescent indicators based on BODIPY. Chem. Soc. Rev.. 2012;41:1130-1172.
- [CrossRef] [Google Scholar]
- B97–3c: A revised low-cost variant of the B97-D density functional method. J. Chem. Phys.. 2018;148:064104
- [CrossRef] [Google Scholar]
- Fluorescent determination of zinc by a quinoline-based chemosensor in aqueous media and zebrafish. Spectrochim. Acta - Part A Mol. Biomol. Spectrosc.. 2019;219:74-82.
- [CrossRef] [Google Scholar]
- Systematic optimization of long-range corrected hybrid density functionals. J. Chem. Phys.. 2008;128:084106
- [CrossRef] [Google Scholar]
- A general strategy to develop cell membrane fluorescent probes with location- And target-specific fluorogenicities: A case of a Zn2+ probe with cellular selectivity. Chem. Commun.. 2019;55:15045-15048.
- [CrossRef] [Google Scholar]
- Naphthalimide-containing isomeric urea derivatives: mechanoluminescence and fluoride recognition. ChemPhotoChem. 2017;1:524-531.
- [CrossRef] [Google Scholar]
- Self-consistent molecular orbital methods. XV. Extended Gaussian-type basis sets for lithium, beryllium, and boron. J. Chem. Phys.. 1975;62:2921-2923.
- [CrossRef] [Google Scholar]
- Visual detection and revisable supermicrostructure sensor systems of Cu(II) analytes. Sensors Actuators, B Chem.. 2012;166–167:253-263.
- [CrossRef] [Google Scholar]
- Applications of nanomaterials based on magnetite and mesoporous silica on the selective detection of zinc ion in live cell imaging. Nanomaterials. 2018;8:434.
- [CrossRef] [Google Scholar]
- Design, synthesis and sensor activity of a highly photostable blue emitting 1,8-naphthalimide. J. Lumin.. 2012;132:2235-2241.
- [CrossRef] [Google Scholar]
- Ni(II), Cu(II), and Zn(II) cryptate-enhanced fluorescence of a trianthrylcryptand: A potential molecular photonic OR operator. J. Am. Chem. Soc.. 1996;118:1553-1554.
- [CrossRef] [Google Scholar]
- Exploration of chemical compound, conformer, and reaction space with meta-dynamics simulations based on tight-binding quantum chemical calculations. J. Chem. Theory Comput.. 2019;15:2847-2862.
- [CrossRef] [Google Scholar]
- Semiempirical GGA-type density functional constructed with a long-range dispersion correction. J. Comput. Chem.. 2006;27:1787-1799.
- [CrossRef] [Google Scholar]
- Anodic stripping voltammetric determination of zinc at a 3-D printed carbon nanofiber–graphite–polystyrene electrode using a carbon pseudo-reference electrode. Sensors Actuators, B Chem.. 2018;267:476-482.
- [CrossRef] [Google Scholar]
- New pyrazolo-quinoline scaffold as a reversible colorimetric fluorescent probe for selective detection of Zn2+ ions and its imaging in live cells. J. Photochem. Photobiol. A Chem.. 2017;341:136-145.
- [CrossRef] [Google Scholar]
- Imaging synaptic zinc: promises and perils. Trends Neurosci.. 2006;29:200-206.
- [CrossRef] [Google Scholar]
- Developing a new chemosensor targeting zinc ion based on two types of quinoline platform. Spectrochim. Acta - Part A Mol. Biomol. Spectrosc.. 2020;241:118652
- [CrossRef] [Google Scholar]
- An anthracene-based fluorescent sensor for sequential detection of zinc and copper ions. Inorg. Chem. Commun.. 2014;39:61-65.
- [CrossRef] [Google Scholar]
- A fluorescent chemosensor for Hg 2+ based on naphthalimide derivative by fluorescence enhancement in aqueous solution. Anal. Chim. Acta. 2012;717:122-126.
- [CrossRef] [Google Scholar]
- Simple, rapid and label-free colorimetric assay for Zn2+ based on unmodified gold nanoparticles and specific Zn2+ binding peptide. Chem. Commun.. 2011;47:4412-4414.
- [CrossRef] [Google Scholar]
- Unconventional application of gold nanoclusters/Zn-MOF composite for fluorescence turn-on sensitive detection of zinc ion. Anal. Chim. Acta. 2018;1024:145-152.
- [CrossRef] [Google Scholar]
- A 1,8-naphthalimide-based fluorescent sensor with high selectivity and sensitivity for Hg2+ in aqueous solution and living cells. Anal. Methods. 2019;11:3150-3154.
- [CrossRef] [Google Scholar]
- An efficient quinoline-based fluorescence sensor for zinc(II) and its application in live-cell imaging. Sensors Actuators, B Chem.. 2016;234:616-624.
- [CrossRef] [Google Scholar]
- Thiol-reactive derivatives of the solvatochromic 4-N, N-dimethylamino-1,8- naphthalimide fluorophore: A highly sensitive toolset for the detection of biomolecular interactions. Bioconjug. Chem.. 2009;20:2133-2141.
- [CrossRef] [Google Scholar]
- Frisch, M.J., Trucks, G.W., Schlegel, H.B., Scuseria, G.E., Robb, M.A., Cheeseman, J.R., et al., 2016. Gaussian 09 Citation [WWW Document]. Gaussian 09, Revis. A.02, Gaussian, Inc. URL http://www.gaussian.com/g_tech/g_ur/m_citation.htm
- A unique water-tuning dual-channel fluorescence-enhanced sensor for aluminum ions based on a hybrid ligand from a 1,1′-binaphthyl scaffold and an amino acid. Chem. - A Eur. J.. 2010;16:10313-10318.
- [CrossRef] [Google Scholar]
- Terpyridine derivatives as “turn-on” fluorescence chemosensors for the selective and sensitive detection of Zn2+ ions in solution and in live cells. Photochem. Photobiol. Sci.. 2018;17:1068-1074.
- [CrossRef] [Google Scholar]
- A batch injection analysis system with square-wave voltammetric detection for fast and simultaneous determination of naphazoline and zinc. Talanta. 2016;152:308-313.
- [CrossRef] [Google Scholar]
- Fluorescence pH-dependent sensing of Zn(II) by a tripodal ligand. A comparative X-ray and DFT study. J. Lumin.. 2019;212:200-206.
- [CrossRef] [Google Scholar]
- Generalized gradient approximation made simple. Phys. Rev. Lett.. 1996;77:3865-3868.
- [CrossRef] [Google Scholar]
- Automated exploration of the low-energy chemical space with fast quantum chemical methods. Phys. Chem. Chem. Phys.. 2020;22:7169-7192.
- [CrossRef] [Google Scholar]
- A Robust Non-Self-Consistent Tight-Binding Quantum Chemistry Method for large Molecules. ChemRxiv 2019:1-19.
- [Google Scholar]
- Methionine-derived Schiff base as selective fluorescent “turn-on” chemosensor for Zn2+ in aqueous medium and its application in living cells imaging. Sensors Actuators, B Chem.. 2015;211:544-550.
- [CrossRef] [Google Scholar]
- 6–31G* basis set for atoms K through Zn. J. Chem. Phys.. 1998;109:1223-1229.
- [CrossRef] [Google Scholar]
- Polyoxometalate based ionic crystal: dual applications in selective colorimetric sensor for hydrated ZnCl2 and antimicrobial activity. New J. Chem.. 2021;45:5576-5588.
- [CrossRef] [Google Scholar]
- Continuous surface charge polarizable continuum models of solvation. I. General formalism. J. Chem. Phys.. 2010;132:114110
- [CrossRef] [Google Scholar]
- Green electrochemical sensor for Zn(II) ions detection in human seminal fluid. Microchem. J.. 2020;157:104958
- [CrossRef] [Google Scholar]
- Modification of the Thioglycosyl-Naphthalimides as Potent and Selective Human O-GlcNAcase Inhibitors. ACS Med. Chem. Lett.. 2018;9:1241-1246.
- [CrossRef] [Google Scholar]
- An efficient and sensitive chemosensor based on salicylhydrazide for naked-eye and fluorescent detection of Zn2+. RSC Adv.. 2018;8:6727-6732.
- [CrossRef] [Google Scholar]
- Accumulation of zinc from diet and its release in common carp. Fish Physiol. Biochem.. 1999;20:313-324.
- [CrossRef] [Google Scholar]
- A fluorescent “turn-on” sensor for the biologically active Zn2+ ion. Inorg. Chim. Acta. 2014;421:538-543.
- [CrossRef] [Google Scholar]
- Hydrogel-based zinc ion sensor on optical fiber with high resolution and application to neural cells. Biosens. Bioelectron.. 2020;162:112230
- [CrossRef] [Google Scholar]
- Quinoline benzimidazole-conjugate for the highly selective detection of Zn(ii) by dual colorimetric and fluorescent turn-on responses. RSC Adv.. 2015;5:44463-44469.
- [CrossRef] [Google Scholar]
- Design and synthesis of two new terbium and europium complex-based luminescent probes for the selective detection of zinc ions. Luminescence. 2020;35:1238-1247.
- [CrossRef] [Google Scholar]
- A Highly Sensitive and Selective Fluorescent Sensor for Zinc(II) Ions Based on a 1,2,3-Triazolyl-Functionalized 2,2’-Dipicolylamine (DPA) ChemistrySelect. 2020;5:5300-5305.
- [CrossRef] [Google Scholar]
- Fluorescein-based chromo-fluorescent probe for zinc in aqueous solution: Spirolactam ring opened or closed? Sensors Actuators, B Chem.. 2014;201:246-254.
- [CrossRef] [Google Scholar]
- Dual-functional chemical sensor for sensitive detection and bioimaging of Zn2+ and Pb2+ based on a water-soluble polymer. Org. Electron.. 2020;82:105711
- [CrossRef] [Google Scholar]
- Zn2+: A novel ionic mediator of neural injury in brain disease. Trends Pharmacol. Sci.. 2000;21:395-401.
- [CrossRef] [Google Scholar]
- General orbital invariant MP2-F12 theory. J. Chem. Phys.. 2007;126:164102
- [CrossRef] [Google Scholar]
- Single chemosensor for multiple analytes: Chromogenic and fluorogenic detection for fluoride anions and copper ions. Tetrahedron Lett.. 2012;53:2026-2029.
- [CrossRef] [Google Scholar]
- Self-Calibrating Bipartite Fluorescent Sensor for Nitroreductase Activity and Its Application to Cancer and Hypoxic Cells. ACS Appl. Bio Mater.. 2021;4:2052-2057.
- [CrossRef] [Google Scholar]
- A selective and sensitive peptide-based fluorescent chemical DSH sensor for detection of zinc ions and application in vitro and in vivo. New J. Chem.. 2019;43:3071-3077.
- [CrossRef] [Google Scholar]
Appendix A
Supplementary material
Supplementary data to this article can be found online at https://doi.org/10.1016/j.arabjc.2022.104002.
Appendix A
Supplementary material
The following are the Supplementary data to this article:Supplementary data 1
Supplementary data 1


