

Translate this page into:
Titania nanotubes (TNTs) prepared through the complex compound of gallic acid with titanium; examining photocatalytic degradation of the obtained TNTs
⁎Corresponding author. yahyaabsalan2014@gmail.com (Yahya Absalan)
-
Received: ,
Accepted: ,
This article was originally published by Elsevier and was migrated to Scientific Scholar after the change of Publisher.
Peer review under responsibility of King Saud University.
Abstract
Abstract
Synthesis, for the first time, complex compound of gallic acid with Ti(IV). Synthesis anatase and rutile TiO2 phase at low temperature through thermal decomposing of the obtained complex. Accurate investigation of the possibility to obtain TiO2 nanotube (TNT) from nano-particles of spherical shapes. Test the photocatalytic degradation of the obtained anatase, rutile, and TNTs.
Abstract
It was for the first time that the complex compound of gallic acid with titanium (IV) salt was used as a precursor to synthesize titania nanotubes. The study was separated into four main sections; (I) synthesizing the complex of titanium with gallic acid, (II) synthesizing anatase and rutile phases through thermal decomposing of the complex, (III) investigating the possibility to synthesize titania nanotubes from the rutile and anatase phases, and (IV) photocatalytic ability of all the nanoparticles.
Different methods were applied to analysis, including X-ray diffraction, 1H NMR, FT-IR spectroscopy, elemental analysis, quantum-chemical modeling, Raman spectroscopy, thermal analysis, photoluminescence, BET analysis (to investigate the specific surface activity, total pore volume), EDX, electron microscopy (SEM), acceleration voltages, electrical conductivity, BJH method (to determine average pore diameter), and UV-Vis spectroscopy.
We illustrated the possibility of the synthesis of the titania nanotubes from the anatase phase, while rutile phase was not turned to a tube shape.
The photocatalytic ability of the obtained nanoparticles was tested by degrading bromophenol blue, as an organic pollutant, under weak light. TiO2 in the form of nanotubes could reduce the concentration of bromophenol blue to 82%, as well as the rutile phase - to 70%, and finally anatase as nan-spheres to 36%.
Keywords
Anatase
Rutile
Nanotube
Photocatalyst
Complex compound
Gallic acid

1 Introduction
TiO2 is one of the most proper and popular semiconductors which is used for different applications such as pigment, thin film, sunscreen and UV blocking pigments, and photocatalyst, etc (Ahmadvand et al., 2019; Ponnusamy et al., 2018; Pinilla et al., 2018; Qiu et al., 2018; Shayegan et al., 2018). On the other hand, nanoparticles became so attractive and applicable, in different areas, due to having some especial and distinguished parameters, including size, structure, and shape. These parameters indeed, effect on the optical, electrical, and magnetic properties of nanoparticles (Albanese et al., 2012; Absalan et al., 2018a, 2018b). Depending on the shape, the properties of nanoparticles are changed remarkably and it has opened a promising window in different scientific subjects such as chemistry and physics (Farvadi et al., 2018). There are different shapes of nanoparticles, such as fibers, rings, tubes, spheres, and plates, which would certainly help towards implementation of safer nanotechnology based systems (Gatoo et al., 2014; Absalan et al., 2017, 2019; Xu et al., 2019).
Among all shapes, nanotubes, have their own and unique properties. They have a well-known shape, which is applied in electronic and mechanical manners, due to the curvature (Lin et al., 2019; Tian et al., 2019). In addition, depending on its structure (for example, chirality, and radius), they can be either metallic or semiconductor (Zhang et al., 2019; Li et al., 2018). Moreover, due to having large surface area and curvature, nanotubes are proper for absorbing different species on their surface, which is so benefit in photocatalytic area (Dong et al., 2019; Yin et al., 2019; Feliz et al., 2019; Ghosh et al., 2019; Zhang et al., 2019; Pei et al., 2019; Moniruddin et al., 2019; Gao et al., 2019; Huang et al., 2017). Also, this shape makes nanoparticles having very large length and diameter, which is useful in manufacturing ultra-strong materials when they are used as composite materials (Blakeet al., 2004; Schneider et al., 2012; Kolesnikov et al., 2014; Zhu et al., 2019; Lifson et al., 2017). Nanotubes are chemically active, so they can be functionalized with different atoms and molecules, and this property provides an opportunity to fabricate new devices such as carbon nanotubes (Mehlenbacher et al., 2013; Corso et al., 2014; Han et al., 2019).
It is expected that when TiO2 nanoparticles convert to titania nanotubes (TNTs), they can be used in some new and different areas. One of the most interesting applications is Grätzel type dye- sensitized solar cells (DSSCs) (Jennings et al., 2008; Kim et al., 2008; Xu et al., 2011; Noor et al., 2018). Another application is using as photocatalyst due to having some advantages such as anodic self-organization, charge separation, easy control of photocatalyst size and doping (because of its substrate) (Singh and Dutta, 2018). Ion-interaction devices are another usage of titanium oxide nanotube, due to electrochemical reduction of Ti4+ and Ti3+ (Arya et al., 2018; Absalan et al., 2016, 2017). Sensors, memristive behavior, super capacitors, and biomedical applications are also other applications of TNTs (Lee et al., 2014).
Several methods are used to synthesize TNTs, including hydrothermal reaction (Mamaghani et al., 2019; Kumar, 2018), deposition into/onto templates (Korhonen et al., 2011; Li-Qun Wu et al., 2003; Uprety et al., 2017; Zu et al., 2015), self-organizing anodic titania nanotubes arrays (Sadek et al., 2009; Ozkan et al., 2018), and electro spinning (Wali et al., 2019; Huang et al., 2011; Aghasiloo et al., 2019).
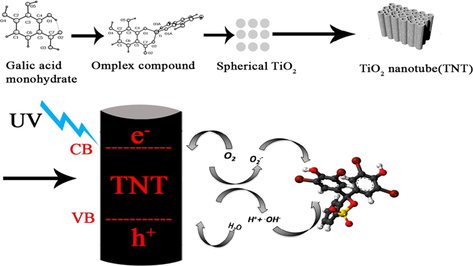
We applied a new method, using organometallic complex compound of titanium as precursor for synthesis of titanium nanotubes (TNT). To have an accurate study, both rutile and anatase, as two main phases of TiO2, were synthesized and compared. The present work contains different steps, including synthesis of titanium oxide nanoparticle in different phases, using complex compound of gallic acid of titanium for the first time, then converting them to the nanotubes by water treating as low cost, nontoxic, and powerful method, and finally ability of the obtained TNT in absorbing UV–Vis light was studied.
2 Experiment section
2.1 Materials
Liquid Titanium (IV) butoxide (TBT, 97%, Sigma-Aldrich), gallic acid (97%, Sigma-Aldrich), n-butanol (99,7%, Ekos.1), NaOH (99%, Sigma-Aldrich), HCl (Ekos.1), distilled water.
2.2 Synthesis of titanium (IV) complexes with gallic acid
Complex compound of titanium with gallic acid was obtained at room temperature. Titanium (IV) butoxide (0.5 mol) was dissolved in n-butanol, and then the solution was added to the solution containing1 mol of gallic acid as ligand with the same solvent. Immediately after adding metal solution, the color changed from colorless to dark red. The solvent was evaporated under room temperature. The procedure for isolation of complex compound was carried out with no recrystallization.
2.3 Synthesizing anatase and rutile phases
The obtained complex compound was used as precursor to isolate titanium oxide anatase and rutile nanoparticle (TiAn and TiRn). Thermal decomposing was the method used to transfer complex compound to the nanoparticles. First of all, to examine the proper temperature and time, a small amount of the complex compound was analyzed thermally. For this purpose it was placed in a closed aluminum crucible and the temperature was set between 25 and 900 °C. The first phase of titanium oxide nanoparticle (anatase phase) was prepared around 500 °C. To reach the rutile phase, different sampling was carried out in higher temperature and time. According to the XRD pattern, the rutile phase was obtained at around 600 °C after 1 h (heating by 10 deg/min).
2.4 Synthesizing titanium oxide nanotube (TNTs)
Anatase (A) and rutile phase (R) (8 g) were treated separately under the same process. First, the corresponding sample was treated with NaOH aqueous solution (100 ml, 1 M) for 20 h at 110 °C was treated (the balloon attached to glass condenser was placed in oil bath and temperature of the oil bath was set at 110 °C). Then the sample was treated by distilled water (DW) to reach 200 ml. The centrifuge (to separate the powder) and repeating treatment with distilled water were used to set the conductivity of the solution on 70 micS/cm as sample I. To obtain sample II, HCl aqueous solution (150 ml, 0.1 M) was mixed with the initial solution, and the then ultrasonicated. The conductivity of the sample was set on 5 mS/cm by DW treating. Samples III was obtained when the samples 1 and 2 were annealed at two different temperatures of 400 and 500 °C for 120 min. Briefly all the steps are presented as a flowchart (Scheme 1).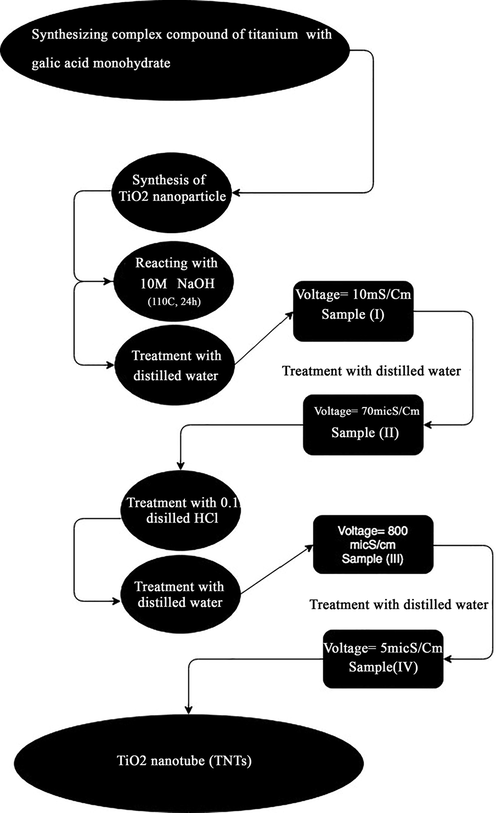
Different steps to synthesis TNTs.
2.5 Photocatalytic Degradation of Bromophenol Blue
The ability of the obtained nanoparticles (Rutile phase before the process “R”, after modifying process “RM”, Anatase phase before the process “A”, and after modifying process “AM”) as photocatalysts was measured by degrading bromophenol blue under UV light. The procedure was carried out as proposed by Jian Zeng et al. (Zhang et al., 2002): each type of TiO2 was plunged into 50 ml 0.5 mol solution of bromophenol blue in dark environment for 6 h. Then, the intensity of the light was adjusted to 0.55 mW/cm2. The concentration of bromophenol blue was measures by the weak UV light spectroscopy at 410 nm. All the obtained nanoparticles, including “A”, “AM”, “R”, and “RM” were used to test their ability as photocatalysts.
2.6 Characterizations
XRD pattern was obtained by Bruker d8 advance using 1.541 A(Cu-Ka). The 1H NMR spectrum of the complex compound was carried out by Jeol JNM ECA 600 (Japan) using DMSO as a reference. The FT-IR spectra were recorded by FT 801 spectrophotometer (between 400 and 4000 cm−1). Varian 735-OES spectroscopy using atomic emission was applied for elemental analysis. Firefly 7.1.G software was used for quantum-chemical modelling of the molecule and complex. Shimadzu RF 5301 spectrofluorometer was applied for analyzing excitation and emission spectra of the nanoparticles with the use of 370 nm optical filter. Jobin Yvon LabRAM HR800 recorded Raman spectra of the nanoparticles. Synchronous thermal analysis (simultaneous recording of TG and DSC curves) was performed on a Netzsch STA 449 F3 Jupiter installation in air. BET analysis to measure surface activity of the nanoparticles was carried out by capillary condensation of nitrogen at 77 K on a micrometric ASAP 2000 (Quanta chrome, USA). To estimate the mesoporosity and pore size distribution function, the Barrett-Joyner-Halenda method (BJH) was used. The microscopic images of the nanoparticles were detected by (EDX detector Oxford INCA350) on Zeiss-EVO-40EP to study the morphology of the nanoparticles, which was accompanied by EDX analysis. The ProsKit S5-803F ultrasonicator was used in the eperiment. The used acceleration voltages were 15–25 kV and 200 kV, respectively and to measure the electrical conductivity, the Anion 4100 device was applied. To measure the concentration of the harmful organic substance and the energy band gap of the obtained nanoparticles, UV–Vis spectroscopy in the range between 200 and 800 nm, using a Cary-50 scan spectrophotometer (Varian), was used.
3 Results and discussion
3.1 Complex compounds of titanium and titanium oxide nanoparticles (TiO2)
3.1.1 1H NMR Analysis
1H NMR spectra of gallic acid as a ligand and its complexes with titanium (IV) is presented in Fig. 1.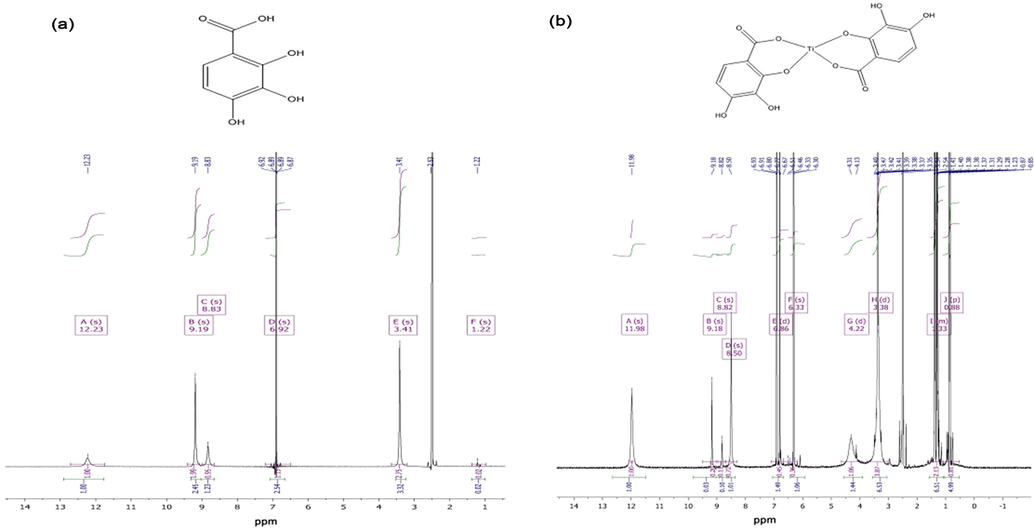
1H NMR spectra of gallic acid as (a) the ligand (L) and (b) its Ti(IV) complex.
The intense peak at 3.41 ppm (s, 2H) in the 1H spectrum of the ligand belongs to two equivalent protons of the benzene ring. At coordination with the titanium ion, the protons become non-equivalent and the signal splits into two.
The vocative protons of the hydroxyl-groups involved in H-bonding of different types (both intra- and intermolecular interactions) are detected as a peak with the maximum at 8.83 ppm. It also can be seen in the spectrum of the complex compounds that not all the OH groups are ionized at complexation.
The peaks at 4.28 and 1.33 ppm in the spectrum of the complex are related to H2O and impurities of n-butanol.
3.1.2 Quantum chemical modeling
This study is devoted to quantum-chemical modeling of the structure and some properties of gallic acid (H4L), as well as its metal complex (Fig. 2). H4L molecule has four mobile hydrogen atoms, however, according to chemical analysis, this molecule is involved in complexation as a dianionic ligand. Therefore, in the following, we will denote this molecule as H2L.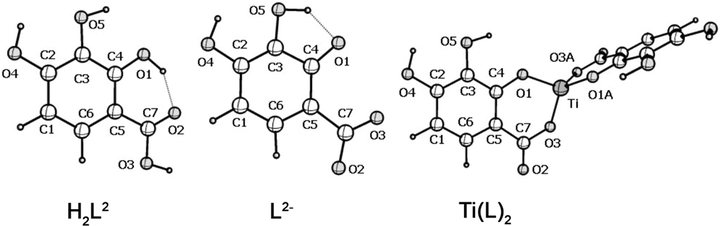
Molecular structure of the isomers of the H2L molecule, dianion L2− and metal complexes according to the DFT calculation.
The number of intermolecular H bonds determines the stability of the H2L molecule. In this case, the H (O1) atom can form a hydrogen bond with both the O2 atom of the carbonyl group and the O3 atom of the hydroxyl group. The isomer formed in the latter case is 17 kJ/mol less stable than that shown in Fig. 2 as isomer H2L, in which the length of the H-bond O2 ∙∙∙ H (O1) is 1.703 Å.
For the H2L2 molecule (Fig. 2), three (L2−) dianions are possible, in which the deprotonated oxygen atoms are able to form a chelate bond with the metal cation. These dianions are formed by ionization of the H (O1) and H (O3) atoms, the H (O1) and H (O5) atoms, the H (O4) and H (O5) atoms. The first of them is 43 and 64 kJ/mol more stable than the second and third, and its structure is given in Fig. 2. The dianion is stabilized by the O1∙∙∙ H(5) intramolecular H bond with the length as 1.610 Å. The coordination polyhedron of the Ti(L)2 complex is a distorted tetrahedron: the O1TiO1A and O3TiO3A angles are 115 and 120°, and the O1TiO3 and O1TiO3A angles are 94 and 117° (Fig. 2). Table 1 includes the calculated bond lengths in the H2L molecule, its dianion (L2−), and the metal complex Ti(L)2 shown in Fig. 2. In Table 2, some atomic charges (ē) calculated by the NBO method in the H2L molecule, its dianion (L2−), and in metal complexes are presented.
Bond/ (R (Å))
Molecule
H2L
L2−
Ti(L)2
M*-O1
–
–
1,828
M−O3
–
–
1,806
M−O6**
–
–
1,805
M−O7**
–
–
1,828
M−O8
–
–
–
M−O9
–
–
–
C4-O1
1,346
1,292
1,366
C4-C5
1,418
1,439
1,415
C5-C7
1,459
1,557
1,489
C7-O3
1,342
1,252
1,376
C7-O2
1,231
1,267
1,200
C5-C6
1,412
1,413
1,407
C1-C6
1,386
1,402
1,391
C1-C2
1,407
1,410
1,400
C2-O4
1,349
1,399
1,347
C2-C3
1,400
1,378
1,406
C3-C4
1,398
1,450
1,397
C3-O5
1,366
1,379
1,361
O4-H
0,976
0,975
0,976
O5-H
0,975
1,047
0,976
Molecule
Atom
H2L
L2−
Ti(L)2
M*
–
–
+1,760
O1
−0,715
−0,776
−0,723
O2
−0,676
−0,840
−0,549
O3
−0,679
−0,787
−0,726
O4
−0,659
−0,736
−0,655
O5
−0,706
−0,814
−0,697
O6**
–
–
−0,724
O7**
–
–
−0,726
O8
–
–
–
O9
–
–
–
C1
−0,286
−0,384
−0,272
C2
+0,339
+0,237
+0,338
C3
+0,218
+0,155
+0,242
C4
+0,343
+0,362
+0,294
C5
−0,283
−0,269
−0,260
C6
−0,168
−0,225
−0,155
C7
+0,854
+0,794
+0,841
H(O4)
+0,477
+0,444
+0,478
H(O5)
+0,487
+0,466
+0,485
From Table 2, it is evident that the charges on the Ti-atom in the complex equals + 1.760 instead + 4. This indicates the essentially covalent nature of the metal – ligand bonds. The data presented in Table 3 indicate the values of electron density transfer to metal cations Δq (Mn+), as well as the values of electron density transfer from the dianion of the ligand Δq (L2−), and water molecules Δq (H2O). Also the electronic configurations of central atoms in the molecules of the complexes is illustrated.
Complex
Δq(Mn+)
Δq(L2−)
Δq(H2O)
Electronic configuration
Ti(L)2
2,240
1,120∙2
–
Ti … 3d2,07 4 s0,164p0,024d0,03
It is obvious from the Table 3 that some part of the electron density of gallic acid dianion transfers to the metal cation. The charge on the O1 atom changed from the value of −0.776 in the dianion to the values of −0.822, −0.963 in the doubly charged complexes. Similarly, the charge on the O3 atom changed from a value of −0.787 in the dianion to values of −0.817, −0.974 in doubly charged complexes.
The intense long-wavelength bands (DP) calculated by the DFT method in the ESP in the H2L molecule, (L2−) dianion, and Ti (L)2 titanium (Table 4) .
H2L
L2−
Ti(L)2
λ (nm)
f
λ (nm)
f
λ (nm)
f
260
0,222
277
0,062
505
0,158
216
0,239
246
0,025
484
0,044
0
0
296
0,025
When a molecule going from neutral to a dianion, a small bathochromic shift of the DP in the ESP is observed. In Table 5 shows the results of the calculation of the IR spectra of the H2L molecule and in Ti (L) titanium using the DFT method.
H2L2
Ti(L)2
ν, cm−1
Intensity
ν, cm−1
Intensity
3418
0,24
3432
0,72
3397
0,32
3429
0,97
3373
0,40
3423
0,98
–
–
3422
1,50
–
–
–
–
–
–
3041
1,15
–
–
3039
2,13
–
–
3017
0,50
3015
3,06
3017
2,90
2985
2,08
–
–
2963
5,89
–
–
–
–
–
–
1768
10,04
1797
13,69
1634
1,14
1775
59,64
1543
1,48
1598
0,00
1506
4,38
1594
6,18
1491
1,46
1528
6,40
–
–
1526
11,24
The bands in the region of 3100–3500 cm− 1 are related to O— H group vibrations, and the position of the bands is determined by the degree of participation of the hydrogen atom of this group in the intermolecular H bond.
The ν (C⚌O) absorption band shifts to the low-frequency region when going from the H2L compound (1768 cm−1) to the titanium complex (1797 and 1775 cm−1) there is a shift to the high-frequency region.
3.1.3 IR and elemental analysis
Fig. 3 illustrates the experimental FT IR spectra of gallic acid as ligand (L), and complex compound of titanium. Based on the result obtained from the FTIR spectroscopy, the C⚌O stretching, which shows itself as a strong absorbance, appeared at 1712 cm−1 in the ligand. This position (C⚌O absorption band) illustrates that an intermolecular H bond went on between C⚌O and the adjacent OH group. Overlapping of ν(C⚌O) vibrations with the C⚌C aromatic stretching occurred at lower frequency shoulder at 1616 cm−1. Another signal appeared at 3511 cm−1, which related to ν(O-H) band. In the complex compound mode, the ν(C⚌O) band shifted to 1670 cm−1. There are also two other signals at 1515 and 1628 cm−1, which correlated to anti-symmetrical and symmetrical stretching of the carboxylate anion COO− respectively (Fig. 3). According to the Δ value (Δ = νas - νs) (113 cm−1), monodentate coordination happened from the carboxylic group of the ligand. Elemental analysis with accompany of IR illustrated that titanium ion was coordinated by the carbonyl group and its adjacent hydroxyl group through their O-atoms (Table 6).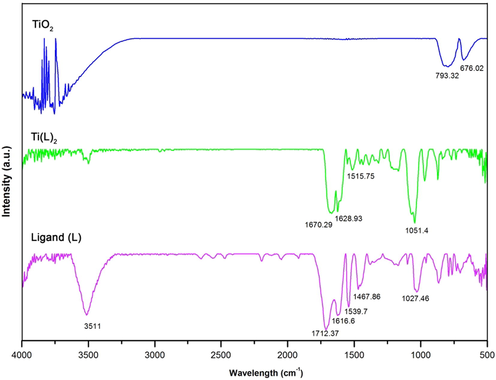
FT IR of the ligand, complex, and nanoparticle compounds.
Formula
Composition
M (g/mole)
Calculated / found, %
C [%]
H [%]
Metal [%]
Theory/Obtained
Theory/Obtained
Theory/Obtained
Ti(L)2
C14H8O10Ti
384.09
43.78/ 44.74
2.10/3.18
12.47/13.05
In the case of titanium oxide nanoparticle (TiO2), after raising temperature, all signals corresponding to the organic substances and H2O (between 800 and 3500 cm−1) disappeared. Several interactions between water’s molecule and the surface of the titanium oxide nanoparticle (H-bond) occurred, and it is observable by splitting of the band into various components. There are also a few weak signals around 1640 cm−1 (δ(OH)), which is due to the hydration on the surface of TiO2. In addition, two sharp and broad signals appeared at around 675 and 790 cm−1 respectively (Ti—O stretching band), which related to TiO6 octahedrons in the lattice with several different distortion.
3.1.4 Thermal decomposition
Fig. 4 provides information about the optimum temperature to synthesize titanium oxide nanoparticles by the thermal analyzing method. Mass loss started at low temperature (35 °C). Then, decreasing mass continued in four different steps. Step A related to the removal of water, which terminated around 80 °C. Step B was a transient state from the complete removal of water to start removing organic substances, which also involved three next steps of C, and D to loss 80.55% of total mass by around 550 °C, which after that the mass fixed with no remarkable changes. The most mass reduction occurred between 445 and 550 °C, which belonged to the loss of ligands, surrounded the titanium ion, and according to the final mass (80.55 g), synthesizing nanoparticle of TiO2 was proved regarding the initial mass of the complex (Ti(L)2, 384 g). Furthermore, the DSC curve (red line) provided information about the thermodynamic effects. The initial mass loss started with endo effects at temperatures 70 and 221 °C, and then the first exo-effects started at higher temperatures by starting removing gallic acid as ligand compound at around 330 °C, and then it continued by newt exo-effect at 445 °C, which was the point that the organic substance was decomposed, and continued to obtain an oxide of titanium removed at 557 °C.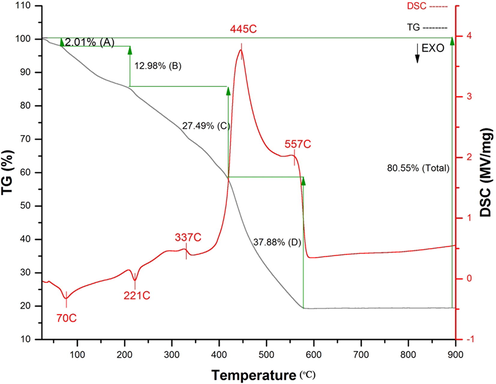
Thermal decomposition of TiL2.
3.1.5 XRD Pattern
Fig. 5 provides information about the XRD of ligand, complex and nanoparticle. Some new peaks appeared after formation of titanium complex compound, and proved some other phases were created. There are two new peaks in the areas 25.26 (1 0 1), 27.42 (1 0 0), which related to anatase and rutile phases respectively and indicated that “Ti” ion was coordinated by the ligand.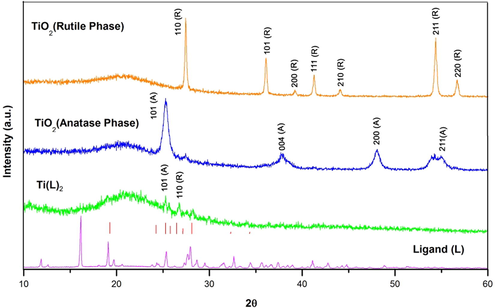
XRD pattern of ligand (L), Ti(L)2, and TiO2 (anatase, rutile phases).
In the case of titanium nanoparticle, two different phases of anatase and rutile phases appeared at the temperature of 500 and 600 °C. Based on the XRD pattern, the JCPDS card Number are equal 21–1272 , 21–1276 for anatase and rutile respectively.
Scherer formula was used for measuring the size of the nanoparticles:
According to the results, the average sizes of anatase and rutile phases obtained around 21 and 39 nm respectively.
3.1.6 Microscopic Image
The morphology of the obtained nanoparticle was studied by SEM image accompanied with EDX analysis (Fig. 6).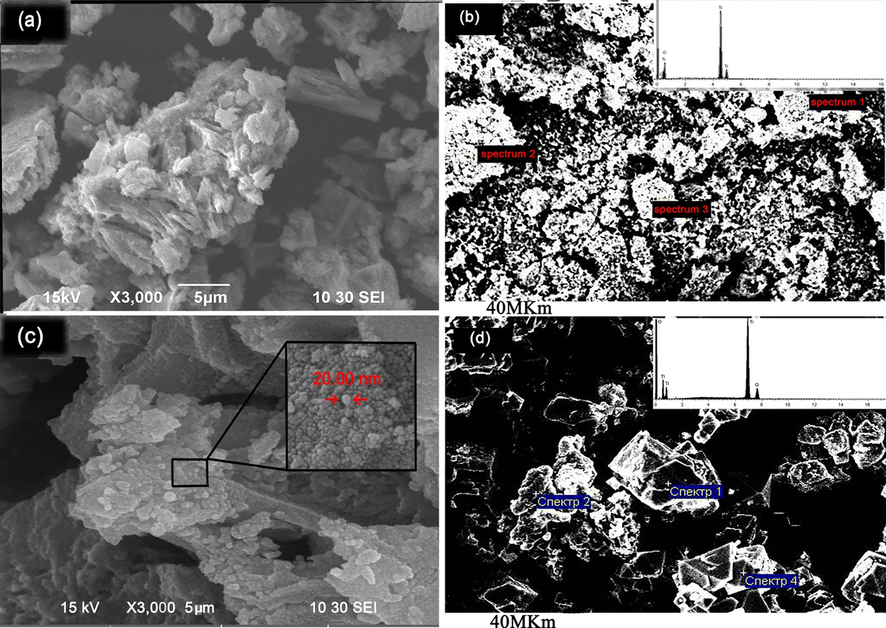
Microscopic image of Rutile phase; (a) SEM images, (b) EDX pattern, and Anatase; (c) SEM images, (d) EDX pattern.
According to the result obtained from the rutile nanoparticle (Fig. 6a), it showed that the shapes had not regular structure which was also predicted because titanium oxide in the phase of rutile are obtained usually rock-like, however, the surface of the nanoparticles showed nanocrystalline domains
According to the result, the spherical shape of the anatase phase after calcination complex compound of titanium was formed. The size measured by the microscopic image is matched with XRD analysis. Uniformity of the nanoparticles is quite satisfied, which related to the proper decomposing of the complex compounds. EDX pattern of the nanoparticle also was studied (Fig. 6b). Based on the analysis, the nanoparticle was pure with no impurity (Table 7).
Sample
O [%]
Ti [%]
TiO2 (Rutile)
38.8
61.2
TiO2 (Anatase)
37.2
62.8
3.2 Titanium oxide nanotubes (TNTs)
To have an accurate investigation, both phases of anatase and rutile were studied. All the procedures were operated exactly the same for rutile and anatase. However, the results were obtained differently.
3.2.1 XRD pattern
XRD pattern of the nanoparticles in different steps was recorded. According to Fig. 7a, the XRD pattern of rutile in all steps had some changes, although, all of them are still rutile. It demonstrated that the procedures, which were applied in each step did not effect on chemical composition of titanium oxide nanoparticle and the structure of the corresponding nanoparticle had no remarkable changes. The sizes of the nanoparticles obtained by Scherer equation are almost between 41 and 42 nm (sample I), 40–41 nm (sample II), and 39–40 nm(sample III).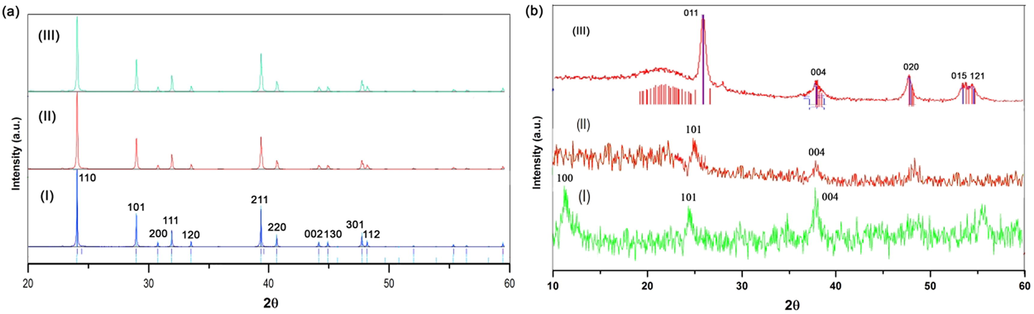
XRD pattern of samples; (a) Rutile phase; (I) after synthesizing to rutile, (II) after treating by HCl, (III) after annealing at 500C. (b) Anatase phase; (I) after synthesizing to anatase, (II) after treating by HCl, (III) after annealing at 500C.
On the other hand, Fig. 7b illustrates XRD pattern of the different samples obtained from anatase phase. Fig. 7b illustrates that the XRD pattern related to the titanium oxide, which treated by NaOH. According to the result, the samples is matched with Na2Ti3O7 with JCPDS 00–059-0666, the main peaks can be observed at around 11, 25.5, and 37, which the second signal related to anatase phase (25.5). The reaction between sodium hydroxide and titanium oxide can be written as the following Eq. (1):
By water treatment, some Ti-O-Ti bonds were broken to form [Ti(OH)6]2. However, this structure is not so stable and due to combination with oxides, nuclei were formed and became thermodynamically stable because of increasing the size of the crystal. Thin nanosheets was formed and combined while the process was grown. The obtained Na2Ti3O7 nanoparticle had layer with octahedral sites and cations of Na+ were located between the octahedral layers.
Fig. 7 b (II) is related to the sample which was treated by HCl. Na+ in Na2Ti3O7 was replaced by H3O+ when Na2Ti3O7 reacted with HCl:
The XRD pattern of the sample showed signal at 25.3°, which illustrated anatase phase ‘s signal is still exist and the JCPDS was matched with 01–089-4921. However, because the crystalinity of the sample is low the profile fitting could not be determined very well. In common researches, exchanging Na+ ions are the reason for collapsing titania nanotubes, but in this experiment, preparing nanosheets was the main reason for being this type of crystalinity (low crystalinity).
Fig. 7b (III) belongs to the titania nanotubes after annealing at 500 °C. The XRD pattern determined that titanium oxide nanotube in anatase phase was prepared by being signals at 25.36, 37.9, 48.17, and 55°.
Comparing to rutile phase, anatase showed that the structure was flexible and it is possible to obtain titania nanotubes from anatase phase, while rutile phase because of its very strong and stable structure had no remarkable changes. The size of the samples obtained from the same method, and obtained 23, 10, and 18 nm.
3.2.2 Microscopic image
Fig. 8 provides information about the SEM image of the obtained nanoparticles in different steps. According to the result obtained from the rutile nanoparticle, it showed that the morphology of the nanoparticle has not been changed a lot and there were no special changes in the shape of the nanoparticles, even after all the processes. The microscopic images illustrated that the shapes had no regular structure which was predicted, because titanium oxide in the phase of rutile are obtained usually rock-like, however, the surface of the nanoparticles showed nanocrystalline domains. Rutile phases due to having high stability, which obtained as the last phase of titanium oxide at high temperature are usually so refractory and resist different conditions, in addition, its irregular shape did not allow obtaining a regular shape such as tube.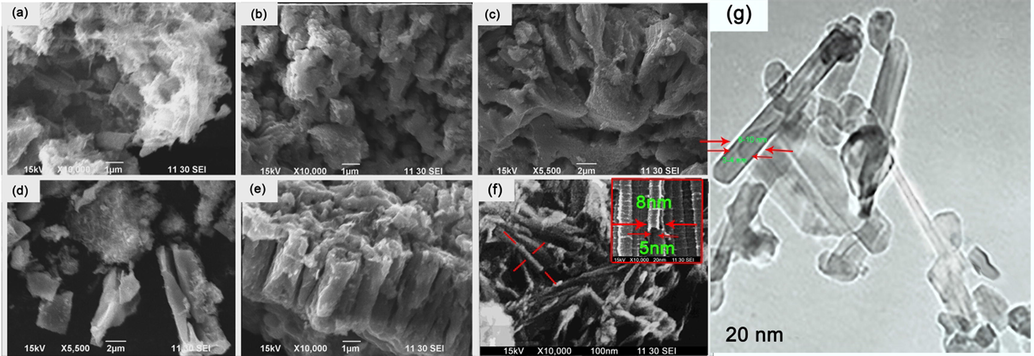
SEM image of rutile phase; (a) sample I, (b) sample II, (c) sample III, and anatase phase; (d) sample I, (e) sample II, (f) sample III, (g) TEM image of the nanotube obtained from the anatase phase.
In the case Anatase phase, it’s obvious that how the spherical shape (Fig. 6c) changed to the tube shape with the 5 nm and 8 nm of inner and outer diameter respectively (Fig. 8f). According to the result, we assumed the following procedure. When the sample was treated by alkali, Na-O-Ti bonds appeared on the surface of the nanoparticles (TiO2). However, there are some microscopic particles, which Na-O-Ti bonds did not appear on their surfaces, so they made charge imbalance (Fig. 8d) (Kasuga et al., 1999) . After treating by HCl, the charged, which appeared on the surface of the nanoparticles and subsequently the electrostatic repulsion vanished. In addition, next treating by distilled water let the charged slowly disappeared and changed Ti-O-Na bonds to Ti-OH (Fig. 8e). The mentioned bonds (Ti-OH) made the structure to be sheet like, which is existed in the tube structure. Also, because Ti-O-Ti or Ti-O---H-O-Ti hydrogen bonds were produced by the dehydration of Ti-OH bonds due to treating by chloric acid, the interval bond between two atoms of titanium (Ti) reduced, which made two sides of the sheet attracted to each other. While this procedure was happening, remaining Ti-O-Na bonds and their electrostatic repulsion made a connection between the extremities of the sheet, so the tube structure formed (Fig. 8f). The most differences between this method and the anodization methods, which has been already carried out, is that, in the current method there is no need to use Teflon-lined autoclave and it can be converted to tube just by a simple chemical reaction (which was mentioned). In addition, the highest temperature required for this reaction, before calcination, is 110C, while in other reported methods, temperature was around 160-200C (Qiu et al., 2018; Tan et al., 2019; Zhao et al., 2019; Liu et al., 2019; Wang et al., 2019).
TEM image of the last product (Fig. 8g) showed the shape of product clearly, and nanotube shape is observable. The inner and outer diameter obtained by TEM image was found to be around 3–4 nm and 8–10 nm respectively, which is matched with the data resulted from SEM image.
3.2.3 Raman Spectroscopy
Fig. 9 Provides information about the Raman spectroscopy of rutile and anatase phases. According to the result, a remarkable change did not occur when rutile phase was used as precursor. There are two peaks at around 602 and 450 cm−1, which related to Ti-O-Ti. After treating by NaOH and HCl, which are observable as I and II sample respectively, still the peaks remain the same as rutile phase. After annealing (sample III) the peaks had no any changes and it showed that the bonds between titanium and oxygen in rutile phase were not broken and nothing happened.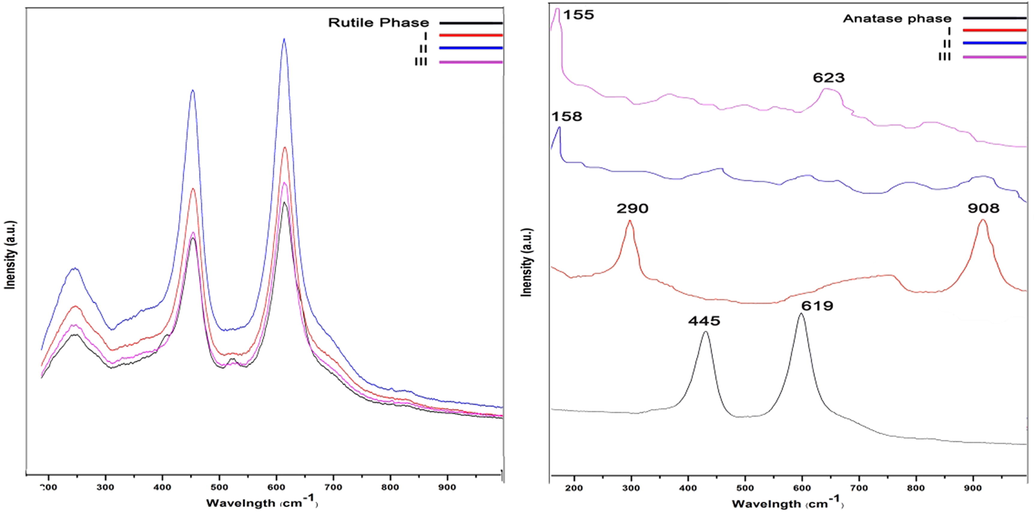
Raman spectroscopy of samples; (a) Rutile phase, (b) Anatase phase.
On the other hand, the figure related to anatase phase (Fig. 9 b) illustrated some changes in the Raman spectrum. In anatase phase (before any treatment), there are two peaks at around 619 and 445 cm−1, which related to Ti-O-Ti bonds. After treating by hydroxide sodium (sample I), the mentioned peaks almost vanished, while two new peaks at 290 cm−1 and 908 cm−1appeared, which related to Na-O-Ti and four-coordinate Ti-O, respectively (Kasuga et al., 1999). It is matched with the result obtained from the XRD and it confirms that the Ti-O-Ti was broken to form Ti-O-Na and Ti-OH. The spectrum regarding sample II, the peak at 908 cm−1 disappeared, while a small peak at 158 cm−1 appeared. It is believed that the titania nanotubes was formed in this stage. In the spectrum, which related to sample III, a sharp peak at 155 cm−1, and a new broad small peak at 623 cm−1 appeared. All the mentioned peaks are due to anatase phase (Kasuga et al., 1999).
3.2.4 Photoluminescence analysis
The photoluminescence of the samples was studied and it illustrates in Fig. 10. Rutile phase illustrated the following characterization; photoluminescence of the samples was measured at 370 nm excitation wavelength with an optical filter placed before detector (370 nm cut-off wavelength). Fig. 10.a shows a number of weak surface-state emissions at 400–480 nm visible range with maximums at 417,438,470 nm clearly expressed for samples rutile phase I and less for II and III with ± 2 nm offset. Green emission peak at 480–570 nm ranges with the maximum at 514 nm is clear and twice more intensive for rutile phase I samples (40–33 r.u. vs. 19–16 r.u. for II-III samples). Separated photoluminescence bands could be explained by different nature of electronic transitions – free holes (Rex et al., 2014, 2016) or trapped holes (Nakamura and Nakato, 2004; Nakamura et al., 2005) or can be a consequence of surface oxidation which also explains weak green emission for samples II and III.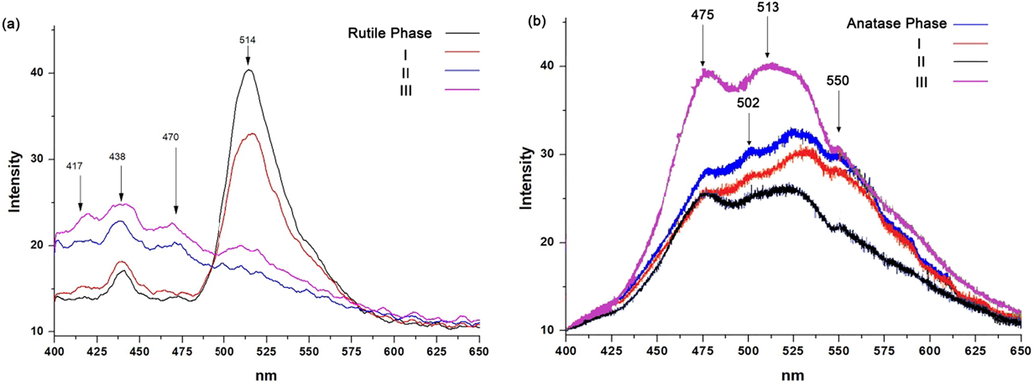
Photoluminescence spectroscopy of samples; (a) Rutile phase, (b) Anatase phase.
On the other hand, Fig. 10 b provides information about anatase sample and its samples derivative from the different steps of the process. Although the shape of the samples is different, the spectra for all the samples were obtained almost the same as each other, however, the intensities are different. The intensity related to the III sample (pink line) showed the greatest intensity, while in contrast the sample, related to treating by acid (II, black line) had the lowest intensity. It can be realized that, the sample III due to having the shape of tube and greater BET surface activity than previous samples, which were spherical (anatase phase) or irregular shape, could trap the electrons more. The sample treated by hydroxide (sample I) and acid (sample II) in opposite, had the lowest spectra. This is because of two reasons of the shape and some new bonds. The irregular shape of the samples, which obtained in these steps did not illustrate large BET surface activity, in addition, forming some new bonds (Ti-OH and Ti-O-Na) act as coordinator led the sample destabilize (0 0 1) the surface by their coordination, while in anatase phase and in the last sample (III) due to annealing there were just TiO2 in spherical and tube shape respectively and trapping electron related to red photoluminescence were because of under-coordinated Ti by proper element.
3.2.5 UV–Vis absorption investigation
Fig. 11 provides information about the UV–Vis diffuse reflectance spectra of rutile and anatase. Tauc’s plot method was used to obtain the energy band gap of the substance:
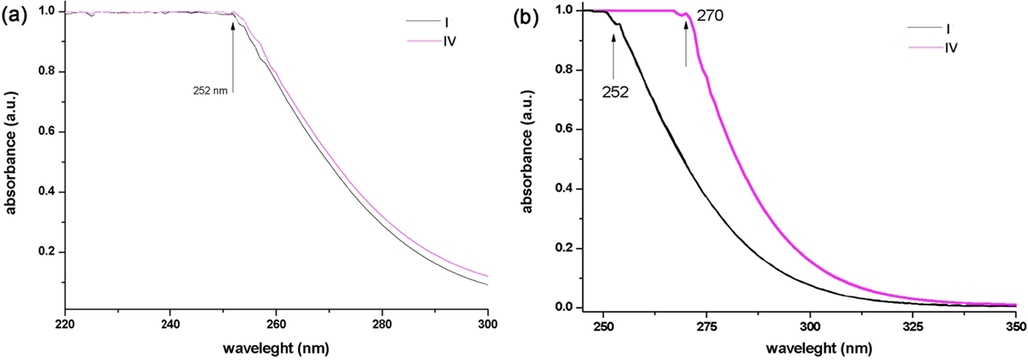
Absorbance of Rutile phase sample (a);(I) before modifying processes, (IV) after modifying processes, and anatase (b); (I) before modifying processes, (IV) after modifying processes.
In the case of rutile (Fig. 11a), samples showed a very weak absorbance at 340 nm (3.65 eV) which is close to normal absorbance of rutile but a huge absorbance at 252 ± 2 nm for all measured samples. According to Tauc’s plot, direct transitions zone was calculated as 4.46 ± 0.02 eV and indirect was about 3.91 eV. Such huge band gaps were discussed by authors (PiotrKowalski et al., 2009; Li et al., 2015; Mercado et al., 2012) with the use of DFT method of analysis to explain the oxygen positions on the TiO2 (1 0 1), (1 0 0) and (0 0 1) surfaces. As it’s clear from the figure, both first and last samples were almost the same with no particular changes.
On the other hand, two 1st and last samples showed a huge gap (almost 20 nm), which belonged to the anatase phase and nanotube respectively (Fig. 11b). It illustrated that when the nanoparticle converted to tube shape, due to having larger active surface, it could absorb UV light at higher wavelength. And because the substance was the same with no extra modification, it can be realized that the only parameter effected on the properties of the nanoparticle was the shape of it, which turned to tube from the spherical shape. Based on the result, obtained from Tauc’ plot, the energy band gap of anatase was obtained 4.08 eV, while the energy bandgap of the nanotube decreased by 3.8 eV.
3.2.6 BET surface analysis
Fig. 12 provides information about BET surface analysis of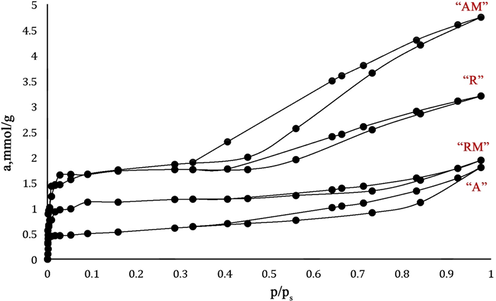
Adsorption-desorption isotherm N2 (77 K) of nanoparticles.
“A”, “AM”, “R”, and “RM” samples to investigate the specific surface activity, total pore volume, and average pore diameter was studied by BJH method. The pressure range (P/P0) between 0.4 and 0.95 was applied to obtain the surface area and texture parameters (Absalan et al., 2018).
Table 8 illustrates the mesoporosity of the samples. The result obtained from the graph proved that the hysteresis loops were kind of type 4 (Yahya Absalan et al., 2017), which provides micropores related to mesoporous. In addition the size of the nanoparticles were between 10 and 40 nm (based on the result of the XRD), and it illustrates presence of mesoporous. While process of calcination was carrying out, the obtained coarser mesoporous degradation and crystal development let forming micropores. In addition, aggregates of plate like nanoparticle, especially in “A”, appeared to thin slit-shaped pores, which make forming type 4 of hysteresis loops.
Sample
BET surface (m2 g−1)
Pore volume (Mesoporous)
(cm3 g−1)Pore diameter (Å)
Percentage of mesoporous (%)
“A”
16.12
0.036
32
6.84
“AM”
43.52
0.121
81
20.66
“R”
20.36
0.046
41
7.83
“RM”
19.33
0.044
40.5
7.39
The specific surface of the mesoporous was obtained from the result of the adsorption-desorption isotherm. Based on the result, it suggested that the nanoparticles with smaller size had larger specific surface activity (Table 8); the advantage of the larger surface activity is based on this fact that they can react better in photocatalytic degradation’s reaction. In addition, the results associated with the designation of the larger mesoporous diameter, which is the result of the pore volume’s structural curves (Table 8).
Photocatalytic investigation. The ability in photocatalytic degradation of bromophenol blue by the obtained titania nanotubes is illustrated in Fig. 13. bromophenol blue are among the organic harmful substances, which is so difficult to be degraded. However, all the synthesized nanoparticles could remove bromophenol blue from the environment with the different ratio under UV light; “R”, “RM”, “A”, and “AM”. According to the result shown in Fig. 13, photocatalytic activity of “AM” was more than others, while sample “A” had the least ability to remove bromophenol blue after “R” and “RM” which were able to remove almost the same. Based on the result extracted from BET surface activity, the surface active of “R”, “RM”, “A”, and “AM” were 20.36, 19.33, 16.12, and 43.52 cm2. Thus, it was predictable that “AM” could remove bromophenol blue under weak UV light more than others. A better irradiation by the amorphous “R” and “RM” than “A” (spherical shape) could be explained that the nanomicroporous, which existed in “R” and “RM” higher than “A”, were able to prevent the structure of “R” and “RM”, which are immobilized in the matrix of TiO2 (Zeng et al., 2010). In addition, the cyclic photodegradation curves of bromophenol blue by “AM” are provided by Fig. 14. “AM” was used to degrade bromophenol blue for three times to test its photo-stability, and it showed that its activity was not reduced remarkably even after three times. Indeed, it suggests that the immobilization of “AM” nanoparticles in its structure made it resist to photo-corrosion (Long et al., 2006). The time of photodegradation was calculated by the intensity of UV light and the first concentration of bromophenol blue. The UV light, which was set for the experiment, was 0.55 mW/cm2 (255 nm) as a very weak UV light. The result showed that it could reduce the concentration of bromophenol blue very well even under weak UV light, which was held at 25 °C. The result showed a high ability for the obtained titania nanotubes; according to our best knowledge and under the same situation, other reported titania nanotubes could decrease concentration of the bromophenol blue by almost 75% (Liu et al., 2008)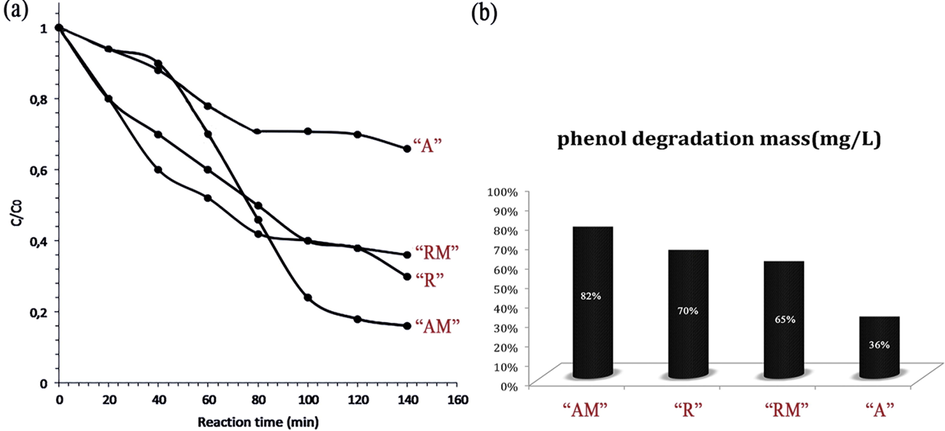
Photodegradation curves of bromophenol blue with “AM”,”R”, “RM”, and “A” (a), and the bromophenol blue degradation concentration (mg/L) under UV irradiation 140 h (b).
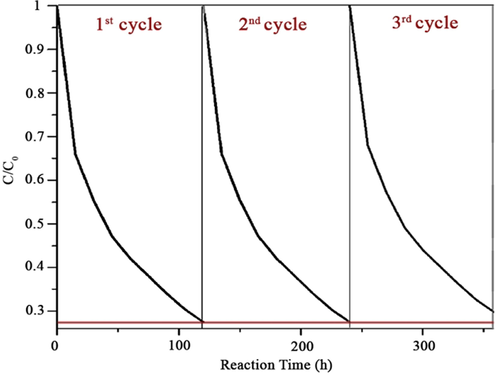
Cyclic photodegradation curves of bromophenol blue with the “AM”.
The mechanism of degradation can be considered as follow:
4 Conclusions
TiO2 in two phases of rutile and anatase was synthesized through thermal decomposing of the complex compound of Ti (IV) with gallic acid at low temperature, which is benefit based on economic. In the next step Titania nanotubes was successfully synthesized through treatment of anatase phase with a large surface activity than other samples. All the obtained nanoparticles were tested as photocatalysts under weak UV light irradiation. Titania nanotubes illustrated very well ability to degrade bromophenol blue as an organic pollutant. In addition, Titania nanotubes had proper stability to be reused as photocatalyst for more cycles. The synthesized Titania nanotubes is a powerful photocatalyst, which can be used for wastewater and it is activated under even weak UV light irradiation.
Acknowledgments
The publication has been prepared with the support of the Peoples’ Friendship University (RUDN University program 5-100) and Ferdowsi University of Mashhad research Council.
Declaration of Competing Interest
The authors declare that they have no known competing financial interests or personal relationships that could have appeared to influence the work reported in this paper.
References:
- Bacteriostatic Effects of Apatite-Covered Ag/AgBr/TiO2 Nanocomposite in the Dark: Anomaly in Bacterial Motility. J. Phys. Chem. B.. 2019;123:787-791.
- [CrossRef] [Google Scholar]
- Composition, structure, and stability of the rutile TiO2(110) surface: Oxygen depletion, hydroxylation, hydrogen migration, and water adsorption. Phy Rev B. 2009;2
- [CrossRef] [Google Scholar]
- Improved Nonenzymatic Glucose Sensing Properties of Pd/MnO2 Nanosheets: Synthesis by Facile Microwave-Assisted Route and Theoretical Insight from Quantum Simulations. J. Phys. Chem. B.. 2018;122:7636-7646.
- [CrossRef] [Google Scholar]
- S. Pinilla, A. Machín, S.-H. Park, J.C. Arango, V. Nicolosi, F. Márquez -Linares, C. Morant, TiO2-Based Nanomaterials for the Production of Hydrogen and the Development of Lithium-Ion Batteries, J. Phys. Chem. B. 122 (2018) 972–983. doi:10.1021/acs.jpcb.7b07130.
- Engineering Interface Structure to Improve Efficiency and Stability of Organometal Halide Perovskite Solar Cells. J. Phys. Chem. B.. 2018;122:511-520.
- [CrossRef] [Google Scholar]
- TiO2 photocatalyst for removal of volatile organic compounds in gas phase – A review. Chem. Eng. J.. 2018;334:2408-2439.
- [CrossRef] [Google Scholar]
- The Effect of Nanoparticle Size, Shape, and Surface Chemistry on Biological Systems. Annu. Rev. Biomed. Eng.. 2012;14:1-16.
- [CrossRef] [Google Scholar]
- Doped rare and transition metal perovskite-type titanate nanoparticles: A new method for developing synthesizing and photocatalytic ability. J. Mol. Liq.. 2018;268:882-894.
- [CrossRef] [Google Scholar]
- Ti (IV) complexes with some diphenols as precursors for TiO2 nano-sized catalysts. J. Organomet. Chem.. 2018;859:80-91.
- [CrossRef] [Google Scholar]
- Cell shape affects nanoparticle uptake and toxicity: An overlooked factor at the nanobio interfaces. J. Colloid Interf. Sci.. 2018;531:245-252.
- [CrossRef] [Google Scholar]
- Physicochemical properties of nanomaterials: Implication in associated toxic manifestations. Biomed Res. Int. 2014 2014
- [CrossRef] [Google Scholar]
- Novel synthesis method for photo-catalytic system based on some 3d-metal titanates. J. Mater. Sci. Mater. Electron.. 2017;28:18207-18219.
- [CrossRef] [Google Scholar]
- Thermal decomposition of bimetallic titanium complexes: A new method for synthesizing doped titanium nano-sized catalysts and photocatalytic application. Mater. Sci. Eng. C.. 2019;97:813-826.
- [CrossRef] [Google Scholar]
- Construction of novel CNT/LaVO4 nanostructures for efficient antibiotic photodegradation. Chem. Eng. J.. 2019;357:487-497.
- [CrossRef] [Google Scholar]
- Tuning Surface Lattice Strain towards Pt-skin CoPtx Truncated Octahedron for Hydrogen Evolution Reaction. J. Phys. Chem. C. 2019
- [CrossRef] [Google Scholar]
- Hierarchical macro-mesoporous g-C3N4 with an inverse opal structure and vacancies for high-efficiency solar energy conversion and environmental remediation. Nanoscale. 2019;11:20638-20647.
- [CrossRef] [Google Scholar]
- Detecting Semiconductor Nanoplatelets with Distinctive Crystal Structures and Thickness by Magnetic Circular Dichroism. J. Phys. Chem. C. 2019
- [CrossRef] [Google Scholar]
- Z-scheme mesoporous photocatalyst constructed by modification of Sn3O4 nanoclusters on g-C3N4 nanosheets with improved photocatalytic performance and mechanism insight. Appl. Catal. B Environ.. 2018;238:284-293.
- [CrossRef] [Google Scholar]
- Spontaneous Polarization Effect and Photocatalytic Activity of Layered Compound of BiOIO3. Inorg. Chem. 2019
- [CrossRef] [Google Scholar]
- Construction of Heterogenous S-C–S MoS2/SnS2/r-GO Heterojunction for Efficient CO2 Photoreduction. Inorg. Chem. 2019
- [CrossRef] [Google Scholar]
- Supramolecular Anchoring of Octahedral Molybdenum Clusters onto Graphene and Their Synergies in Photocatalytic Water Reduction. Inorg. Chem. 2019
- [CrossRef] [Google Scholar]
- A Diuranyl(VI) Complex and Its Application in Electrocatalytic and Photocatalytic Hydrogen Evolution from Neutral Aqueous Medium. Inorg. Chem.. 2019;58:14410-14419.
- [CrossRef] [Google Scholar]
- Transition-Metal-Ion (Fe Co, Cr, Mn, Etc.) Doping of TiO2 Nanotubes: A General Approach. Inorg. Chem.. 2019;58:12511-12515.
- [CrossRef] [Google Scholar]
- Selectively Photocatalytic Activity of an Open-Framework Chalcogenide Built from Corner-Sharing T4 Supertetrahedral Clusters. Inorg. Chem.. 2019;58:12011-12016.
- [CrossRef] [Google Scholar]
- Designing CdS-Based Ternary Heterostructures Consisting of Co-Metal and CoOx Cocatalysts for Photocatalytic H2 Evolution under Visible Light. Inorg. Chem.. 2019;58:12325-12333.
- [CrossRef] [Google Scholar]
- Theoretical Insights into Two-Dimensional IV–V Compounds: Photocatalysts for the Overall Water Splitting and Nanoelectronic Applications. Inorg. Chem.. 2019;58:12053-12068.
- [CrossRef] [Google Scholar]
- Macroscopic Polarization Enhancement Promoting Photo- and Piezoelectric-Induced Charge Separation and Molecular Oxygen Activation. Angew. Chemie Int. Ed.. 2017;56:11860-11864.
- [CrossRef] [Google Scholar]
- R. Blake, Y.K. Gun’ko, J. Coleman, M. Cadek, A. Fonseca, J.B. Nagy, W.J. Blau, A Generic Organometallic Approach toward Ultra-Strong Carbon Nanotube Polymer Composites, J. Am. Chem. Soc. 126 (2004) 10226–10227. doi:10.1021/ja0474805.
- Materials Properties of Ultra-Incompressible Re2P. Chem. Mater.. 2012;24:3240-3246.
- [CrossRef] [Google Scholar]
- Strong Anisotropic Dynamics of Ultra-Confined Water. J. Phys. Chem. B.. 2014;118:13414-13419.
- [CrossRef] [Google Scholar]
- Ultra-Tough, Strong, and Defect-Tolerant Elastomers with Self-Healing and Intelligent-Responsive Abilities. ACS Appl. Mater. Interfaces.. 2019;11:29373-29381.
- [CrossRef] [Google Scholar]
- Enabling Simultaneous Extreme Ultra Low-k in Stiff, Resilient, and Thermally Stable Nano-Architected Materials. Nano Lett.. 2017;17:7737-7743.
- [CrossRef] [Google Scholar]
- Photoexcitation Dynamics of Coupled Semiconducting Carbon Nanotube Thin Films. Nano Lett.. 2013;13:1495-1501.
- [CrossRef] [Google Scholar]
- Electrochemical Charge-Transfer Resistance in Carbon Nanotube Composites. Nano Lett.. 2014;14:1329-1336.
- [CrossRef] [Google Scholar]
- 0D CoP cocatalyst/ 2D g-C3N4 nanosheets: An efficient photocatalyst for promoting photocatalytic hydrogen evolution. J. Am. Ceram. Soc.. 2019;102:5484-5493.
- [CrossRef] [Google Scholar]
- Dye-Sensitized Solar Cells Based on Oriented TiO2 Nanotube Arrays: Transport, Trapping, and Transfer of Electrons. J. Am. Chem. Soc.. 2008;130:13364-13372.
- [CrossRef] [Google Scholar]
- Bamboo-Type TiO2 Nanotubes: Improved Conversion Efficiency in Dye-Sensitized Solar Cells. J. Am. Chem. Soc.. 2008;130:16454-16455.
- [CrossRef] [Google Scholar]
- Multilayer Assembly of Nanowire Arrays for Dye-Sensitized Solar Cells. J. Am. Chem. Soc.. 2011;133:8122-8125.
- [CrossRef] [Google Scholar]
- ZnO/TiO2 nanocomposite photoanode as an effective UV-vis responsive dye sensitized solar cell. Mater. Res. Express.. 2018;5:095905
- [CrossRef] [Google Scholar]
- A review on H2 production through photocatalytic reactions using TiO2/TiO2-assisted catalysts. Fuel.. 2018;220:607-620.
- [CrossRef] [Google Scholar]
- Impact of Shape (Nanofiller vs. Nanorod) of TiO2 nanoparticle on Free Standing Solid Polymeric Separator for Energy Storage/Conversion Devices Lithium Ion Batteries and Supercapacitors View project Polymer Nanocomposites for Li Ion Battery and Supercapacitor View project Impact of Shape (Nanofiller vs. Nanorod) of TiO2 nanoparticle on Free Standing Solid Polymeric Separator for Energy Storage/Conversion Devices. Artic. J. Appl. Polym. Sci. 2018
- [CrossRef] [Google Scholar]
- Optimization of the ways of synthesis of the catalysts based on titanium dioxide by the thermal decomposition of titanium tetrabutoxide. Butlerov Commun.. 2016;47:49-55. ROI: jbc-02/16-47-8-49
- [Google Scholar]
- Accurate investigation to find the best situation for degradation of bromophenol blue from environment by under UV-Vis light and compare with, based on reduction concentration. Environ. Nanotechnol. Monit. Manag. J.. 2017;8:244-253.
- [CrossRef] [Google Scholar]
- One-dimensional titanium dioxide nanomaterials: Nanotubes. Chem. Rev.. 2014;114:9385-9454.
- [CrossRef] [Google Scholar]
- Hydrothermal/solvothermal synthesis and treatment of TiO2 for photocatalytic degradation of air pollutants: Preparation, characterization, properties, and performance. Chemosphere.. 2019;219:804-825.
- [CrossRef] [Google Scholar]
- Different Methods Used for the Synthesis of TiO2 Based Nanomaterials: A Review. Am. J. Nano Res. Appl.. 2018;6:1.
- [CrossRef] [Google Scholar]
- Inorganic Hollow Nanotube Aerogels by Atomic Layer Deposition onto Native Nanocellulose Templates. ACS Nano.. 2011;5:1967-1974.
- [CrossRef] [Google Scholar]
- †,‡ Li-Qun Wu, †,§ Hyunmin Yi, ‖,⊥ Sheng Li, ⊥,# Gary W. Rubloff, †,§ William E. Bentley, ‖,⊥ and Reza Ghodssi, †,‡ Gregory F. Payne*, Spatially Selective Deposition of a Reactive Polysaccharide Layer onto a Patterned Template, (2003). doi:10.1021/LA026518T.
- Anisotropic Electroless Deposition on DNA Origami Templates To Form Small Diameter Conductive Nanowires. Langmuir.. 2017;33:726-735.
- [CrossRef] [Google Scholar]
- Silica-Titania Composite Aerogel Photocatalysts by Chemical Liquid Deposition of Titania onto Nanoporous Silica Scaffolds. ACS Appl. Mater. Interfaces.. 2015;7:5400-5409.
- [CrossRef] [Google Scholar]
- Anodization of Ti Thin Film Deposited on ITO. Langmuir.. 2009;25:509-514.
- [CrossRef] [Google Scholar]
- Critical parameters and factors in the formation of spaced TiO2 nanotubes by self-organizing anodization. Electrochim. Acta.. 2018;268:435-447.
- [CrossRef] [Google Scholar]
- In-vivo wound healing performance of Halloysite clay and Gentamicin incorporated Cellulose ether-PVA electro-spun nanofiber mats, ACS Appl. Bio Mater. 2019 acsabm.9b00589
- [CrossRef] [Google Scholar]
- Electro-optics of Polymer Nanotube Dispersions. J. Phys. Chem. C.. 2011;115:8447-8456.
- [CrossRef] [Google Scholar]
- Highly porous TiO2 nanofibers by humid-electrospinning with enhanced photocatalytic properties. J. Alloys Compd.. 2019;790:257-265.
- [CrossRef] [Google Scholar]
- Preparation of Long TiO 2 Nanotubes from Ultrafine Rutile Nanocrystals. Chem. Lett.. 2002;2010:226-227.
- [Google Scholar]
- Titania Nanotubes Prepared by Chemical Processing. Adv. Mater.. 1999;567:1307-1311.
- [Google Scholar]
- Preparation of 3D TiO2 nanotube arrays photoelectrode on Ti mesh for photoelectric conversion and photoelectrocatalytic removal of pollutant. Sep. Purif. Technol.. 2018;207:206-212.
- [CrossRef] [Google Scholar]
- Insights into the inhibition mechanism of three 5-phenyltetrazole derivatives for copper corrosion in sulfuric acid medium via experimental and DFT methods. J. Taiwan Inst. Chem. Eng.. 2019;102:424-437.
- [CrossRef] [Google Scholar]
- Fabrication and photoelectrochemical performance of Ag/AgBr sensitized TiO2 nanotube arrays for environmental and energy applications. Sep. Purif. Technol.. 2019;209:782-788.
- [CrossRef] [Google Scholar]
- Solvothermal fabrication and construction of highly photoelectrocatalytic TiO2 NTs/Bi2MoO6 heterojunction based on titanium mesh. J. Colloid Interface Sci.. 2019;556:92-101.
- [CrossRef] [Google Scholar]
- Engineering Bi2S3/BiOI p-n heterojunction to sensitize TiO2 nanotube arrays photoelectrodes for highly efficient solar cells and photocatalysts. Ceram. Int.. 2019;45:3995-4002.
- [CrossRef] [Google Scholar]
- Surface Traps of TiO 2 Nanosheets and Nanoparticles as Illuminated by Spectroelectrochemical Photoluminescence. J. Phys. Chem. C.. 2014;118:16831-16841.
- [CrossRef] [Google Scholar]
- Spectroelectrochemical Photoluminescence of Trap States in H-Treated Rutile TiO2 Nanowires: Implications for Photooxidation of Water. J. Phys. Chem. C.. 2016;120:3530-3541.
- [CrossRef] [Google Scholar]
- Primary Intermediates of Oxygen Photoevolution Reaction on TiO2 (Rutile) Particles, Revealed by in Situ FTIR Absorption and Photoluminescence Measurements. J. Am. Chem. Soc.. 2004;126:1290-1298.
- [CrossRef] [Google Scholar]
- Molecular Mechanisms of Photoinduced Oxygen Evolution, PL Emission, and Surface Roughening at Atomically Smooth (110) and (100) n-TiO2 (Rutile) Surfaces in Aqueous Acidic Solutions. J. Am. Chem. Soc.. 2005;127:12975-12983.
- [CrossRef] [Google Scholar]
- Calculation of TiO 2 Surface and Subsurface Oxygen Vacancy by the Screened Exchange Functional. J. Phys. Chem. Calc.. 2015;119:18160-18166.
- [CrossRef] [Google Scholar]
- Location of Hole and Electron Traps on Nanocrystalline Anatase TiO 2. J. Phys. Chem. C.. 2012;116:10796-10804.
- [Google Scholar]
- Novel synthesis method for photo-catalytic system based on some 3d-metal titanates. J Mater Sci Mater Electron. 2017
- [CrossRef] [Google Scholar]
- TiO 2 Immobilized in Cellulose Matrix for Photocatalytic Degradation of Phenol under Weak UV Light Irradiation. J. Phys. Chem. C.. 2010;114:7806-7811.
- [Google Scholar]
- Efficient Photocatalytic Degradation of Phenol over Co3O4/BiVO4 Composite under Visible Light Irradiation. J. Phys. Chem. B.. 2006;110:20211-20216.
- [CrossRef] [Google Scholar]
- Highly ordered TiO2 nanotube arrays with controllable length for photoelectrocatalytic degradation of phenol. J. Phys. Chem. C.. 2008;112:253-259.
- [CrossRef] [Google Scholar]


