

Total ginsenoside wild ginseng root improves spleen qi deficiency by regulating intestinal microbes and flora metabolites
⁎Corresponding authors. zhengfei@ccucm.edu.cn (Fei Zheng), yuehao@sohu.com (Hao Yue)
-
Received: ,
Accepted: ,
This article was originally published by Elsevier and was migrated to Scientific Scholar after the change of Publisher.
Peer review under responsibility of King Saud University.
Abstract
Spleen qi deficiency (SQD) is an important immune change in traditional Chinese medicine. Ginseng tonic for deficiency treatment focuses on qi tonicity, which is consistent with the modern medical view of immune enhancement. In this study, the therapy of wild ginseng (WG) extract was examined using weight measurement, histopathology, flow cytometry, and ELISA. Then, 16S rDNA gene sequencing of the gut microbiota and fecal RRLC-Q-TOF tandem mass spectrometry-based metabolomic analysis were carried out. Finally, the relationship among immunity indicators, permeability indicators, gut microbiota and metabolites was analyzed. Results showed that WG administration significantly increased the body weight and organ index in SQD rats; significantly reversed the levels of immune markers, such as IgA and TNF-a; decreased serum levels, such as LPS; and increased the expression of tight-junction proteins, such as ZO-1, in colonic tissues. The abundance of intestinal microorganisms, such as Lactobacillus and Akkermansia, was restored in SQD rats. Elevated amino acid content and decreased bile acid content were observed in fecal metabolites. Overall, this study demonstrated the central role of WG in immunomodulation and intestinal microecology in SQD rats, providing a reference for a more in-depth study of the scientific connotation of the traditional efficacy of WG and the interpretation of its clinical pharmacodynamic mechanism.
Keywords
Wild ginseng
Gut microbiota
Metabolomics
Immune function
Spleen qi deficiency

1 Introduction
In traditional Chinese medicine (TCM), the qi of cereal essence is transformed by the spleen and stomach after digestion and absorption of food, and then it becomes the main source of qi in the spleen and the whole body (Huang et al., 2020). The number of disorders associated with functional hyposplenism caused by spleen qi deficiency (SQD) has increased substantially over the past couple of decades. SQD is a common immune disorder described in TCM texts (Zhou et al., 2019). The malfunctioning of the immune system always results from the malfunctioning of qi (Li et al., 2021). SQD impairs gastrointestinal function and reduces the ability to obtain nutrients, which then leads to the decline in immune function (Wang et al., 2020). Related studies in treatment of SQD symptoms mainly focused on the regulation of gastrointestinal and immunoregulatory functions (Tamura et al., 2004; Zhang et al., 2022; Liu et al., 2015).
The intestinal flora and its metabolic function are the material basis for verifying the objective existence and function of the spleen in TCM (Feng et al., 2018). Altered intestinal microbes and metabolites have been demonstrated in rats with spleen deficiency. Yi et al. showed that 31 metabolites and 11 intestinal microbes were altered in spleen-deficient rats (Yi et al., 2022). The gut microbiota plays a critical role in maintaining immune homeostasis. Considerable studies investigated the potential role of microbiota in communicating with an organism’s immune system via the microbiota–gut–immune axis to modulate body immunity (Michelini et al., 2018). The gut microbiota primarily interacts with the host through metabolites, which are small molecules that are produced as intermediate or end products of microbial metabolism (Lavelle and Sokol 2020). One of the most promising areas of the practical use of inorganic compounds is a biomedical one (Dukenbayev et al., 2019, Tishkevich et al., 2019). To date, alterations in the intestinal microbiota and gut microbiota-derived metabolites have been recognized in many immune-related inflammatory disorders. For example, some microbiota and metabolites improve host physiology such as short-chain fatty acids (SCFAs), immune maturation, immune homeostasis, host energy metabolism, and mucosal integrity maintenance (Trukhanov et al., 2019, Tao et al., 2021, Vinnik et al., 2021). In addition, tryptophan catabolites determine immune responses by binding to the aryl hydrocarbon receptor (AhR) (Gao et al., 2018).
As an herb with a long medicinal history, Panax ginseng C.A. Mey. (ginseng) has a potential role in reinforcing vital energy and rescuing the dying applied to the treatment of consumptive diseases as the first-choice drug (Wang et al., 2020). Modern research showed that ginseng has antifatigue, immunity-boosting, and metabolism-boosting effects (Wang et al., 2020). Ginseng has two types: cultivated ginseng (CG) and wild ginseng (WG). CG remarkably increases swimming time and improves blood and biochemical indices and organism metabolism in rats with SQD. Many studies examined the relationship and influence of CG on human gut microbiota (Zhang et al., 2021, Zheng et al., 2021). Ginsenosides serve as energy substrates for specific intestinal bacteria, thereby regulating the gut microbiota, and the reshaped gut microbial ecosystem can trigger several molecular and cellular signaling pathways (Liu et al., 2021, Almessiere et al., 2022, Almessiere et al., 2022). In addition, CG extracts modulate glucose and amino acid metabolism by altering the structure and diversity of the intestinal flora in rats with spleen deficiency syndrome (Li et al., 2020). WG refers to CG seeds or seedlings grown under natural forest conditions for many years with little human interference; it is thought to be more effective than CG in preventing diseases (Sun et al., 2016, Li et al., 2017). However, the therapeutic basis and mechanism of WG for reinforcing vital energy through the intestinal flora and flora metabolites remain unclear.
In this study, a multifactor composite method of strain and fatigue injuring the spleen and dietary disorders was used to establish an SQD model. The immune-enhancing and protective effects of WG on the epithelial cells of rats were evaluated by analyzing immune indicators, immune organs, immune cells, endotoxins, and tight-junction (TJ) proteins. 16 s RNA gene sequencing and RRLC-Q-TOF were used to detect the variation of intestinal flora and filter differential metabolites that reveal the underlying mechanism. The results indicated that the total saponins of WG have immunomodulatory effects, and the mechanism may be related to the intestinal microbial–flora metabolite axis.
2 Materials and methods
2.1 Materials and reagents
WG (15–20 years old) and CG (5 years old) were obtained from the Wanliang ginseng market (Fusong, China), and Shenling Baizhu Powder was obtained from Tongrentang (Beijing, China). All herbal medicines were identified by Prof. Shumin Wang (Changchun University of Chinese Medicine). HPLC–mass spectroscopy (MS)-grade methanol, acetonitrile, and formic acid were purchased from TEDIA (Fairfield, OH, USA). Ultrapure water was filtered through a Milli-Q system (Millipore, Billerica, MA, USA). The ginsenoside standards (purity ≥ 98%) were obtained from Yuanye (Yuanye, Shanghai, China). The fecal genomic DNA extraction kit was obtained from Chengdu Bainuo Co., Ltd. (Chengdu, China), and all assay kits for R&D (Minneapolis, MN, USA), PBS, RPMI-1640 medium and FBS were obtained from Gibco (Carlsbad, CA, USA). The antibodies used for staining included claudin-1, occludin, ZO-1, FITC-CD4+, PE-CD8+, and PE-CY5-CD3+ (BD Biosciences, USA).
2.2 Preparation of total ginsenoside (TG) ginseng root
WG and CG crude powders were extracted two times in water for 2 h each time. The extracts were combined, and column chromatography was carried out on macroporous absorption resin D101 by eluting with water to remove impurities and then with 60% EtOH. The filtrate was concentrated to a clear cream with a relative density of 1.06–1.08 (80 °C), dried, and crushed to obtain TG. Then, the TG solid samples were redissolved with 1 mL methanol and filtered through a 0.22 μm membrane filter before LC–MS.
2.3 UPLC-Q-Orbitrap-MS/MS of TG
Chromatographic separation was performed on an Ultimate 3000 ultrahigh-performance liquid chromatography system (Thermo Fisher Scientific, Dionex, Sunnyvale, CA, USA) coupled with Sigma Supelco Ascentis Express C18 column (50 × 3.0 mm, 2.7 µm, Sigma–Aldrich, USA). The column oven temperature was maintained at 35 °C, and 100% acetonitrile and water with 0.1% formic acid were used as mobile phases B and A, respectively. The separation of experimental samples was programmed using the following gradient elution: the proportion of acetonitrile (B) was increased to 15%–15% (0–5 min), 15%–19% (5–10 min), 19%–25% (10–13 min), 25%–28% (13–15 min), 28%–28% (15–18 min), 28%–30% (18–22 min), 30%–35% (22–25 min), 35%–40% (25–30 min), 40%–60% (30–35 min), 60%–80% (35–38 min), 80%–100% (38–40 min), and 100%–100% (40–45 min). Finally, the gradient elution was adjusted from 100% to 15% (45–50 min) and maintained at 15% for 10 min. The injection volume, flow rate, and sample chamber temperature of the autosampler were 5 μL, 0.4 mL·min−1, and 4 °C, respectively.
MS was carried out on a Q-Orbitrap-MS/MS (Thermo Fisher, San Jose, CA, USA) equipped with an ESI source operated in negative ion mode. The parameters of the ion source were set as follows: sheath gas flow of 40 Arb, aux gas flow of 10 Arb, and sweep gas flow of 1 Arb. The S-Lens RF was 55%. The capillary voltage was set to 2.5 kV with a capillary temperature of 320 °C. Full-scan MS data ranging from m/z 150 to 2000 Da were acquired at the centroid mode, with 70,000 resolution, automatic gain control, a target of 1 × 10⁶, and a maximum injection time of 100 ms.
2.4 Animal experiments
Fifty-four male SPF Wistar rats (weight, 200 ± 20 g; age, 5 weeks) were obtained from Liaoning Changsheng Biotechnology Co. Ltd (Liaoning, China; Certificate of Conformity: SCXK [Liao] 2015‐0001). All experiments were performed in accordance with the Regulations of Experimental Animal Administration, and the protocol was approved by the Animal Care and Use Committee of CCUCM (protocol number: 2021272). The rats were set in an SPF environment and given free access to food and water for a week. Then, they were randomly assigned into nine groups (six rats in each group), including normal control (K), model control (M), positive control (Y, Shenling Baizhu Powder, 1.62 g·kg−1), WG-administered (WH: 1.62 g·kg−1, WM: 0.81 g·kg−1, and WL: 0.41 g·kg−1), and CG-administered (CH: 1.62 g·kg−1, CM: 0.81 g·kg−1, and CL: 0.41 g·kg−1) groups. The high, medium, and low doses in the WG and CG dosing groups were 18, 9, and 4.5 g·day−1·person−1 (70 kg), respectively. Calculations were performed in accordance with the rat and human conversion factor of 6.3. The K and M groups received an equal volume of physiological saline. The SQD rat model was established through “dietary restriction and overstraining” (Liu et al., 2021). The rats were placed in a constant temperature water tank (23 °C ± 1 °C, water depth of 40 cm, weighted with 10% wire) for exhaustion swimming (exhaustion was defined as sinking at the end of the swimming and not being able to return to the water surface after 10 s) and fed with 100 g·kg−1 diet for 30 days. The weight change in rats was evaluated every 5 days. On the last day of modeling administration, the feces of each group of rats were collected. Blood, spleen, kidney and small intestine tissues were collected for use, and the weight of the thymus and spleen was recorded. Furthermore, the organ index was calculated as follows: organ index = organ mass (mg)/animal body weight (g).
2.5 Histological evaluation
The spleen, thymus, kidney, and small intestine tissues were collected and stored in pre-cooled 4% paraformaldehyde solution at 4 °C for fixation. After 48 h of tissue fixation, the tissues were dehydrated using alcohol. Then, they were immersed in a mixture of different ratios of anhydrous ethanol and xylene. After the tissues became transparent, they were waxed, embedded, and sectioned. Afterwards, HE staining was performed, and the stained spleen, thymus, kidney, and small intestine were observed under a light microscope (Leica Microsystems, Germany).
2.6 Testing of blood index, immune index and intestinal permeability
One milliliter of abdominal aortic blood was placed in an EDTA-K2 anticoagulation tube. Blood was routinely analyzed by examining the blood parameters with the use of a Pentra80 automatic hematology analyzer (ABX, Inc). The rest of the plasma was placed in EP tubes, stored at 4 °C for 1 h, and then centrifuged for 20 min at 3000 rpm. The supernatant was collected, and immunoglobulins G, A and M (IgG, IgA and IgM, respectively), secretory immunoglobulin A (sIgA), complement proteins 3 and 4 (C3 and C4), interleukin (IL)-6 and IL-2, tumor necrosis factor-α (TNF-α), interferon-γ (IFN-γ), amine dioxide (DAO), endotoxin (LPS) and D-lactose (D-Lac) were detected by ELISA in strict accordance with the instructions on the kits.
2.7 Immunofluorescence staining
Colon tissues were deparaffinized before being placed in xylene for 20 min. Slices were submerged for 5 min at 100%, 95%, 85% and 75% ethanol concentrations and then boiled in an electric furnace after being immersed in citrate buffer. The slices were cleaned for 3 min with 0.01 M PBS (pH 7.4) and then immersed in a sodium borohydride solution for 30 min at room temperature. Next, they were submerged in Sudan black dye solution for 5 min at room temperature. Afterwards, slices were blocked for 30 min and then placed in the first antibody overnight at 4 °C. A secondary antibody was then added to the slices after 24 h. Furthermore, the slices were stained in the nucleus with DAPI solution at 37 °C before being observed with a fluorescence microscope. Further details can be found in the method of Wang et al (Wang et al., 2021).
2.8 Determination of cytokines
Peritoneal macrophages were isolated by peritoneal lavage. The rats were anesthetized with ether, and peritoneal cavities were lavaged with RPMI1640 with 10% (v/v) heat-inactivated FBS. The peritoneal macrophages were counted and seeded in a 96-well plate (1 × 10⁶). After they were incubated for 5 h in a humidified incubator at 37 °C with 5% CO2, the macrophages were washed with RPMI1640 two times, added with 100 μL lysis buffer, and then incubated overnight at 4 °C. The absorbance was measured at 540 nm.
The spleens were excised to prepare single-cell suspensions by aseptic manipulation. After red blood cells (RBCs) were removed with lysis, the cells were washed with PBS three times and centrifuged at 1000 rpm for 5 min. Splenic lymphocytes (1 × 10⁶ cells·mL−1) were pretreated with RPMI1640 containing 10% FBS, seeded into 96-well cell culture plates for 72 h at 37 °C with 5% CO2, and exposed to ConA (5 μg/mL). Then, MTT (5 mg·mL−1) reaction was added, and the plates were incubated for 4 h. Finally, the culture solution was discarded, and 150 μL DMSO was added to each well. The absorbance was measured at 570 nm.
Splenic lymphocytes were cultured as previously described and then stained with a rat T-lymphocyte subset antibody cocktail (consisting of FITC-CD4+, PE-CD8+, and PE-CY5-CD3+ rat antibodies) for 30 min at 4 °C. Afterwards, the samples were washed two times, fixated with 1% formaldehyde, and measured by flow cytometry (Beckman Coulter, CytoFLEX, Brea, CA, USA) to determine CD3+, CD4+, and CD8+ lymphocytes.
2.9 Fecal sample preparation
Fecal samples (100 mg) were dissolved directly using 900 µL methanol. The samples were vortexed for 60 s and centrifuged at 13,000 r·min−1 (10 min at 4 °C). Then, the collected supernatants were filtered through a 0.22 μm membrane filter before LC–MS. Quality control (QC) samples were composed of five groups of fecal samples.
2.10 RRLC-Q-TOF MS/MS of feces
The rapid resolution liquid chromatography (Agilent 1200 RRLC, Santa Clara, CA, USA) system was equipped with a binary pump, a micro‐degasser, an auto-plate sampler, and a thermostatically controlled column apartment; the mass spectrometer (Agilent 6520 Q-TOF MS, Santa Clara, CA, USA) was equipped with an electrospray interface and automatic calibration system. Liquid chromatography separation was performed on a Sigma Supelco Ascentis Express C18 column (50 mm × 3.0 mm, 2.7 µm, Sigma–Aldrich, USA) at 35 °C. Formic acid (0.1%, v/v) and 100% acetonitrile were used as mobile phases A and B, respectively. The initial elution was 5% B, and the gradient elution was programmed as follows: 5%–15% (0–5 min), 15%–22% (5–8 min), 22%–45% (8–15 min), 45%–70% (15–18 min), 70%–95% (18–23 min), 95%–5% (23–25 min), and 5%–5% (25–28 min). The flow rate was 0.4 mL·min−1, and the injected sample volume was 5 μL.
This RRLC system was connected to a Q-TOF mass spectrometer. The Q-TOF-MS scan range was set at m/z 150–2000 in positive and negative modes. The ESI source was set as follows: drying gas (N2) flow rate of 8.0 L·min−1, drying gas temperature of 350 °C, nebulizer set at 30 psig, capillary voltage of 3,500 V, fragmentor set at 175 V, and skimmer set at 65 V.
2.11 Multiplex data processing
The MS data were analyzed by MassHunter (Agilent Technologies). The original data collected by MS were processed using Mass Profiler Professional software (MPP 2.2, Agilent Technologies), including noise filtering, overlapping peak analysis, peak alignment, peak matching, standardization, and normalization. The acquired data were imported into a free online platform called Metware Cloud (https://cloud.metware.cn) for multivariate data analysis (principal component analysis [PCA], OPLS-DA, and s-plot). Different biological metabolites were selected on the basis of the VIP value of the s-plot (>1) and T-test (p < 0.05). The compounds detected by LC–MS were identified on the basis of a search of accurate masses of peak features against the online KEGG (https://www.kegg.jp/) and HMDB (https://www.hmdb.ca) databases.
2.12 16 s rRNA gene sequencing
Fresh fecal samples of rats in each group were collected and stored in an aseptic freezer, quick-frozen in liquid nitrogen for 1 h, and stored in a refrigerator at − 80 °C. The samples were analyzed for whole-length 16S rRNA diversity. The whole region of the 16S rRNA gene was amplified with 27F (5′-AGRGTTTGATYNTGGCTCAG-3′) and 1492 R (5′-TASGGHTACCTTGTTASGACT T-3′) primers. The products were amplified using the following conditions: 95 °C for 5 min, 30 cycles of 95 °C for 30 s, 50 °C for 30 s, and 72 °C for 60 s, with a final extension step at 72 °C for 7 min. After the products were purified with MagicPure Size Selection DNA Beads (TransGen Biotech, Beijing, China), they were sequenced on the PacBio platform by Biomarker Technologies Corporation (Beijing, China). The optimized circular consensus sequences were obtained after filtering using the threshold of minPasses ≥ 5, minPredictedAccuracy ≥ 0.9, and length between 1200 and 1650 bp (Lima version 1.7.0 and Cutadapt 1.9.1). Amplicon sequence variants (ASVs) were obtained after denoising using dada2. Annotation was conducted by querying against SILVA 132. Taxon summary and calculation of alpha and beta diversities were conducted using the QIIME2 2020.6 pipeline. PCoA (based on dissimilarity matrices) was used to visualize the dissimilarity of beta diversity, and PERMANOVA (Adonis function in the Vegan package) was performed to test the composition differences at the ASV level.
2.13 Statistical analysis
The results are presented as the mean ± standard deviation. The values were analyzed using one-way analysis of variance followed by Tukey’s post hoc test. Differences were considered statistically significant at p < 0.05. Data analysis was performed using GraphPad Prism version 8.2.0 for Windows (GraphPad Software, San Diego, California USA).
3 Results and discussion
3.1 Analysis of ginsenosides in TG
The identification and analysis of ginsenosides in the aqueous extract of WG by UPLC-Q-Orbitrap-MS/MS, which is a representative total ion current chromatogram in electrospray ionization (ESI−) mode, are shown in Fig. 1A. A total of 36 chromatographic peaks were characterized on the basis of retention time, accurate molecular mass, and fragment ions by matching these data with the corresponding data of known compounds in standards (Table 1) and combining related literature analyses (Wang et al., 2016). Three ginsenosides were used as an example: protopanaxadiol saponin Rg3 (compound 29), protopanaxatriol saponin Rf (compound 9) and oleanolic saponin Ro (compound 17). The MS/MS fragmentation of ginsenosides showed fragment ions with their corresponding structures (Supplemental Fig. 1). The proportions of ginsenosides in WG were different compared with those from the previous studies on ginsenoside composition in CG (Li et al., 2008, Wang et al., 2021).
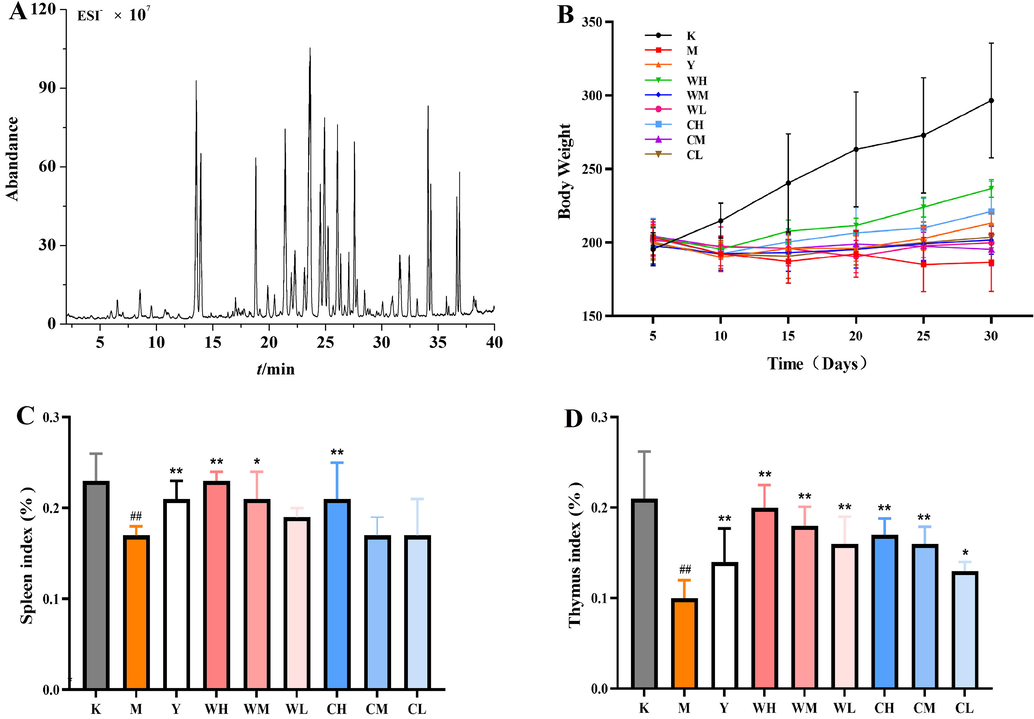
- Ginsenoside analysis of total ion chromatography (TIC) of total ginsenosides (TGs) in electrospray ionization (ESI−) mode (A); body weight and organ indices of rats in each group: body weight (B), spleen index (C), and thymus index (D). Note: Compared with the blank group (K), # represents significant difference (p < 0.05), and ## represents highly significant difference (p < 0.01) in the model group (M). Compared with the model group (M), * represents significant difference (p < 0.05), and ** represents highly significant difference (p < 0.01) in the drug administration group (Y, WH, WM, WL, CH, CM, and CL).
| No. | tR/min | [M−H]−/[M + COOH]− (m/z) | Name | Molecular formula | ESI-MS2 |
|---|---|---|---|---|---|
| 1 | 6.37 | 861.48993 | Re5 | C42H72O15 | MS2[8 6 1]637, 475, 161, 143,131, 113, 101 |
| 2 | 9.07 | 1007.54816 | Re1 | C48H82O19 | MS2[1007] 945, 783,621, 459, 293, 221, 191, 149,101 |
| 3 | 9.28 | 977.53784 | R1 | C47H80O18 | MS2[9 7 7]799, 637, 475,293, 149, 131, 113, 101 |
| 4 | 10.13 | 977.53760 | Re4 | C47H80O18 | MS2[9 7 7]799, 637, 475,293, 149, 131, 113, 101 |
| 5 | 11.17 | 1007.54871 | Re2 | C48H82O19 | MS2[1007] 945, 783,621, 459, 293, 221, 191, 149,101 |
| 6 | 12.10 | 1007.54895 | Re3 | C48H82O19 | MS2[1007] 945, 783,621, 459, 293, 221, 191, 149,101 |
| 7 | 12.82 | 845.49396 | Rg1 | C42H72O14 | MS2 [8 4 5]637, 475, 179, 161, 101 |
| 8 | 13.34 | 991.55334 | Re | C48H82O18 | MS2 [9 9 1]799, 783, 637, 475, 307, 279, 205, 179, 145,101 |
| 9 | 18.47 | 799.49420 | Rf | C42H72O14 | MS2[7 9 9]637, 475, 221, 161, 149, 143, 119, 113, 101 |
| 10 | 19.41 | 815.48419 | F3 | C41H70O13 | MS2[8 1 5]637, 475, 161, 143,131, 113, 101 |
| 11 | 20.83 | 683.44063 | Rh1 | C36H62O9 | MS2 [6 8 3]475, 161, 101 |
| 12 | 21.02 | 829.49951 | Rg2 | C42H72O13 | MS2[8 2 9]637, 475, 307, 279,205, 145, 101 |
| 13 | 21.39 | 829.50006 | 20(R)Rg2 | C42H72O13 | MS2[8 2 9]637, 475, 307, 279,205, 145, 101 |
| 14 | 21.71 | 683.44116 | 20(R)Rh1 | C36H62O9 | MS2 [6 8 3]475, 161, 101 |
| 15 | 22.37 | 1209.63062 | Ra2 | C58H98O26 | MS2[1209]1077, 915, 783, 621,459, 293, 221, 191, 149, 101 |
| 16 | 22.83 | 1153.60583 | Rb1 | C54H92O23 | MS2[1153]945, 783, 621, 459,323, 221, 179, 101 |
| 17 | 23.87 | 955.49561 | Ro | C48H76O19 | MS2[9 5 5]793, 631, 455, 101,119, 221 |
| 18 | 24.14 | 1123.59546 | Rc | C53H90O22 | MS2[1123]945, 783, 621, 459,293, 221, 191, 149, 101 |
| 19 | 24.53 | 1209.63196 | Ra1 | C58H98O26 | MS2[1209]1077, 915, 783, 621,459, 293, 221, 191, 149, 101 |
| 20 | 25.50 | 1123.59570 | Rb2 | C53H90O22 | MS2[1123]945, 783, 621, 459,293, 221, 191, 149, 101 |
| 21 | 25.86 | 1123.59570 | Rb3 | C53H90O22 | MS2[1123]945, 783, 621, 459,293, 221, 191, 149, 101 |
| 22 | 27.18 | 991.55347 | Rd | C48H82O18 | MS2[9 9 1]783, 621, 459, 221,161, 101 |
| 23 | 27.43 | 1165.60681 | Rs1 | C55H92O23 | MS2[1165]1077, 1059, 945, 783,621, 459, 293, 221,191,149,101 |
| 24 | 28.10 | 1165.60693 | Rs2 | C55H92O23 | MS2[1165]1077, 1059, 945, 783,621, 459, 293, 221,191,149,101 |
| 25 | 30.59 | 811.48883 | Rg6 | C42H70O12 | MS2[8 1 1]619, 457, 307, 279,205, 145, 101 |
| 26 | 31.20 | 811.48828 | Rg4 | C42H70O12 | MS2[8 1 1]619, 457, 307, 279,205, 145, 101 |
| 27 | 31.30 | 665.43054 | Rk3 | C36H60O8 | MS2[6 6 5]457, 161, 101 |
| 28 | 32.05 | 665.4306 | Rh4 | C36H60O8 | MS2[6 6 5]457, 161, 101 |
| 29 | 33.85 | 783.49945 | Rg3 | C42H72O13 | MS2[7 8 3]621, 459, 323, 221,179, 101 |
| 30 | 34.12 | 783.49963 | 20(R)Rg3 | C42H72O13 | MS2[7 8 3]621, 459, 323, 221,179, 101 |
| 31 | 35.56 | 871.51068 | Rs3 | C44H74O14 | MS2[8 7 1]783, 621, 179, 459, 323, 101, 221 |
| 32 | 35.76 | 871.51080 | 20(R)Rs3 | C44H74O14 | MS2[8 7 1]783, 621, 179, 459, 323, 101, 221 |
| 33 | 36.51 | 811.48877 | Rk1 | C42H70O12 | MS2[8 1 1]603, 441, 323,221, 161, 101 |
| 34 | 36.74 | 811.48879 | Rg5 | C42H70O12 | MS2[8 1 1]603, 441, 323,221, 161, 101 |
| 35 | 37.79 | 853.50031 | Rs5 | C44H72O13 | MS2[8 5 3]765, 603, 161, 441, 323, 101, 221 |
| 36 | 38.22 | 853.50037 | Rs4 | C44H72O13 | MS2[8 5 3]765, 603, 161, 441, 323, 101, 221 |
3.2 WG alleviation of pathological changes in SQD rats
As shown in Fig. 1B, the body weight of the Y group and the different doses of WG and CG increased from day 10 onwards compared with that of the M group. The improvement effect of WG and CG in the high-dose administration group was evident, but the increase was always lower than that of the K group and higher than that of the Y group. The WG-administered group was dose-dependent, and the CG-administered group showed weight improvement. However, this improvement was not significant. The increase in body weight indicated that the rats’ body functions gradually recovered, which can alleviate weight loss and maintain the metabolism of nutrients required by the body.
The effect of organ indices in each group showed (Fig. 1C and D) that the spleen and thymus indices of the M group were significantly lower than those of the K group (p < 0.01), indicating that the rat model of SQD certificate was successfully established, and that SQD certificate seriously damaged the spleen and thymus of rats. The spleen indices of the Y, WH, and CH groups were significantly higher than that of the M group (p < 0.01). Furthermore, the WM (p < 0.05) and WL groups had increased spleen indices among the other dosing groups. WG and CG extracts protected the rats from organ damage in a dose-dependent manner, and the protective effect of WG on the spleen was more pronounced. The thymus indices of different doses of WG and CG were higher than those of the M group, showing significant differences (p < 0.01) except for GL (p < 0.05). Furthermore, the recovery of organs in the WH group was similar to that in the K group, indicating that the WH group repaired damage to immune organs and enhanced organ immunity.
3.3 WG improvement of blood biochemical parameters
The main blood parameters in the SQD model included white blood cells (WBCs), lymphocytes (LYMPHs), RBCs, hemoglobin (HGB) and platelets (PLTs). Among them, WBCs, LYMPHs and PLTs were below the normal range. WG and CG significantly increased the number of blood parameters (Fig. 2A–E). WH significantly increased the number of WBCs, RBCs, PLTs (p < 0.01) and LYMPHs (p < 0.05), whereas the other administration groups showed only significantly increased WBCs and PLTs (p < 0.05). In addition, CH significantly increased the number of RBCs (p < 0.05), indicating that WG can restore the hematopoietic function in rats with SQD. No difference in HGB content was observed among the groups (p > 0.05). Serum biochemical parameters reflect the comprehensive function of body organs and nutritional metabolism (Wang et al., 2020). Studies reported that the immune function of spleen-deficient mice decreases, and the number of PLTs and WBCs is reduced. Moreover, strengthening the spleen and improving qi have significant efficacy in treating patients with immune thrombocytopenia and spleen deficiency (Ye et al., 2017). The results showed that WG can effectively adjust the metabolism of immune organs in the host’s body through blood circulation, maintain the dynamic balance of the internal and external environment, and then improve blood biochemical indices.
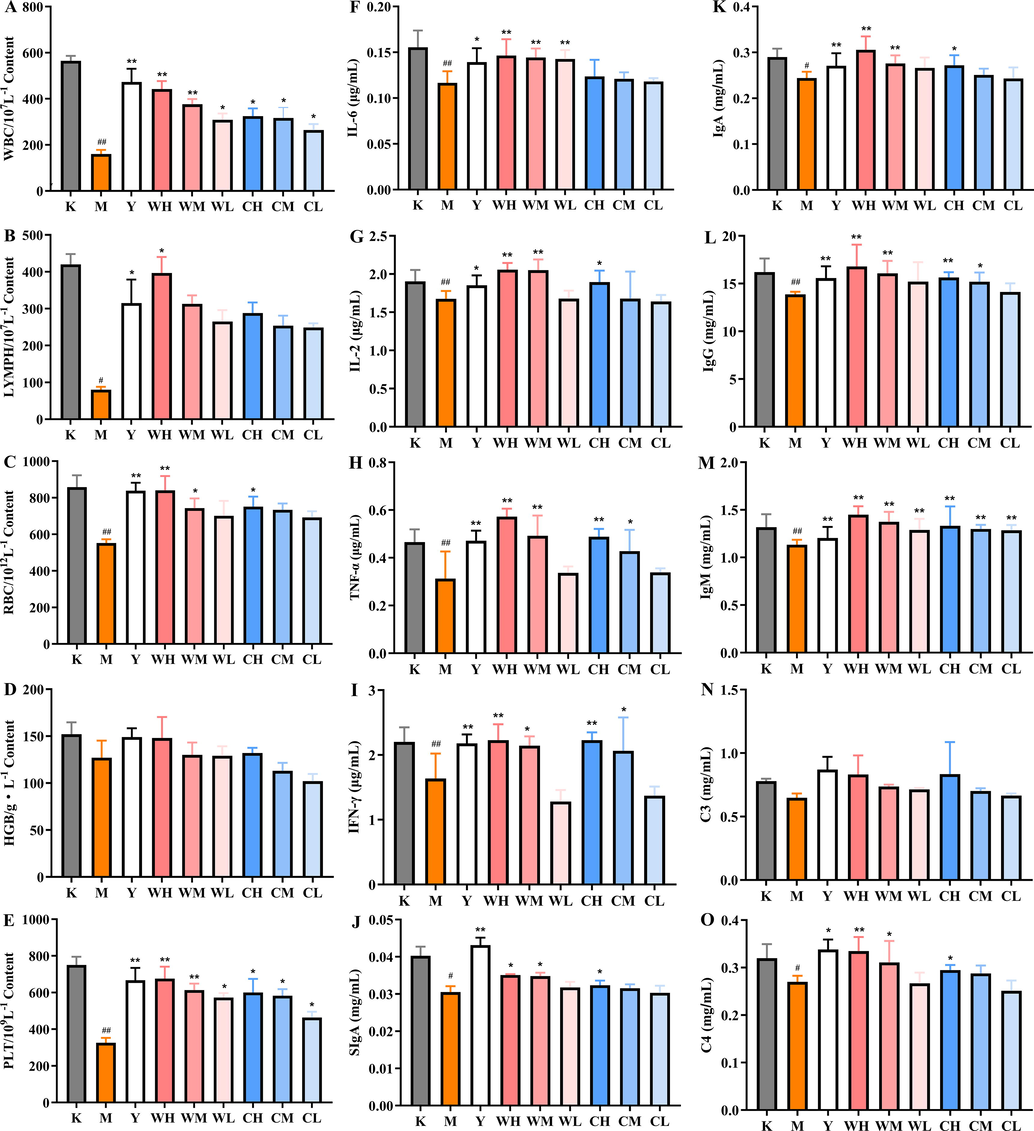
- Basic immune-related indicators. (A) WBC, (B) LYMPH, (C) RBC, (D) HGB, (E) PLT, (F) IL-6, (G) IL-2, (H) IFN-γ, (I) TNF-α, (J) sIgG, (K) IgA, (L) IgG, (M) IgM, (N) C3, and (O) C4. Note: Compared with the blank group (K), # represents significant difference (p < 0.05), and ## represents highly significant difference (p < 0.01) in the model group (M). Compared with the model group (M), * represents significant difference (p < 0.05), and ** represents highly significant difference (p < 0.01) in the drug administration group (Y, WH, WM, WL, CH, CM, and CL).
3.4 WG regulation of immune parameters
The changes in the levels of immune indicators in each group are shown in Fig. 2F–O. All immune parameters except for C3 (p > 0.05) were significantly altered throughout the experimental period. The M group had highly significant reductions in IL-6, IL-2, TNF-α, IFN-γ, IgG and IgM levels (p < 0.01) and significant reductions in SIgA, IgA and C4 (p < 0.05). By contrast, WH significantly increased the level of immune factors except for SIgA and C3 (p < 0.01). Moreover, with the increase in the dose of WG, the levels of immune parameters increased and improved in a dose-dependent manner. The immune factor levels were significantly increased in the CH group except for IL-6 and C3 (p < 0.05), with more significant increases in TNF-a, IFN-γ, IgG and IgM (p < 0.01). The CG-administered groups also showed a dose-dependent trend, but almost no significant difference was observed between CM and CL. Dysregulation of spleen immunity leads to a decrease in the levels of cytokines, such as serum pro-inflammatory factors IL-6 and TNF-α. The immune factors were significantly enhanced by WG in a dose-dependent manner. The results of Yang et aL. study on spleen-deficient mice were the same as those of the present study (Yang et al., 2012). The secretion of cytokines IL-2, IL-6 and TNF-a plays a suppressive role in lupus erythematosus autoimmunity (Du et al., 2016). In the present study, the expression of immunoglobulin and interleukin was correlated with the occurrence and evolution of SQD, indicating that the deficiency of spleen qi leads to immunodeficiency and inflammatory response. The ability of WG to improve immune factors was higher than that of CG, so WG significantly improved the immune function of SQD rats.
3.5 WG reduction in intestinal permeability
The results showed that the SQD rat model was successfully established and the drug intervention can alleviate the symptoms of SQD rats to some extent, among which high doses of WG and CG showed better improvement. Subsequent experiments focused on the immunomodulatory function of the WG and CG high-dose groups in rats with SQD. The gut microenvironment has strong interactions with the immune system; the immune system can control the gut microenvironment, and the gut microenvironment can shape immunity (Ashrafian et al., 2021). However, the potential role of the gut microenvironment modulated by WG in regulating the immune response remains unclear. When the intestinal mucosal barrier function is impaired, intestinal mucosal cells are shed into the intestinal lumen, and pathogenic bacteria in the intestine, particularly Gram-negative bacteria, could proliferate and release large amounts of toxins into the portal circulation (Shukla et al., 2021, Wang et al., 2021). The present study showed (Fig. 3A–C) that DAO, LPS and D-Lac were significantly higher in the M group than in the K group (p < 0.05), indicating that intestinal permeability and impaired intestinal barrier function increased, resulting in an increased proportion of toxic substances in the intestine entering the circulation of body fluids. Compared with M, Y and WH could significantly reduce intestinal permeability (p < 0.01), and CH could significantly reduce the levels of DAO and LPS (p < 0.01). To determine the role of WH on the restoration of intestinal barrier structure, the expression levels of claudin-1 (Fig. 3D), occludin (Fig. 3E) and ZO-1 (Fig. 3F) in colon tissues were detected by immunofluorescence staining, and their fluorescence intensity was measured (Fig. 3G–I). The data showed that the intestinal barrier was impaired in SQD rats, resulting in the downregulation of claudin-1, occludin (p < 0.05) and ZO-1 (p < 0.01). However, the fluorescence intensity significantly rebounded after WH treatment, different from the M group (p < 0.05), indicating that WH can restore the expression of the three proteins. Overall, the results showed that WH reduced the release of DAO, LPS and D-Lac, in addition to a significant enhancement of TJ protein expression in the intestine. Thus, WH has a stronger intestinal barrier function that prevents toxic substances from entering the humoral immune system and better intestinal regulation.
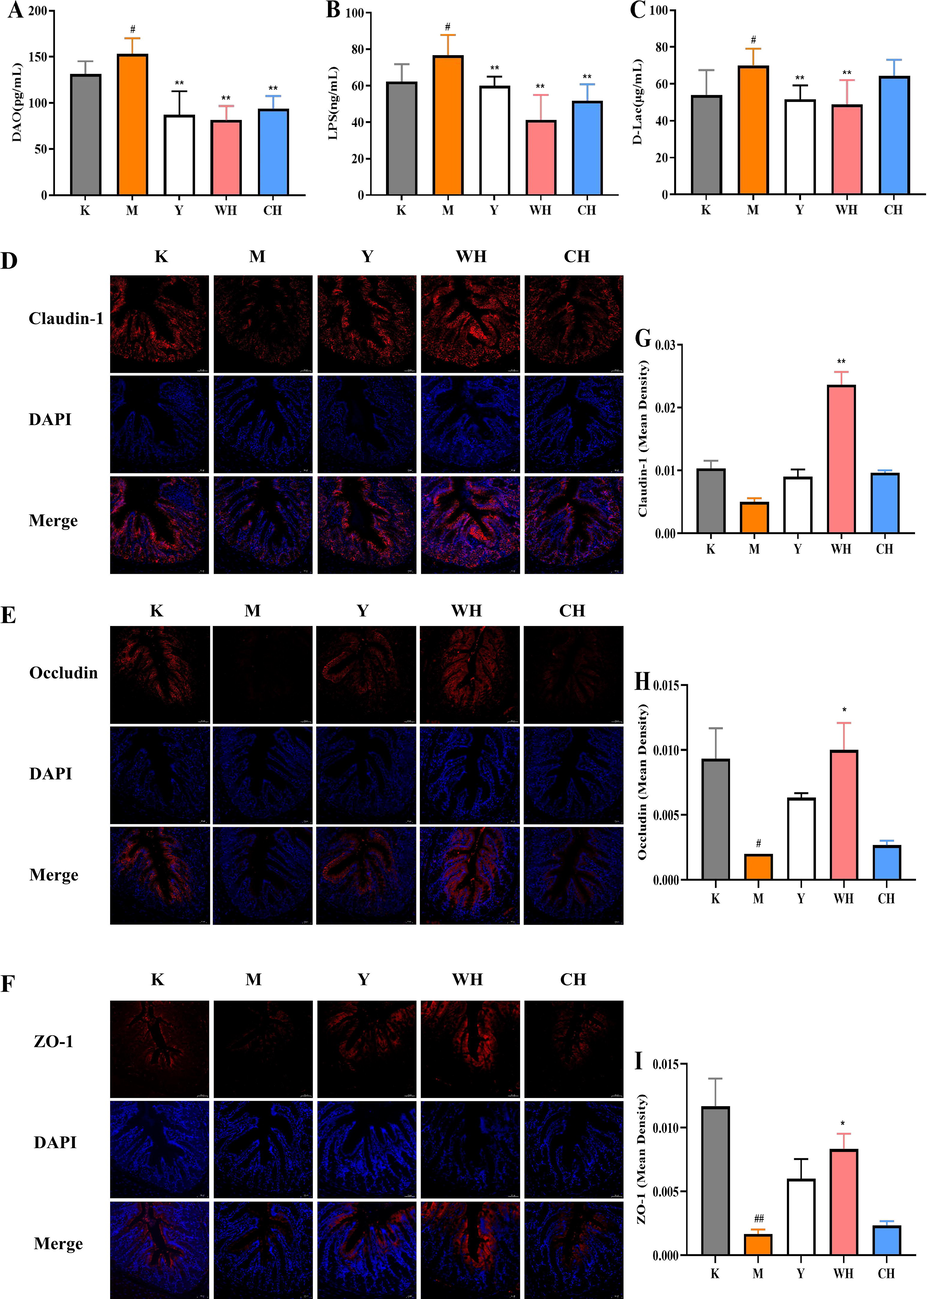
- Recovery effect of WG on intestine barrier structure. (A) Concentration of DAO in serum. (B) Concentration of LPS in serum. (C) Concentration of D-Lac in serum. (D) Immunofluorescence of claudin-1. (E) Immunofluorescence of occludin. (F) Immunofluorescence of ZO-1. (G) Relative fluorescence intensity of claudin-1. (H) Relative fluorescence intensity of occludin. (I) Relative fluorescence intensity of ZO-1. Note: Compared with the blank group (K), # represents significant difference (p < 0.05), and ## represents highly significant difference (p < 0.01) in the model group (M). Compared with the model group (M), * represents significant difference (p < 0.05), and ** represents highly significant difference (p < 0.01) in the drug administration group (Y, WH, and CH).
3.6 WG reversal of organ damage
The HE staining results of spleen, thymus, small intestine, and kidney tissue sections were further analyzed (Fig. 4). Compared with the K group, the M group had poorly delineated white and red pulp, inflammatory cell infiltration, increased fibrous tissue in the splenic cords, and reduced peri-arterial lymph sheaths. Thymocytes were significantly reduced, and the tissue was loosely arranged. The small intestinal villi were significantly shortened and irregularly arranged, and the gap with the intestinal wall increased. The kidney has inflammatory cells infiltrating the lumen of the kidney bursa, with thickened capillary walls and distal tubule walls and connective tissue proliferation. The changes in the organs of rats with SQD indicated a decrease in the overall immune function of the organism. Compared with those in the M group, the cells and other structures in the other administration groups were intact, indicating that the drug administration can avoid organ damage to a certain extent. Fewer villi were found in the CH group than in the WH group. In addition, a significant increase in thymocytes was observed in WH, indicating increased immunity, and fewer cells were found in the CH group than in the WH group. An improvement in the lumen of the bursa was observed in CH, but a gap between the lumen and intestinal wall was found, and some of the walls of the bursa were hyperplastic. The organ morphology showed that WG improved the tissues of the rats with SQD, and CG can improve tissue damage. However, the damage can still be observed, which indicated that WG was more effective in improving organ lesions of rats with SQD. The results demonstrated that WG can also alleviate organic lesions in organs, such as the kidneys and small intestine, but not the spleen and thymus.
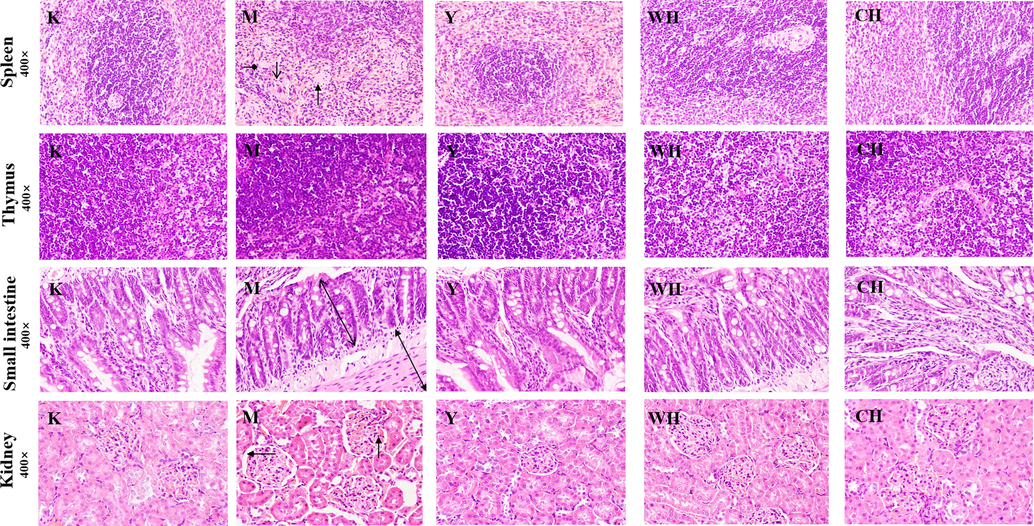
- Histological lesions of the spleen, thymus, small intestine, and kidney in various groups of rats. Note: Peri-arterial lymphatic sheath (
 ), inflammatory cells (
 ), Bauer’s bursa luminal space (
 ), splenic cord (
 ), distance between small intestinal villi and intestinal wall (
 ), and small intestinal villi (
 ).
).3.7 WG enhancement of phagocytic activity of macrophages and proliferative activity of lymphocytes
Macrophages are important for tissue repair, host defense mechanisms, and morphological reconstitution in many inflammatory responses (Cui et al., 2019). The effects of macrophage phagocytic activity in each group of rats are shown in Fig. 5A. The results showed that the macrophage phagocytic activity in the M group significantly decreased compared with that in the K group. Meanwhile, the macrophage phagocytic activity in the Y, WH, and CH groups significantly increased compared with that in the M group. In addition, the phagocytic activity of the WH and CH groups was close to that of the Y group (p < 0.05). In particular, the phagocytic index of the WH group was significantly higher than that of the M group (p < 0.01). The results indicated that WG can enhance macrophage activity, thereby enhancing the body’s resistance to infection and its intrinsic immune response. Splenic lymphocytes are immune responsive cells, and their proliferation directly indicates cellular immunity and lymphocyte precursor differentiation and proliferation (Bi et al., 2018). The results showed (Fig. 5B) the proliferation of lymphocytes in each group. The proliferation of lymphocytes was affected in the M group, with a reduced proliferation rate compared with the K group. Moreover, WH and CH increased the proliferation rate of splenic lymphocytes compared with M, with a significant difference in WH (p < 0.05). Studies confirmed that ginsenosides play a role in innate and adaptive immune functions and support epithelial integrity and immune function, including macrophages, natural killer cells, and lymphocytes. The results of the present study showed that the phagocytic activity of macrophages and the value-added activity of lymphocytes were reduced in SQD rats. WG intervention reversed the cellular activity.
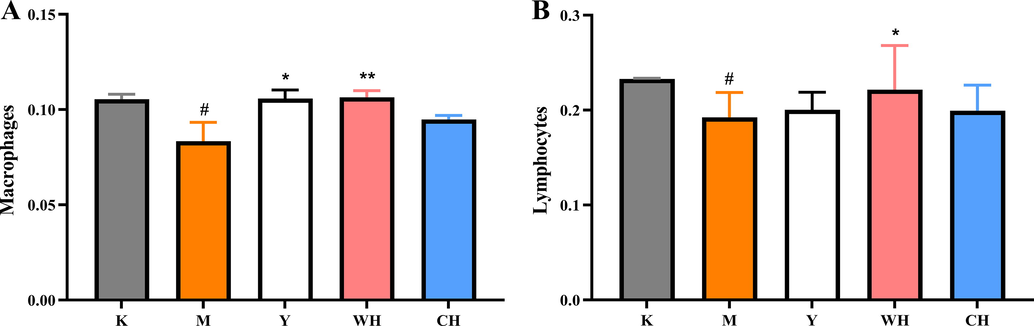
- Immune cell activity: (A) phagocytic activity of macrophages and (B) proliferative activity of lymphocytes. Note: Compared with the blank group (K), # represents significant difference (p < 0.05), and ## represents highly significant difference (p < 0.01) in the model group (M); compared with the model group (M), * represents significant difference (p < 0.05), and ** represents highly significant difference (p < 0.01) in the drug administration group (Y, WH, and CH).
3.8 WG alteration in lymphocyte subset ratios
Lymphocytes perform their immune functions by using relevant cell subsets, such as CD4+ and CD8+. Decreased levels of lymphocyte subsets in the spleen are affected by various factors, such as malignancy, autoimmune disease, receiving radiotherapy, chemotherapy or using immunosuppressive drugs (Wei et al., 2017). The results of the present experiment showed (Fig. 6) that the levels of lymphocyte subsets in the M group decreased compared with those in the K group, indicating that the lymphocyte subpopulation was disrupted, and immune function was low in rats with SQD. Compared with M, all drug interventions can promote the level of lymphocyte subsets, and WH and CH were more evident in increasing CD3+T and CD4+T levels, indicating that these drugs can promote T cell maturation. The drug can promote the maturation of T cells and serve as an immunomodulator, thereby producing more cytokines, which are proliferated and differentiated into effector cells to perform immune functions. The ability of WG to increase the number of lymphocyte subpopulations, which promoted the immune organs to perform their immune functions, was stronger than that of CG. Therefore, WG can enhance the immune function of the body at the cellular level.
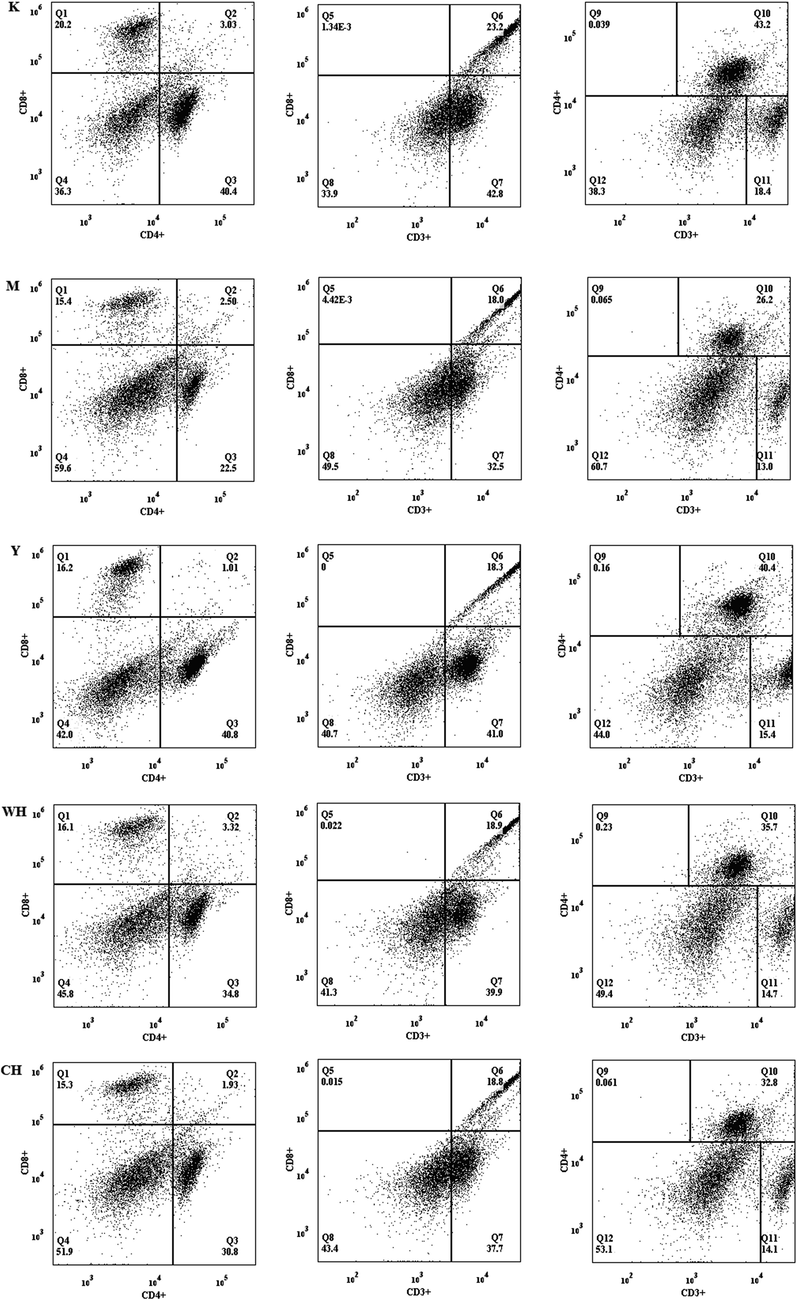
- Effect of WG on the expression of spleen lymphocyte subpopulations in rats with SQD.
3.9 WG modulation of fecal metabolites
SQD is usually determined using animal signs and organ indices, but these indices can hardly elucidate its essence. The current research on SQD markers usually focuses on obtaining differential metabolites through urine and blood (Xu and Wang 2020). Feces contains many small-molecule endogenous metabolites, which are a key objective of metabolomics research. The fecal metabolite profiles (TIC) of each group of rat fecal samples were obtained by RRLC-Q-TOF MS in negative (ESI−) and positive (ESI+) ion detection modes (Fig. 7A and B). A total of 29,875 compound information were obtained in ESI+ mode, and 838 compound information were obtained in ESI−. PCA was used to differentiate the five groups (Fig. 7C and D), with the M group significantly deviating from the K group, indicating significant changes in the metabolites of the M samples.
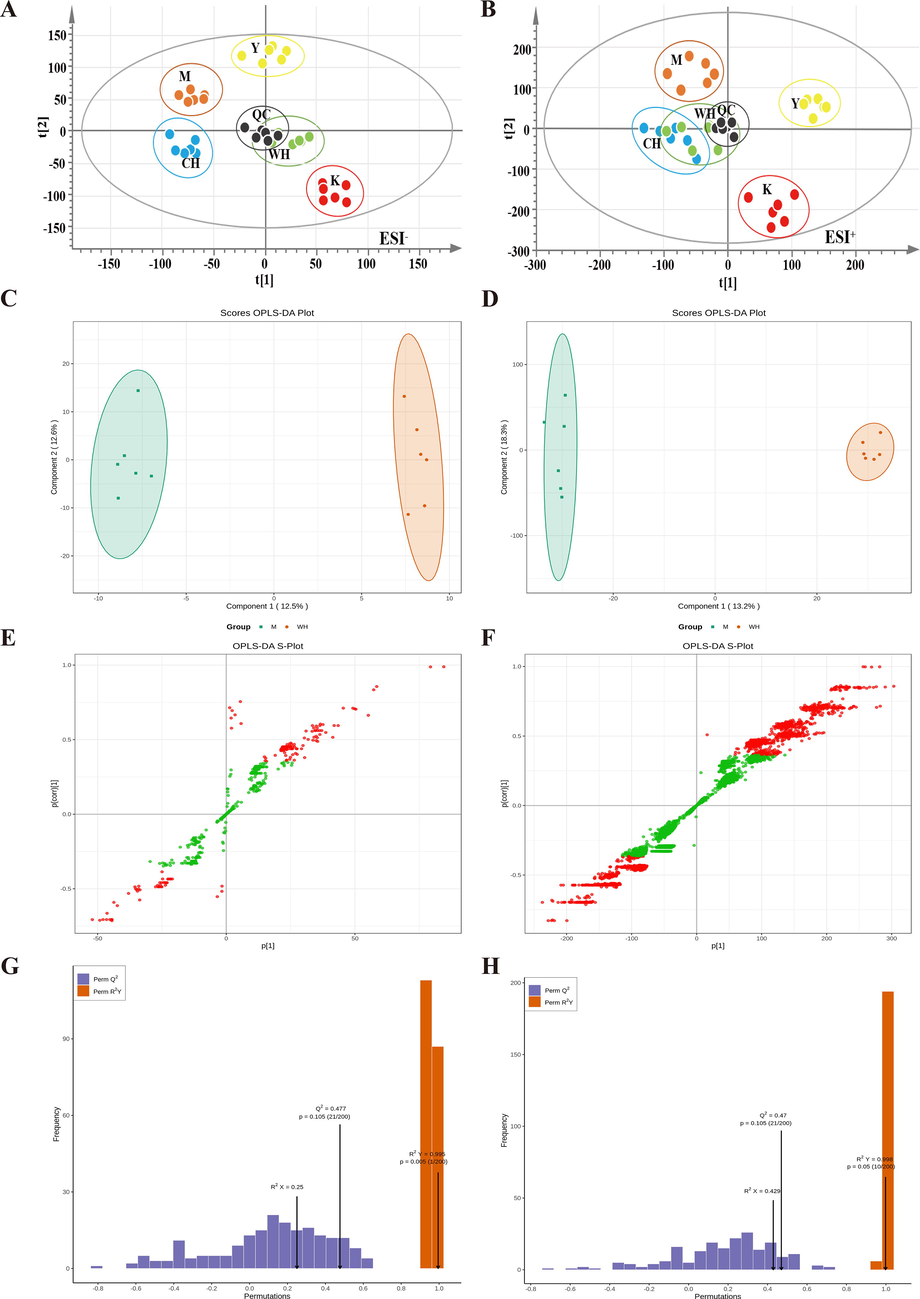
- Rat fecal biomarkers in negative ion mode (ESI−): PCA score diagram (A), OPLS-DA score plot comparison between M and WH (B), s-plot (C), permutation (D); positive ion mode (ESI+), PCA score diagram (E), OPLS-DA score plot comparison between M and WH (F), s-plot (G), permutation (H). Note: Quality control (QC) samples, blank (K), model (M), positive control (Y), high-dose WG (WH) and high-dose CG (CH).
S-plot plots were obtained to search for endogenous differential metabolites between the groups (Fig. 7E and F). Subsequently, the combination of VIP values and t-test (p < 0.05) was used to screen potential biomarkers in rat feces among the groups (Table 2). The model data were further subjected to multiple (number n = 200) randomized permutation experiments for model validation. The results indicated that the model had a good fit and predictive ability, and it was not overfitted (Fig. 7H and I). WG primarily affected bacterial metabolites, such as indole derivatives (IDs) and bile acid (BS). BS and IDs are the main metabolites in the gut, and they are affected by the gut microbiota and crucial to organism immune response (Paley 2019, Xu and Wang 2020). BS can mediate intestinal flora imbalance and abnormal BS metabolism and provoke enteritis. Abnormal BS metabolism disrupts the normal enterohepatic circulation of BSs and alters the activity of BS receptors in the intestine (Song et al., 2020, Li et al., 2023). The activation of FXR by BSs in the intestine induces FGF15 to inhibit BS synthesis in the liver, whereas inhibition of BSH by gut bacteria or antioxidant tempol increases T-β-MCA, which may antagonize FXR and FGF15 production to stimulate BS synthesis (Chiang et al., 2017). On the contrary, IDs combined with SCFAs regulate inflammation by reducing stress in epithelial cells and intestinal immunity. In IBD, AhR expression is downregulated together with tryptophan metabolites (Schanz et al., 2020). Therefore, the changes of metabolites in the feces of rats with SQD reflected the decreased immune function of these rats, indicating that their intestinal barrier function was impaired, and the flora showed dysbiosis. In addition, WG and CG can remarkably improve SQD and the immune function of the organism in rats, and the improvement effect of WG was more evident than that of ginseng. The follow-up study could screen signaling pathways and elucidate the immune action mechanism of WG.
| No. | HMDB | Component name | tR/min | VIP | Formula | Mearsured (m/z) | PubChem | Ion mode | Comparison between groups | Related metabolic pathways | ||||
|---|---|---|---|---|---|---|---|---|---|---|---|---|---|---|
| K:M | M:Y | M:WH | M:CH | CH:WH | ||||||||||
| 1 | HMDB0003405 | D-Lysine | 0.78 | 2.85242 | C6H14N2O2 | 147.1147 | 866 | [M + H]+ | ↑↑↑ | ↓↓ | ↓↓ | ↓↓ | ns | Lysine degradation |
| 2 | HMDB0029519 | Liquiritigenin | 0.81 | 1.15062 | C15H12O4 | 257.0822 | – | [M + H]+ | ↓↓ | ns | ns | ns | ns | Biosynthesis of other secondary metabolites |
| 3 | HMDB0000215 | N-Acetyl-D-glucosamine | 0.81 | 1.36859 | C8H15NO6 | 222.0965 | 439,174 | [M + H]+ | ↓↓↓ | ns | ns | ns | ns | Amino sugar and nucleotide sugar metabolism |
| 4 | HMDB0000212 | N-Acetylgalactosamine | 0.81 | 1.36859 | C8H15NO6 | 222.0956 | 84,265 | [M + H]+ | ↓↓↓ | ns | ns | ns | ns | Amoebiasis |
| 5 | HMDB0003646 | N-Methylhydantoin | 0.82 | 1.26965 | C4H6N2O2 | 115.0509 | 69,217 | [M + H]+ | ↑↑ | ↓↓ | ↓ | ↓ | ns | Arginine and proline metabolism |
| 6 | HMDB0029737 | Indole-3-aldehyde | 5.47 | 1.23741 | C9H7NO | 144.0455 | 10,256 | [M−H]− | ↓ | ↑ | ↑ | ↑ | ns | Tryptophan metabolism |
| 7 | HMDB0000197 | Indole-3-acetic acid | 5.83 | 1.37532 | C10H9NO2 | 174.0563 | 802 | [M−H]− | ↓↓ | ↑ | ↑ | ↑ | ns | Tryptophan metabolism |
| 8 | HMDB0001015 | N-Formyl-L-methionine | 6.17 | 1.0291 | C6H11NO3S | 178.0544 | 6,995,182 | [M + H]+ | ↓↓↓ | ns | ns | ns | ns | Cysteine and methionine metabolism |
| 9 | HMDB0002302 | Indole-3-propionic acid | 6.23 | 1.67618 | C11H11NO2 | 188.0722 | 3744 | [M−H]− | ↓↓↓ | ↑↑ | ↑↑↑ | ↑↑ | ↑ | Tryptophan metabolism |
| 10 | HMDB0000225 | Oxoadipic acid | 6.29 | 1.00012 | C6H8O5 | 161.044 | 71 | [M + H]+ | ↑ | ns | ↓ | ns | ns | Lysine biosynthesis |
| 11 | HMDB0000661 | Glutaric acid | 7.11 | 1.02257 | C5H8O4 | 133.0492 | 743 | [M + H]+ | ↑↑ | ns | ↓↓ | ns | ↓↓ | Fatty acid degradation、Lysine degradation |
| 12 | HMDB0006855 | (S)-2-Acetolactate | 7.11 | 1.02257 | C5H8O4 | 133.0490 | 440,878 | [M + H]+ | ↑↑ | ns | ↓↓ | ns | ↓↓ | Valine, leucine and isoleucine biosynthesis |
| 13 | HMDB0000671 | Indole-3-lactic acid | 7.12 | 1.78421 | C11H11NO3 | 204.0032 | 92,904 | [M−H]− | ↓↓ | ↑↑↑ | ↑ | ↑ | ns | Tryptophan metabolism |
| 14 | HMDB0000715 | Kynurenic acid | 8.07 | 1.21338 | C10H7NO3 | 190.0516 | 3845 | [M + H]+ | ↑↑↑ | ns | ↓↓ | ns | ns | Tryptophan metabolism |
| 15 | HMDB0001138 | N-Acetyl-L-glutamic acid | 8.07 | 1.21338 | C7H11NO5 | 190.0726 | 185 | [M + H]+ | ↑↑↑ | ns | ↓↓ | ns | ns | Arginine biosynthesis |
| 16 | HMDB0001278 | Presqualene diphosphate | 8.2 | 6.3364 | C30H52O7P2 | 587.3321 | 5,280,592 | [M + H]+ | ↑↑↑ | ns | ↓↓↓ | ↓↓↓ | ns | Steroid biosynthesis |
| 17 | HMDB0002343 | 5,6-DHET | 9.05 | 1.75333 | C20H34O4 | 339.2532 | 5,283,142 | [M + H]+ | ↑↑↑ | ↓↓↓ | ns | ns | ns | Tryptophan metabolism |
| 18 | HMDB0060666 | Endoxifen | 9.4 | 1.39784 | C25H27NO2 | 374.2127 | – | [M + H]+ | ↑↑ | ns | ↓↓↓ | ns | ↓↓↓ | Arachidonic acid metabolism |
| 19 | HMDB0000734 | Indole-3-acrylic acid | 9.45 | 1.48132 | C11H9NO2 | 188.0694 | – | [M + H]+ | ↓↓↓ | ↑↑ | ↑↑↑ | ↑ | ↑ | Tryptophan metabolism |
| 20 | HMDB0002226 | Adrenic acid | 10.66 | 2.05207 | C22H36O2 | 333.2765 | 5,497,181 | [M + H]+ | ↑↑↑ | ↓ | ns | ns | ns | Biosynthesis of unsaturated fatty acids |
| 21 | HMDB0000253 | Pregnenolone | 10.94 | 2.13719 | C21H32O2 | 317.2484 | 53,477,678 | [M + H]+ | ↑ | ns | ns | ns | ns | Steroid hormone biosynthesis |
| 22 | HMDB0001173 | 5′-Methylthioadenosine | 11.2 | 3.10063 | C11H15N5O3S | 298.0961 | 439,176 | [M + H]+ | ↑↑ | ns | ns | ns | ns | Steroid hormone biosynthesis |
| 23 | HMDB0000506 | alpha-Muricholic acid | 13.1 | 2.35358 | C24H40O5 | 409.2988 | 96,023,991 | [M + H]+ | ↑↑↑ | ↓↓ | ↓↓↓ | ↓↓↓ | ns | Secondary bile acid biosynthesis |
| 24 | HMDB0000917 | Ursocholic acid | 13.1 | 2.35358 | C24H40O5 | 409.2988 | 122,340 | [M + H]+ | ↑↑↑ | ↓↓↓ | ↓↓↓ | ↓↓ | ↓↓↓ | Secondary bile acid biosynthesis |
| 25 | HMDB0000505 | Allocholic acid | 13.1 | 2.35358 | C24H40O5 | 409.2988 | 53,477,699 | [M + H]+ | ↑↑↑ | ↓↓↓ | ↓↓↓ | ↓↓↓ | ns | Secondary bile acid biosynthesis |
| 26 | HMDB0000760 | Hyocholic acid | 13.1 | 2.35358 | C24H40O5 | 409.2988 | 131,750,324 | [M + H]+ | ↑↑↑ | ↓↓↓ | ↓↓↓ | ↓↓ | ↓↓↓ | Secondary bile acid biosynthesis |
| No. | HMDB | Component name | tR/min | VIP | Formula | Mearsured (m/z) | PubChem | Ion mode | Comparison between groups | Related metabolic pathways | ||||
| K:M | M:Y | M:WH | M:CH | CH:WH | ||||||||||
| 27 | HMDB0003419 | Formyl-CoA | 13.5 | 1.61809 | C22H36N7O17P3S | 796.1134 | 439,313 | [M + H]+ | ↑↑↑ | ↓↓ | ↓↓↓ | ↓ | ↓ | Glyoxylate and dicarboxylate metabolism |
| 28 | HMDB0035282 | Solasodine | 13.75 | 1.46625 | C27H43NO2 | 413.3264 | 5250 | [M + HCOO]− | ↓↓ | ns | ns | ns | ns | Biosynthesis of alkaloids derived from terpenoid and polyketide |
| 29 | HMDB0012819 | 5-Hydroxykynurenine | 13.81 | 1.31674 | C10H12N2O4 | 225.0866 | 440,745 | [M + H]+ | ↑↑ | ns | ns | ns | ns | Tryptophan metabolism |
| 30 | HMDB0000128 | Guanidoacetic acid | 15.6 | 1.1717 | C3H7N3O2 | 118.0621 | 763 | [M + H]+ | ↑↑↑ | ↓ | ↓↓↓ | ↓↓ | ns | Glycine, serine and threonine metabolism |
| 31 | HMDB0002200 | Leukotriene E4 | 15.71 | 1.98361 | C23H37NO5S | 440.2457 | 5,280,879 | [M + H]+ | ↑↑ | ↓↓ | ↓↓ | ↓↓ | ns | Arachidonic acid metabolism |
| 32 | HMDB0000619 | Cholic acid | 15.74 | 1.14755 | C24H40O5 | 409.2988 | 221,493 | [M + H]+ | ↑↑↑ | ↓ | ↓↓↓ | ↓↓↓ | ↓↓↓ | Secondary bile acid biosynthesis |
| 33 | HMDB0001248 | FAD | 16.39 | 1.4516 | C27H33N9O15P2 | 786.1684 | 643,975 | [M + H]+ | ↑ | ↓ | ns | ns | ns | Metabolism of cofactors and vitamins |
| 34 | HMDB0000518 | Chenodeoxycholic acid | 20.15 | 1.49101 | C24H40O4 | 393.3029 | 10,133 | [M + H]+ | ↑↑↑ | ↓↓ | ↓↓↓ | ↓↓↓ | ns | Primary bile acid biosynthesis |
| 35 | HMDB0000946 | Ursodeoxycholic acid | 20.15 | 1.49101 | C24H40O4 | 393.3009 | 31,401 | [M + H]+ | ↑↑↑ | ↓ | ↓↓↓ | ↓↓↓ | ns | Secondary bile acid biosynthesis |
| 36 | HMDB0000686 | Isoursodeoxycholic acid | 20.15 | 1.49101 | C24H40O4 | 393.3009 | 127,601 | [M + H]+ | ↑↑↑ | ↓↓ | ↓↓↓ | ↓ | ns | Secondary bile acid biosynthesis |
| 37 | HMDB0000514 | Allochenodeoxycholic acid | 20.15 | 1.49101 | C24H40O4 | 393.3009 | 96,024,007 | [M + H]+ | ↑↑↑ | ↓↓ | ↓↓↓ | ↓ | ns | Secondary bile acid biosynthesis |
| 38 | HMDB0000626 | Deoxycholic acid | 20.15 | 1.49101 | C24H40O4 | 393.3009 | 222,528 | [M + H]+ | ↑↑↑ | ↓↓ | ↓↓↓ | ↓ | ns | Secondary bile acid biosynthesis |
| 39 | HMDB0000774 | Pregnenolone sulfate | 23.6 | 1.08977 | C21H32O5S | 397.2071 | 20,845,972 | [M + H]+ | ↑ | ↓ | ↓ | ↓ | ns | Steroid hormone biosynthesis |
| 40 | HMDB0003229 | Palmitoleic acid | 24.07 | 1.36171 | C16H30O2 | 255.2324 | 5,312,427 | [M + H]+ | ↑↑↑ | ↓ | ↓ | ↓↓ | ns | Fatty acid biosynthesis |
| 41 | HMDB0004682 | 11(R)-HETE | 24.93 | 1.52543 | C20H32O3 | 365.2339 | 5,312,981 | [M + HCOO]− | ↑↑↑ | ns | ns | ns | ns | Arachidonic acid metabolism |
| 42 | HMDB0004680 | 16(R)-HETE | 24.93 | 1.52543 | C20H32O3 | 365.2339 | 9,548,884 | [M + HCOO]− | ↑↑↑ | ns | ns | ns | ns | Arachidonic acid metabolism |
| 43 | HMDB0011136 | 19(S)-HETE | 24.93 | 1.52543 | C20H32O3 | 365.2339 | 9,548,883 | [M + HCOO]− | ↑↑↑ | ns | ns | ns | ns | Arachidonic acid metabolism |
| 44 | HMDB0003128 | Cortolone | 24.93 | 1.52543 | C21H34O5 | 365.2339 | 160,499 | [M−H]− | ↑↑↑ | ns | ns | ns | ns | Steroid hormone biosynthesis |
Note: Blank group (K), model (M), positive control (Y), high-dose WG (WH), high-dose CG (CH). Trend: ns, no significant difference (p > 0.05); “↓” “↑” (p < 0.05); “↓↓” “↑↑” (p < 0.01); “↓↓↓” “↑↑↑” (p < 0.001).
3.10 Alpha and beta diversity analyses
Groups of rat gut microbiota were studied by sequencing the whole-length region of the 16S rRNA gene. As the number of sequences sampled increased, the sample dilution and Shannon curves flattened out for each group, indicating that the number of sequencing per sample was sufficient and covered information for most microbial species (Fig. 8A and B). Considering the β-diversity in principal coordinate analysis (PCoA) based on the distance matrix (Bray–Curtis algorithm, Fig. 8C), the gut microbial fraction profiles were clearly separated among the groups of rats, with M clearly deviating from K and Y, and WH and CH being closer to K. These findings indicated that the gut microorganisms of the M group were clearly distinguished from those of the K group. In addition, the drug administration evidently showed the intestinal microbial changes by SQD, whereas drug intervention can positively improve the intestinal microbial composition, showing higher similarity to the K group at the phylum level (Fig. 8D).
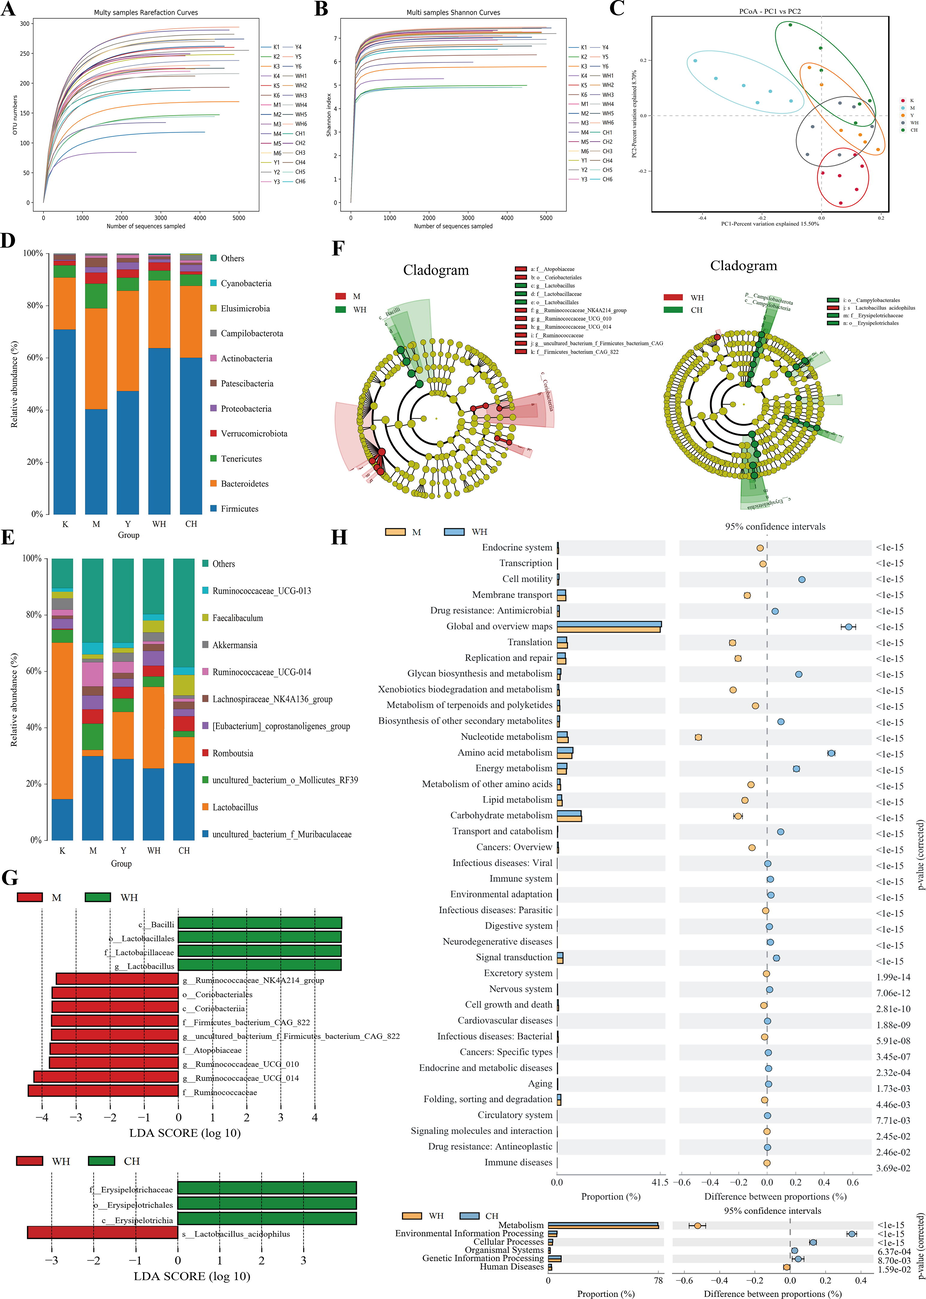
- Groups of rat intestinal microorganisms: (A) dilution curve, (B) Shannon curve, (C) principal coordinate analysis, (D) species distribution at the phylum level, (E) species distribution at the genus level, (F) histogram of LDA value distribution, (G) evolutionary branching of LEfSe analysis and (H) KEGG functional gene prediction.
The statistical analysis of the differences in intestinal flora species among groups on the genus level (Fig. 8E) showed that compared with the K group, the M group exhibited a significant increase in Uncultured_bacterium_f_Muribaculaceae (p < 0.01), uncultured_bacterium_o_Mollicutes_RF39 (p < 0.01), Romboutsia (p < 0.01), [Eubacterium]_coprostanoligenes_group, Lachnospiraceae_NK4A136_group (p < 0.05), Ruminococcaceae_UCG-014 (p < 0.01), and Ruminococcaceae_UCG-013 (p < 0.01) genera and a significant decrease in Lactobacillus (p < 0.01), Akkermansia (p < 0.05), and Faecalibaculum. Compared with the M group, the dosing group can regulate related genera. All three dosing groups can increase the relative abundance of Lactobacillus, Akkermansia, and Faecalibaculum genera and decrease that of other genera, with WH having a stronger ability to regulate Lactobacillus and Akkermansia. Genus changes indicated that the intestinal microenvironment of mild rats improved significantly after drug intervention. Beneficial bacteria increased significantly, and the structure and diversity of the intestinal flora changed significantly. In addition, intestinal microorganisms can be involved in the immune process of the organism. The results of this study suggested that WG can indirectly improve the immune function of the organism by improving the intestinal microenvironment.
3.11 Analysis of significant differences among groups
LEfSe was used to describe the composition of the microbiota and identify specific bacterial taxa from phylum to genus in the WH, M, and CH groups. A total of 13 species differed in the M and WH groups (Fig. 8F and G), and in the WH group, c_Bacilli (Firmicutes), o_Lactobacillales (Firmicutes), f_Lactobacillaceae (Firmicutes), and g_Lactobacillus (Firmicutes) were significantly different (p < 0.05). Four species differed in the WH and CH groups (Fig. 8F and G), and the relative abundance of s_Lactobacillus_acidophilus (Firmicutes) in the WH group was significantly different (p < 0.05). Based on the comparative results, the good immune effect of WG may be due to the significant difference in the higher levels of Lactobacillus in WG. This result is consistent with the abovementioned results at the genus level.
3.12 Prediction of KEGG functional genes
By analyzing the differences in KEGG metabolic pathways, observing the differences and discrepancies in functional gene metabolic pathways in microbial communities between different sample groups is possible. The results are shown in Fig. 8H. Comparison of the metabolic pathways between the M and WH groups showed differences in 40 metabolic categories, whereas WG adjusted the microenvironment in the intestinal tract of rats with SQD Certificate, primarily through amino acid metabolism and lipid metabolism. In addition, differences in six metabolic categories of the intestinal flora were observed between the WH and CH groups, and WG played a role in metabolism.
In this study, rats with SQD can significantly upregulate the Firmicutes gate after the drug intervention, in which the upregulation of WG was more pronounced. Huang et aL. confirmed that the relative abundance of fecal Actinomycetes increased, and the structure of intestinal flora significantly changed in mice with SQD (Huang et al., 2020) (). Long-term administration of CG extracts to rats significantly decreased the abundance of Proteobacteria, Bacteroidetes, and Actinomycetes. In addition, WG modulated the gut microbiota of rats with SQD-induced immunodeficiency and reversed two main probiotics, namely, Lactobacillus and Akkermansia. Lactobacillus has BSH activity (Kilburn et al., 2020). Suppression of BSH-containing microorganisms in SQD may be associated with an increase in fecal BS concentration. Based on previous reports, Akkermansia maintains the integrity of the intestinal mucosa and contributes to the immunity of the body (Bian et al., 2020). Therefore, the altered structure and diversity of the intestinal flora can affect the immune process of the body. The results of the present study showed that WG may directly improve the immune function of the organism by improving the intestinal microenvironment. Furthermore, the correlation between key gut microbiota and basic immune indices was demonstrated through Spearman’s correlation analysis.
3.13 Correlation analysis
When abnormalities occur in the intestinal flora of spleen-qi-deficient rats, the metabolic disorder of the organism, particularly the metabolites of the flora, and the endogenous toxins in the intestine could gradually accumulate. The accumulation of toxic substances could cause damage to the function of the intestinal barrier and the invasion of toxins into the blood of patients, which could then result in systemic immune responses. A correlation heatmap and a correlation network diagram were developed on the basis of Spearman’s correlation to explore the functional relationship among alterations in the gut microbiota, disturbances in fecal metabolites, changes in immune indicators, and intestinal permeability (Fig. 9A and B). A clear correlation can be observed among such factors. In particular, the strong correlation found among fecal metabolites was associated with the intestinal microbiota and reversal of probiotics by WG, in which tryptophan and BS metabolism were involved. Lactobacillus and Akkermansia showed strong positive correlations with indole-3-propionic acid and indole-3-lactic acid and strong negative correlations with chenodeoxycholic acid, cholic acid, and deoxycholic acid. In addition, immune indicators, such as IL-6 and IL-2, showed a positive correlation with Lactobacillus and Akkermansia levels. Meanwhile, D-Lac and LPS showed a negative correlation with Lactobacillus and Akkermansia. Bacteroides fragilis, Lactobacillus, and Bifidobacterium have been shown to modulate BS metabolism and strengthen the intestinal barrier (Heeney et al., 2019). Furthermore, Akkermansia treatment improved the circulation of BS metabolism in the gut–liver axis (Grajeda-Iglesias et al., 2021). The abovementioned results are consistent with the results of the present study. Therefore, WG reversed the structure and abundance of gut microorganisms and metabolites altered by SQD, affecting intestinal permeability and further enhancing the immune response of the organism.
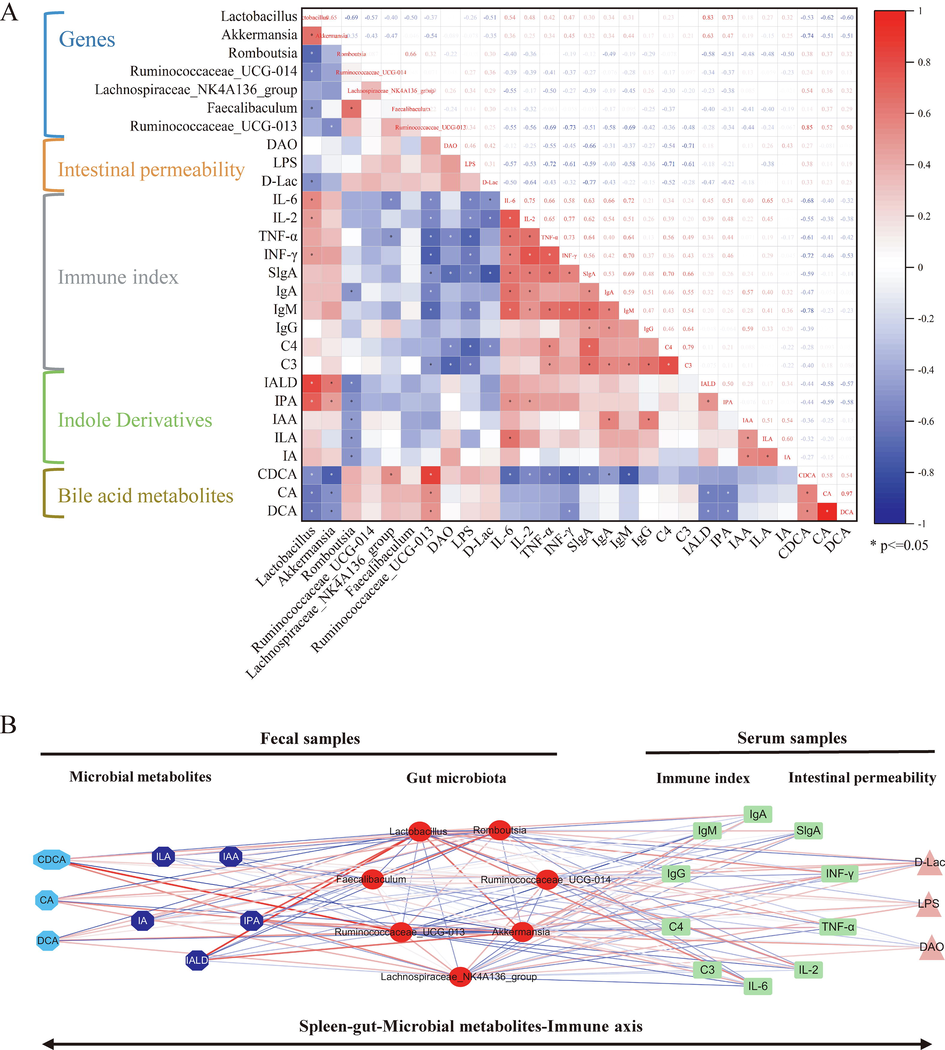
- Correlation between probiotics reversed by WG and immune indicators, intestinal permeability and microbial metabolites: A, hot map; B, network diagram. Note: Indole-3-aldehyde (IA), indole-3-acetic acid (IAA), indole-3-propionic acid (IPA), indole-3-lactic acid (ILA), indole-3-acrylic acid (IALA), cholic acid (CA), chenodeoxycholic acid (CDCA), and deoxycholic acid (DCA).
4 Conclusion
This study combined fecal metabolomics and 16S rDNA sequencing technology to explore the mechanism of WG in improving SQD rats and determine the correlation of related metabolites and intestinal flora. The results found that Lactobacillus and Akkermansia may be the key flora for WG to intervene in spleen qi deficiency. Further analysis showed that Lactobacillus and Akkermansia may improve the metabolites of the flora. Indole-3-propionic acid and indole-3-lactic acid were significantly upregulated, whereas chenodeoxycholic acid, cholic acid and deoxycholic acid were significantly downregulated. These findings highlighted the mechanisms of immune action of the gut microbiota and metabolites on the spleen-supplementing activities of WG. However, the immune effects of WG reversing probiotics, such as Lactobacillus and Akkermansia, must be further validated by fecal transplantation. The result of this study could lay the foundation for further development of the mechanism of immune action of WG and the use of intestinal microorganisms to regulate the immune targets of the body.
Acknowledgments
This research was supported by Jilin Provincial Science and Technology Department of China [grant numbers 20210204046YY, 20220508081RC] and the Graduate student excellence demonstration course construction program [grant numbers 2022JP06].
Author Contributions
Author contributions were as follows. Fangtong Li, Meiyu Zhang and Yongxi Wu worked together to construct a rat model of SQD. Yizhu Wang and Yongyu Cai performed 16S rRNA gene sequencing and metabolomics studies. Fangtong Li, Jing Luo and Meiyu Zhang processed data curation. Zifeng Pi and Yulin Dai collected data and analyzed results. Fei Zheng and Fangtong Li wrote the first draft of the manuscript. Hao Yue and Fei Zheng conceptualized and provided funding, resources and writing-review & editing. All authors commented on the manuscript and approved the final version. Fangtong Li is the first author. Other authors contributed equally to this work and share first authorship.
Declaration of Competing Interest
The authors declare that they have no known competing financial interests or personal relationships that could have appeared to influence the work reported in this paper.
References
- Investigation of exchange coupling and microwave properties of hard/soft (SrNi0.02Zr0.01Fe11.96O19)/(CoFe2O4)x nanocomposites. Mater. Today Nano. 2022;18:100186.
- [CrossRef] [Google Scholar]
- Tuning the structure, magnetic, and high frequency properties of Sc-doped Sr0.5Ba0.5ScxFe12-xO19/NiFe2O4 hard/soft nanocomposites. Adv. Electron. Mater.. 2022;8:2101124.
- [CrossRef] [Google Scholar]
- Comparative effects of alive and pasteurized Akkermansia muciniphila on normal diet-fed mice. Sci Rep. 2021;11:17898.
- [CrossRef] [Google Scholar]
- Therapeutic and immune function improvement of vitamin D combined with IFN-alpha on mouse with hepatitis B infection. Int J Immunopathol Pharmacol. 2018;32:2058738418775250
- [CrossRef] [Google Scholar]
- Pediococcus pentosaceus LI05 alleviates DSS-induced colitis by modulating immunological profiles, the gut microbiota and short-chain fatty acid levels in a mouse model. J. Microbial. Biotechnol.. 2020;13:1228-1244.
- [Google Scholar]
- Intestinal farnesoid X receptor and Takeda G protein couple receptor 5 signaling in metabolic regulation. Dig. Dis.. 2017;35:241-245.
- [Google Scholar]
- Quercetin inhibits LPS-induced macrophage migration by suppressing the iNOS/FAK/paxillin pathway and modulating the cytoskeleton. Cell Adh. Migr.. 2019;13:1-12.
- [Google Scholar]
- Octreotide prevents liver failure through upregulating 5 ’-methylthioadenosine in extended hepatectomized rats. Liver Int. 2016;36:212-222.
- [CrossRef] [Google Scholar]
- Fe3O4 nanoparticles for complex targeted delivery and boron neutron capture therapy. Nanomaterials (Basel). 2019;9:494.
- [Google Scholar]
- Impact of the gut microbiota on intestinal immunity mediated by tryptophan metabolism. Front. Cell. Infect. Microbiol.. 2018;8:13.
- [Google Scholar]
- Oral administration of Akkermansia muciniphila elevates systemic antiaging and anticancer metabolites. Aging (Albany NY). 2021;13:6375-6405.
- [Google Scholar]
- Lactobacillus plantarum bacteriocin is associated with intestinal and systemic improvements in diet-induced obese mice and maintains epithelial barrier integrity in vitro. Gut Microbes.. 2019;10:382-397.
- [Google Scholar]
- A metabonomics and lipidomics based network pharmacology study of qi-tonifying effects of honey-processed Astragalus on spleen qi deficiency rats. J. Chromatogr. B Anal. Technol. Biomed. Life Sci.. 2020;1146:122102.
- [Google Scholar]
- High-fat diets led to OTU-level shifts in fecal samples of healthy adult dogs. Front. Microbiol.. 2020;11, 564160. https://doi.org/10.3389/fmicb.2020.564160
- [Google Scholar]
- Gut microbiota-derived metabolites as key actors in inflammatory bowel disease. Nat. Rev. Gastro. Hepat.. 2020;17:223-237.
- [Google Scholar]
- Molecular differentiation of Russian wild ginseng using mitochondrial nad7 intron 3 region. J. Ginseng Res.. 2017;41:326-329.
- [Google Scholar]
- Effective purification of ginsenosides from cultured wild ginseng roots, red ginseng, and white ginseng with macroporous resins. J. Microbiol. Biotechnol.. 2008;18:1789-1791.
- [Google Scholar]
- Urine and serum metabolomics study of wild ginseng in rats with spleen-qi deficiency using rapid resolution liquid chromatography coupled with quadrupole-time-of-flight mass spectrometry. J. Sep. Sci.. 2023;46:e2300344
- [CrossRef] [Google Scholar]
- Characterization of the components and pharmacological effects of mountain-cultivated Ginseng and garden Ginseng based on the integrative pharmacology strategy. Front. Pharmacol.. 2021;12:659954.
- [Google Scholar]
- In vitro effects of Ginseng and the seed of Zizyphus jujuba var. spinosa on gut microbiota of rats with spleen deficiency. Chem. Biodivers.. 2020;17:e2000199
- [Google Scholar]
- Efficacy of Sijunzi decoction (四君子汤) on limb weakness in spleen Qi deficiency model rats through adenosine monophosphate-activated protein kinase/unc-51 like autophagy activating kinase 1 signaling. J. Tradit. Chin. Med.. 2021;41:617-623.
- [CrossRef] [Google Scholar]
- Efficacy of Sijunzi decoction on limb weakness in spleen Qi deficiency model rats through adenosine monophosphate-activated protein kinase/unc-51 like autophagy activating kinase 1 signaling. J. Tradit. Chin. Med.. 2021;41:617-623.
- [Google Scholar]
- A reverse metabolic approach to weaning: in silico identification of immune-beneficial infant gut bacteria, mining their metabolism for prebiotic feeds and sourcing these feeds in the natural product space. Microbiome. 2018;6
- [Google Scholar]
- Liu, F., Liu, Y., Tian, C. M., 2015. [Effect of Rhizoma Atractylodis extract in protecting gastric mucosa and modulating gastrointestinal immune function in a rat model of spleen deficiency]. Nan fang yi ke da xue xue bao = Journal of Southern Medical University. 35, 343-7, 354.
- Diet-Related Metabolic Perturbations of Gut Microbial Shikimate Pathway-Tryptamine-tRNA Aminoacylation-Protein Synthesis in Human Health and Disease. Int J Tryptophan Res. 2019;12:1178646919834550
- [Google Scholar]
- Schanz, O., Chijiiwa, R., Cengiz, S.C., et al., 2020. Dietary AhR ligands regulate AhRR expression in intestinal immune cells and intestinal microbiota composition. Int. J. Mol. Sci. 21,3189. https://doi.org/10.3390/ijms21093189.
- Chronic stress and corticosterone exacerbate alcohol-induced tissue injury in the gut-liver-brain axis. Sci. Rep.. 2021;11:826.
- [Google Scholar]
- Microbial bile acid metabolites modulate gut RORgamma(+) regulatory T cell homeostasis. Nature. 2020;577:410-415.
- [Google Scholar]
- Proteomic analysis of amino acid metabolism differences between wild and cultivated Panax ginseng. J. Ginseng Res.. 2016;40:113-120.
- [Google Scholar]
- Enhanced effects of combined bu-zhong-yi-qi-tang (TJ-41) and interleukin-18 on the production of tumour necrosis factor-alpha and interferon-gamma in human peripheral blood mononuclear cells. J. Int. Med. Res.. 2004;32:25-32.
- [Google Scholar]
- Enteral nutrition modulation with n-3 PUFAs directs microbiome and lipid metabolism in mice. PLoS One. 2021;16:e0248482
- [Google Scholar]
- Immobilization of boron-rich compound on Fe3O4 nanoparticles: Stability and cytotoxicity. J. Alloy. Compd.. 2019;797:573-581.
- [Google Scholar]
- High-frequency absorption properties of gallium weakly doped barium hexaferrites. Phil. Mag.. 2019;99:585-605.
- [Google Scholar]
- Changes in the structure, magnetization, and resistivity of BaFe12–xTixO19. ACS Appl. Electron. Mater.. 2021;3:1583-1593.
- [Google Scholar]
- Network Pharmacology to Uncover the Biological Basis of Spleen Qi Deficiency Syndrome and Herbal Treatment. Oxid Med Cell Longev. 2020;2020:2974268
- [Google Scholar]
- Application of RRLC-QTOF-MS-based metabonomics and UPE for investigating Spleen-Qi deficiency syndrome with Panax ginseng treatment. J. Ethnopharmacol.. 2020;256:112822.
- [Google Scholar]
- N-Acetylcysteine improves intestinal function and attenuates intestinal autophagy in piglets challenged with beta-conglycinin. Sci. 2021;11:1261.
- [Google Scholar]
- Enhancing the antitumor activity of an engineered TRAIL-coated oncolytic adenovirus for treating acute myeloid leukemia. Signal Transduct. Target. Ther.. 2020;5:40.
- [Google Scholar]
- 177 saponins, including 11 new compounds in wild Ginseng tentatively identified via HPLC-IT-TOF-MS(n), and differences among wild Ginseng, Ginseng under forest, and cultivated Ginseng. Molecules. 2021;26:3371.
- [Google Scholar]
- High-performance liquid chromatography with diode array detector and electrospray ionization ion trap time-of-flight tandem mass spectrometry to evaluate ginseng roots and rhizomes from different regions. Molecules. 2016;21:603.
- [Google Scholar]
- Untargeted metabonomics study of ginseng in treatment of spleen-Qi deficiency. Zhongguo Zhong Yao Za Zhi. 2020;45:398-404.
- [Google Scholar]
- Bovine Lactoferrin protects dextran sulfate sodium salt mice against inflammation and impairment of colonic epithelial barrier by regulating gut microbial structure and metabolites. Front. Nutr.. 2021;8:660598.
- [Google Scholar]
- Decreased absolute numbers of CD3(+) T cells and CD8(+) T cells during aging in herpes zoster patients. Sci. Rep.. 2017;7:15039.
- [Google Scholar]
- GC-MS and metabolomics analysis of amino acids, glucose and urinary metabolic pathways and characteristics in children with spleen-deficiency diarrhea. Cell. Mol. Biol.. 2020;66:125-130.
- [Google Scholar]
- Inhibition of P-glycoprotein leads to improved oral bioavailability of compound K, an anticancer metabolite of red Ginseng extract produced by gut microflora. Drug Metab. Dispos.. 2012;40:1538-1544.
- [Google Scholar]
- Identification of ginseng root using quantitative X-ray microtomography. J. Ginseng Res.. 2017;41:290-297.
- [Google Scholar]
- Elucidation of the reinforcing spleen effect of jujube fruits based on metabolomics and intestinal flora analysis. Front Cell Infect Mi.. 2022;12,
- [Google Scholar]
- Comparative study on the gastrointestinal- and immune- regulation functions of Hedysari Radix Paeparata Cum Melle and Astragali Radix Praeparata cum Melle in rats with spleen-qi deficiency, based on fuzzy matter-element analysis. Pharm. Biol.. 2022;60:1237-1254.
- [Google Scholar]
- In vitro transformation of protopanaxadiol saponins in human intestinal flora and its effect on intestinal flora. Evid. Based Complement. Alternat. Med.. 2021;2021:1735803.
- [Google Scholar]
- Biotransformation of Ginsenosides (Rb1, Rb2, Rb3, Rc) in human intestinal bacteria and its effect on intestinal flora. Chem. Biodivers.. 2021;18:e2100296
- [Google Scholar]
- Efficacy and safety of Hou Gu Mi Xi in patients with spleen qi deficiency syndrome who underwent radical gastrectomy for gastric cancer: protocol for a multicenter, randomized, double-blind, placebo-controlled trial. Trials. 2019;20:343.
- [CrossRef] [Google Scholar]


