

Translate this page into:
Transferring the wide band gap chitosan: POZ-based polymer blends to small optical energy band gap polymer composites through the inclusion of green synthesized Zn2+-PPL metal complex
⁎Corresponding author at: Hameed Majid Advanced Polymeric Materials Research Lab., Physics Department, College of Science, University of Sulaimani, Qlyasan Street, Sulaimani 46001, Kurdistan Regional Government, Iraq. shujahadeenaziz@gmail.com (Shujahadeen B. Aziz)
-
Received: ,
Accepted: ,
This article was originally published by Elsevier and was migrated to Scientific Scholar after the change of Publisher.
Peer review under responsibility of King Saud University.
Abstract
In this study, the solution of black tea leaves (BTL) was extracted and used as a green coordination approach to synthesize Zinc metal ions (Zn2+)- polyphenol (PPL) complexes (Zn2+-PPL complexes) with increased UV–vis absorption. The FTIR of the BTL and Zn2+-PPL complex confirms the formation of the Zn2+-PPL complex through the wide variation in the intensity of FTIR bands. XRD shows that the interaction between Zn2+ ions and PPL produced an amorphous Zn2+-PPL complex. The prepared Zn2+-PPL complex with chitosan: Poly(2-ethyl-2-oxazoline) (CS: POZ) polymer blends exhibit enhanced optical properties. The polymer composite (PC) films are synthesized using the solution casting process. FTIR, XRD, and UV–vis spectroscopy techniques approve the synthesis of PCs films with handled optical properties. The structural properties of CS: POZ: Zn2+-PPL complex composite films confirm the amorphous phase dominant. The optical properties of CS: POZ blend and CS: POZ: Zn2+-PPL complex films are determined using UV–Visible spectroscopy, including refractive index (n), absorption edge, dielectric loss ( ), dielectric constant ( ), and bandgap energy ( ). The is measured by examining the optical parameter, whereas the types of electronic transition in the films are detected using Tauc's technique. Significant optical parameters such as localized charge density (N/m*), high-frequency dielectric constant , relaxation time ( ), optical mobility ( ), optical resistivity ( ), and plasma angular frequency ( ) of electrons are measured. The N/m* values are increased from 7.3 × /kg to 35.3 × /kg by adding Zn2+-complex concentration, resulting in a significant reduction (4.8 eV to 1.6 eV) in the . The Wemple–DiDomenico single oscillator model was used to measure the oscillator dispersion energy ( ) and average oscillator energy ( ) property.
Keywords
Polymer blend
Polymer composite
Optical properties
Metal complex
Coordination chemistry
Localize charge density

1 Introduction
The Sun provides a long-term supply, sustainable, and reliable energy, in contradiction to traditional resources, such as fossil fuels and coals can hence assist in solving the increasing global necessity for energy. One of the effective methods of solar energy converting to a valuable form like electricity makes use of solar cell devices (Heo, 2013). Composites are materials made up of two or more chemically and physically distinct phases parted by a discrete interface (Aziz et al., 2015). Due to their unique optical, electrical, and mechanical capabilities, polymer composite (PCs) materials have recently attracted much scientific and technological interest (Ebnalwaled and Thabet, 2016). Polarizers, sensors, optical networking, LEDs, data storage systems, solar panels, and even biological applications have benefitted from these materials with improved optical characteristics (Nofal et al., 2021). Considerable work has been done by improving the optical characteristics of PCs by reinforcing polymers with metals, semiconductors, carbon nanotubes, magnetic nanoparticles, and metal complexes (Soliman and Vshivkov, 2019; Wang et al., 2007; So et al., 2007; Hoque et al., 2018; Aziz et al., 2021).
There are applications for which inorganic materials are not preferably appropriate; those requiring, for example, mechanical flexibility, colour tunability, low-cost processing or large active areas. Organic materials are a good candidate for the application as they mix the material property of plastics with large and ultrafast nonlinear responses, high optical cross-sections, and broad spectral tunability. In terms of construction, they are solutions processed at a low-priced, permitting large area deposition (contact printing or roll-to-roll, for instance) on a nonstandard substrate (Clark and Lanzani, 2010). Natural polymers in general and natural PCs in specific appear to be gaining popularity because they are biodegradable, renewable, inexpensive, and easy to treat without the use of toxic materials (Usman et al., 2012). Due to their wide range of applications in pharmaceutical and biomedical industries for enzyme immobilization and purification, in chemical plants for wastewater treatment, and in food manufacturing for binding, gelling, thickening, and stabilizing agents in food products, chitinous polymers, particularly chitosan (CS), have piqued attention recently as one of the most effective natural polymeric materials (D. K.-F. T. (USA), 1984).
CS is a cationic polysaccharide made from the alkaline N-acetylation of chitin, the main component of crustacean shells, including crab, shrimp, and crawfish. Chitin is the second most prevalent natural biopolymer in nature after cellulose (No and Meyers, May 2002). Its biodegradability, biocompatibility, and nontoxicity are only a few of its several desirable characteristics (Varma et al., 2004). The CS backbone structure contains the functional groups of hydroxyl (–OH) and amine (–NH2), which are in charge in the presence of inorganic salts (Aziz, 2019). Simple blending with other non-ionic water-soluble polymers could also help modify the properties of chitosan (Abilova et al., 2020). Polymer blending combines at least two polymers to form a new material with distinct physical properties (Markovic and Visakh, 2017). In this work, POZ (Poly(2-ethyl-2-oxazoline)) attempted to make a CS: POZ polymer blend, which is a non-ionic water-soluble polymer with good temperature stability and belongs to the poly(2-oxazolines) family. It is also an amorphous polymer that is biocompatible and commercially available (D. K.-F. T. (USA), 1984). A metal complex is added to the polymer blend to improve its optical characteristics further. It has been established that adding metal complexes to poly (vinyl alcohol) (PVA) reduces the optical bandgap. Brza et al. inserted cerium metal-complexes (Ce3+-complex) into PVA and found a significant reduction in the optical band gap (Brza, 2020). In another investigation, the authors in ref. (Brza, 2021) reduced the optical band gap by loading cadmium-complexes (Cd2+-complex) to PVA (Brza, 2021). Aziz et al. also loaded Al3+-complex into PVA, which resulted in a significant decrease in the optical band gap (Aziz et al., 2021). On the other hand, Metal complexes help enhance the performance of electrochemical devices. In research by Asnawi et al., insertion of the Zn(II)-complex into the chitosan PE increased the electrochemical double-layer capacitor (EDLC) device efficiency (Asnawi, 2020).
Organic semiconductor materials and their applications in photonic and electronic devices have been vital in materials science in recent decades. These materials appear promising in terms of functionalization, electrical properties, simplicity of processing, and thin-film flexibility. The low-energy bandgap (Eg) molecules/polymers that absorb in the near-infrared region and typically have an Eg of < 1.6 eV are particularly attractive for photodetectors (PDs) ambipolar field-effect transistors and organic photovoltaics. More attempts were made to synthesise new polymeric materials for the applications, and significant improvement was achieved (Dou et al., 2015).
To achieve higher performance and desired property, new material design concepts and a deeper fundamental understanding of the chemistry and physics of the materials are essential. The optical property of polymeric materials can be appropriately justified by loading dopants relying on their reactivity with the polymers (Varishetty et al., May 2010). For inorganic-based PCs, improving the spectral response range is an exciting subject, and the cost of fabrication is another problem that restricts the applications (Dou et al., 2015). The optical absorbance study and the absorption edge are valuable methods for optically induced transition investigation and information about the energy gap and band structure in amorphous and crystalline materials. The absorption coefficient measurement closes the fundamental absorption edge, offers a standard technique for optically induced electronic transition investigation, and delivers concepts about the energy gap and band structure in non-crystalline and crystalline substances (Sonmez et al., 2003).
Using the bio-based technique for the utilization, recovery, and capture of elements (adsorption and chelation) will become an essential topic for green chemistry in the years to come (Paquin et al., 2015). The green approach was used to synthesize zinc metal complex (Zn complex) utilizing black tea extract solution in this work. This process can be considered a new green technique to make PCs with tunable optical Eg and moderately transparent behaviour. Transparent polymers have been widely used as packaging materials and optical coatings for optoelectronic instruments because of their great optical transparency, low cost, and processability. Recently, high refractive index and transparent materials have drawn more attention because of their extensive application (Tao).
According to the FTIR analysis, polyphenol (PPL), hydroxyl, and carboxylic acid groups are abundant in the extract tea solution (Aziz et al., 2017). BTLs are famous for their antioxidant attributes, and they enrich PPL primarily associated with the aromatic ring and hydroxyl group (Ponmurugan and Kavitha, 2019). PPL chelates and coordinates with cations and synthesis complexes because of the presence of the carbonyl group and hydroxyl group. In addition to their remarkable properties, metal complexes of flavonoids may also reduce cation toxicity because they are coloured, pro-oxidant or antioxidant, antimicrobial, and often fluorescent (Ponmurugan and Kavitha, 2019). As stated by Drynan et al., an aqueous mixture of BTLs contains a high concentration of PPL (Drynan et al., 2010). Polymerized phenolic structures, PPL, and PPL conjugates are the critical elements of the BTL. In addition, a diverse mixture of conjugated flavonoids is present in white, black, and green teas (Van Der Hooft, 2012). As a result of the experimental results, there are a lot of active ligands and functional groups in the BTL extract solution, which is vital for complex construction with the cations of heavy metals (Brza, 2020). PPL in black tea leaves extracts solution combines with Zn2+ cations to form Zn2+-PPL complex. Coordinate bonds arise between electron-pair donors, known as ligands, and electron pair acceptors, metal atoms or ions, which is a required property of coordination compounds (Lawrance).
In order to achieve the desired optical characteristics, the Zn2+-PPL complex is mixed with a CS: POZ polymer blend. In this study, the amorphous phase of blend polymer composites increased whiles the decreased. On the other hand, the importance of the current study may be seen in the green methods and desirable optical features, particularly the low of the polymer composite.
2 Materials and methods
2.1 Materials
Chitosan (low molecular weight, 75% deacetylated), poly(2-ethyl-2-oxazoline) (POZ) powder (average molecular weight of 200,000 g/mol), and zinc acetate (Zn (CH3CO2)2·2H2O) [MW = 219.49 g/mole] were obtained from Sigma-Aldrich, and BTL was purchased from a local market.
2.2 Sample preparation
Using distilled water (D.W.), extract BTLs solution was made. To begin the extraction method, place 50 g of BTL in 1200 mL D.W. at 90 °C, but avoid direct sunlight. After 10 min, the BTLs extract solution was filtered. 20 g zinc acetate (Zn (CH3CO2)2·2H2O) was dissolved in 250 mL D.W. at the same time. By loading dissolved Zn (CH3CO2)2 to the extract BTLs solution at 80 °C, the Zn2+- PPL complex was synthesized. The solution was stirred for around 10 min. The Zn2+- PPL complex synthesis was confirmed when the dark-coloured BTL solution was converted into light brown and precipitated at the bottom of the container. Prior to use, the Zn2+- PPL solution was brought to room temperature. The Zn2+- PPL complexes were rinsed numerous times with D.W. After that, 100 mL of D.W. was added to the Zn2+- PPL complexes.
To make the polymer blend, 4 gm of POZ was first dissolved in 600 mL of acetic acid (1 wt%) solution at ambient temperature and then stirred for 45 min with a magnetic stirrer. Six grams of CS powder were then added to create the blend polymer. Continuous stirring was used until homogenous solutions were achieved.
The solution cast method was used to prepare composite samples containing a CS: POZ blend doped with Zn2+- PPL complex. The samples were made by adding 15–45 mL of Zn2+- PPL complex solution in 15 mL portions to a homogenous CS: POZ blend solution. For around 40 min, the solutions were continuously mixed. For CS: POZ blend injected with 0–45 mL of Zn2+- PPL complexes, the samples were coded as PBZn-0, PBZn-1, PBZn-2, and PBZn-3. The mixtures were cast into Petri dishes and allowed to dry at ambient temperature to make the films. Sample preparation for the prepared composite electrolytes is shown in Fig. 1.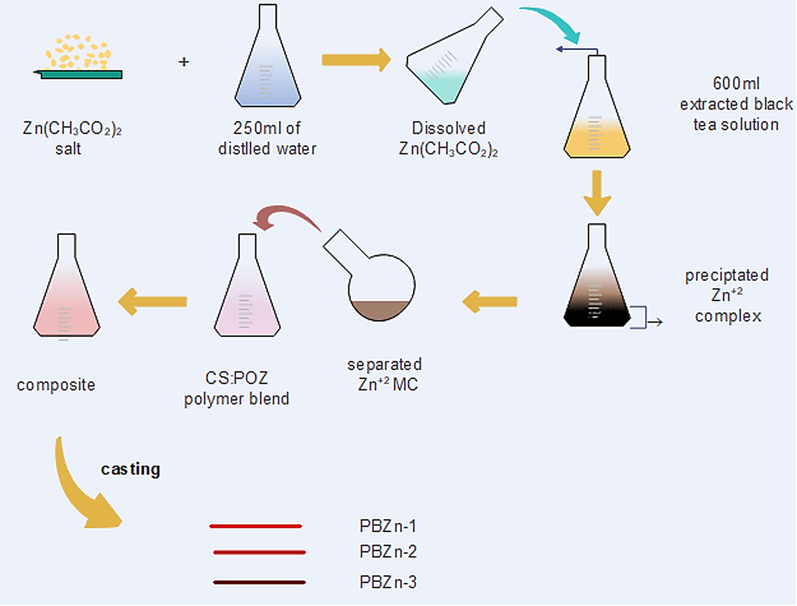
Schematic diagram of sample preparation.
2.3 X-ray diffraction
The structural properties were investigated with an X-ray diffractometer (XPERT-PRO) equipped with a Cu kα (λ = 0.154 nm) radiation source in the 2θ between 10° and 80° at a scan rate of 2°min−1.
2.4 Fourier transform infrared (FTIR) and UV–visible spectroscopy
The films were measured between 400 and 4000 cm−1 with a resolution of 2 cm−1, using Nicolet iS10 FTIR spectrophotometer (Perkin Elmer, Melville, New York, United States). A Perkin Elmer double beam UV–vis–NIR spectrometer (Lambda 25 model) was used to record the UV–vis spectra of the synthesized films. The average thickness of the films in the range of 111–115 µm.
3 Result and discussion
3.1 XRD study
The X-ray diffraction form is a trustworthy and straightforward method for evaluating the crystal structure of PCs. The amorphous phase is linked with broader peaks, while the crystalline phase is characterized by sharp peaks (Salleh et al., 2016). The XRD patterns of the Zn2+-PPL complex, pure CS: POZ blend, and its composites are shown in Fig. 2(a and b). The crystalline peaks' absence over the 2
degree indicates that the structure of the produced Zn2+-PPL complex is predominantly amorphous (Fig. 2a). Three peaks may be seen in the XRD of the composites and the polymer blend (see Fig. 2b). The crystalline peaks at 2
= 7, 11 and 20 in the polymer blend's XRD pattern relate to the crystalline structure; nevertheless, as the concentration of the Zn2+-PPL complex raised, the crystalline peaks declined and broadened; on the other hand, the peaks at 2
= 7 and 11 virtually disappeared, suggesting an almost increase in amorphous phases.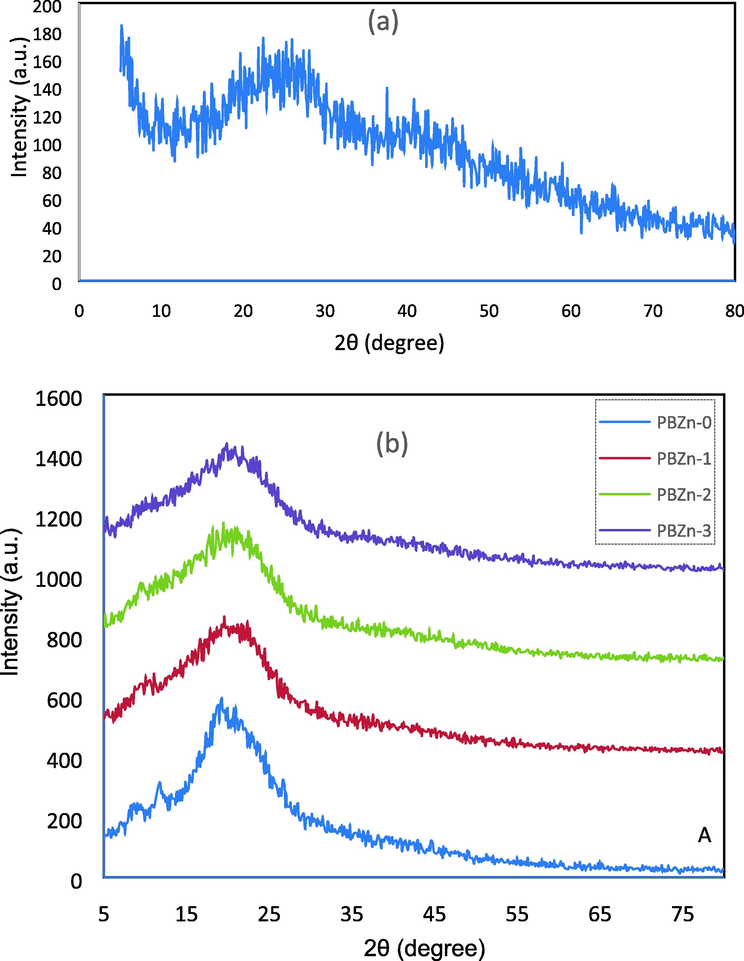
X-ray diffraction (XRD) pattern for the (a) Zn2+-PPL complex and (b)CS: POZ polymer blend and its composites.
3.2 FTIR study
Fourier-transform infrared (FTIR) spectroscopy was utilized to describe and identify the components in a black tea leaf extract solution. By earlier research, the information about the functional group of the BTL sample can be acquired by analyzing the spectra ranges between 400 and 4000 cm−1. This is an essential region for identifying functional groups because the vibration frequency of chemical bonds of organic compounds and inorganic compounds are determined in this area. The functional groups absorption due to vibration happens in a narrow range of frequency and has a robust intensity of IR absorption. The absorption peaks of several functional groups emerge in the definite region, and their places are roughly fixed (Zhou et al., 2020).
The BTLs extract's FTIR spectra are shown in Fig. 3. The strong wide N-H and O-H stretching vibration modes of PPL are mainly ascribed to the broad band found at 3272 cm−1 (Loo et al., 2012; Senthilkumar and Sivakumar, 2014). Both O-H stretching in phenol, alcohol, and a carboxylic acid and N-H stretching mode in (secondary and primary) amide and amine were found to have a wideband in the range of 3410–3371 cm−1 in previous investigations (Szymczycha-Madeja et al., 2013). The peaks at 2925 cm−1 and 2851 cm−1 are attributed to the C-H stretching vibration of carboxylic acids and aliphatic groups (Szymczycha-Madeja et al., 2013; Senthilkumar and Sivakumar, 2014). The stretching vibration peaks for carbonyl bonds (C=O) of flavonoids, PPL, and catechins occur at 1695 cm−1 (Tao). In contrast, a strong peak for the alkene group (C=C) stretching in polyphenols and caffeine appear at 1630 cm−1. The C=C vibration of aromatic compounds is shown at 1515 cm−1, and stretch vibrations of aromatic compounds can be seen at 1450 cm−1 (Journal, 2020). An additional wideband was discovered between 1440 and 1410 cm−1, resulting from carboxylic acid O-H in plane bend and carbonate C-O stretch vibration (Szymczycha-Madeja et al., 2013). C-N vibrations from aliphatic amine groups are shown by medium intensity peaks in the 1236 cm−1 area while stretching vibrations of C-O from alcoholic compounds, esters, and carboxylic acids are characterized by sharp and robust intensity peaks in the 1037 cm−1 range (Journal, 2020). The spectrum of FTIR in this work is similar to that attained by previous documents for green and black teas (Zhou et al., 2020; Szymczycha-Madeja et al., 2013; Hao et al., 2021; Li and Zhang, 2016). The caffeine spectrum has been shown to comprise changes in the range 1700–400 cm−1 (Fig. 3), and these bands correspond to the stretching and bending vibrations of carbonyl, imidazole, pyrimidine and methyl fragments (Hao et al., 2021; Ucun and Sağlam, 2007; Mohamed El Amane and Hicham El Hamdani, 2014). Literature suggested that PPL and metal cations could form cation-polyphenol complexes when they interact together (Markova, 2014; Wu and Bird, 2010; Máirtin et al., 2003).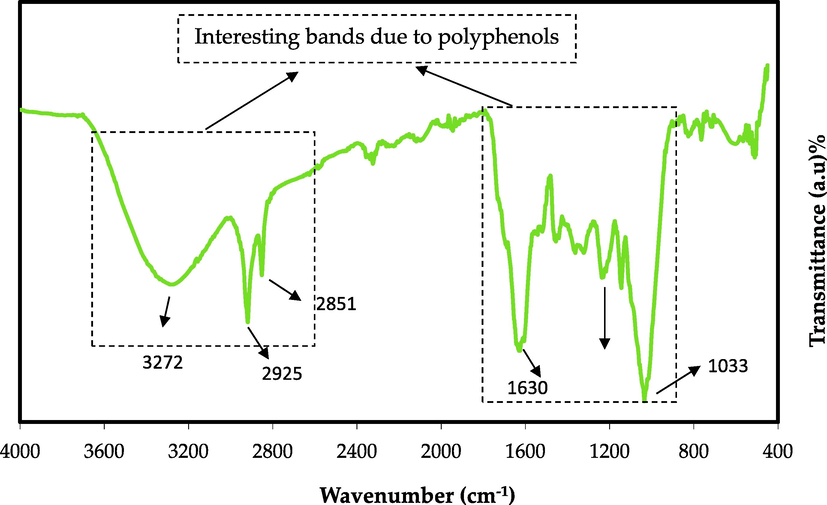
FTIR spectrum of black tea leaf.
Brza et al. produced both Cd(II) and Ce(III)-PPL complexes (Abilova et al., 2020; Markovic and Visakh, 2017). Also, Aziz et al. synthesized the Al (III)- PPL complex. Both used the extraction of black tea leaves. They claimed that a metal-PPL complex is produced when metal ions combine with PPL. The formation of colloidal suspension and green solution at the bottom and top of the container, respectively, is evidence of this creation. The FTIR spectrum of the Zn2+-PPL combination is depicted in Fig. 4. When comparing Fig. 3 to Fig. 4, it is obvious that the peaks at 2925 and 2851 cm−1 in the FTIR spectra of the Zn2+-PPL complex have almost disappeared. This is consistent with the hypothesis that coordination between PPL and Zn2+ ions causes a reduction in their vibration due to the Zn2+ ions' attachment, increasing their weight. Máirtin et al. also observed the formation of the Al complex by FTIR technique and found the metal coordination sites (Máirtin et al., 2003). They observed that aluminium-theaflavin complexation was detected by changing absorption peaks at 1630 cm−1. To give a pair of electrons from a ligand to a metal ion, the metal ion should have a vacant orbital to accept the two electrons (Lawrance). Furthermore, the peaks in the region between 1700 and 400 cm− 1 in Fig. 4 were altered.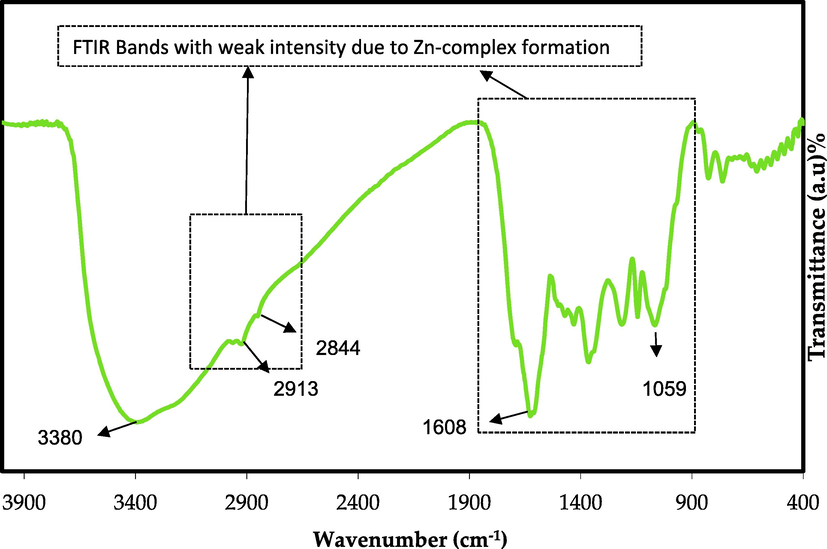
FTIR spectrum of Zn2+ complex.
As previously stated, tea extracts' caffeine and PPL interact with metal ions, and the chemistry of the interaction between Zn2+ ion and tea extracts consists of various complexes. Fig. 5 depicts three potential complexes. The Zn2+-PPL combination and the Zn2+ -caffeine complex are highly predicted (see Fig. 5c) (Fig. 5a). Moreover, as demonstrated in Fig. 5b, interactions between Zn2+, PPL, and caffeine in a complex are achievable. On the other hand, the researchers used the electron paramagnetic resonance EPR method to determine how metal ions interact with a polyphenol in BTL extract solution (Goodman and Severino, 2012). The FTIR method was employed in this research.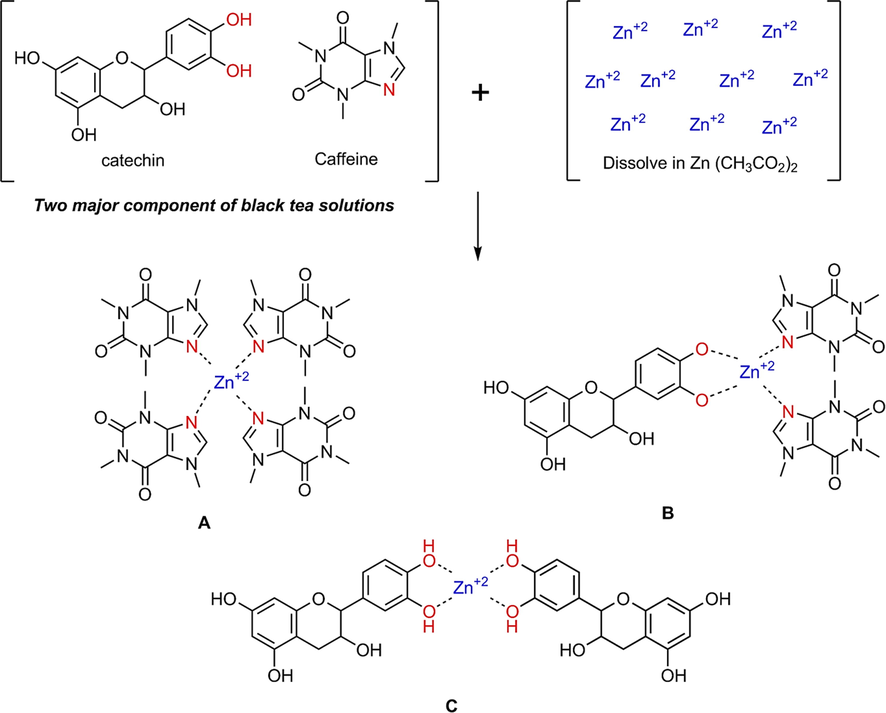
The proposed structures for the formation of (A) Zn2+-PPL complex, (B) Zn2+-caffeine complex and (C) complex form involving both polyphenol and caffeine components.
The atoms or ions interaction in PC cause variations in the polymer vibrational modes; therefore, FTIR spectroscopy is an important method to identify this interaction. Fig. 6 displays the FTIR spectra of CS: POZ polymer blend and CS: POZ loaded with Zn2+-PPL complexes. The two bands observed in pure polymer blends at 2923.56 and 2859.92 cm−1 correspond to asymmetric stretching of CH3 and CH2, but their intensities dropped as Zn2+-PPL complex concentration increases (Ali et al., 2018). Also, robust peaks seen at 1420 cm−1, 1550.02 cm−1 and 1628.87 cm−1 display C-H deformation, N-H bending, and C=O stretching (amide I band), respectively (Kumar and Koh, 2014), while these peaks are moved and display lesser intensity in the loaded films. In addition, the reduction in the intensity of the stretching band of C–O was observed at 1038.48 cm−1 (Ali et al., 2018). The connection between the metal complex and the functional groups of the polymer blend and the adsorption of metal complex particles on the functional groups of the host polymer are two possible causes for the decrease in peak intensity. As a result of the increase in molecular weight (MW) caused by adsorption, the vibrational intensity of the functional groups has decreased (Aziz et al., 2017).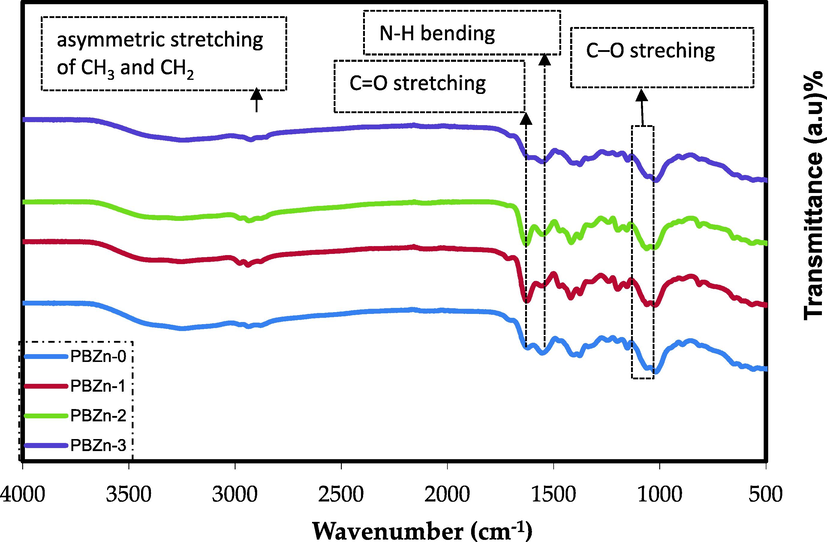
FTIR spectra of CS: POZ polymer blend and its composites.
3.3 Optical properties
3.3.1 Absorbance and absorption edge study
The absorption studies led to more interesting optical phenomena of thin films, which is thrown substantial light on the phonic and solids states band structure (Kramadhati, 2013). The CS: POZ polymer blend absorption spectra and their PCs are shown in Fig. 7. As can be seen, absorption does not occur in the visible region of the CS: POZ mix's absorption spectrum. It is nearly transparent in the visible region of the absorption spectrum. There is strong evidence to support that the photon does not absorb and the materials stay transparent to it when the incident photon's energy is smaller than the energy difference between the two electronic levels. Absorption occurs when the photon energy is more prominent, and the valence electrons shift between the two electronic levels (Parola et al., 2016).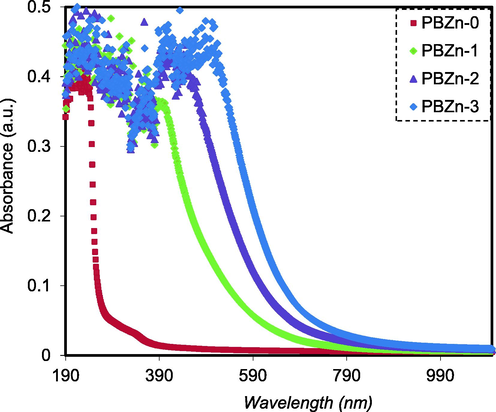
Absorption spectra for the PBZn-0, PBZn-1, PBZn-2, and PBZn-3 samples.
In contrast, the composite samples show significant absorption throughout the UV–visible range. The absorption moved to locations with longer wavelengths or lower energy as the concentration of the Zn2+-PPL complex rose. This shift and enhancement in absorption inside the loaded samples may be responsible for the substantial absorption of Zn2+-PPL complexes (Brza, 2020). The manufactured PCs must have suitable optical properties for industrial applications, such as optoelectronics, solar cells, and photonic devices (Aziz et al., 2019).
The absorption coefficient(α) of CS: POZ polymer blend and their PCs are shown in Fig. 8. From the absorption spectra, the following equation can be used to compute the α of the produced films at numerous wavelengths (Aziz et al., 2017).
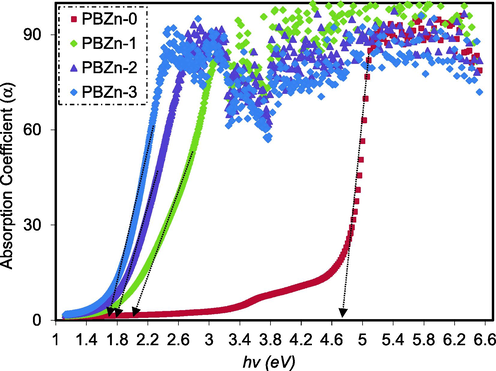
Plot of α against hυ for CS: POZ blend and its PCs.
The film's transmittance, absorbance, and thickness are represented by T, A, and t, respectively.
Many different things can occur when a beam of light transmits from one medium to another medium, for example, the propagation of light from air to solid. Some light is reflected, while others are absorbed and transferred by the medium. The responses must be simply the sum of the transmitted beam intensity IT, reflected beam IR, and absorption beam IA as the beam reaches the second medium surface, as illustrated by equation (2):
The following relationship is formed as a result of Equation (2):
R stands for reflectivity ( ), A stands for absorptivity ( ), and T stands for transmissivity ( ).
The study of optical absorption, particularly the shift and shape of the absorption edge, has proven extremely useful in comprehending the key process of primary optically induced transition in both non-crystalline and crystalline materials (Brza, 2021). Furthermore, useful data about the optical band gap is obtained when the absorption edge is carefully investigated. The broad shift of absorption edge to lower photon energy for PCs than CS: POZ blend was observed, as shown in Fig. 8. This is due to the complex formation between CS: POZ matrix and Zn2+-PPL complex. In Table 1, the absorption edge values are shown.
Sample
Absorption edge (eV)
PBZn-0
4.75
PBZn-1
2
PBZn-2
1.8
PBZn-3
1.7
3.3.2 Refractive index study
Optical properties, for example, complex dielectric constant, refractive index, and a specific wavelength range between NIR and UV, are critical factors in selecting synthesised films for various applications (Saini et al., 2013). The energy gap and refractive index of semiconductor materials show two important physical characteristics that describe their electronic and optical property. The design of optoelectronic equipment is heavily reliant on exact information about the n parameter. At constant pressure and temperature, the refractive index (n) is determined by the medium's density and polarizability (Yakuphanoglu and Arslan, 2007).Using Kramer's–Kronig relations, the values of n were derived from extinction coefficient (k) and reflectance (R):
where αλ/4πt, t is the thickness of the produced films and λ is the wavelength of incident light. Where t is the film thickness (in the range of 111–115 µm) for all the films.
Fig. 9 shows the changing of refractive index with wavelength for samples. The results show that adding the Zn2+-PPL complex filler to the CS: POZ polymer blend changed the n of the composite films, increasing it from 1.17 to about 1.28. This is most likely because of the space charge creation in the Zn2+-PPL complex filler presence (Somesh et al., 2019), which improved bond strength and dipole strength. It also shows that the refractive indexes of all the specimens tested were highest in the UV area below 300 nm. Subsequently, when the wavelength increased, they began to diminish. The value of n became constant at long wavelengths (λ→∞). This is due to the resonance effect caused by the photons of incident light polarizing the specimens (Aziz et al., 2021).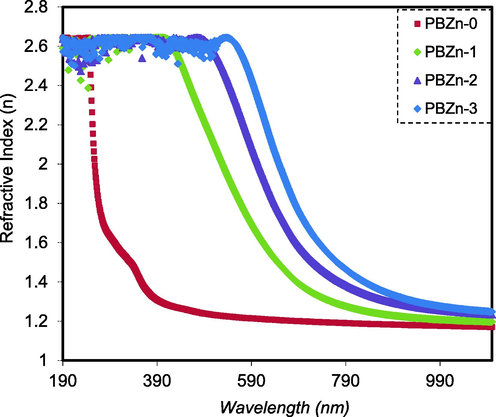
n versus λ for the PBZn-0, PBZn-1, PBZn-2, and PBZn-3 samples.
PCs and/or polymers with large n have gained interest because of their light weight, superior ductility, and flexibility relative to inorganic materials. The main uses of polymers with high n are optical storage device (Yetisen et al., 2016), lenses (Kim, 2015), antireflective coating (Li et al., 2013), and optical immersion lithography (Sanders, 2010).
3.3.3 Dielectric constant and localized density of state (N/m*) study
It is important to note that changes in the optical dielectric constant cause the fundamental optical transition in PCs. The ability of bulk material to lose energy can be measured by the number of electrons that sit on its surface. It is split into two sections: real (
) and imaginary (
). The real part evaluates a material's ability to slow down an electromagnetic wave. The performance of absorbing energy owing to polarization is calculated in the imaginary part. The real and imaginary parts of the
are related with both n and k values (Wakkad et al., 2000), as shown below.
The
spectra of all samples are shown in Fig. 10 as a function of wavelength, and it is evident that the number of Zn2+-PPL complexes increases with increasing
value. According to the Spitzer–Fan model, there is a straight connection between the
and density of states inside the bandgap of the polymer films. This rise is therefore caused by an increase in the density of states (Spitzer and Fan, 1957).
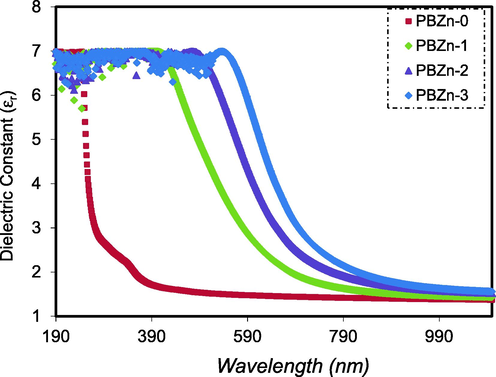
Dielectric constant versus wavelength for the PBZn-0, PBZn-1, PBZn-2, and PBZn-3 samples.
where , represents the material's dielectric response at high frequencies (short wavelengths), e represents the electron charge, c represents the light speed, represents the free space dielectric constant, N represents the charge carrier concentration, and m* represents the electron effective mass.
In the visible wavelength area, the connection between the values of
and
is a straight line, as seen in Fig. 11. Using the parameters in Table 2, one may calculate the
and N/m* correspondingly from the slope and intersect of the line in the y-axis. Equation (7) can be used to approximate the values of
, N, and N/m* as shown in Table 3.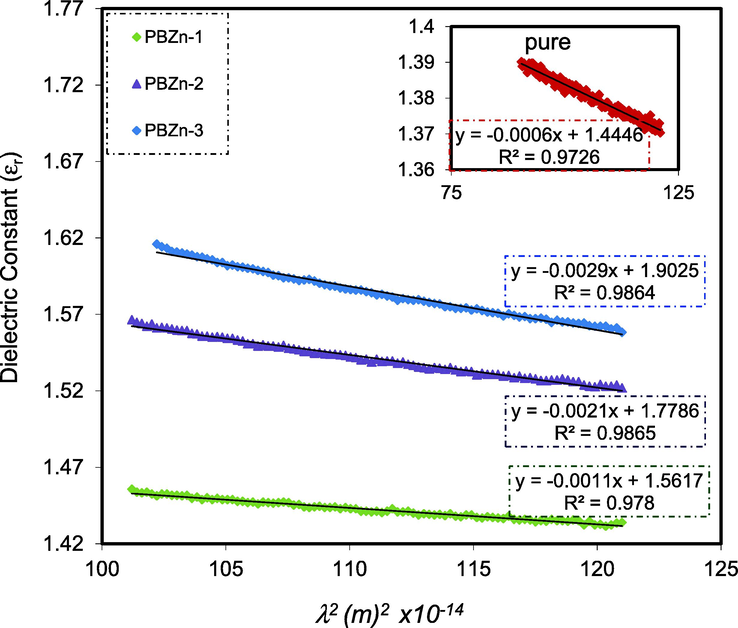
Relationship between
and
for the PBZn-0, PBZn-1, PBZn-2, and PBZn-3 samples.
Physical Parameters
Values
mass of an electron (me)
9.109 ×
Kg
charge of an electron (e)
1.602 ×
coulombs
dielectric constant of free space (ԑo)
8.85 ×
F/m
π
3.14
speed of light (c)
2.99 ×
m/s
effective mass (m*)
10.566 ×
Kg
Sample code
N/m* ×
(
/kg)
PBZn-0
7.3
1.444
PBZn-1
13.4
1.562
PBZn-2
25.5
1.778
PBZn-3
35.3
1.902
Table 3 reveals that as the Zn2+-PPL complex concentration increases, the charge carriers/m* of the CS: POZ blend film increase 5-fold, from to /kg, and the value of rises from 1.44 to 1.90.These rising N/m* and values can be interpreted as evidence of more free charge carriers actively participating in the process of polarization (Aziz et al., 2021). The predicted values for the N/m* in this investigation agree with those published in the literature (Ebnalwaled and Thabet, 2016; Hoque et al., 2018).
3.3.4 Band gap study
Since the band structure of materials influences the optical dielectric function ( ), the is determined using the optical dielectric loss ( ), whereas electronic transitions nature is given based on Tauc's technique (Aziz, 2017). The usage of UV–vis spectroscopy to evaluate the has been shown to greatly aid the materials band structure (Abilova et al., 2020; Varishetty et al., 2010; Zhou et al., 2020).
For discussing optical transition process in detail, the was studied. It is identified that the can explain the optical transition very well (Guo and Du, 2012). It is important to note that interband transitions are responsible for the emergence of the peak in the spectra (Guo and Du, 2012). The real can be calculated from the intersection of the linear part and horizontal axis ( ) using the spectra.
In reaction to electromagnetic wave transmissions, the
value replicates the essence of the medium. The imaginary portion
, signifies the real transition between the unfilled Ψkc wave function and filled Ψkv wave function which is provided by (Hossain et al., 2008):
From a QM perspective, equation (8) reveals a direct relation between and the (EΨkc- EΨkv) band structure. The delta function is used to confirm the energy conservation related to the electronic transitions: only when the photon's energy equals the different energy between conduction and valence levels the transition occurs.
Simple equations may be used to calculate the complex dielectric function (CDF), which can be associated with other optical quantities (k and n). The plots of
against
for the CS: POZ blend film and its composite are shown in Fig. 12. As can be seen, all the films have distinct peaks. Interband transitions are responsible for the peak in the
spectra (Hoque et al., 2018; Loo et al., 2012). Consequently, the intersection of linear sections of
spectra and the
axis might be used to determine the true
. Table 4 shows the
values obtained from Fig. 12.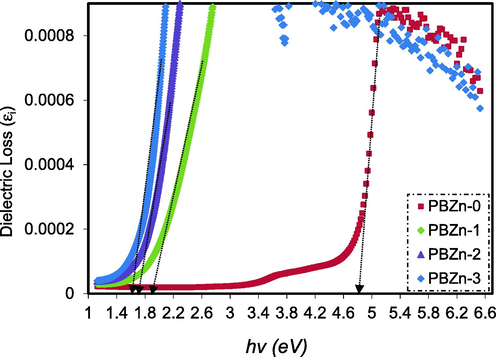
Dielectric loss against hυ for the PBZn-0, PBZn-1, PBZn-2, and PBZn-3 samples.
Sample Code
Dielectric Loss
PBZn-0
4.8
4.8
4.65
4.65
4.8
PBZn-1
1.7
2.69
1.6
1.9
1.9
PBZn-2
1.48
2.28
1.5
1.75
1.7
PBZn-3
1.48
2.1
1.4
1.6
1.6
was calculated for CS: POZ blend film as well as CS: POZ doped with Zn2+-PPL metal complex using Tauc's equation.
In Eq. (9), B denotes the parameter influenced by the possibility of an interband transition,
refers to the input photon energy, and
represents the kind of electron transfer (Aziz, 2017). According to Tauc's theory (Aziz et al., 2020); several electronic transitions can exist between the conduction band (CB) and valence band (VB). For direct allowed transition,
is ½, for indirect allowed transition,
is 2, for direct forbidden transition,
is 3/2, and for indirect forbidden transition,
is 3 as shown in Fig. 13 (Aziz, 2017).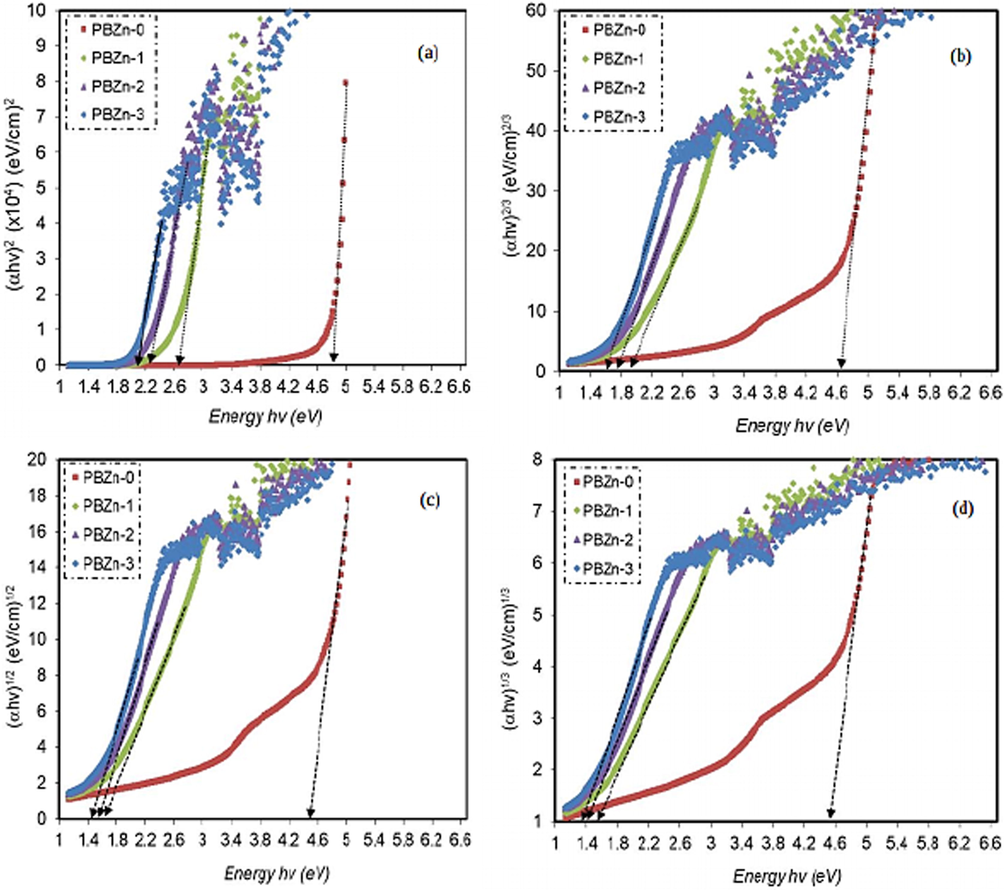
Plot of
versus (
) for (a) γ = 1/2, (b) γ = 3/2, (c) γ = 2, (d) γ = 3, for all films.
The value of
in Fig. 13 can be determined by extrapolating the intersection of the linear part of the
in dispute with
axis. The insertion of numerous localized states (i.e., trap levels) into the prohibited bandgap via the integration of filler into the polymer has previously been associated with a drop-in
(Ebnalwaled and Thabet, 2016; Drynan et al., 2010). Fig. 14 illustrates the types of transition associated with electron based on Tauc's model.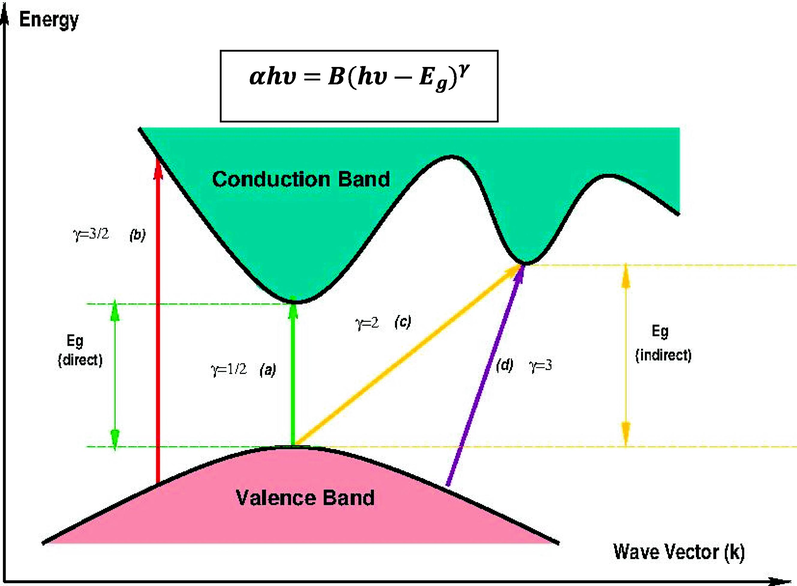
Classes of electronic transition: (a) direct allowed, (b) direct forbidden, (c) indirect allowed, and (d) indirect forbidden (Aziz, et al., 2020).
The values of decrease as the Zn2+-PPL insertion is increased, as seen in Table 4. This could be attributed to electronic structure rearrangement of the CS: POZ Polymer blends after loading Zn2+-PPL, resulting in polymer blend defects (Hemalatha et al., 2014). As a result, the phenomenon of state trapping happens within the bandgap, facilitating electron transition between VB and CB (Nofal et al., 2021). It is desirable to have a low Eg for applications since it enhances the thermal population probability of the CB and hence the intrinsic charge carrier numbers (Sonmez et al., 2003). The Eg reduction is also due to Zn2+-PPL complex insertion into the polymer chains and, thereby, lengthening the density of state more into the region of visible electromagnetic radiation compared to the undoped film. The Eg decrease improves the semiconducting level of the fabricated loaded films (Abdi, 2012).
Polymer-Based functional composites are crucial for novel optical, sensor optoelectronic and energy applications. Many research works have been focused on decreasing the optical band gap of solid polymer composites to produce thin films to be used in the promising optoelectronic industry. Our research group focused on transferring transparent insulating polymers to polymer composites with optical energy band gaps close to semiconductor or conductive polymer materials.
From Tauc's model and we can derive the two crucial parameters, and the cut-off energy (see Figs. 12 and 13). The electron transition types in materials can be determined based on the values of both parameters (Aziz, 2017).the kind of electronic transition in parent CS: POZ is direct allowed ( ), whereas it is direct forbidden ( ) in composite samples., as shown by a comparison of Figs. 11 and 12 (see Table 4). As a result, the structure of solid bands can be studied using an optical dielectric function (ODF). An ODF is a useful tool for studying solid band structure-interband transitions produce the origin and different peaks in the dielectric functions (Aziz et al., 2021).
The complex dielectric function (CDF) can be related to other measurable optical properties using simple equations to explain the optical characteristics of solids (Hussein, 2020). Optical dielectric functions (
and
) are connected to the density of localized electronic states inside the composite films' forbidden gap, according to previous research (Journal, 2020; Ucun and Sağlam, 2007; Mohamed El Amane and Hicham El Hamdani, 2014).Numerous significant additional characteristics such as relaxation time (τ), optical resistivity (ρ) and plasma frequency (
) may be easily approximated using the Drude free electron theory by employing the
parameter using values of N/m*:
In the region where a linear behavior was obtained, for
with
(see Fig. 15), the relaxation time(τ) parameter can be obtained based on Eq.(10) for all the samples. The values of τ were determined using the N/m* values derived from Eq. (7) and the slope of
versus
. Furthermore, the electron's optical resistivity (
), optical mobility (
), and plasma angular frequency (
)were calculated using the following relationships:
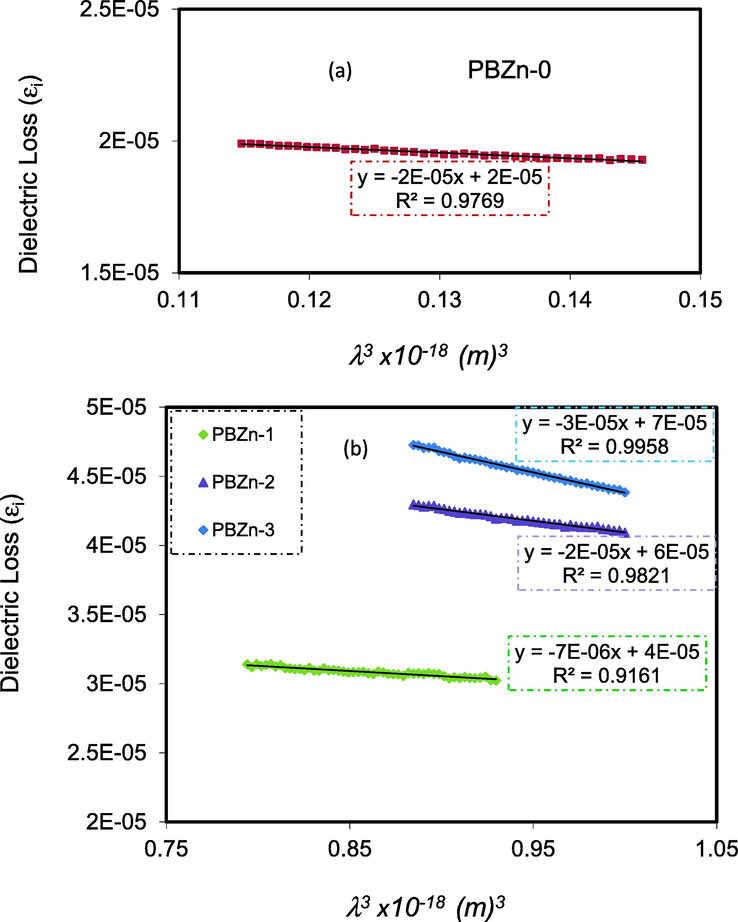
Plots of εi with λ3 for (a) pure CS:POZ (PBZn-0) and (b), PBZn-1, PBZn-2, and PBZn-3 samples.
In Table 5, the computed values of
and
are also shown. The inclusion of the Zn+2 metal complex reduced the values of
,
, and
of pure PVA, resulting in a quicker relaxation response of the PCs to the applied optical electric field than the unoccupied one (Nofal et al., 2021). From Table 5, one can notice that (
) decreased with rising Zn2+-PPL metal complex. This is related to the fact more electron provider source are added to the polymer blend and thus impurity level inside the band gap reduces the time for electrons to transfer.
Film Code
τ (ps)
PBZn-0
7.99
12.1
7.71
1.01
2.11
PBZn-1
5.86
8.89
14.1
0.75
3.88
PBZn-2
5.59
8.48
27
0.412
7.4
PBZn-3
5.15
7.81
37.3
0.324
10.22
The decrease in, τ, , and is related to the increase in n, and as a result, the light velocity in the medium with a higher n will decrease. The insertion of the Zn+2 metal increased electron's plasma frequency ( ) by five times, from 2.11 × to 10.22 × Hz. This is in agreement with earlier results for other PCs, which showed that the dipole moment of the nanofillers boosted the material's polarization under the applied electric field, resulting in a high local electric field (Aziz et al., 2016). As a result, several optical parameters were discovered in addition to predicting bandgap from the optical dielectric loss function, all of which are critical for the manufacturing process in optoelectronic applications.
3.3.5 Wemple-DiDomenico (WD) model
Experiment results matching based on the WDD single oscillator model was used to evaluate the refractive index dispersion (no) of the produced films. The refractive index and its dispersion characteristic are two of the most crucial optical material properties to investigate. Refractive index dispersion is vital when exploring optical communication for spectrum dispersion (Aziz et al., 2021). The single oscillator model of WD can be used to study no in the normal area (Wemple and DiDomenico, 1971). A dispersion energy parameter (
) is used as a metric for the force of the inters band optical transition in this investigation. Because it incorporates the coordination number and charge distribution in each unit cell, the
parameter is strongly tied to chemical bonding. As a consequence, the oscillator energy (i.e., the average Eg) is related in a linear manner to a single oscillator parameter (
). As demonstrated in the semiempirical equation below, the photon energy and refractive index under the interband absorption edge is associated (Nofal et al., 2021).
The data on plots of
versus
were fixed with linear regression lines to derive the values of
and
and from the slope and intercept, respectively, as shown in Fig. 16. The constants
and
show the dispersive energy and single oscillator, respectively.
and
stand for the structure disorder and average excitation energy, respectively, and enhance the optical transitions through the material's band structure.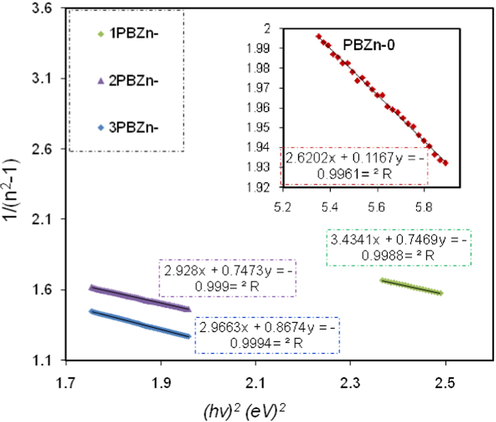
Variation of 1/(n2-1) versus photon energy
for the PBZn-0, PBZn-1, PBZn-2, and PBZn-3 samples.
The computed
and
values are shown in Table 6. An increase in
and a decrease in
were seen as the amount of the Zn+2-complex increased. The
and
are connected (Benchaabane et al., 2014).As shown in Table 4, the
for the films are empirically equal to the direct
(
≈
).
Sample code
PBZn-0
4.74
1.808
PBZn-1
2.14
0.617
PBZn-2
1.97
0.676
PBZn-3
1.84
0.623
4 Conclusion
In conclusion, BTL extract can be used successfully to synthesize Zn2+-PPL complexes and fabricate direct bandgap PCs with an enhanced amorphous structure which are useful in the optoelectronic device uses. The XRD result showed an increase in peak span and a decrease in peak intensity for the neat blend after adding the Zn2+-PPL complex, indicating that the amorphous phase was enlarged inside the PCs. The XRD result of the produced Zn2+-PPL complex also revealed the amorphous phase. The FTIR analysis established the formation of Zn2+-PPL complex via significant changes in the intensity of FTIR bands in Zn2+-PPL complexes. UV–visible spectroscopy was used to investigate the effect of dispersion of the Zn2+-PPL metal complex on the optical properties of the CS-POZ blend polymer. The composite's essential properties, such as , type of transitions, n, absorption edge, and were determined. The results indicate that the optical characteristics were improved by loading the Zn2+-PPL complex. Tauc's method was utilized to choose the type of electron transitions, while the was determined by carefully analyzing the . The N/m*, , , , and associated with electron were also measured using the diagram of imaginary and real parts of complex dielectric constant versus wavelength of photons. The N/m* values were amplified 7.3 × /kg to 35.3 × /kg in proportion to Zn2+-PPL complex concentration, resulting in a significant reduction in the optical bandgap. The WD single oscillator model was used to measure the and properties. The of the films was dramatically droped by adding Zn2+-PPL complex to the blend. Due to the simplicity and environmental friendliness of the approach used in this study, as well as the enhancement of excellent optical properties and UV–vis absorption, these films have the potential to be employed in photonics devices.
Acknowledgements
We would like to acknowledge all support for this work by the University of Sulaimani. The authors acknowledge the financial support for this study from the Ministry of Higher Education and Scientific Research-Kurdish National Research Council (KNRC).
References
- Optical band gap and conductivity measurements of polypyrrole-chitosan composite thin films. Springer. 2012;30(1):93-100.
- [CrossRef] [Google Scholar]
- Abilova, G.K., et al., 2020. Chitosan/poly(2-ethyl-2-oxazoline) films with ciprofloxacin for application in vaginal drug delivery. Materials (Basel) 13 (7). doi: 10.3390/ma13071709.
- Chitosan nanoparticles extracted from shrimp shells, application for removal of Fe(II) and Mn(II) from aqueous phases. Sep. Sci. Technol.. 2018;53(18):2870-2881.
- [CrossRef] [Google Scholar]
- Metal complex as a novel approach to enhance the amorphous phase and improve the EDLC performance of plasticized proton conducting chitosan-based polymer electrolyte. Membranes (Basel). 2020;10(6):1-20.
- [CrossRef] [Google Scholar]
- Morphological and optical characteristics of chitosan(1–x): Cuox (4 ≤ x ≤ 12) based polymer nano-composites: Optical dielectric loss as an alternative method for tauc’s model. Nanomaterials. 2017;7(12):1-15.
- [CrossRef] [Google Scholar]
- Proton conducting chitosan-based polymer blend electrolytes with high electrochemical stability. Molecules. 2019;24:1-15.
- [Google Scholar]
- Tuning the absorption of ultraviolet spectra and optical parameters of aluminum doped PVA based solid polymer composites. J. Mater. Sci. Mater. Electron.. 2015;26(10):8022-8028.
- [CrossRef] [Google Scholar]
- In situ synthesis of CuS nanoparticle with a distinguishable SPR peak in NIR region. J. Mater. Sci. Mater. Electron.. 2016;27(5):4163-4171.
- [CrossRef] [Google Scholar]
- From insulating PMMA polymer to conjugated double bond behavior: green chemistry as a novel approach to fabricate small band gap polymers. Polymers (Basel). 2017;9(11):1-15.
- [CrossRef] [Google Scholar]
- Fabrication of polymer blend composites based on [PVA-PVP](1–x):(Ag2S)x (0.01 ≤ x ≤ 0.03) with small optical band gaps: Structural and optical properties. Mater. Sci. Semicond. Process.. 2017;71(May):197-203.
- [CrossRef] [Google Scholar]
- Aziz, S.B., Hamsan, M.H., Kadir, M.F.Z., Karim, W.O., Abdullah, R.M., 2019. Development of polymer blend electrolyte membranes based on chitosan: dextran with high ion transport properties for EDLC application. Int. J. Mol. Sci. 20 (13). doi: 10.3390/ijms20133369.
- Aziz, S.B., et al., 2020. A comprehensive review on optical properties of polymer electrolytes and composites. Materials (Basel) 13 (17). doi: 10.3390/MA13173675.
- Aziz, S.B., et al., 2021. Characteristics of poly(Vinyl alcohol) (PVA) based composites integrated with green synthesized Al3+-metal complex: structural, optical, and localized density of state analysis. Polymers (Basel) 13 (8). doi: 10.3390/polym13081316.
- Aziz, S.B., et al., 2021. Synthesis of pva/ceo2 based nanocomposites with tuned refractive index and reduced absorption edge: Structural and optical studies. Materials (Basel). 14 (6), doi: 10.3390/ma14061570.
- Benchaabane, A., et al., 2014. Performances of effective medium model in interpreting optical properties of polyvinylcarbazole:ZnSe nanocomposites. J. Appl. Phys. 115 (13). doi: 10.1063/1.4870804.
- Tea from the drinking to the synthesis of metal complexes and fabrication of PVA based polymer composites with controlled optical band gap. Sci. Rep.. 2020;10(1):1-17.
- [CrossRef] [Google Scholar]
- Green coordination chemistry as a novel approach to fabricate polymer:Cd(II)-complex composites: Structural and optical properties. Opt. Mater. (Amst). 2021;116(April):111062
- [CrossRef] [Google Scholar]
- Clark, J., Lanzani, G., 2010. Organic photonics for communications. Nat. Photonics 2010 47 4 (7) 438–446. doi: 10.1038/nphoton.2010.160.
- D. K.-F. T. (USA) and undefined 1984. Use of chitinous polymers in food: a challenge for food research and development. agris.fao.org. Accessed: Sep. 25, 2021. [Online]. Available from: <https://agris.fao.org/agris-search/search.do?recordID=US8500036>.
- Low-bandgap near-IR conjugated polymers/molecules for organic electronics. Chem. Rev.. 2015;115(23):12633-12665.
- [CrossRef] [Google Scholar]
- The chemistry of low molecular weight black tea polyphenols. Nat. Prod. Rep.. 2010;27(3):417-462.
- [CrossRef] [Google Scholar]
- Controlling the optical constants of PVC nanocomposite films for optoelectronic applications. Synth. Met.. 2016;220:374-383.
- [CrossRef] [Google Scholar]
- Goodman, B., Severino, J., K. P.-F. & function, and undefined 2012. Reactions of green and black teas with Cu (II). pubs.rsc.org. Accessed: Jan. 02, 2022. [Online]. Available from: <https://pubs.rsc.org/en/content/articlehtml/2012/fo/c1fo10086f>.
- First-principles study of electronic structures and optical properties of Cu, Ag, and Au-doped anatase TiO 2. Phys. B Condens. Matter. 2012;407(6):1003-1007.
- [CrossRef] [Google Scholar]
- Hao, R., Li, D., Zhang, J., Jiao, T., 2021. Green synthesis of Iron nanoparticles using green tea and its removal of hexavalent chromium. Nanomaterials 11, 650. mdpi.com. doi: 10.3390/nano11030650.
- Synthesis, characterization and optical properties of hybrid PVA-ZnO nanocomposite: a composition dependent study. Mater. Res. Bull.. 2014;51:438-446.
- [CrossRef] [Google Scholar]
- Efficient inorganic-organic hybrid heterojunction solar cells containing perovskite compound and polymeric hole conductors. Nat. Photonics. 2013;7(6):486-491.
- [CrossRef] [Google Scholar]
- Fabrication and comparative study of magnetic Fe and α-Fe2O3 nanoparticles dispersed hybrid polymer (PVA + Chitosan) novel nanocomposite film. Results Phys.. 2018;10(May):434-443.
- [CrossRef] [Google Scholar]
- Optical properties of anatase and rutile titanium dioxide: Ab initio calculations for pure and anion-doped material. J. Phys. Chem. Solids. 2008;69(7):1820-1828.
- [CrossRef] [Google Scholar]
- Steps toward the band gap identification in polystyrene based solid polymer nanocomposites integrated with tin titanate nanoparticles. Polymers (Basel). 2020;12(10):1-21.
- [CrossRef] [Google Scholar]
- Biointerface Res. Appl. Chem.. 2020;10(3):5556-5563.
- Effective graded refractive-index anti-reflection coating for high refractive-index polymer ophthalmic lenses. Mater. Lett.. 2015;160:158-161.
- [CrossRef] [Google Scholar]
- Kramadhati, S., K. T.-I. journal of engineering, and undefined 2013. Optical properties of pure and doped (KNO3 & Mgcl2) polyvinyl alcohol polymer thin films. Citeseer. 6 (8), 15–18. Accessed: Jan. 02, 2022. [Online]. Available from: <https://citeseerx.ist.psu.edu/viewdoc/download?doi=10.1.1.415.6510&rep=rep1&type=pdf>.
- Physiochemical and optical properties of chitosan based graphene oxide bionanocomposite. Int. J. Biol. Macromol.. 2014;70:559-564.
- [CrossRef] [Google Scholar]
- Lawrance, G.A. Introduction to Coordination Chemistry.
- Li, X., Zhang, Y., Y. H.-S. reports, and undefined 2016, Rapid detection of talcum powder in tea using FT-IR spectroscopy coupled with chemometrics. nature.com. Accessed: Jan. 02, 2022. [Online]. Available from: <https://www.nature.com/articles/srep30313>.
- Polymer thin films for antireflection coatings. J. Mater. Chem. C. 2013;1(12):2266-2285.
- [CrossRef] [Google Scholar]
- Synthesis of silver nanoparticles by using tea leaf extract from Camellia Sinensis. Int. J. Nanomedicine. 2012;7:4263-4267.
- [CrossRef] [Google Scholar]
- Máirtin, Ó., Astill, C., S. S.-D. Transactions, and undefined 2003, Potentiometric, FTIR and NMR studies of the complexation of metals with theaflavin. pubs.rsc.org. Accessed: Jan. 02, 2022. [Online]. Available from: <https://pubs.rsc.org/en/content/articlehtml/2003/dt/b211102k>.
- Iron(II, III)-polyphenol complex nanoparticles derived from green tea with remarkable ecotoxicological impact. ACS Sustain. Chem. Eng.. 2014;2(7):1674-1680.
- [CrossRef] [Google Scholar]
- Markovic, G., Visakh, P.M., 2017. Polymer blends: state of art. In: Recent Dev. Polym. Macro, Micro Nano Blends Prep. Characterisation, pp. 1–15. doi: 10.1016/B978-0-08-100408-1.00001-7.
- Mohamed El Amane, Hicham El Hamdani, 2014. Synthesis and characterization of caffeine complexes [M (caf) 4X2] M = Ni(II), Cu(II), Zn(II), Cd(II) X = SCN- , CN- ; caf : caffeine.
- Crawfish chitosan as a coagulant in recovery of organic compounds from seafood processing streams. J. Agric. Food Chem.. 2002;37(3):580-583.
- [CrossRef] [Google Scholar]
- Nofal, M.M., et al., 2021. Polymer composites with 0.98 transparencies and small optical energy band gap using a promising green methodology: structural and optical properties. Polymers (Basel). 13 (10), doi: 10.3390/polym13101648.
- Multi-phase semicrystalline microstructures drive exciton dissociation in neat plastic semiconductors. J. Mater. Chem. C. 2015;3:10715-10722.
- [CrossRef] [Google Scholar]
- Optical properties of hybrid organic-inorganic materials and their applications. Adv. Funct. Mater.. 2016;26(36):6506-6544.
- [CrossRef] [Google Scholar]
- Ponmurugan, P., Kavitha, S., … M. S.-T.-C. and, and undefined 2019. Tea polyphenols chemistry for pharmaceutical applications. books.google.com. Accessed: Jan. 02, 2022. [Online]. Available from: <https://books.google.com/books?hl=en&lr=&id=bBT8DwAAQBAJ&oi=fnd&pg=PA115&dq=Ponmurugan,+P.,+Kavitha,+S.,+Suganya,+M.,+%26+Gnanamangai,+B.+M.+(2019).+Tea+polyphenols+chemistry+for+pharmaceutical+applications.+In+Justino,+J.,+Tea+-+Chemistry+and+Pharmacology.+&ots=ksCJS5sONB&sig=3MffKzpYAH9qw9XUIRPjFSmZ6Bw>.
- Saini, I., Rozra, J., Chandak, N., … S. A.-M. C. and, and undefined 2013. Tailoring of electrical, optical and structural properties of PVA by addition of Ag nanoparticles. Elsevier. Accessed: Jan. 02, 2022. [Online]. Available from: <https://www.sciencedirect.com/science/article/pii/S0254058413001740>.
- Electrical impedance and conduction mechanism analysis of biopolymer electrolytes based on methyl cellulose doped with ammonium iodide. Ionics (Kiel). 2016;22(11):2157-2167.
- [CrossRef] [Google Scholar]
- Advances in patterning materials for 193 nm immersion lithography. Chem. Rev.. 2010;110(1):321-360.
- [CrossRef] [Google Scholar]
- Green tea (Camellia sinensis) mediated synthesis of zinc oxide (ZnO) nanoparticles and studies on their antimicrobial activities. Int. J. Pharm. Pharm. Sci.. 2014;6(6):461-465.
- [Google Scholar]
- Effect of carbon nanotubes on mechanical and electrical properties of polyimide/carbon nanotubes nanocomposites. Eur. Polym. J.. 2007;43(9):3750-3756.
- [CrossRef] [Google Scholar]
- Soliman, T.S., Vshivkov, S.A., 2019. Effect of Fe nanoparticles on the structure and optical properties of polyvinyl alcohol nanocomposite films. J. Non. Cryst. Solids 519 (April). doi: 10.1016/j.jnoncrysol.2019.05.028.
- Somesh, T.E., Al-Gunaid, M.Q.A., Madhukar, B.S., Siddaramaiah. 2019. Photosensitization of optical band gap modified polyvinyl alcohol films with hybrid AgAlO2 nanoparticles. J. Mater. Sci. Mater. Electron. 30 (1), 37–49. doi: 10.1007/s10854-018-0226-3.
- Very stable low band gap polymer for charge storage purposes and near-infrared applications. Chem. Mater.. 2003;15(26):4923-4929.
- [CrossRef] [Google Scholar]
- Determination of optical constants and carrier effective mass of semiconductors. Phys. Rev.. 1957;106(5):882-890.
- [CrossRef] [Google Scholar]
- Multi-element analysis, bioavailability and fractionation of herbal tea products. J. Braz. Chem. Soc.. 2013;24(5):777-787.
- [CrossRef] [Google Scholar]
- Tao, P., et al., TiO 2 nanocomposites with high refractive index and transparency. pubs.rsc.org. doi: 10.1039/c1jm13093e.
- Ucun, F., Sağlam, A., V. G.-S. A. P. A. M. and, and undefined 2007. Molecular structures and vibrational frequencies of xanthine and its methyl derivatives (caffeine and theobromine) by ab initio Hartree–Fock and density functional. Elsevier. Accessed: Jan. 02, 2022. [Online]. Available from: <https://www.sciencedirect.com/science/article/pii/S1386142506004203>.
- Copper nanoparticles mediated by chitosan: synthesis and characterization via chemical methods. Molecules. 2012;17(12):14928-14936.
- [CrossRef] [Google Scholar]
- Structural annotation and elucidation of conjugated phenolic compounds in black, green, and white tea extracts. J. Agric. Food Chem.. 2012;60(36):8841-8850.
- [CrossRef] [Google Scholar]
- Structure, electrical and optical properties of (PVA/LiAsF 6) polymer composite electrolyte films. Polym. Eng. Sci.. 2010;50(5):878-884.
- [CrossRef] [Google Scholar]
- Metal complexation by chitosan and its derivatives: a review. Carbohydr. Polym.. 2004;55(1):77-93.
- [CrossRef] [Google Scholar]
- Optical and calorimetric studies of Ge-Sb-Se glasses. J. Non. Cryst. Solids. 2000;265(1):157-166.
- [CrossRef] [Google Scholar]
- Synthesis, characterization and optical properties of hybridized CdS-PVA nanocomposites. Mater. Chem. Phys.. 2007;106(2–3):443-446.
- [CrossRef] [Google Scholar]
- Behavior of the electronic dielectric constant in covalent and ionic materials. Phys. Rev. B. 1971;3(4):1338-1351.
- [CrossRef] [Google Scholar]
- The interaction of protein and polyphenol species in ready to drink black tea liquor production. J. Food Process Eng.. 2010;33(3):481-505.
- [CrossRef] [Google Scholar]
- Determination of thermo-optic coefficient, refractive index, optical dispersion and group velocity parameters of an organic thin film. Phys. B Condens. Matter. 2007;393(1–2):304-309.
- [CrossRef] [Google Scholar]
- Yetisen, A.K., Montelongo, Y., Butt, H., 2016. Rewritable three-dimensional holographic data storage via optical forces. Appl. Phys. Lett. 109 (6). doi: 10.1063/1.4960710.
- Discrimination of tea varieties based on FTIR spectroscopy and an adaptive improved possibilistic c-means clustering. J. Food Process. Preserv.. 2020;44(10)
- [CrossRef] [Google Scholar]


