

Translate this page into:
Tribo-corrosion behavior of Zn-Ni-Cu and Zn-Ni-Cu-TiB2 coated mild steel
-
Received: ,
Accepted: ,
This article was originally published by Elsevier and was migrated to Scientific Scholar after the change of Publisher.
Peer review under responsibility of King Saud University.
Abstract
In this investigation , Zn-Ni-Cu and Zn-Ni-Cu-TiB2 were coated on a mild steel specimen using a high velocity oxy fuel thermal spray (HVOF) process. The surface morphology and coated powder distribution of coated specimens were characterized using scanning electron microscope (SEM), energy dispersive spectroscopy (EDS), and X-ray-Elemental mapping. The pin-on-disc (ASTM G99-17) method was used to examine the wear resistance of the coated and uncoated mild steel specimens. Both coated Zn-Ni-Cu and Zn-Ni-Cu-TiB2 on mild steel saw reduced wear volume loss than uncoated mild steel. The coated samples of Zn-Ni-Cu and Zn-Ni-Cu-TiB2 on Mild Steel were put through a scratch test to determine the adhesion strength of the coating with the substrate. The adhesion strength of coated Zn-Ni-Cu and Zn-Ni-Cu TiB2 mild steel was higher than that of untreated mild steel, indicating a solid link between the coating and substrate and minimal delamination. Using the Vickers hardness test to measure the hardness caused by the coating, it was shown that coated samples of Zn-Ni-Cu and Zn-Ni-Cu-TiB2 coated mild steel had significantly higher hardness than uncoated mild steel. Using ASTM G1-03 and ASTM G-31 standards, a 0.2 M HCl immersion cycle test was conducted for 28 days to test the corrosion resistance of coatings in an acidic media (672Hrs). When compared to Zn-Ni-Cu and Zn-Ni-Cu-TiB2 coated mild steel, the weight loss for the uncoated mild steel was significantly larger. Additionally, XRD examination showed that coated samples had less rust on their surface than uncoated samples. Both Zn-Ni-Cu and Zn-Ni-Cu-TiB2 on Mild Steel were anti-corrosive, as evidenced by increased corrosion potential and reduced corrosion current density when compared to uncoated mild steel, according to electrochemical impedance spectroscopy (EIS)/Tafel study in 0.2 MHCl. The outcomes of each test were very encouraging and demonstrated the durability of these coatings against wear and corrosion.
Keywords
Tribo testing
Thermal spray
Acidic solution
Mass loss

Data Availability statement
All data generated or analyzed during this study are included in this published article (and its supplementary information files).
1 Introduction
For the majority of engineering applications, mild steel is a common material because of its high strength and inexpensive price. Mild steel has a lower resistance to corrosive wear, which restricts its use (Eddy et al., 2009). Comparing Zn-Ni alloy coatings to pure Zn coatings, good corrosion-resistant characteristics have been reported (Rashmi et al., 2017).Although zinc coating has been widely utilised, its application is restricted due to the weak chloride movement prevention (acidic and alkaline) corrosive conditions. (Meymian et al., 2020). In this research high velocity thermal spray coating (HVOF) was used to coat transition metals on mild steel and subsequently tested for corrosion and wear. Easily available Zinc, nickel, copper, and titanium diboride were surface coated on mild steel using the HVOF spray technique. TiB2 coated HVOF coatings have been reported to show brittle behavior in absence of binder material, hence Ni having good binding properties apart from corrosion resistance was used as a binding agent in coating formulation (Anwar et al., 2018). TiB2 has been reported to have high hardness against wear (Lotfi, 2010). The coated surface was characterized using SEM, and EDS, to develop a thorough insight understanding of coated surface. After that, the coated surface was subjected to a wear test (using pin on disc setup), Hardness test, and 0.2 M HCl immersion cycle test for corrosive studies. The results were very satisfactory as both coatings performed well in wear and corrosion environments. Transition metals are surface coated using HVOF for commercial applications of pipelines and automotive components.
HVOF sprayed coatings have found a significant place where erosion, corrosion, and wear-related failures are encountered (Meymian et al., 2020). HVOF spray coating process produces dense, little splat size coating having excellent erosion properties and has been used for tribo-mechanical, corrosion-resistant, chemically aggressive environments. HVOF process produces thermal and chemically stable coating because of minimum particle-flame contact time (Meymian et al., 2020). The residual stresses induced on the coated surface are lesser (Anwar et al., 2018). The erosion behavior of HVOF coatings over plasma arc coatings has been reported to be superior (Lotfi, 2010). These properties make HVOF an effective time-to-money process. This is why the HVOF process was used to surface coat the substrate in this study.
Taking into account the foregoing discussion and the proper application of the elements in the fight against corrosion. It was determined to surface coat mild steel using the HVOF technique with Zn, Ni, Cu, and TiB2, in two compositions (Zn-85 percent, Ni-5 percent, Cu-10 percent) and (Zn-80 percent, Ni-5 percent, Cu-5 percent, TiB2-10 percent), by weight, and compare their performance in the corrosive medium. Because Zn is a key component in the coating, it acts as a sacrificial anode, forming corrosion products such as ZnOH2 and ZnCl2, which protect the underlying surface from corrosion and slow down the pace of corrosion and Cl-ion migration across the interface. Ni would largely serve as a binder, assisting in coating adherence to the substrate surface. Cu would also help in corrosion prevention. The use of TiB2 would improve hardness and corrosion resistance.
Since no data is reported on the wear and corrosion behavior of HVOF-sprayed Zn-Ni-Cu and Zn-Ni-Cu-TiB2 coatings on mild steel in corrosive settings. This prompted us to pursue this research and learn more about the impact of various alloying elements on corrosion behavior.
2 Sample preparation
Mild steel specimen was cut using Wire EDM into coupons of size (10.16 cm × 6.35 cm × 0.2 cm). The specimens were sandblasted using Al2 O3 for obtaining a rough surface on a metal substrate and subsequently were ultra-sonicated in ethanol at 25 °C for removal of any surface impurity present. The material composition of the mild steel specimen was obtained using Atomic emission spectroscopy (METAL POWDER ANALYTICAL, Model NO: 1508080) and is given in Table 1.
S.No
Element
Weight %
1
C
0.26
2
Si
0.38
3
Mn
0.24
4
Zn
0.09
5
Fe
99.03
2.1 Characterization of uncoated specimen
For a better understanding of uncoated mild steel specimen surface analysis. The characterization was undertaken using EPMA (JEOL EDS System, Japan coupled EDS) analysis. The micrograph showed an uneven and boisterous surface created by grit blasting necessary for better adhesion of the coating.EPMA of the uncoated sample is given in Fig. 1.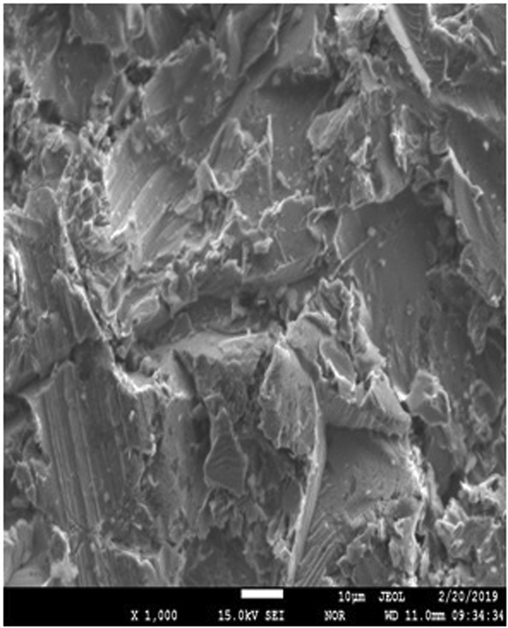
Shows EPMA and EDS of uncoated mild steel at X400.
2.2 Coating powder preparation
Two coating powder formulations were used. An electronic weighing balance (LIBROR AEG-120) was used to weigh powders. Coating 1 consisted of (Zn – 85, Ni – 10, Cu 5, % respectively by weight) and coating 2 (Zn- 80, Ni – 5, Cu – 5, TiB2 – 10, % respectively by weight).The purity of coating powders used was 99.6 %, procured from Nano-shel USA. The powder was mixed well using a convective mixer and heated on an Autoclave to remove any moisture ingress or gas trap. Size of the micro powder used is 40–50 µm. Quickly after performing the above procedure the coating powder was stored in airtight containers.
2.3 Coating procedure
Thermal spray HVOF was used because it has been reported to give good surface adhesion because of the interlocking effect and dense structure of the coating. The coating procedure is easy to set up due to moderate temperature attainment. Zinc being one of the major constituents in the coating is prevented from being oxidized due to less oxidation time of the HVOF process (0.01 Sec). Also, the porosity of the HVOF process is less than 0.5 % (Stack and Abd El-Badia, 2008). For the kind of coatings used in this work, HVOF spray may be better than plasma spray (Uusitalo et al., 2002). The specimens were fitted into a coupon holder and preheated by flame for moisture removal after obtaining the required flame the feeder input was opened and the powder was fed to a spray gun. Coating 1 (Zn-Ni-Cu) and coating 2 (Zn-Ni-Cu-TiB2) were used. Various parameters of the process are given in Table 2.
S.No
Process Parameter
Value, units
1
Gas flow rate (LPG)
0.5 m3/ min
2
Powder flow rate
20 g/min
3
Oxygen flow rate
0.3 m3/ min
4
Air compressor pressure
8 bar
5
RPM of powder feed disc
120
6
Standoff distance
150 mm
7
Temperature Of LPG mixer tank
75 °C
8
Fuel air ratio (LPG/Oxygen)
4:1
2.4 Coating thickness
A coating thickness gauge, New Dualscope, was used to measure the thickness of the coating (FMP-40, Fischer Germany). The device has a precision of 1 µm. The coating thickness varied slightly because HVOF is a mechanical spraying method. Zn-Ni-Cu on mild steel had a coating thickness of 115.1 ± 0.1 µm, while Zn-Ni-Cu-TiB2 on mild steel had a coating thickness of 114.6 ± 0.2 µm. The thickness of the coating was measured at ten separate points and average values are given.
3 Characterization of coated specimen
3.1 Characterization of coating 1
SEM (SEM, Model, Nova NANO SEM 430) coupled with EDS (EDAX, USA Apollo 40) was used to analyze the coated samples, SEM analysis of coated surface showed a conformably coated surface with globules on the surface. The coating is thick and fully spread. Due to the high velocity of HVOF thermal spray leading to insufficient melting of powder particles, several globules can be observed on the coated surface of the SEM micrograph. Fig. 2 shows the surface SEM of surface coating 1 (Zn-Ni-Cu on mild steel). X-ray Spectroscopic analysis helped to have better insights into coated powder distribution on the surface shown in Fig. 3. Zn being ample is almost fully spread across the surface. Designated by red color at 20 µm magnification. While Ni is represented by green color and Cu is represented by blue color being also presents as an isle preferably because of agglomeration of powder during coating that non-uniform pattern of coated powder is seen in elemental mapping. The Presence of Fe on the surface can be attributed due to surface diffusion from the substrate to the coating, the presence of pores is also observed in HVOF coatings, the average size of pores is 794.3 nm (Zhang et al., 2020). However, the diffusion of Fe onto the surface is very less as seen from the X-ray elemental distribution designated by light blue color. Fig. 3 gives the X-ray elemental distribution of coating 1 on the specimen (Zn-Ni-Cu on mild steel).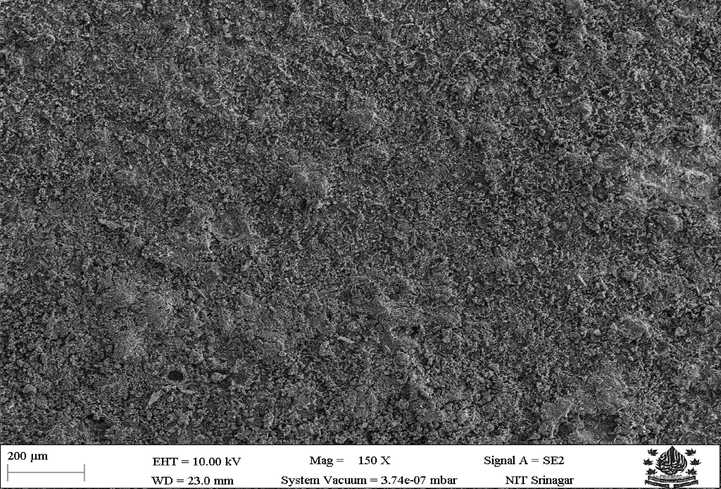
Shows an SEM image of coated (Zn-Ni-Cu on mild steel).
Shows the X-ray elemental distribution of constituent elements of (Zn-Ni-Cu on mild steel).
3.2 Characterization of coating 2
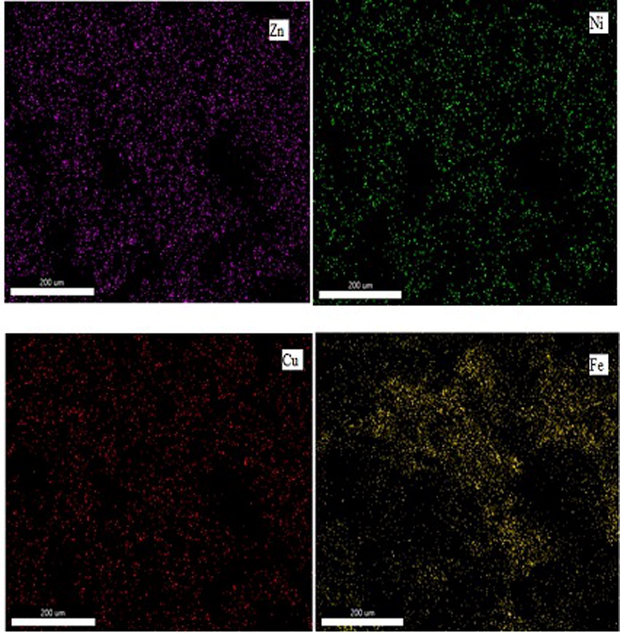
As the SEM micrograph shows coating 2 (Zn-Ni-Cu-TiB2) is well developed and fully spread with the non-uniform pattern. however, some large globules are still present preferably due to the incomplete melting of some metal powder during the spraying process but the splatted powder has solidified into splats and overlaying each other leads to a small number of pores or voids in between them. Fig. 4 shows the SEM micrograph of coating 2 (Zn-Ni-Cu-TiB2 on mild steel). Foreign contamination is absent. X-ray Spectroscopic analysis helped to have better insights into coated powder distribution on the surface. Zn is represented as the red color being ample and is almost fully spread across the surface. While Ni represented by light yellow color is also spread fully along with some isle present. Cu represented by blue color is also spread but due to agglomeration it is present less uniformly eccentrically, and Ti and B represented by light blue and green respectively are also spread fully while some portions are present like an aisle. The Presence of Fe represented by Cyan color on the surface can be attributed due to surface diffusion from the substrate to the coating and the presence of pores having 998.0 nm size (Zhang et al., 2020). TiB2 has been found to possess a pseudogap between d-orbitals of Ti and p orbitals of B which helps it to form strong metallic and covalent bonds with other constituents of coating like Zn, Ni, Cu thereby increasing the cohesion strength of Zn-Ni-Cu -TiB2 on mild steel (Lotfi, 2010). Fig. 5 gives the X-ray elemental distribution of coating 2 on the specimen (Zn-Ni-Cu -TiB2 on mild steel).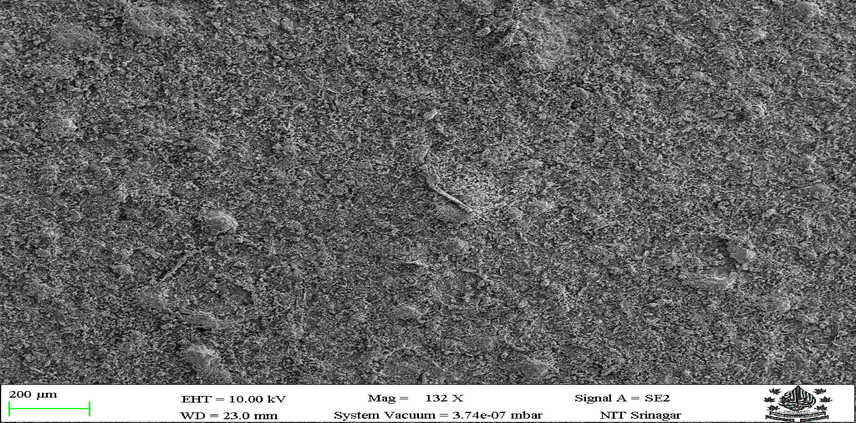
Shows an SEM image of coated (Zn-Ni-Cu-TiB2 on mild steel).
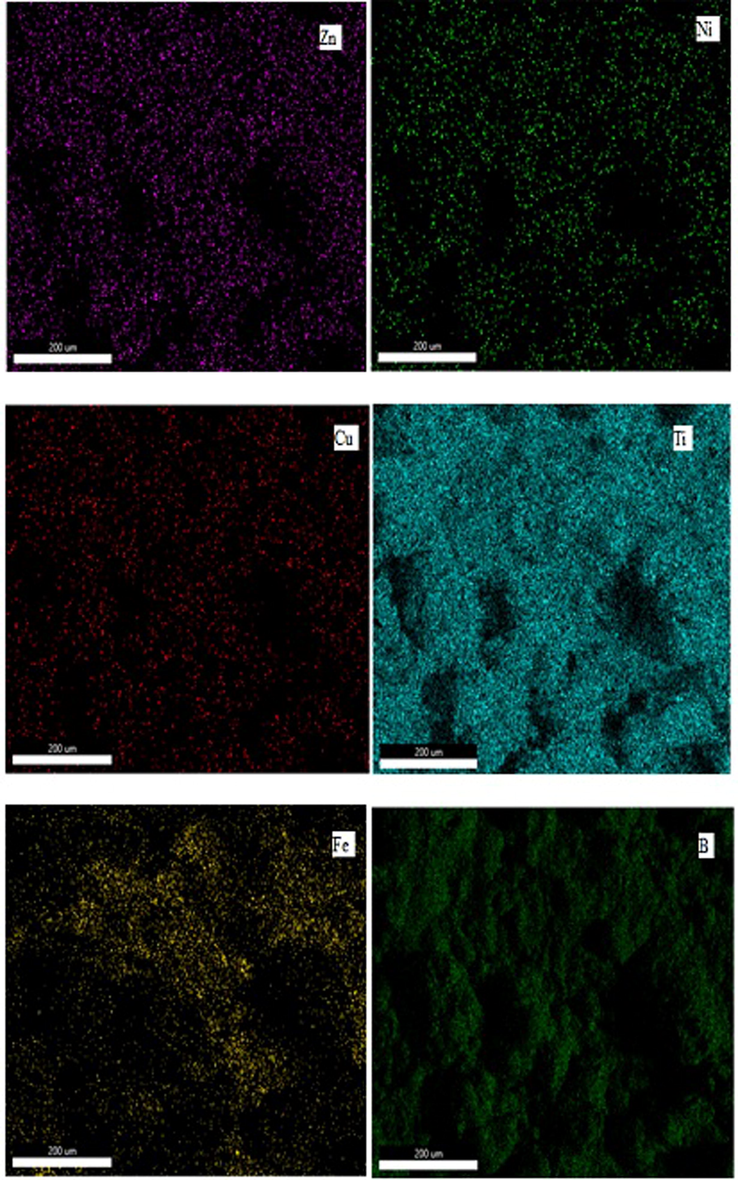
Shows the X-ray elemental distribution of constituent elements of Zn-Ni-Cu-TiB2 on mild steel.
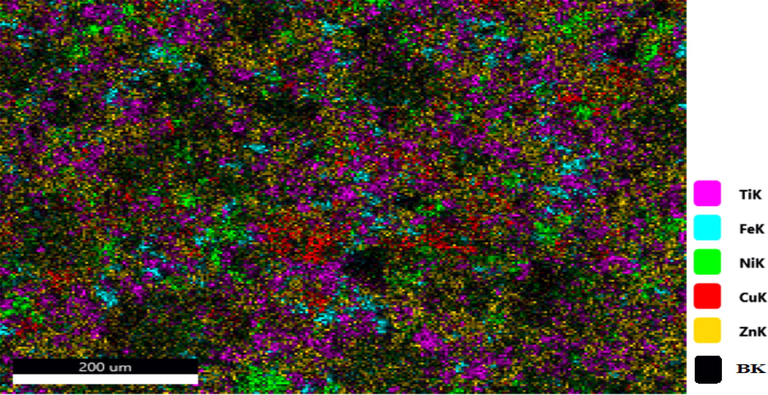
Shows the X-ray elemental distribution of constituent elements of Zn-Ni-Cu-TiB2 on mild steel.
4 Results and discussion
4.1 Wear test
A pin-on-disc reciprocating tribometer (R Tech universal Tribometer) was used for wear testing in accordance with the (ASTM G99-17) standard, and tests were conducted under dry sliding conditions. There were 39 discs, 13 in each group. The entire time, pins were made out of 100 Cr bearing steel, which has a tensile strength of 170 HB and a 2.5 mm diameter. The size of the specimen remained maintained throughout (25×25×3 mm). The test was conducted at 23°C the entire time. For testing, identical load conditions of 9, 18, 27, and 36 N were applied to specimens 1 (uncoated mild steel), 2 (Zn-Ni-Cu on mild steel), and 3 (Zn-Ni-Cu TiB2 on mild steel). Each test was repeated three times to ensure the lowest possible error, and as a result, mean values were taken as the final results. Using, mass loss was computed (LIBROR AEG 120) with a 0.0001 mg precision. The conditions for the tests were a constant, typical room temperature and humidity. SEM and EDS were used to evaluate the worn tracks. Table 3 lists the experimental parameters. Table No. 4 findings contains the wear results for 36 N.
S.No
Frequency(Hz)
Stroke (mm)
Time Duration (Hr)
Length(m)
Sliding velocity m/s
1
5
1
20
1000
5
S.No
Specimen
Mass Loss
(mg)Wear rate
(kg/m)Volume Loss
(mm3)
1
Uncoated mild steel
10.31
1.02 × 10⁻⁵
1.3131
2
Zn–Ni-Cu coating on mild steel
0.31
3.514 × 10⁻⁷
0.04721
3
Zn–Ni-Cu-TiB2 coating on mild steel
0.12
1.21 × 10⁻⁷
0.01411
ASTM G 99 procedure was followed, specimens were ultrasonically cleaned in ethanol at 25 °C and later dried. Mass loss of each specimen was measured using (SMIAZDU, LIBROR AEG-120) by comparing the mass change in the sample before and after completion of the test. For analyzing efficacious of various coatings, wear debris and wear tracks created during the tests were subjected to FEG-SEM (NOVA-NANO-SEM 430 Coupled to EDAX-TSL) and the results are given in Fig. 6. It is clear from figures and mass loss data of uncoated mild steel (specimen 1) has well-defined wear tracks and added wear debris even at a moderate load of 18 N, increasing its surface roughness and also the wear. While in specimen 2 (Zn –Ni-Cu on mild steel), wear tracks were mild and mass loss was less as compared to uncoated specimen 1 (uncoated mild steel) even at a maximum load of 36 N. The wear tracks and wear debris at lower loads were a little insignificant and minimal respectively. Little wear present may be because of the removal of a fine particle like Zn from the coating which acted as a third body abrasive between pin and disc surface, being Soft and less significant for causing any large wear at the interface. The EDX analysis of debris proves the greater presence of Zn hence ascertaining the reason. For specimen 3 (Zn–Ni-Cu-TiB2 on mild steel) the wear tracks observed were fewer and mass loss as compared to specimens 1 and 2 was very little even at 36 N load. During friction, TiB2 has been reported to lower the coefficient of friction and wear rate during wear tests (Das et al., 2018). TiB2 particles have been found to take the main pressure due to loading and subsequently prevent the abrasive particles from being released leading to a three-body abrasion state (Panich, 2007). Possibly due to TiB2 being hard and its particles being strongly adhered to its substrate and coating matrix (Zhang et al., 2020). The presence of TiB2 in debris may be due to oxidation of the interface surface lowering the ductility of TiB2 and making the surface near it brittle eventually detaching the hard particle. The presence of Zn in debris is also present as shown in EDX. Also, the room temperature is not enough to produce oxidative damage to the HVOF coating (Federici et al., 2017). Also according to Wu et al and G. Bolelli et al HVOF spray technique reported having high bonding strength as compared to the plasma coating process.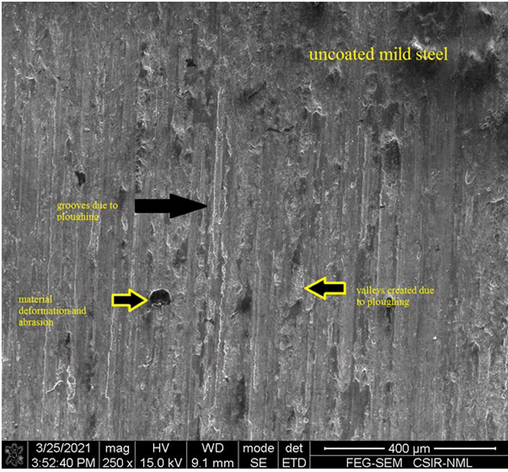
Shows the FEG-SEM images of specimens after pinning on disc tribotest. Fig. 6, (a) shows pin on disc test on uncoated mild steel specimen. (b) shows the pin on the disc test on Zn-Ni-Cu coated specimen. (c) shows pin on disc test on Zn-Ni-Cu-TiB2 coated specimen.
Volume loss was calculated using equation (1).
5 Coefficient of friction in uncoated and coated samples
The coefficient of friction of both uncoated and coated samples of mild steel was investigated at identical load conditions results are shown in Fig. 8. The wear test (pin on disc method) gave a thorough insight analysis of the pin and disc interface. the pin material having lesser hardness was removed easily and its particles acted as a third body abrasive hence lowering the coefficient of friction in the interface in both coated samples of Zn-Ni-Cu and Zn-Ni-Cu-TiB2 on mild steel compared to mild steel. At lower loads of 8 N, the coefficient of friction in uncoated mild steel is higher as compared to coated mild steel coefficient of friction of both coated samples. Also, the wear rate of uncoated mild steel samples is significantly higher as compared to both Zn-Ni-Cu on mild steel and Zn-Ni-Cu-TiB2 on mild steel.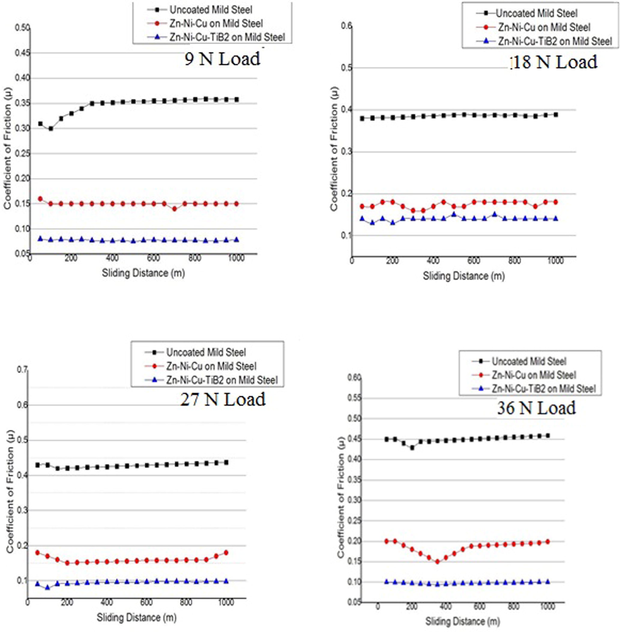
Shows the coefficient of friction versus sliding distance for uncoated/coated mild steel samples.
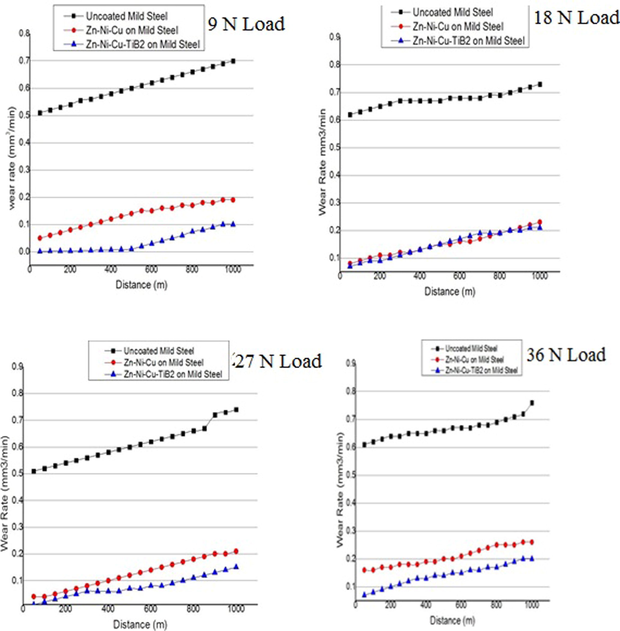
Shows wear rate versus sliding distance for uncoated/coated mild steel samples.
A consequence of both Zn-Ni-Cu and Zn-Ni-Cu-TiB2 on mild steel reduced the friction coefficient significantly as compared to uncoated mild steel hence helping us to understand the lower wear rate in coated samples as compared to uncoated mild steel under identical conditions. Lower coefficient of friction ≤ 0.25 for titanium alloys has been reported (Bolelli et al., 2015). Figs. 7, 8 shows the coefficient of friction and wear rates of all specimens during the tribology test. Fig. 9 shows 3 D profilometer images of specimens after pin on disc experiment at 32 N Load.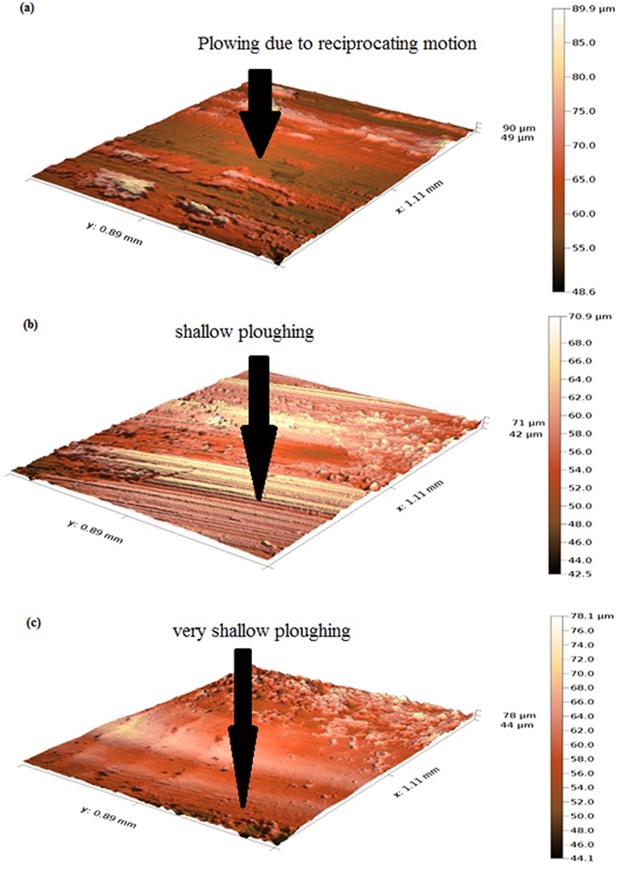
Shows 3D profilometer images of (a)uncoated mild steel, (b)Zn-Ni-Cu, and (c)Zn-Ni-Cu-TiB2 on mild steel after pin on disc experiment at 32 N load.
6 Surface roughness
The surface roughness of coating 1 (Zn-Ni-Cu on mild steel) and coating 2 (Zn -Ni-Cu -TiB2 on mild steel) was known using a surface roughness tester (3 D profilometer R Tech India) and the average surface roughness found for coating 1 was 3.1 Ra and for coating 2 as 3.16 Ra.
7 Hardness testing
The hardness of coatings was determined using the Vickers Micro Hardness testing machine (INNOVA TEST FALCON 500). For minimizing errors 15 indentation values were taken for a single sample and average determined results were obtained. It was observed for specimen 1 (Uncoated mild steel) the Vickers hardness was lesser compared to specimen 2 (Zn–Ni-Cu on mild steel) and specimen 3 (Zn–Ni-Cu-TiB2 on mild steel). For specimen 3 the average Vickers hardness was highest because of the presence of TiB2 which has been reported extensively to be hard, and its even distribution over the coated surface improves the hardness extensively. The increased hardness in both coated samples may be attributed due to rapid solidification during spray deposition leading to a fine and numerous grain structure boundaries which resist misplacement hence leading to harder surfaces to encounter (Meymian et al., 2020). Similar results of hardness and wear resistance improvement due to Ti and B have been reported (Meng et al., 2019). Results are shown in Table 5. The hardness decreases at higher loads in both coated and uncoated mild steel, which is attributed to high loads that leads to higher pressure(P = Load/Area) at the same contact area, hence big indent is formed at high loads leading to less hardness. However, the values of hardness at higher loads in coated and uncoated mild steel vary significantly.
Vickers Hardness value
Load (Gms)
Vickers Hardness value (HV)
Uncoated mild steel
500
363
1000
356
1500
341
2000
324
Coating 1 (Zn–Ni-Cu on mild steel)
500
561
1000
543
1500
490
2000
487
Coating 2 (Zn–Ni-Cu-TiB2 on mild steel)
500
701
1000
681
1500
643
2000
621
8 Scratch test
To determine the scratch resistance of the coating, the scratch test was performed for sliding wear conditions. For this purpose, an adhesion scratch tester (Du-Com instruments, India) was used having a diamond C indentor with having tip radius of 200 µm, a stroke length of 5 mm, and a contact Load rate of 2 N/mm, the scratch velocity of 0.1 mm/s. Normal load varied from 10 N to 40 N. The Scratch width of coating 1 (Zn-Ni-Cu on mild steel) was 110 µm. For coating 2 (Zn-Ni-Cu TiB2 on mild steel) it was 62 µm.while for uncoated mild steel it was 505 µm at 40 N Load. Fig. 10 shows the optical images of (a) uncoated mild steel at 10 N load,(b) Zn-Ni-Cu on mild steel at 40 N, and (c) Zn-Ni-Cu-TiB2 on mild steel at 40 N. Fig. 11 shows the traction force verses normal load for uncoated/coated specimens. The traction increases linearly for uncoated samples inferring higher friction. while for coated samples it remains constant after certain load inferring constant coefficient of friction reiterating that coating has a lubrication effect as well during rubbing action. The data values of the scratch test are shown in Table 6. Tensile cracks can be seen in optical micrographs of both coated samples as compared to mild steel inferring better surface adhesion of coating with substrate.Lower conformal cracks in coated samples also infer the same thing (Bolelli et al., 2015). Also, the traction force measured during the scratch test is significantly more in uncoated samples as compared to both coated samples reiterating lower friction encountered in the uncoated sample as compared to coated one.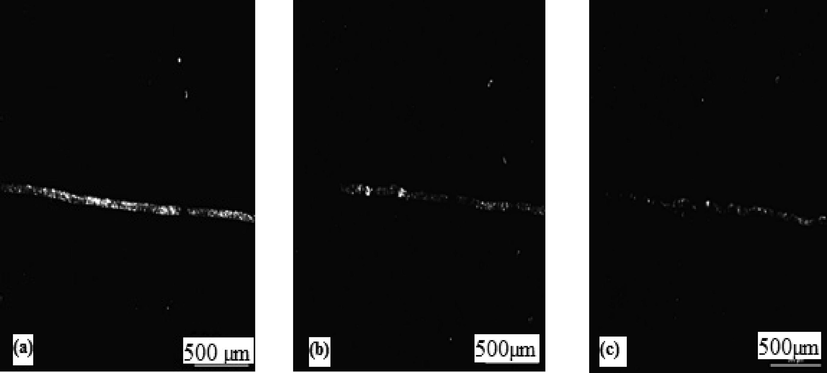
Shows the optical micrographs of the Scratch test at 40 N, 500 µm magnification. (a) uncoated mild steel,(b) Zn-Ni-Cu on mild steel, (c) Zn-Ni-Cu-TiB2 on mild steel.
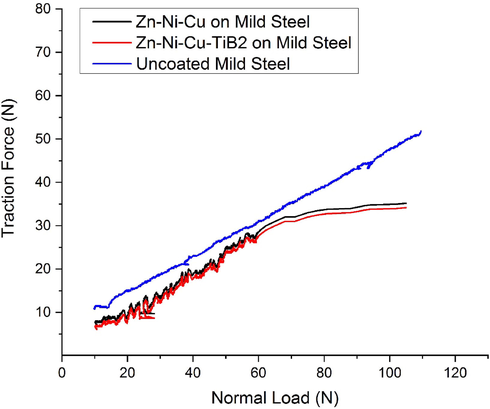
Shows traction force versus normal load for uncoated/coated samples.
Specimen
Load
(N)Depth of scar
µmWidth of scar
µm
Uncoated mild steel
10
4.41
184
20
5.12
244
30
7.55
452
40
11.31
503
Zn-Ni-Cu on mild steel
10
1.11
32.1
20
2.88
53.2
30
3.44
69.1
40
4.41
110.4
Zn-Ni-Cu-TiB2 on mild steel
10
0.83
22.1
20
1.21
31.1
30
2.02
40.1
40
3.13
62.1
9 Immersion cycle test of Coated/Uncoated mild steel in 0.2 M HCl
Mild steel is very prone to corrosion attack, the corroded mild steel parts are cleaned using HCl or H2SO4 to remove scales on the surface. However, the presence of SO4− and Cl− ions in these acids can further increase the rate of corrosion on the mild steel surface. Hence we tested coated mild steel samples in a 0.2 M HCl environment to ascertain the effectiveness of coatings (Panich, 2007). HCl was used as a corrosive medium because it is amply used in food processing industries and oil and natural gas industries for cleaning of mild steel equipment leading to corrosion of cleaned parts eventually. The size of the specimens was (1016 mm × 635 mm × 2.0 mm). This test was performed at 25 °C. Corrosion studies on mild steel have been undertaken in the past at various concentrations of HCl because it has been reported to be very corrosive to most metals and their alloys (Federici et al., 2017; Mikula et al., 2007). It was found that mild steel showed appreciable corrosion impregnation and mass loss at 0.5 M HCl. Considering these facts we tried to investigate the effectiveness of our two coatings (Zn -Ni-Cu) and (Zn-Ni-Cu-TiB2) on mild steel and compare its results with that of uncoated mild steel specimen. For this Coated Specimen 2 (Zn-Ni-Cu on mild steel), specimen 3 (Zn-Ni-Cu -TiB2 on mild steel), and specimen 1 uncoated mild steel of the same dimension was used. 0.5 M HCl was prepared and poured in equal quantities into beakers. Later on, specimens 1, 2, and 3 were weighed using (LIBROR AEG 120) and checked for any pores and cracks. A pH meter (P-100 Cole Parmer) was used to measure the pH of the solution (pH = 3). Later samples were put into beakers and removed every 7 days (1 6 8) Hrs. Cleaned with distilled water, dried, and later weighed. The sample solution was changed every 7 days with pH, being measured every 7 days. It was clear that corrosion was initiated within the first few minutes of immersion into 0.2 M HCl. However the rate varied significantly in uncoated mild steel specimens and it was clear that material particles could be seen floating in an uncoated mild steel beaker within a few hours after immersion, while the coated samples showed significant resistance to corrosion attack. The mass loss for specimen 1 uncoated mild steel was 4159 mg, specimen 2 (Zn-Ni-Cu On mild steel) at the end of the experiment was 523 mg and specimen 3 (Zn-Ni-Cu -TiB2 on mild steel) was 406 mg, and for at the end of 28 days (672) hrs. No protective black (Fe3O4) layer could be formed on an uncoated mild steel surface in an acidic medium which could save the underneath metal from further attack (Souza and Neville, 2005). one interesting accidental observation was made by placing uncoated mild steel directly over the 0.2 M HCl beaker having no physical contact between the two, the uncoated mild steel specimen developed corrosion after observation at 24 hrs. black and brown rust was present on the surface of the sample is very loosely bonded and was removed by gently blowing some air over the sample. Although the exact mechanism of this is not known nor reported by any literature review, it could be attributed due to the volatile vapors of 0.2 M HCl which could have initiated the rust in the specimen when not being in direct contact. The lower mass in specimen 2 is due to better surface adhesion with substrate and TiB2 being itself more resistant to corrosion thus helping improve the existing resistance of the metal coating. HVOF-coated Ni also has good corrosion-resistant behavior (Souza and Neville, 2005). Fig. 12 and Table 7 show the results of the test.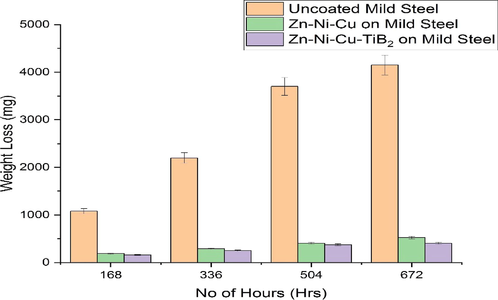
Shows weight loss results of uncoated/coated samples for 672 hrs in 0.5 M HCl solution.
Specimen No
Weight Loss (mg)
Cr (mpy)
Coating Efficiency %
Uncoated mild steel (Specimen 1)
41579
1.07
–
Coated Specimen (Zn-Ni-Cu on mild steel) specimen 2
521
0.131
72.1
Coated specimen (Zn-Ni-Cu-TiB2 on mild steel) specimen 3
405
0.103
77.6
Coatings have two types of corrosion protection mechanisms: (1) sacrificial barrier protection and (2) barrier effect protection. The sacrificial barrier effect is given by zinc, which interacts with Cl- and OH – ions to create products such as Zn(OH)2 and ZnCl2, as shown in equations (2), (3). These products prevent Cl− and OH− ions from propagating further into the interface, protecting the substrate from corrosion. Here it is to be noted that ZnOH2, and TiO2, act as a protective film and save the underlying substrate from corrosion attack The barrier effect is well provided by Cu, Ni, and TiB2 particles, which prevent the migration of Cl− and OH− ions into the interface. The lowest corrosion rate in Zn-Ni-Cu-TiB2 coated mild steel is preferably by the formation of TiO2 layer which is not formed in Zn-Ni-Cu on mild steel specimen. Chemical reactions taking place for the formation of various sacrificial products are given below.
9.1 Characterization of uncoated/coated samples after immersion cycle test in 0.2 m HCl
Uncoated samples along with coated samples (coating 1, Zn-Ni-Cu on mild steel), (coating 2, Zn-Ni-Cu-TiB2 on mild steel) were subjected to SEM/EDS analysis to infer the morphological changes undergone by the surfaces in 0.5 M HCl immersion. SEM (NOVA-NANO-SEM 430 Coupled to EDAX-TSL), it is clear from Fig. 11 that uncoated samples have undergone drastic changes on their surface, the mass loss has resulted in a plowing effect. The penetration is very deep into the surface. While on the other hand, both coating 1 and coating 2 samples have less surface penetration and the coating is still intact even after 28 days of testing. Fig. 13 gives a detailed analysis of SEM micrographs.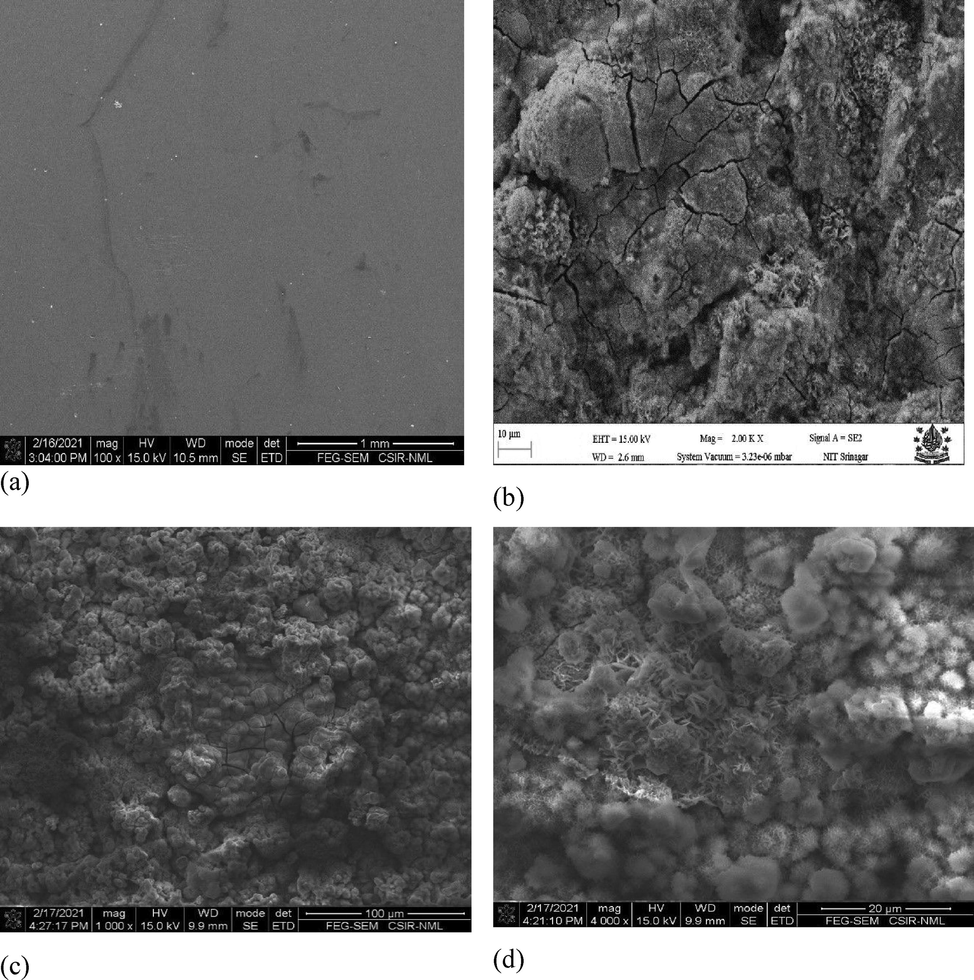
Shows the FESEM/FEG-SEM images of specimens before and after the 0.5 M HCl immersion test. Fig. 8 (a,b) shows uncoated mild steel surface before and after the 0.5 M HCl immersion cycle test.(c,d) shows Zn-Ni-Cu coated mild steel surface before and after 0.5 M HCl immersion cycle test. (e,f) shows Zn-Ni-Cu-TiB2 coated mild steel surface before and after 0.5 M HCl immersion cycle test.(g,h) shows uncoated mild surface at higher magnification after 0.5 M immersion cycle test.
Shows the FESEM/FEG-SEM images of specimens before and after the 0.5 M HCl immersion test. Fig. 8 (a,b) shows uncoated mild steel surface before and after the 0.5 M HCl immersion cycle test.(c,d) shows Zn-Ni-Cu coated mild steel surface before and after 0.5 M HCl immersion cycle test. (e,f) shows Zn-Ni-Cu-TiB2 coated mild steel surface before and after 0.5 M HCl immersion cycle test.(g,h) shows uncoated mild surface at higher magnification after 0.5 M immersion cycle test.
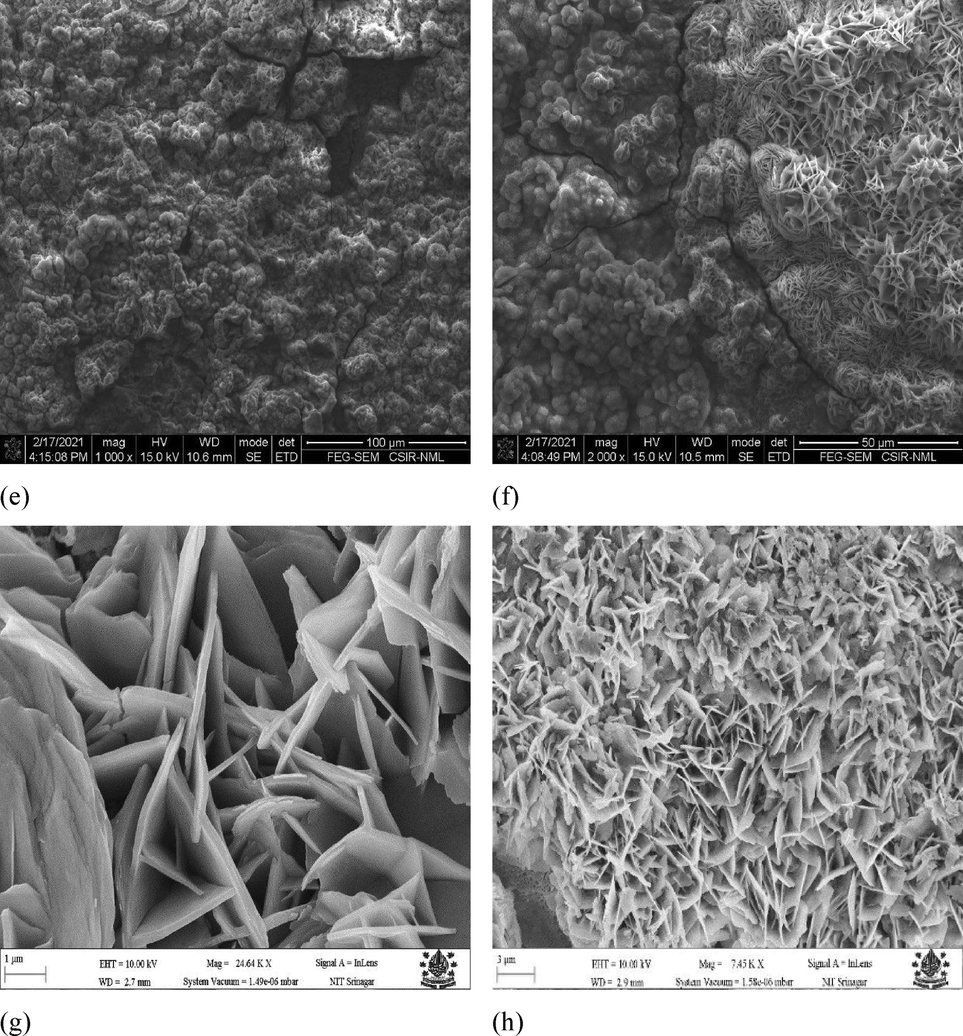
10 XRD analysis
For recognition of corrosion products formed during immersion cycle test (0.5 M HCl,672 hrs). The immersion cycle test samples were subjected to XRD analysis (Rigaku, smart lab). Quantifiable X-ray analysis designated the primary corrosion products were Goethite, Magnetite, and Lepidocrocite. In uncoated mild steel, all forms of rust(Goethite, magnetite, lepidocrocite) and in major proportions were found. Both Zn-Ni-Cu and Zn-Ni-Cu-TiB2 on mild steel showed little quantity and few kinds of rust only. A detailed Xrd analysis is given in Fig. 14(a,b,c).
Shows XRD analysis of (a)uncoated mild steel (b) Zn-Ni-Cu on mild steel (c) Zn-Ni-Cu-TiB2 on mild steel. L = Lepidicrocite, M = Magnetite,G = Geothite.
11 Electrochemical tests
11.1 Polarization/Potentiodynamic tests
Potentiodynamic tests were performed using a three-electrode configuration, Working electrode was used as specimen 1 (Uncoated mild steel), Specimen 2 (Zn-Ni-Cu on mild steel), Specimen 3 (Zn-Ni-Cu -TiB2 on mild steel). Reference Electrode used as saturated calomel electrode (SCE). Platinum is used as the counter electrode. The electrochemical cell was filled with about 250 ml of 0.2 M HCl solution. A settling time of 1 hr (60 mins) was adopted before the scan started (Mikula et al., 2007; Souza and Neville, 2005,). Starting scan potential was Ecrorr = − 250 M V SCE, having a scanning rate of 100 µV/S. Tests were performed at 25 °C. The size of the specimens was (101.6 cm × 63.5 cm × 2 mm) the actual working area of specimen subjected to test solution was (1.5 × 1.5 cm2). Each test was repeated thrice for the minimization of error. Potentiodynamic studies help us to understand the anodic and cathodic reactions taking place on the surface. It is clear from Fig. 15 that coatings have significantly reduced the dissolution of mild steel surfaces compared to uncoated mild steel. The mean average values obtained from the experiment are given in Table 8. Ni when alloyed to Zn has been reported to increase the corrosion resistance of Zinc coating on mild steel (Meymian et al., 2020; Ibrahim et al., 2020). Cu—Zn alloys have also been reported to have better corrosion resistance as compared to uncoated steel (Zavareh et al., 2018; Seifzadeh et al., 2016; Krishna et al., 2019; Singh et al., 2012). Fig. 15 shows Tafel's exploration of uncoated/coated samples. ZnO,NiO formed during the corrosion reaction has been reported to induce higher protection behaviour (Ibrahim et al., 2020).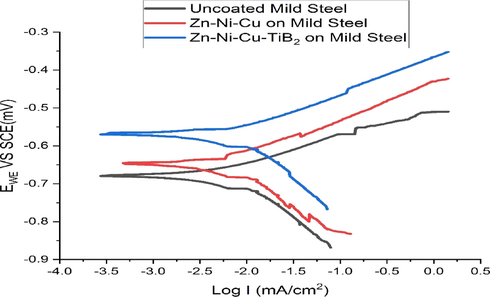
Shows the Tafel plot of uncoated/coated samples in 0.5 M HCl solution.
S.No
Specimen
Ecorr (mV)
Icorr (mA)
βa (mV dec−1)
βC (mV dec−1)
1
Uncoated mild steel
−0.68
0.5
211
195
2
Zn-Ni-Cu coated mild steel
−0.57
−1.11
171
351
3
Zn-Ni-Cu-TiB2 coated mild steel
−0.38
−1.21
164
426
11.2 Electrochemical impedance spectroscopy
EIS is a reliable technique to test the performance of coating on steel substrates at lower and high-frequency ranges. EIS helps to understand the capacitative and resistive behavior of coating in the corrosive medium. Figs. 16, 17 shows the Nyquist and bode plot for uncoated/coated surface in 0.5 M HCl medium respectively.0.5 M HCl was used as solution because the immersion cycle test were also evaluated in 0.5 M HCl, this would help us correlate the analysis in standard manner. The values obtained during the EIS test are given in Table 9. The equivalent Randles circuit is shown in Fig. 18, where.
RS = Solution Resistance being offered by the electrolyte.
Rct = charge transfer resistance being offered by the uncoated/coated surface.
CPE = constant phase element being used in place of double-layer capacitance because CPE takes into account the surface roughness and porosity of the coating. It allows the coating to exhibit both resistive and capacitive behavior based upon microstructural behavior.
CPE is obtained using equation (6)
A = Magnitude of CPE. (µF.cm2).
ω = Angular frequency of sine wave modulation (rad/s).
i2 = −1 (imaginary number).
n = empirical exponent (0 ≤ n ≤ 1) (takes into account deviation from ideal capacitative behavior).
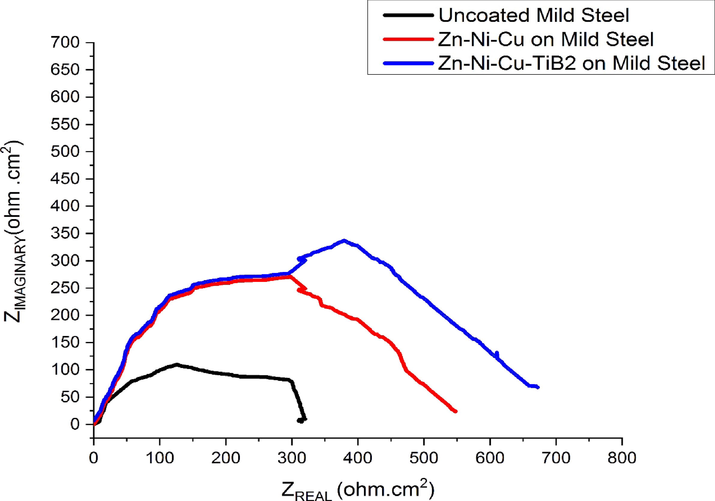
- Shows the Nyquist Plot of Uncoated/Coated surfaces in 0.5 M HCl.
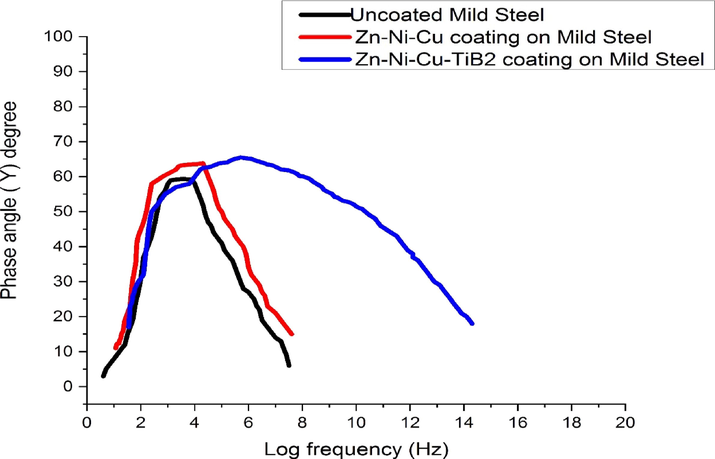
- Shows the Bode Plot of Uncoated/Coated surfaces in 0.5 M HCl.
| S.No | Sample | RS(Ω.cm2) | Rct (Ω.cm2) | n | CPE (µF.cm2) |
|---|---|---|---|---|---|
| 1 | Uncoated mild steel | 4.36 ± 0.02 | 50.0 | 0.756 ± 0.002 | 485.3 |
| 2 | Zn-Ni-Cu coating on mild steel | 4.51 ± 0.02 | 253.1 | 0.827 ± 0.021 | 315.2 |
| 3 | Zn-Ni-Cu-TiB2 coating on mild steel | 4.49 ± 0.01 | 320.4 | 0.910 ± 0.001 | 108.6 |
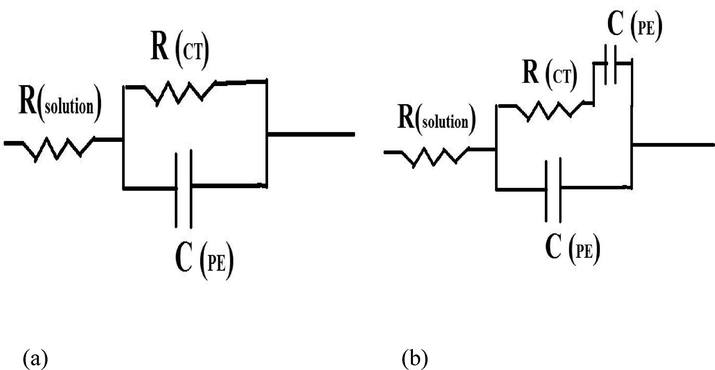
- Shows an Equivalent circuit (EIS) for (a) Uncoated mild steel in 0.5 M HCl solution and (b) Zn-Ni-Cu and Zn-Ni-Cu-TiB2 on mild Steel in 0.5 M HCl solution.
Rct value increase shows that resistance in coated surface for charge transfer is much higher as compared to uncoated reiterating the fact that coating has effectively prevented Cl−1 ions to enter inside and initiate the corrosion. A maximum Rct value of 320.4 (Ω.cm2) for Zn-Ni-Cu-TiB2 coating was observed suggesting a well-developed oxide layer providing a barrier effect (Mishra et al., 2013; Ammal et al., 2018; Storozhenko et al., 2017). Fig. 16 shows the semicircular nature of both coated curves at lower and high-frequency regions. Minimum CPE values for both coated surfaces also suggest that the barrier effect is effectively being provided by the coating possibly because of the formation of a protective layer of Zn(OH)2, TiO2 on the surface of the coating (Orubite-Okorosaye et al., 2007; Noor and Al-Moubaraki, 2008; Seidu and Kutelu, 2013). The mechanism of corrosion occurring on the coated surface is because of ionic charge movement. The impressed voltage across the interface leads to storage of charge and later aligning that charge across the interface leading to corrosion (Moretti et al., 2013; Bolelli et al., 2015). The maximum impedance of uncoated mild steel is 100 (Ω.cm2), while for Zn-Ni-Cu on mild steel maximum impedance value is 275 (Ω.cm2), for Zn-Ni-Cu-TiB2 on mild steel its value is maximum, 350 (Ω.cm2). Bode plots shown in Fig. 17 indicate that both coated surfaces have maximum phase angle at medium frequency range, Zn-Ni-Cu on mild steel has Ø value of 620 and Zn-Ni-Cu-TiB2 on mild steel has Ø value of 650 inferring corrosion product film is stable and intact. Phase angle decreases with increasing frequency.Zn-Ni-Cu and Zn-Ni-Cu-TiB2 coatings on mild steel have been found to be corrosion resistant in alkaline medium as well (3.5 %NaCl solution) (Ali and Ahmad, 2022a,b; Shet et al., 2021; Bhat et al., 2021; Bhat et al., 2020; Bhat et al., 2021; Bhat et al., 2020).
ECM modeling software uses EIS data and analyses it for circuit elements. Fig. 18(a) shows ECM results for uncoated mild steel using the above EIS data. Fig. 18(b) shows ECM results for coated mild steel. For coated samples having imperfections and pores RCT and CPE are in series.
12 Conclusion
The Zn-Ni-Cu and Zn-Ni-Cu-TiB2 coatings were successfully surface coated on a mild steel substrate using high-Velocity oxy-fuel (HVOF) technique. The outcome of the two coatings on the microhardness variation, wear behavior, adhesion strength with the substrate, and corrosion resistance in an acidic medium are summarized below.
-
The Zn-Ni-Cu and Zn-Ni-Cu-TiB2 coatings adequately adhered to the substrate because Ni acted as an effective binder for the coatings with the substrate. The scratch test proved that delamination of the coated samples at high loads of 40 N was very insignificant compared to uncoated mild steel specimens.
-
The microhardness of Zn-Ni-Cu coated mild steel increased to 561 HV, and Zn-Ni-Cu-TiB2 coated mild steel increased to 702 HV compared to the 365 HV microhardness value in uncoated mild steel.
-
The Zn-Ni-Cu and Zn-Ni-Cu-TiB2 coatings on mild steel improved the wear resistance of mild steel. The SEM images confirmed that wear tracks and plowing, grooving, and wear debris in coated samples were minimal compared to uncoated mild steel even at high load/ high contact pressure.
-
The Zn-Ni-Cu and Zn-Ni-Cu-TiB2 coatings showed significant corrosion resistance in 0.5MHCl following an immersion cycle test for 28 days (672 hrs). The weight loss for Zn-Ni-Cu coated mild steel was 521 mg, and Zn-Ni-Cu-TiB2 coated mild steel was 405 mg, compared to an uncoated mild steel weight loss of 4157 mg. Hence such coatings can be used to withstand highly acidic corrosive environments for extended periods.
-
XRD analysis helped to identify rust formed over the surface of uncoated/coated mild steel. The analysis confirmed the performance of both coatings in an acidic medium.
-
Zn-Ni-Cu and Zn-Ni-Cu-TiB2 coatings on mild steel performed well in the Tafel/EIS test in 0.2 M HCl medium. The Ecorr = −0.57 Values in Zn-Ni-Cu coated mild steel, Ecorr = −0.38 m V value in Zn-Ni-Cu-TiB2 coated mild steel is higher as compared to Ecorr = −0.68 m V in uncoated mild steel. The Icorr values of the coated samples were significantly low compared to uncoated samples indicating high polarization resistance of the coatings to the corrosion medium.
Acknowledgment
The authors would like to thank Dr. L.C.Pathak, chief scientist, AMP division, NML Jamshedpur for allowing us to use equipment/facilities in his laboratory. The authors would also like to show gratitude to Director NML, Jamshedpur for allowing us to work at National Metallurgical Laboratory Jamshedpur.
Declaration of Competing Interest
The authors declare that they have no known competing financial interests or personal relationships that could have appeared to influence the work reported in this paper.
References
- Corrosion behaviour OF HVOF deposited Zn–Ni–Cu and Zn–Ni–Cu–TiB2 coatings on mild steel. Corros. Rev. 2022
- [CrossRef] [Google Scholar]
- Erosion Behavior of Zn-Ni-Cu and Zn-Ni-Cu-TiB2 Coated Mild Steel. J. Mater. Eng. Perform. 2022
- [CrossRef] [Google Scholar]
- Effective inhibition of mild steel corrosion in hydrochloric acid using EBIMOT, a 1, 3, 4-oxadiazole derivative bearing a 2-ethylbenzimidazole moiety: Electro analytical, computational and kinetic studies. Egypt. J. Pet.. 2018;27(4):823-833.
- [Google Scholar]
- Electrochemical behaviour and analysis of Zn and Zn–Ni alloy anti-corrosive coatings deposited from citrate baths. RSC Adv.. 2018;8(51):28861-28873.
- [Google Scholar]
- Electroplating of Zn-Ni Alloy Coating on Mild Steel and Its Electrochemical Studies. JMEPEG ASM Int.. 2021;30(11):8188-8195.
- [CrossRef] [Google Scholar]
- Compositionally Modulated Multilayered Zn-Co Deposits for Better Corrosion Resistance. JMEPEG ASM International. 2022;58(1):99-108.
- [Google Scholar]
- Development of Corrosion Resistant Zn-Ni-TiO2 Composite Coatings. Anal. Bioanal. Electrochem.12 (4):569-579.
- [Google Scholar]
- Zn-Ni compositionally modulated multilayered alloy coatings for improved corrosion resistance. Surf. Eng.. 2021;37(6):755-763.
- [Google Scholar]
- Tribology of HVOF-and HVAF-sprayed WC–10Co4Cr hardmetal coatings: A comparative assessment. Surf. Coat. Technol.. 2015;265:125-144.
- [Google Scholar]
- HVOF sprayed diamond reinforced nano-structured bronze coatings. J. Alloy. Compd.. 2018;746:361-369.
- [Google Scholar]
- Inhibitive and adsorption properties of ethanol extract of Colocasia esculenta leaves for the corrosion of mild steel in H2SO4. International Journal of Physical Sciences. 2009;4(4):165-171.
- [Google Scholar]
- Pin-on-disc study of a friction material dry sliding against HVOF coated discs at room temperature and 300 C. Tribol. Int.. 2017;115:89-99.
- [Google Scholar]
- Enhanced corrosion protection of epoxy/ZnO-NiO nanocomposite coatings on steel. Coatings. 2020;10(8):783.
- [Google Scholar]
- Strategies for corrosion protection of non-ferrous metals and alloys through surface engineering. Mater. Today:. Proc.. 2019;15:145-154.
- [Google Scholar]
- Elevated temperature oxidation behavior of HVOF sprayed TiB2 cermet coating. Trans. Nonferrous Met. Soc. Chin.. 2010;20(2):243-247.
- [Google Scholar]
- Friction and wear properties of TiN-TiB2-Ni based composite coatings by argon arc cladding technology. Surf. Coat. Technol.. 2019;374:437-447.
- [Google Scholar]
- Fabrication and characterization of bimetallic nickel-molybdenum nano-coatings for mild steel corrosion protection in 3.5% NaCl solution. Colloids Surf A Physicochem. Eng. Asp. 2020;593:124617.
- [Google Scholar]
- Mechanical properties of superhard TiB2 coatings prepared by DC magnetron sputtering. Vacuum. 2007;82(2):278-281.
- [Google Scholar]
- Erosion–corrosion performance of NiCrAlY coating produced by plasma spray process in a coal-fired thermal power plant. Surf. Coat. Technol.. 2013;216:23-34.
- [Google Scholar]
- Corrosion inhibition of the mild steel in 0.5 M HCl by 2-butyl-hexahydropyrrolo [1, 2-b][1, 2] oxazole. Corros. Sci.. 2013;76:206-218.
- [Google Scholar]
- Corrosion behavior of mild steel in hydrochloric acid solutions. Int. J. Electrochem. Sci. 2008;3(1):806-818.
- [Google Scholar]
- Synergistic effect of potassium iodide on corrosion inhibition of mild steel in HCl medium by extracts of Nypa fruticans’ Wurmb. J. Appl. Sci. Environ. Manag.. 2007;11(2)
- [Google Scholar]
- Panich, N., 2007. Fabrication, Characterisation and Property Modelling of TiB2 Based Nanostructured Coatings.
- Multilayered Zn-Ni alloy coatings for better corrosion protection of mild steel. Eng. Sci. Technol. Int. J.. 2017;20(3):1227-1232.
- [Google Scholar]
- Seidu, S.O., Kutelu, B.J., 2013. Effect of heat treatments on corrosion of welded low-carbon steel in acid and salt environments.
- 5-CM-Salophen Schiff base as an effective inhibitor for corrosion of mild steel in 0.5 M HCl. Chem. Eng. Commun.. 2016;203(10):1279-1287.
- [Google Scholar]
- Development and optimization of Zn-Ni-TiO2 composite coating, assessment of its corrosion resistance and antimicrobial activity. Appl. Nanosci.. 2021;11(9):2469-2477.
- [Google Scholar]
- Performance of HVOF sprayed NiCr and Stellite-6 coatings under pin on disc wear testing. In: Materials science forum. Vol vol. 701. Trans Tech Publications Ltd.; 2012. p. :21-29.
- [Google Scholar]
- Corrosion and synergy in a WCCoCr HVOF thermal spray coating—understanding their role in erosion–corrosion degradation. Wear. 2005;259(1–6):171-180.
- [Google Scholar]
- Some comments on mapping the combined effects of slurry concentration, impact velocity and electrochemical potential on the erosion–corrosion of WC/Co–Cr coatings. Wear. 2008;264(9–10):826-837.
- [Google Scholar]
- Effect of the structure of TiB2–(Fe–Mo) plasma coatings on mechanical and tribotechnical properties. Powder Metall. Met. Ceram.. 2017;56(1):60-69.
- [Google Scholar]
- Elevated temperature erosion–corrosion of thermal sprayed coatings in chlorine containing environments. Wear. 2002;252(7–8):586-594.
- [Google Scholar]
- Analysis of corrosion protection behavior of Al2O3-TiO2 oxide ceramic coating on carbon steel pipes for petroleum industry. Ceram. Int.. 2018;44(6):5967-5975.
- [Google Scholar]
- Effects of rare earth elements on the microstructure and wear properties of TiB2 reinforced aluminum matrix composite coatings: Experiments and first principles calculations. Appl. Surf. Sci.. 2020;530:147051
- [Google Scholar]
Appendix A
Supplementary material
Supplementary data to this article can be found online at https://doi.org/10.1016/j.arabjc.2023.104648.
Appendix A
Supplementary material
The following are the Supplementary data to this article:Supplementary data 1
Supplementary data 1
Supplementary data 2
Supplementary data 2
Supplementary data 3
Supplementary data 3
Supplementary data 4
Supplementary data 4
Supplementary data 5
Supplementary data 5
Supplementary data 6
Supplementary data 6
Supplementary data 7
Supplementary data 7
Supplementary data 8
Supplementary data 8
Supplementary data 9
Supplementary data 9
Supplementary data 10
Supplementary data 10
Supplementary data 11
Supplementary data 11
Supplementary data 12
Supplementary data 12
Supplementary data 13
Supplementary data 13


