Translate this page into:
Two-stage reaction rates in transesterification of palm oil with methanol catalysed by anion-exchange resin with tetrahydrofuran as a co-solvent
⁎Corresponding author. palang.b@chula.ac.th (Palang Bumroongsakulsawat)
-
Received: ,
Accepted: ,
This article was originally published by Elsevier and was migrated to Scientific Scholar after the change of Publisher.
Peer review under responsibility of King Saud University.
Abstract
Abstract
Several heterogeneous catalysts have been proposed as recoverable catalysts for transesterification in place of homogeneous hydroxide or methoxide. Anion-exchange resin is a potential recoverable and reusable catalyst but its industrial use is still barred by its low catalytic activity. Transesterification of refined palm oil with methanol catalysed by anion-exchange resin was studied. A phenomenon limiting the reaction rates was discovered and is presented. Two types of anion-exchange resins were used as the catalysts: dense IRA402 and macroporous A26. With IRA402, an oil conversion of only 6.1 % was obtained from 4 h transesterification at 60 °C with a methanol-to-oil molar ratio of 9.5:1 and 4 cm3 resin per 42 cm3 reaction mixture. Severe mass transfer resistance in this three-phase system appeared to be the limiting factor. Addition of tetrahydrofuran (THF) as a co-solvent helped form a single liquid phase. The oil conversion was improved to 19.3 %. The reaction between oil and adsorbed methoxide at resin’s ion-exchange sites seemed to be the rate-determining step. When A26 was used, the rate of FAME production was boosted due to the porous nature of the resin. Nevertheless, the reaction rate fell sharply after a while into a slower second stage. The formation of a secondary liquid phae in resin pores triggered by glycerol generation was proposed as the cause of this drop in the reaction rate. A higher oil conversion of 63.4 % was obtained. Diluting the reaction mixture with more THF eliminated the slower second stage and sustained the firststage’s faster reaction rate. An oil conversion of 84.7 % was achieved from 3 h transesterification. A finite-volume model was developed to simulate the reaction and internal mass transport in A26 resin beads. The proposed secondary liquid phase formation and a branching pore structure in resin beads were required in the model to reproduce experimental data. The findings suggested improvement directions for anion-exchange resin as a catalyst for transesterification.
Keywords
Biodiesel
FAME
THF
Co-solvent
Mass transport
Nomenclature
-
specific surface area of a resin [length2 · mass-1]
-
peak area of species i from a chromatogram [arbitrary]
-
peak area of the internal standard from a chromatogram [arbitrary]
-
molar concentration of species i [(amount of substance) · length-3]
-
total molar concentration of all species [(amount of substance) · length-3]
-
i-j pair diffusivity [length2 · time-1]
-
i-j pair diffusivity at infinite dilution of i [length2 · time-1]
-
effective i-j pair diffusivity in resin beads [length2 · time-1]
-
fraction of accessible pore volume behaving as branch channels [dimensionless]
-
i-j pair binary interaction parameter [dimensionless]
-
molar diffusion flux of species i [(amount of substance) · length-2 · time-1]
-
rate constant for reaction occurring in resin beads in the forward direction [time-1]
-
rate constant for reaction occurring at the outer surfaces of resin beads in the forward direction [length · time-1]
-
rate constant for reaction occurring at true resin surfaces in the forward direction [length · time-1]
-
characteristic length for mass transport in branch channels [length]
-
mass of species i [mass]
-
mass of the internal standard added to a sample [mass]
-
mass of a sample [mass]
-
molar mass of species i [mass · (amount of substance)-1]
-
number of moles of species i [amount of substance]
-
molar flux of species i [(amount of substance) · length-2 · time-1]
-
total molar flux of all species [(amount of substance) · length-2 · time-1]
-
exchange capacity of a resin [(amount of substance) · length-3]
-
rate of generation or consumption of species i per resin bead volume [(amount of substance) · length-3 · time-1]
-
rate of generation or consumption of species i per geometric outer surface area of resin beads [(amount of substance) · length-2 · time-1]
-
radius of a resin bead [length]
-
ratio of the true external catalytic surface area to the geometric external surface area of a resin bead assumed to be perfectly spherical [dimensionless]
-
time [time]
-
temperature [temperature]
-
specific pore volume [length3 · mass-1]
-
molar volume of solution [length3 · (amount of substance)-1]
-
molar volume of pure species i [length3 · (amount of substance)-1]
-
volume of reaction mixture [length3]
-
resin bed volume [length3]
-
molar liquid volume of species i at its normal boiling temperature [length3 · (amount of substance)-1]
-
mass fraction of species i [dimensionless]
-
mole fraction of species i [dimensionless]
-
relative basic site content of a resin [dimensionless]
-
radial distance in a spherical coordinate system [length]
-
void fraction in a resin bead [dimensionless]
-
dynamic viscosity of solution [mass · length-1 · time-1]
-
arbitrary factor [dimensionless]
-
tortuosity [dimensionless]
-
stoichiometric coefficient of species i in a chemical reaction [dimensionless]
-
submerged-bed density of a resin [mass · length-3]
-
particle density of a resin [mass · length-3]
-
association parameter of species i [dimensionless]
Symbols
- bc
-
property in a branch channel
- bulk
-
property in the bulk of reaction mixture
- rc
-
property in a radial channel
Additional descriptive symbol subscripts
- SSE
-
error sum of squares
- SSR
-
regression sum of squares
- SSTR
-
treatment sum of squares (‘Treatment’ is a traditional term in statistics for a set of experimental conditions.)
- SST
-
total sum of squares
- SSPE
-
pure-error sum of squares
- SSLOF
-
lack-of-fit sum of squares
- MSE
-
error mean square
- MSR
-
regression mean square
- MSTR
-
treatment mean square
- MST
-
total mean square
- MSPE
-
pure-error mean square
- MSLOF
-
lack-of-fit mean square
- R2
-
coefficient of determination
Statistical symbols
- FAME
-
fatty acid methyl ester
- GLY
-
glycerol
- MET
-
methanol
- TG
-
triglyceride
- THF
-
tetrahydrofuran
Abbreviations
1 Introduction
Biodiesel, or more technically fatty acid methyl ester (FAME), is produced by transesterification of palm oil with methanol. Conventional processes use NaOH, KOH, NaOCH3, or KOCH3 as homogeneous catalysts, which are characterised by fast kinetics. However, the removal of these catalysts from reaction mixture is difficult. In practice, they are neutralised into salts and removed as thick slurry. As a result, consumption of acid and handling of the generated salts are unavoidable and the catalysts are destroyed after a single use.
These problems have led to many studies of heterogeneous catalysts for transesterification. The most prominent type is probably CaO-based catalysts. CaO is abundant in nature and the catalyst can even be derived from eggshell (Ngaosuwan et al., 2021). Interestingly, the presence of a small amount of water increases the rate of transesterification with CaO (Anantapinitwatna et al., 2021). Ultrasound boosts the rate of transesterification with CaO as opposed to mechanical stirring (Choedkiatsakul et al., 2013; Anantapinitwatna et al., 2021).
Anion-exchange resin is a less common catalyst for transesterification of oil/fat with alcohol. Alkaline anions can be adsorbed at resin’s ion exchange sites to catalyse the reaction. Ion-exchange resins are commonly available in the form of spherical beads of 0.1 mm to 1 mm in diameter. Resin’s relatively large size should allow easier handling and removal from reaction mixture. Reported transesterification catalysed by anion-exchange resin is of oil with methanol (Sabudak and Yildiz, 2010; Li et al., 2012; Ren et al., 2012; Jamal et al., 2015) and also with ethanol (Shibasaki-Kitakawa et al., 2007; Jaya et al., 2015; Keneni et al., 2020; Ferreira et al., 2021). Varying oil conversions including those approaching 100 % can be achieved, depending on reaction conditions. Proper treatment of used resin can restore most of its initial catalytic activity (Shibasaki-Kitakawa et al., 2007). More advanced uses of ion-exchange resin in transesterification are also reported. Microwave-assisted transesterification with ion-exchange resin resulted in boosted FAME generation rates (Li et al., 2012). Transesterification of canola oil with methanol and ethanol can occur with alkaline species electro-generated at electrodes modified with ion-exchange resin (Allioux et al., 2017). Cation-exchange resin is preferred for oil containing significant amounts of free fatty acid (FFA) such as waste or used cooking oil (Gómez-Trejo-López et al., 2022; Lin et al., 2022; Roslan et al., 2022).
The low miscibility of oil and alcohol is a classic problem in transesterification with both homogeneous and heterogeneous catalysts. The majority of oil and methanol reside in two different liquid phases. Various means can be used to disperse one in the other to improve mass transfer. In parallel with conventional stirring, co-solvents can be added to reaction mixture to increase the miscibility of oil and alcohol or even to form a single liquid phase. Co-solvents commonly used are n-hexane (Ren et al., 2012), acetone (Thanh et al., 2013; Ngaosuwan et al., 2023), and tetrahydrofuran (THF) (Ren et al., 2012; Ngaosuwan et al., 2023).
Following the gradual ban on the use of diesel engines, biodiesel demand would likely dwindle. Nonetheless, transesterification would still be viable for the production of other chemical products such as green solvents (Hu et al., 2004; da Roza Costa et al., 2017). Compared to ethyl, propyl, and butyl esters, methyl esters produced by transesterification appear to exhibit the highest solvent power measured in the kauri-butanol value (KBV), which is a solvent’s ability to dissolve kauri gum (Hu et al., 2004). Nevertheless, the production of methyl esters exhibits probably the slowest reaction rates owing to the lowest miscibility of oil and methanol as opposed to higher alcohols.
Because FAME is preferable for both biodiesel and green solvents, in this work we studied transesterification of refined palm oil with methanol. As the kinetics of transesterification with homogeneous catalysts has already been widely studied (Issariyakul and Dalai, 2012; Reyero et al., 2015; Roosta and Sabzpooshan, 2016), whereas the works with ion-exchange resins, especially with co-solvents added, are relatively scarce, the use of anion-exchange resin as a heterogeneous catalyst for transesterification was explored and is presented. Two types of anion-exchange resins: dense IRA402 and macroporous A26 were used in this work. THF was added in some experiments as a co-solvent to increase the miscibility of oil and methanol. We also investigated the kinetics and mass transport of the reaction catalysed by the two resins with mathematical modelling.
2 Materials and methods
2.1 Transesterification
Transesterification was performed in a jacketed glass reactor with a Graham (spiral) condenser equipped on the top. The jacket was supplied with water from a heated water bath. The condenser was cooled by running tap water to condense and retain methanol and tetrahydrofuran (THF) evaporated during experiments. The inner diameter of the inner compartment for reaction mixture was 35 mm. The reaction temperature was maintained at 60 °C and monitored directly with a thermometer inserted into the reactor through a dedicated port. A 26 mm magnetic stir bar was used to agitate the reaction mixture at 1500 rpm throughout the specified reaction time. During agitation, a vortex formed in the reaction mixture and appeared to be more stable at higher agitation speeds. Hence, the maximum agitation speed of 1500 rpm was used.
Refined palm oil (Morakot) was obtained from local suppliers. Thermo Fisher’s analytical reagent methanol and Merck’s ACS reagent tetrahydrofuran (THF) were used in our experiments. Table 1 shows the amounts of chemicals used in a standard transesterification experiment at a methanol-to-oil molar ratio of 9.5 to 1.
Chemicals
Without THF
With THF
Refined palm oil
27.1 g
13.9 g
Methanol
12.3 cm3
6.3 cm3
THF
–
20.8 cm3
These amounts resulted in a total liquid volume of ca 42 cm3, which was kept to maintain the hydrodynamic characteristics of the reaction mixture during agitation. 4 cm3 of pre-treated anion-exchange resin was added as a catalyst. The amounts of resin were measured in bed volume of resin in methanol instead of resin mass to avoid uncertainties arising from the liquid content of resin.
In some experiments with THF added as a co-solvent, different amounts of oil and methanol were used to study the effects of their concentrations while the amounts of THF were also changed to maintain the total liquid volume; the methanol-to-oil molar ratios were not maintained in these experiments. Similarly, different amounts of resin were used in some experiments to observe their effects.
Samples were not collected at intervals. Instead, individual experiments were conducted specifically for the specified reaction durations. At the end of a transesterification experiment, the agitation was stopped and 20 cm3 of the reaction mixture without resin was transferred to another jacketed vessel for removal of methanol and THF by evaporation at 75 °C for 2 h. The remaining liquid was centrifuged for 2 min to aid phase separation. Only the oily phase was sampled for analysis.
The amount of fatty acid methyl ester (FAME) generated in an experiment was determined by gas chromatography (GC) equipped with a DB-WAX column and a flame ionisation detector (FID). The EN 14103 method was followed. 0.05 g of methyl heptadecanoate was added as an internal standard to 0.25 g of a sample. This solution was diluted with 5 cm3 of n-heptane. 1 μl of this diluted sample was injected into the GC. The injector temperature was set at 150 °C. The temperature of the oven was set to start and held at 150 °C for 5 min. Then, it was increased to and held at 190 °C for 5 min with a ramp rate of 3 °C min−1. Finally, the temperature was raised to and held at 220 °C for 5 min with the same ramp rate. The FAME content by mass of the sample, wFAME, was calculated by the following formula:
2.2 Resin preparation
Two types of anion-exchange resins were used in experiments: AmberLiteTM IRA402 Cl and AmberLystTM A26 OH. The former was supplied in the chloride form while the latter was in the hydroxide form. In terms of morphology, IRA402 is a gel-type, dense resin, whereas A26 is macroporous. With IRA402, reactions were assumed to occur mainly on the external surfaces of resin beads. Results from experiments conducted with IRA402 were studied for the intrinsic kinetics over resin surfaces in the approximate absence of pore diffusion and relatively free from external mass transfer limitations. A26 is a macroporous resin and was used to achieve faster overall reaction rates.
Hydroxide-form IRA402 was prepared by gently stirring 4 cm3 of the resin in 32 cm3 of 1.5 M aqueous solution of NaOH for 30 min. The resin was filtered and washed in methanol a few times until the pH of the washing methanol became stable before use in a transesterification experiment, or in DI water also until the pH of the washing water became stable before further treatment required in some experiments. Washing the resin removed species that were not adsorbed by ion exchange but simply adhered to resin surfaces, especially sodium hydroxide, which is a homogeneous catalyst for transesterification. Washing with methanol in excess also converted all hydroxide into methoxide according to this equilibrium reaction:
2.3 Removal of resins’ basic site contents
In some experiments, the resins’ basic site contents were removed partially by predetermined amounts. A calculated amount of 37 % HCl was diluted in DI water to 32 cm3. Hydroxide-form IRA402 prepared beforehand or A26 washed in DI water was gently stirred in this HCl solution for 30 min, filtered, and washed in methanol until the pH of the washing methanol became stable before use in a transesterification experiment.
2.4 Resin characterisation
Both IRA402 and A26 were examined by SEM (Hitachi S-3400 N). Methoxide-form resin samples were dried overnight in an oven before the examination.
The exchange capacity of a resin was determined by titration. 4 cm3 of hydroxide-form IRA402 or A26 was transferred to 32 cm3 of 1.5 M aqueous solution of NaCl for ion exchange. Resin’s higher affinity for the chloride ion should have resulted in the complete release of the hydroxide ion to the solution. The solution together with the resin was titrated with 0.2 M HCl. The resin’s exchange capacity was then calculated from the amount of the titrant used to reach the endpoint.
The surface area and pore volume of a resin were derived from N2 physisorption (Micromeritics ASAP 2020) with the BET isotherm and BJH method, respectively. A resin’s particle density was determined by simple volume displacement. Dry resin mass was measured after the resin was washed in methanol and dried in a hot-air oven overnight and used in the calculations for densities.
2.5 Statistical analysis
Statistical hypothesis testing was conducted to support observations. A significance level of 5 % was set for all hypothesis testing. Hypothesis testing for the significance of effects from independent variables was performed with analysis of variance (ANOVA). Briefly, a mean explained variation was compared with a mean unexplained variation, i.e. from experimental errors. A similar procedure was carried out for judging the significance of regression. Model adequacy was gauged through the coefficient of determination (R2) and the lack-of-fit test.
2.6 Mathematical modelling
A system of partial differential equations in one spatial dimension and one temporal dimension was developed to model the reaction rates of transesterification with A26 with mass transport effects in resin beads. Both the reactions occurring in resin pores and at the outer surfaces of resin beads were incorporated in the model. The model was discretised with the finite-volume method (FVM). Code was developed in MATLAB R2022b for the model and the software’s ode15s integrator was used to solve the system of equations. The developed mathematical model was used for curve fitting to determine kinetic parameters and other model parameters. Only general model formulation is given in this section. The details of the developed model will be discussed in the results and discussion so that the rationale behind the model can be discussed in relation to experimental results.
The flux of species i used in the model was of the following form:
The reactions occurring in the pores were modelled through the reaction rates per resin bead volume. These and the flux equations were incorporated into the material balance equations. A one-dimension spherical coordinate system along the radius was used to approximate the nearly spherical geometry of a resin bead:
The effective pair i-j diffusivities in resin pores were estimated by:
The dynamic viscosities of solutions were estimated by the method of Grunberg and Nissan (1949):
All phenomena in and around every resin bead were assumed to be identical in the same transesterification experiment. Changes in the concentrations of species in the bulk of the reaction mixture were modelled as:
3 Results and discussion
3.1 Resin characterisation
Fig. 1 presents SEM micrographs of IRA402 and A26 at different magnifications. The beads of both IRA402 and A26 appeared to be virtually spherical. The bead sizes of A26 seemed to have better consistency than IRA402. Micrographs of higher magnifications revealed markedly different surface morphology between the two resins. The outer surface of IRA402 appeared as folds while that of A26 seemed to form from multiple elongated grains. Large and small openings to the internal pores of A26 appeared scattered over the external surfaces, suggesting non-uniform pore sizes.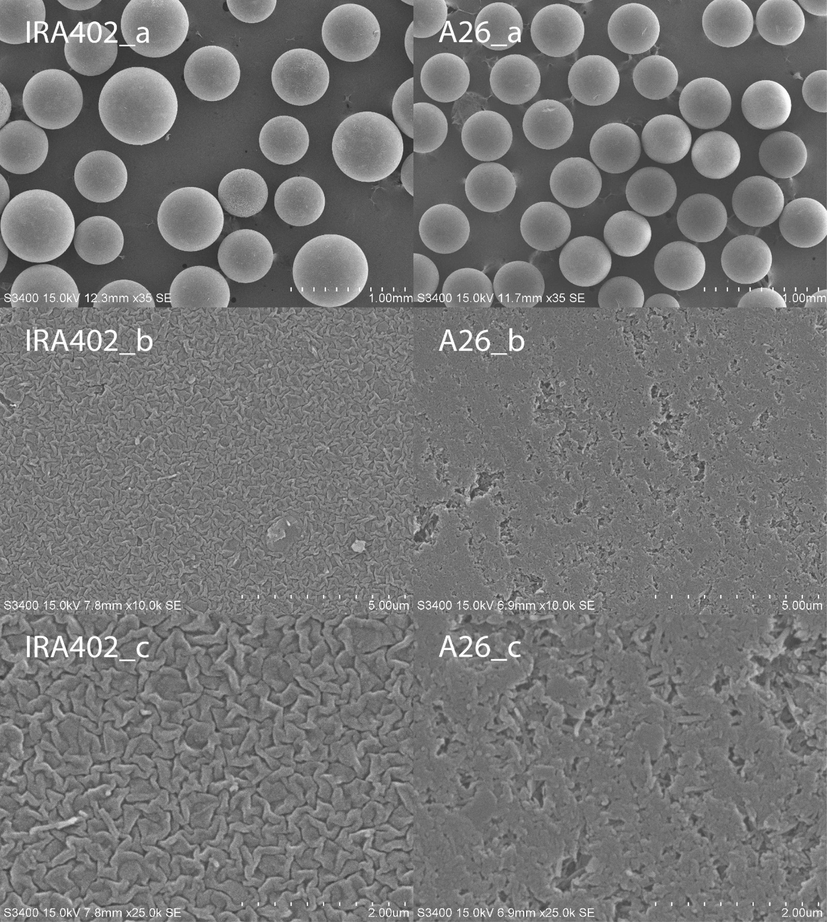
SEM micrographs of IRA402 (left column) and A26 (right column) at different magnifications. a, b, and c: 35, 10 000, and 25 000 times, respectively.
Table 2 presents some properties of IRA402 and A26. The average particle diameters were measured from the SEM micrographs (Fig. 1). That of IRA402 was larger than that of A26. The exchange capacity of IRA402 was lower than that of A26. The BET surface area and pore volume were available for only A26 because those of IRA402 were too low to be precisely derived from N2 physisorption. Both the submerged-bed and particle densities of IRA402 were higher than those of A26, being consistent with the fact that IRA402 is dense while A26 is porous.
Property
IRA402
A26
Average particle diameter, 2R/mm
0.55
0.44
Exchange capacity, q/eq dm−3
0.57
0.73
BET surface area, a/m2 g−1
–
16.8
Pore volume, v/cm3 g−1
–
0.126
Submerged-bed density, ρb/g cm−3
0.312
0.144
Particle density, ρp/g cm−3
0.379
0.221
3.2 Transesterification with IRA402
The intrinsic kinetics of transesterification with anion-exchange resin was studied with the dense IRA402 resin. Owing to the resin’s lack of pores, reactions were assumed to occur only on the external surfaces of resin beads. The resin’s relatively low surface area should also have abated external mass transfer resistance.
Fig. 2 compares the FAME yields after 4 h transesterification with IRA402 at standard conditions without and with THF added. It should be noted that the amount of oil in the experiment without THF was higher than that in the other (Table 1). Despite this, a lower FAME yield was obtained from this experiment without THF. The addition of THF appeared to greatly enhance the reaction rate and hence increased the FAME yield.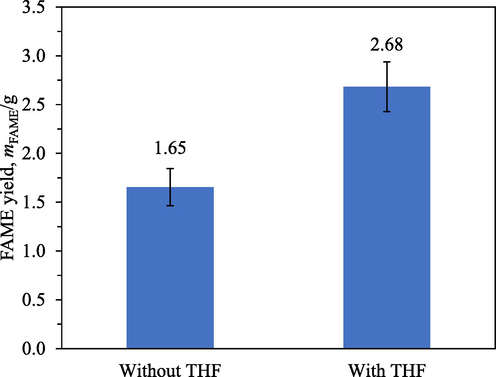
FAME yields after 4 h transesterification with IRA402 at standard conditions without and with THF added.
Statistical analysis was conducted to judge the significance of the effect of THF addition on the FAME yield. Table 3 presents some statistics of the experimental data shown in Fig. 2. The 3 degrees of freedom of SSE were derived from 3 and 2 replicates of the experiments without and with THF, respectively. A hypothesis test was conducted between a null hypothesis that MSTR = MSE and an alternative hypothesis that MSTR > MSE. A statistic F = MSTR/MSE = 27.7 gave a p-value of 0.0134. Therefore, the null hypothesis was rejected. In other words, the observed effect of THF addition on the FAME yield was statistically significant.
Sum of squares
Degrees of freedom
Mean square
Treatment
SSTR = 1.27 g2
1
MSTR = 1.27 g2
Error
SSE = 0.14 g2
(3 – 1) + (2 – 1) = 3
MSE = 0.046 g2
Total
SST = 1.41 g2
1 + 3 = 4
MST = 0.351 g2
Fig. 3 compares the physical appearances of the reaction mixtures after 4 h transesterification with IRA402 without and with THF added. During the transesterification without THF added, two liquid phases persisted throughout. IRA402 beads agglomerated irregularly. The close-up suggested that the resin beads had better affinity with the methanol-rich phase; the oil-rich phase was repelled from the resin agglomeration. By this structure, it could be inferred that oil would have to be transferred to the methanol-rich phase before it could reach resin’s catalytic sites and react at low concentrations. On the other hand, the reaction mixture during the transesterification with THF added remained as a single liquid phase. No irregular agglomeration of resin beads was observed. Mass transfer of the reactants to the resin’s catalytic sites was expected to be faster in the presence of THF; oil should also have reacted at higher concentrations. The FAME yields in Fig. 2 could plausibly be explained by these phenomena.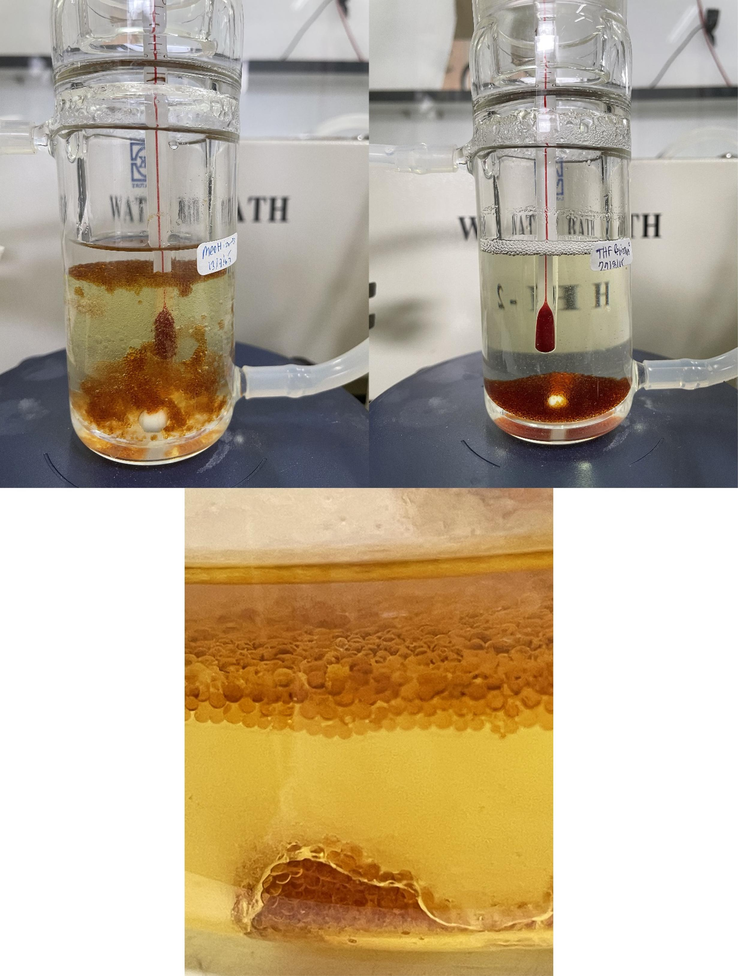
Photographs of the reaction mixtures in the reactor after 4 h transesterification with IRA402 without (top left) and with (top right) THF added. The bottom photograph is a close-up of agglomeration of IRA402 beads after an experiment without THF added.
From this point onwards, all transesterification experiments presented and discussed were conducted with THF added. This was to avoid complex effects arising from the presented phase separation and resin agglomeration.
The effects of the initial amount of oil, resin’s relative basic site content, and initial amount of methanol on the FAME yield were investigated in order to gain insight into the reaction mechanism. Fig. 4 shows the FAME yields from different initial amounts of oil after 4 h transesterification with 4 cm3 of IRA402. The FAME yields appeared to have a linear relation with the initial amounts of oil. These results suggested that the reaction was first-order with respect to the concentration of oil.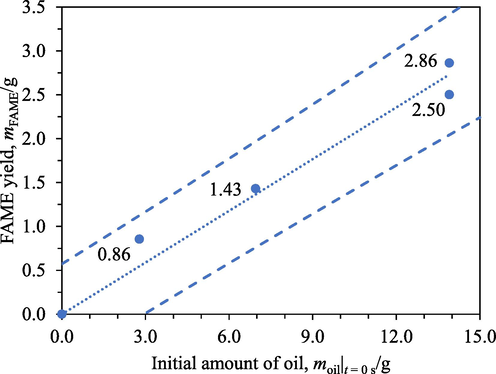
FAME yields from different initial amounts of oil: 0 g, 2.8 g, 7.0 g, and 13.9 g after 4 h transesterification with IRA402. Circles: experimental data, dotted line: regression line, dashed lines: bounds of 95 % prediction interval.
Statistical analysis was conducted to support this conclusion. Initially, two-parameter linear regression consisting of a slope and a vertical intercept with the initial amount of oil as the only regressor was performed. A null hypothesis that the vertical intercept was 0 g could not be rejected for an alternative hypothesis that the vertical intercept was not 0 g as the p-value obtained was 0.385. Therefore, the vertical intercept was dropped and a new slope was determined to be 0.196. This is the slope of the regression line presented in Fig. 4. A null hypothesis that this slope was zero was rejected for an alternative hypothesis that the slope was not zero with a p-value of 3.68 × 10⁻⁵. An R2 of 0.973 was obtained, indicating that most of the variations in the experimental data were explained by the regression. With a 95 % confidence interval, the value of the slope lied between 0.169 and 0.224.
Fig. 5 presents the FAME yields after 4 h transesterification with IRA402 having different relative basic site contents. As methoxide is considered to be the catalyst for transesterification, varying the resin’s relative basic site content meant varying the resin’s number of catalytic sites and hence would affect the FAME yields obtained. The relation seemed to be linear and hence indicated negligible influence of external mass transfer.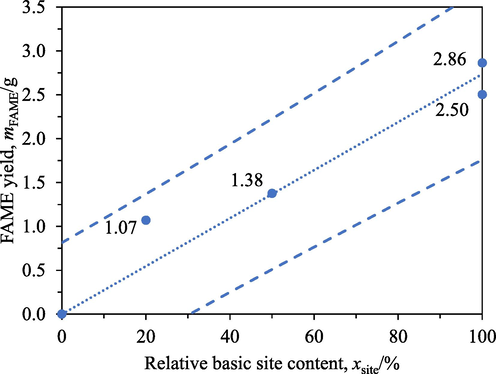
FAME yields from different IRA402′s relative basic site contents: 0 %, 20 %, 50 %, and 100 % after 4 h transesterification with the resin. Circles: experimental data, dotted line: regression line, dashed lines: bounds of 95 % prediction interval.
A similar statistical analysis was conducted to corroborate this conclusion. A null hypothesis that the vertical intercept of an initial model was 0 g could not be rejected for an alternative hypothesis that the vertical intercept was not 0 g as the p-value obtained was 0.354. The vertical intercept was dropped as a result. A new slope of 2.74 g was obtained. A null hypothesis that this new slope was 0 g was rejected in favour of an alternative hypothesis that the new slope was not 0 g with a p-value of 1.46 × 10⁻⁴. An R2 was 0.948. A range of 2.20 to 3.28 for this slope was obtained with a confidence interval of 95 %.
Fig. 6 shows the FAME yields from different initial amounts of methanol after 4 h transesterification with 4 cm3 of IRA402. A strongly non-linear relation was observed. The 68 % decrease in the initial amount of methanol (6.3 cm3 to 2.0 cm3) decreased the FAME content by only 23 % (2.68 g to 2.06 g). This implied that the involvement of methanol in the generation of FAME was in a reaction step that was separate from the reaction of oil and that the reaction step involving methanol was not the rate-determining step.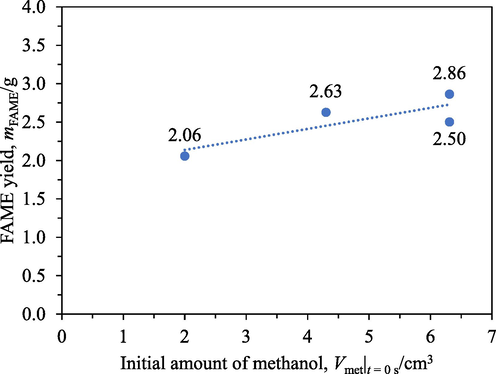
FAME yields from different initial amounts of methanol: 2.0 cm3, 4.3 cm3, and 6.3 cm3 after 4 h transesterification with IRA402.
A simple statistical analysis was conducted to confirm the non-linearity. A linear equation was initially assumed; a slope of 0.137 g cm−3 and a vertical intercept of 1.86 g were obtained by regression. For this regression, a null hypothesis that the vertical intercept was 0 g was rejected with a p-value of 0.0296 in favour of an alternative hypothesis that the vertical intercept was not 0 g. However, if the initial amount of methanol is 0 cm3, the FAME yield must actually be 0 g because one of the reactants is missing. It could be inferred that the linear model first assumed was unsuitable for the observed behaviour and hence the relation between the FAME yield and the initial amount of methanol was non-linear.
The behaviours observed in Fig. 4 to Fig. 6 suggested that the rate-determining step involved the reaction between acylglycerols and adsorbed methoxide at resin surfaces to produce FAME and acylglycerol-derived alkoxides. Methanol would participate in a subsequent faster step for protonating the alkoxides resulting from the previous step into lower acylglycerol or glycerol. Methoxide would ultimately be recovered from this last step. Fig. 7 illustrates this reaction mechanism.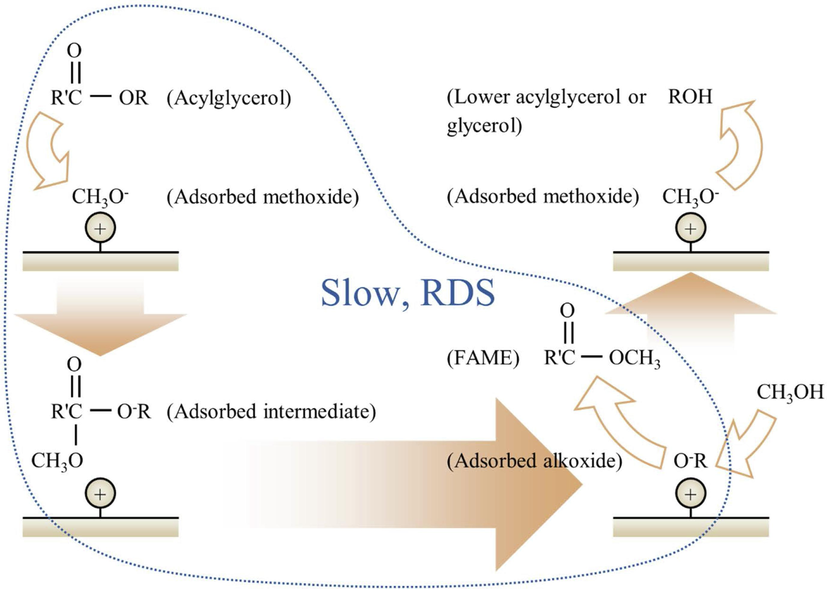
Proposed mechanism of transesterification of refined palm oil with methanol catalysed by anion-exchange resin.
Transesterification of triglyceride actually occurs through three consecutive reactions each producing a FAME molecule accompanied by a lower acylglycerol molecule or a glycerol molecule in the last step. The three reactions form a moderately complex reaction scheme but by the nature of this system and under the experimental conditions, the scheme could be greatly simplified.
According to Issariyakul and Dalai (2012), the forward rate constants of the three consecutive reactions increase from the first to the last. Therefore, it was reasonable to assume that the first step, the conversion of triglyceride, was the rate limiting step. In other words, this reaction was assumed:
The rate constant for IRA402 could be estimated from the results presented in Fig. 4. The rate of change in the number of moles of TG according to the proposed rate law was:
This reaction mechanism and rate law would be the basis for subsequent modelling of the reaction rates observed with the porous A26 resin.
3.3 Transesterification with A26
A26 is macroporous. The resin was expected to offer higher FAME generation rates than IRA402 due to A26′s higher specific surface area. Fig. 8 presents the FAME yields after 0.5 h, 1 h, and 4 h transesterification with A26 having different relative basic site contents. Non-linear relations between the FAME yields and the relative basic site contents were apparent for all three reaction durations. The FAME yields from 0.5 h transesterification appeared relatively insensitive to the resin’s basic site contents in the range of 10 % to 100 %. On the other hand, clearer but still weak dependence of the FAME yields from 1 h and 4 h transesterification on the relative basic site contents was observed.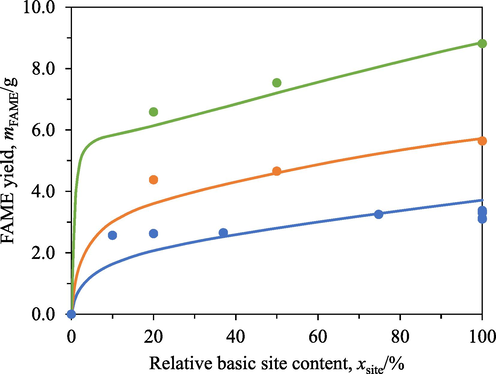
FAME yields at different A26′s relative basic site contents after 0.5 h (blue), 1 h (orange), and 4 h (green) transesterification with the resin. Circles: experimental data, curves: model predictions.
The somewhat flat profiles of the FAME yields with respect to A26′s relative basic site contents in Fig. 8 were attributed to internal mass transfer limitations. Fig. 9 shows the FAME yields from 0.5 h transesterification with only 0.4 cm3 of A26 having different relative basic site contents. This amount of resin was only 10 % of the standard value. A26 of this amount having a full basic site content would have the same number of basic sites as 4 cm3 of A26 having a relative basic site content of 10 %. Nevertheless, the FAME yield obtained from 0.5 h transesterification with 0.4 cm3 of A26 having a full basic site content was only 0.39 g, which was only 15.2 % of 2.57 g (Fig. 8) obtained from 0.5 h transesterification with 4 cm3 of A26 having a relative basic site content of 10 %. In other words, the same number of basic sites distributed on different number of resin beads affected the FAME yields. This behaviour indicated the presence of external and/or internal mass transfer resistance.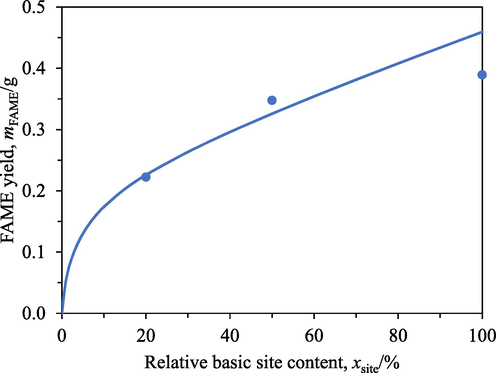
FAME yields at different A26′s relative basic site contents after 0.5 h transesterification with only 0.4 cm3 of the resin. Circles: experimental data, curves: model predictions.
Fig. 10 shows that the FAME yields were only weakly affected by the agitation speeds. Nevertheless, a gradual falling trend could be noticed as the agitation speed increased. Based on visual observation, a faster agitation speed induced a larger vortex, which in turn carried the resin towards the top of the reaction mixture away from the stir bar. As the distance from the stir bar increased, the shear from the rotating stir bar would become weaker. The relative speed between the resin beads and the liquid would also become slower. This would cause a slight increase in the external mass transfer resistance and hence a small drop in the FAME yield. However, this small drop in the FAME yield over a range of agitation speeds from 300 rpm to 1500 rpm indicated that the external mass transfer resistance was small compared to the internal mass transfer resistance in resin beads. Therefore, the flat profiles of the FAME yields in Fig. 8 and Fig. 9 were attributed to internal mass transfer resistance.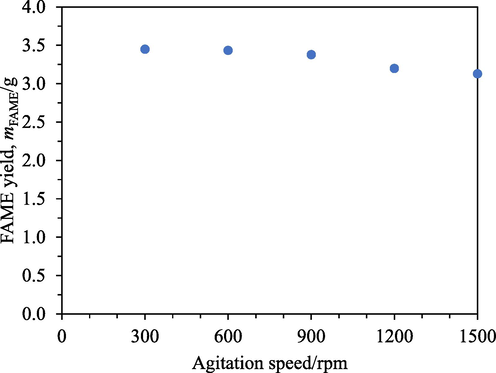
FAME yields at different agitation speeds from 0.5 h transesterification with A26.
Comparing the FAME yields in Fig. 4 and Fig. 8 shows that A26 offered markedly faster FAME formation rates than IRA402. The FAME yield from only 0.5 h of transesterification with A26 having a full basic site content was 3.23 g (Fig. 8), which was even slightly higher than 2.68 g (Fig. 4) obtained from 4 h of transesterification with IRA402, also having a full basic site content. These results indicated that the FAME formation rate obtained with A26 was at least 8 times faster than that obtained with IRA402. Nevertheless, this fast FAME formation rate of A26 fell sometime after 0.5 h of transesterification. The FAME yield from 4 h of transesterification with A26 having a full basic site content was 8.81 g (Fig. 8), which was 2.8 times the FAME yield of 3.23 g obtained from only 0.5 h of transesterification. In other words, 3.5 h of transesterification were required in the slower second stage to produce 1.8 times the amount of FAME previously obtained during the first 0.5 h.
Fig. 11 shows the FAME yields and FAME contents obtained after transesterification for the specified reaction durations with A26 and the specified initial amounts of oil and methanol. The FAME formation rate during the transesterification with the standard amounts of oil and methanol possessed a somewhat sharp transition into a slower rate at approximately 1 h after the reaction had started. The rate also appeared to decay so rapidly that a FAME yield of 9.72 g and a corresponding FAME content of only 69.9 % were obtained from 9 h transesterification. This drop in the overall reaction rate could be caused by either a shift in the reaction mechanism or the formation of an additional limiting factor, or both. It will also be shown later that the cause of this fall in the reaction rate was not permanent.![FAME yields (top) and FAME contents (bottom) after transesterification for the specified reaction time with A26 and the following initial amounts of [oil and methanol] relative to the standard values: [100 % and 100 %] (blue), [25 % and 100 %] (orange), and [25 % and 25 %] (green). Circles: experimental data, curves: model predictions.](/content/184/2024/17/1/img/10.1016_j.arabjc.2023.105449-fig12.png)
FAME yields (top) and FAME contents (bottom) after transesterification for the specified reaction time with A26 and the following initial amounts of [oil and methanol] relative to the standard values: [100 % and 100 %] (blue), [25 % and 100 %] (orange), and [25 % and 25 %] (green). Circles: experimental data, curves: model predictions.
Fig. 11 also presents the FAME yields and FAME contents from transesterification with the initial amounts of oil reduced to 25 % of the standard amount and with the initial amounts of both oil and methanol reduced to 25 % of the standard amounts. Decreasing the initial amounts of oil or both oil and methanol increased the rate of percentage oil conversion (with the FAME content regarded as percentage oil conversion). Higher FAME contents approaching 100 % were also achieved in only 3 h. No sharp transition to slower rates were observed. On the other hand, the absolute rates of FAME formation decreased as expected from having lower reactant concentrations. The FAME contents and FAME yields from the transesterification with the initial amounts of both oil and methanol reduced to 25 % were only slightly lower than those from the transesterification with only the initial amounts of oil reduced to 25 %. That the 4 times lower initial amounts of methanol barely affected the reaction rates corroborated the findings discussed earlier for Fig. 6 that methanol was not involved in the rate-determining step. When the initial amounts of both oil and methanol were reduced to 25 %, the methanol-to-oil molar ratios were maintained at the same value as those in the experiments with 100 % oil and methanol; this indicated that the low oil conversion obtained with 100 % oil and methanol was not limited by thermodynamic equilibrium. The different kinetic behaviours observed by varying the initial reactant amounts implied that the transition to the slower rate observed with 100 % oil and methanol did not involve the intrinsic reaction mechanism and that an additional limiting factor was at play.
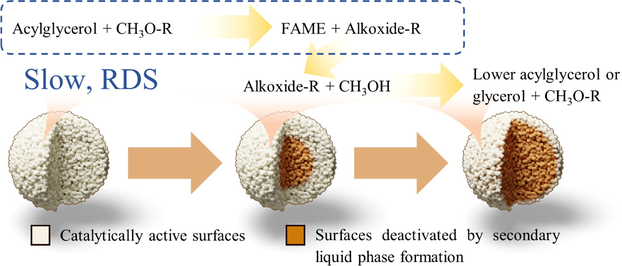
Fig. 12 shows the reaction mixtures before and after 3 h transesterification with A26. The reaction mixture before the reaction was clear, while that after the experiment became turbid, suggesting the formation of colloidal droplets of a secondary liquid phase. Based on this observation, the mechanism of the rate suppression was hypothesised to be the formation of a secondary liquid phase triggered by glycerol generation and accumulation in the pores of A26. The secondary phase formed would adhere to the internal surfaces of the pores, preventing acylglycerols from reaching the catalytic sites and thereby ceasing the reaction. Nevertheless, near the outer surfaces of A26, the formed secondary phase would be readily transported away as colloidal droplets dispersed in the primary liquid phase and the regions would still be catalytically active. In this scheme, the transition to the slower reaction rate would be the indication of significant secondary phase formation in the pores of A26 and the slower reaction rate would be mainly sustained by the reaction occurring at the outer surfaces of the resin beads. The transesterification with the initial amount of oil or the initial amounts of both oil and methanol reduced presented no such rate transition (Fig. 11) plausibly because the concentrations of generated glycerol were too low to initiate secondary liquid phase formation, according to the proposed hypothesis. As demonstrated by Phoopisutthisak et al. (2019), the presence of glycerol in reaction mixture also affected rates of transesterification with homogeneous catalyst without any co-solvent added mainly by dilution of polar phase droplets and suppression of interfacial mass transfer.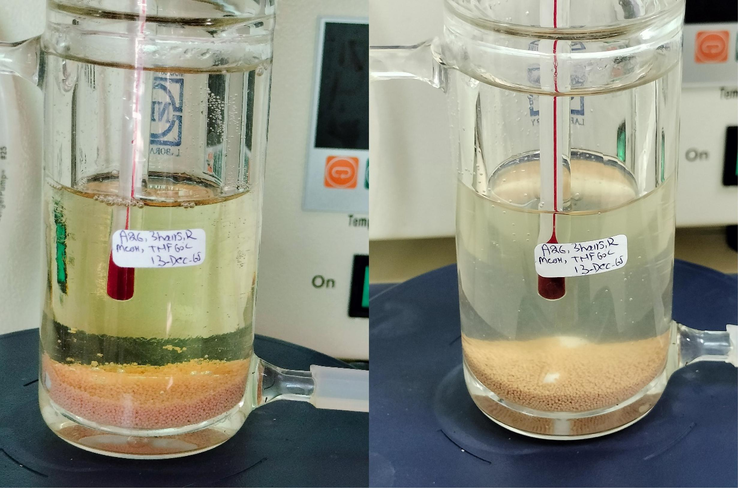
Photographs of the reaction mixtures in the reactor before (left) and after (right) 3 h transesterification with A26. The white balance and tint of the photograph on the left were adjusted to achieve a natural appearance.
Fig. 13 compares the FAME yields from 0.5 h transesterification without and with deliberate addition of glycerol at the start of the reaction. The presence of glycerol from the start of the reaction reduced the FAME content from 23.2 % to 16.0 %, plausibly by hastening secondary phase formation. This behaviour was consistent with the proposed hypothesis.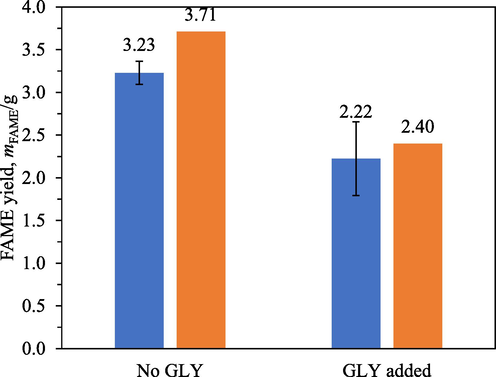
FAME yields from 0.5 h transesterification with A26 without and with deliberate addition of glycerol to achieve an initial concentration of 0.1 M. Blue: experimental data, orange: model predictions.
Statistical analysis of the data presented in Fig. 13 was conducted to judge the significance of the observations. Table 4 presents some statistics of the experimental data in Fig. 13. The 4 degrees of freedom of SSE were derived from 4 and 2 replicates of the experiments without glycerol addition and with glycerol addition, respectively. A statistic F = MSTR/MSE of 22.3 was obtained. A p-value of 0.00916 suggested the rejection of a null hypothesis that MSTR = MSE in favour of an alternative hypothesis that MSTR > MSE. In other words, the observed difference in the FAME yields between the two sets of experiments without and with glycerol addition was statistically significant.
Sum of squares
Degrees of freedom
Mean square
Treatment
SSTR = 1.35 g2
1
MSTR = 1.35 g2
Error
SSE = 0.24 g2
(4 – 1) + (2 – 1) = 4
MSE = 0.060 g2
Total
SST = 1.59 g2
1 + 4 = 5
MST = 0.318 g2
Resin reuse was also briefly studied. The FAME yields from 0.5 h transesterification with fresh, pretreated A26 and A26 that had previously been used once in 3 h transesterification were compared. 3 h transesterification had been sufficiently long for the resin to exhibit the slow second stage (Fig. 11). The used resin was washed in THF and methanol to remove the hypothesised secondary liquid phase before reuse in this 0.5 h transesterification. Only a 16 % decrease in the FAME yield was observed (3.23 g to 2.72 g) from reusing the resin for transesterification. This indicated that the cause for the slower rate was not permanent and hence in agreement with the hypothesis of secondary liquid phase formation.
3.4 Mathematical modelling of transesterification with A26
A few preliminary models had been developed and fitted with the experimental data but the flat profiles observed in Fig. 8 and Fig. 9 could not have been reproduced satisfactorily. It was further hypothesised that the pore structure of A26 was complex and caused nonuniform species concentrations at the same radial distance in a resin bead. These effects could not have been modelled through tortuosity alone and thereby an additional element was introduced to the final model, which could better reproduce the flat profiles and is the one presented in this work.
The pores were modelled as radial channels and branch channels. Fig. 14 illustrates this model. This conceptual pore structure was suggested by the surface morphology of A26 observed in A26_b and A26_c of Fig. 1, which show scattered small and large openings to the internal pores of A26. It was inferred that the suggested non-uniform pore sizes possessed non-uniform mass transport characteristics; only some pore regions provided radial pathways with relatively low resistance, whereas the others presented large resistance for radial mass transport.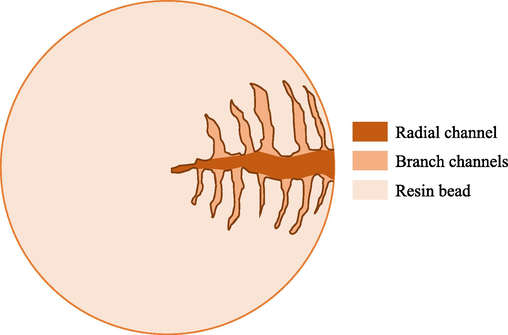
Exaggerated illustration of radial channels and branch channels in a resin bead for the mathematical modelling of pores in A26.
Based on this hypothetical pore structure, radial mass transport could occur only in the radial channels, whereas the branch channels could gain or lose mass through mass transport with the radial channels only. At low relative basic site contents, the reaction occurred slowly and a large portion of the surface areas in both the radial channels and the branch channels would be utilised. At high relative basic site contents, the fast reaction rate consumed triglyceride rapidly. As the branch channels had no direct access to the reaction mixture, triglyceride would be depleted there and the overall utilisation of the surface areas would be lower. These phenomena would result in the observed strongly non-linear relation between the reaction rate and the relative basic site content.
The model for the radial channels was similar to a conventional radial mass transport model in a spherical catalyst particle with some modifications. The material balance (8) was rewritten to include mass transport with branch channels as follows:
The ideal-solution molar volume constraint (15) took a new form:
Mass transport between the resin beads and the bulk of the reaction mixture was modelled to occur through the radial channels only with Eq. (20). The negligible external mass transfer resistance was modelled by setting a small value for the mass transfer characteristic length between the resin beads and the bulk of the reaction mixture.
Initially, A26 beads’ void fraction of 0.417 was obtained from:
The rate law for the reactions occurring at the external surfaces of A26 beads was the same as that written previously for IRA402 but a different value of the rate constant was used. In addition, the rate of generation or consumption of a chemical species in the forward direction per resin bead volume was required and written as:
On the other hand, the rates per outer surface area were left to function normally as per the reaction scheme discussed earlier. Nevertheless, secondary phase formation would absorb glycerol generated at the outer surfaces of resin beads and render the concentration of glycerol in the primary phase somewhat constant. Therefore, glycerol generation at the outer surfaces of the resin beads had to be suppressed to model this phenomenon:
Parameter
Value
cGLY,lim/mol m−3
152
fbc
0.9
kf/s−1
8.26 × 10⁻²
kf,s/m s−1
5.8 × 10⁻⁸
lbc/m
4.8 × 10⁻⁵
τ
2.1
Table 6 and Table 7 present two different sets of four and two replicates that were used to estimate the pure error, i.e., experimental errors, as a component in a model adequacy check to be discussed next. Note that these 6 data points were part of the 31 experimental data points already presented.
FAME yield, mFAME/g
Replicate 1
3.13
Replicate 2
3.38
Replicate 3
3.10
Replicate 4
3.31
Sample mean
3.23
Sample standard deviation
0.136
FAME yield, mFAME/g
Replicate 1
1.92
Replicate 2
2.53
Sample mean
2.22
Sample standard deviation
0.431
Sums of squares and mean squares from this model and the experimental data were calculated for statistical analysis. The values are presented in Table 8.
Sum of squares
Degrees of freedom
Mean square
Regression
SSR = 235.7 g2
8
MSR = 29.46 g2
Error
SSE = 8.5 g2
31 – 6 = 25
MSE = 0.34 g2
Total
SST = 244.2 g2
8 + 25 = 33
MST = 7.399 g2
Pure error
SSPE = 0.24 g2
(4 – 1) + (2 – 1) = 4
MSPE = 0.060 g2
Lack of fit
SSLOF = SSE – SSPE = 8.25 g2
25 – 4 = 21
MSLOF = 0.393 g2
The 8 degrees of freedom for SSR were from 8 independent variables in the model: initial amounts of the five species considered in the model, amount of resin, relative basic site content, and reaction time. SSPE was derived from the replicates presented in Table 6 and Table 7. The mean squares were obtained by dividing the corresponding sums of squares by their numbers of degrees of freedom.
Model adequacy was judged through the coefficient of determination R2 = SSR/SST and a lack-of-fit test. The statistics in Table 8 resulted in an R2 of 0.965. This indicated that the model explained most of the variations in the data. For a lack-of-fit test, a statistic F = MSLOF/MSPE of 6.50 was obtained. This resulted in a p-value of 0.0408. Hence, a null hypothesis that MSLOF = MSPE was rejected for an alternative hypothesis that MSLOF > MSPE. This rejection indicated a significant lack of fit. A conclusion could be drawn from these model adequacy tests that the developed model could provide reasonable predictions but significant deviations from experimental trends were present.
The FAME yields and FAME contents from the model presented in Fig. 8, Fig. 9, Fig. 11, and Fig. 13 were generally in good agreement with experimental data. The nonlinear relation between the FAME yield and the relative basic site content in Fig. 8 could be captured moderately by the model. Deviations of the predicted values from the experimental data grew larger as the relative basic site content decreased and were consistent with the significant lack of fit determined statistically. These errors were attributed to complex mass transport phenomena in resin beads that could not be captured by the simplified pore structure employed in the current model. The trend in the FAME yield from the model for 4 h transesterification possessed a sharp change at a relative basic site content of ca 3 %. This was caused by the abrupt drop in the reaction rate after the formation of the secondary liquid phase. Fig. 9 shows that FAME yields were also predicted by the model moderately accurately when only 0.4 cm3 of A26 was used in transesterification.
This model could also reproduce the sharp transition in the temporal profile of the experimental FAME yields and FAME contents from transesterification at standard conditions in Fig. 11. Analysis of the model revealed that the secondary liquid phase started to form virtually at the same time in a spherical volume whose radius was 75 % of the resin bead’s. The front then propagated outwards, deactivating all internal resin surfaces. The graphical abstract illustrates this process. Nevertheless, Fig. 11 shows that the model was valid only up to 4 h of transesterification; it clearly overpredicted both the FAME yield and FAME content from 9 h transesterification. It was suspected that when the amount of the secondary liquid phase reached a certain point, it would not be effectively transported away from the outer surfaces of the resin beads any more and its presence would suppress the reaction occurring there. This effect was not included in the model and therefore the overprediction resulted.
The model also correctly predicted that decreasing the initial amount of oil or the initial amounts of both oil and methanol to 25 % of their standard values avoided the formation of the secondary liquid phase and allowed oil conversions approaching 100 % to be achieved (Fig. 11). However, the model underpredicted both the FAME yields and FAME contents. This error was again attributed to complex mass transport in resin beads modelled only partially in this work.
Fig. 13 shows that the model could also predict the FAME yield from transesterification with glycerol deliberately added at the start. According to the model, the addition of glycerol initiated the formation of the secondary liquid phase at 0.05 h. This greatly limited the reaction to occur only at the outer surfaces of the resin beads soon after transesterification started and resulted in a lower FAME yield.
Factor fbc of 0.9 was required to reproduce the observed non-linear effect of the relative basic site content on the FAME yield. This value indicated that 90 % of resin pore volume behaved as branch channels; only 10 % formed effective paths from the external surface to the centre of a bead. The value of fbc seemed reasonable given the apparent non-uniform pore sizes; the probability of finding a relatively direct path from a point on the outer surface to the centre of a bead would be low. A tortuosity, τ, of 2.1 employed in the model was moderately high and in agreement with the branching characteristic of the resin’s pore structure. The mass transport characteristic length of the branch channels used in the model was 4.8 × 10⁻⁵ m, which was about 10 % of the diameter of an A26 bead.
A26′s rate constant for the reactions occurring at the resin’s external surfaces, kf,s, of 5.8 × 10⁻⁸ m s−1 was in the same order as IRA402′s of 1.77 × 10⁻⁸ m s−1 determined previously. This was in agreement with the proposed hypothesis that during the slow second stage the reactions occurred only at the resin’s external surfaces. With the same density of basic sites in the dense resin phase assumed for both A26 and IRA402, A26′s kf,s being 3.3 times larger than IRA402′s could plausibly reflect the former’s larger external catalytic surface area owing to its porosity. This could be expressed mathematically as follows:
cGLY,lim of 152 mol m−3 was obtained by fitting the model to the experimental data. It could be treated as the solubility limit of glycerol in the reaction mixture. There was a lack of experimental data for this phase equilibrium system; most available data in literature feature glycerol-oil systems, whereas the system in this work would be better described as glycerol-THF systems due to the use of THF as a co-solvent. Thermodynamic simulation was performed in Aspen Plus V12.1 to evaluate the obtained value of cGLY,lim. Refined palm oil was modelled as triolein. As the software also did not have any phase equilibrium data of glycerol-THF systems, the UNIFAC method was chosen. It should be noted that this method had to be modified to use VLMAQUAD as the liquid molar volume model because the default model VLMX01 led to extremely abnormal molar volume of mixture. A transesterification system with the standard conditions with which experiments in this work were carried out was configured in the software. cGLY,lim of ca 49 mol m−3 was obtained over a wide range of oil conversion. In another simpler simulation of binary liquid–liquid equilibrium of glycerol and triolein, the software gave a mole fraction of glycerol in the oil-rich phase of 1.33 × 10⁻³, whereas a reported experimental value was 4.99 × 10⁻³ (Silva et al., 2016). Based on these observations, it was concluded that the UNIFAC method tended to underpredict the solubility of glycerol in an oil-containing phase and hence it was deemed that cGLY,lim of 152 mol m−3 obtained by curve fitting in this work was realistic.
4 Conclusions
Transesterification of refined palm oil and methanol with IRA402 and A26 anion-exchange resins as heterogeneous catalysts was conducted. THF was added as a co-solvent to improve the miscibility of oil and methanol. IRA402 was used to study the reaction rates occurring in the approximate absence of pore diffusion and external mass transfer resistance. The reaction appeared to consist of at least two separate steps. The rate-determining step was found to be the reaction between oil and adsorbed methoxide at resin’s surfaces.
With porous A26, the reaction rates appeared to possess two stages: a faster first stage and a slower second stage. The formation of a secondary liquid phase induced by glycerol caused this transition by adhering to the internal surfaces of the resin beads and preventing oil to reach the internal catalytic sites. Secondary liquid phase formation could be avoided by diluting the reaction mixture with more THF. Future improvement should be aimed at other economical means of disrupting this secondary liquid phase formation to maintain fast reaction rates.
A finite-volume model was developed to simulate the reaction and mass transport in A26 beads. A complex pore structure comprised of radial channels and branch channels was required in the model to reproduce the strongly non-linear relation between the reaction rate and the relative basic site content. The model with secondary liquid phase formation incorporated reproduced the rate transition adequately. As suggested by the model, the internal mass transport was greatly hindered because 90 % of the accessible pore volume behaved as branch channels with no direct access to the reaction mixture. The pore structure of resin for catalytic purposes should be controlled to minimise branch channels.
Acknowledgements
This Research is funded by Thailand Science Research and Innovation Fund Chulalongkorn University (CU_FRB65_bcg (26)_140_21_06).
This research has received funding support from the NSRF via the Program Management Unit from Human Resources & Institutional Development, Research and Innovation (Grant number B05F640085).
The authors are grateful to Rawipa Choknumchaisiri for conducting additional experiments to complement this work.
Declaration of Competing Interest
The authors declare that they have no known competing financial interests or personal relationships that could have appeared to influence the work reported in this paper.
References
- Electro-catalytic biodiesel production from canola oil in methanolic and ethanolic solutions with low-cost stainless steel and hybrid ion-exchange resin grafted electrodes. Front. Mater. Sci.. 2017;4
- [CrossRef] [Google Scholar]
- Water influence on the kinetics of transesterification using CaO catalyst to produce biodiesel. Fuel. 2021;296:120653
- [CrossRef] [Google Scholar]
- Homogeneous catalysts used in biodiesel production. In: Rokhum S.L., Halder G., Assabumrungrat S., Ngaosuwan K., eds. Biodiesel Production. John Wiley & Sons Ltd.; 2022. p. :83-101.
- [Google Scholar]
- Application of heterogeneous catalysts for transesterification of refined palm oil in ultrasound-assisted reactor. Fuel Process. Technol.. 2013;111:22-28.
- [CrossRef] [Google Scholar]
- Using biodiesel as a green solvent in the polymerization reactions: the attempt to separate the biodiesel from the polymer by thermal treatment. Polym. Bull.. 2017;74:2365-2378.
- [CrossRef] [Google Scholar]
- Optimizing the production of biodiesel from palm olein (Elaeis guineensis Jacq.) using a strong basic anionic resin as a heterogeneous catalyst. Ind. Crop. Prod.. 2021;174:114121
- [CrossRef] [Google Scholar]
- Waste cooking oil transesterification by sulfonated polyphenylsulfone catalytic membrane: Characterization and biodiesel production yield. Renew. Energy. 2022;182:1219-1227.
- [CrossRef] [Google Scholar]
- Study on the solvent power of a new green solvent: Biodiesel. Ind. Eng. Chem. Res.. 2004;43:7928-7931.
- [CrossRef] [Google Scholar]
- Isdale, J.D., MacGillivray, J.C., Cartwright, G., 1985. Prediction of Viscosity of Organic Liquid Mixtures by a Group Contribution Method. East Kilbride, Glasgow, Scotland, National Engineering Laboratory.
- Comparative kinetics of transesterification for biodiesel production from palm oil and mustard oil. Can. J. Chem. Eng.. 2012;90:342-350.
- [CrossRef] [Google Scholar]
- Determination of methanolysis rate constants for low and high fatty acid oils using heterogeneous surface reaction kinetic models. React. Kinet. Mech. Catal.. 2015;114:63-74.
- [CrossRef] [Google Scholar]
- Synthesis of biodiesel from pongamia oil using heterogeneous ion-exchange resin catalyst. Ecotoxicol. Environ. Saf.. 2015;121:3-9.
- [CrossRef] [Google Scholar]
- Optimization of the production of biofuel form Jatropha oil using a recyclable anion-exchange resin. Fuel. 2020;278:118253
- [CrossRef] [Google Scholar]
- Biodiesel production from yellow horn (Xanthoceras sorbifolia Bunge.) seed oil using ion exchange resin as heterogeneous catalyst. Bioresour. Technol.. 2012;108:112-118.
- [CrossRef] [Google Scholar]
- Preparation and characterization of mesoporous polymer-based solid acid catalysts for biodiesel production via transesterification of palmitic oils. Catal. Today. 2022;397–399:145-154.
- [CrossRef] [Google Scholar]
- La2O3/CaO catalyst derived from eggshells: Effects of preparation method and La content on textural properties and catalytic activity for transesterification. Catal. Commun.. 2021;149:106247
- [CrossRef] [Google Scholar]
- In-situ synergistic effect of ultrasonic irradiation and solvent addition for enhancing CaO catalyzed transesterification. Fuel. 2023;338:127305
- [CrossRef] [Google Scholar]
- The inhibiting behavior of glycerol on the kinetics of transesterification of palm oil. Appl. Biochem. Biotechnol.. 2019;187:1081-1095.
- [CrossRef] [Google Scholar]
- The properties of gases and liquids (5 ed.). McGraw Hill; 2000.
- Continuous biodiesel production in a fixed bed reactor packed with anion-exchange resin as heterogeneous catalyst. Bioresour. Technol.. 2012;113:19-22.
- [CrossRef] [Google Scholar]
- Kinetics of the NaOH-catalyzed transesterification of sunflower oil with ethanol to produce biodiesel. Fuel Process. Technol.. 2015;129:147-155.
- [CrossRef] [Google Scholar]
- Modeling the effects of cosolvents on biodiesel production. Fuel. 2016;186:779-786.
- [CrossRef] [Google Scholar]
- Esterification reaction of free fatty acid in used cooking oil using sulfonated hypercrosslinked exchange resin as catalyst. Chem. Eng. Res. Des.. 2022;180:414-424.
- [CrossRef] [Google Scholar]
- Biodiesel production from waste frying oils and its quality control. Waste Manag. (Oxf.). 2010;30:799-803.
- [CrossRef] [Google Scholar]
- Biodiesel production using anionic ion-exchange resin as heterogeneous catalyst. Bioresour. Technol.. 2007;98:416-421.
- [CrossRef] [Google Scholar]
- Phase equilibria of triolein to biodiesel reactor systems. Fluid Phase Equilib.. 2016;409:171-192.
- [CrossRef] [Google Scholar]
- Multicomponent mass transfer. New York: John Wiley & Sons Inc; 1993.
- A new co-solvent method for the green production of biodiesel fuel – Optimization and practical application. Fuel. 2013;103:742-748.
- [CrossRef] [Google Scholar]
- Mass transfer. New York: E. Horwood; 1990.
- Correlation of diffusion coefficients in dilute solutions. AIChE J.. 1955;1:264-270.
- [CrossRef] [Google Scholar]


