

Translate this page into:
Ultra-trace analysis of chromium ions (Cr3+/Cr6+) in water sample using selective fluorescence turn-off sensor with natural carbon dots mixed graphene quantum dots nanohybrid composite synthesis by pyrolysis
⁎Corresponding author. sakcha2@kku.ac.th (Saksit Chanthai)
-
Received: ,
Accepted: ,
This article was originally published by Elsevier and was migrated to Scientific Scholar after the change of Publisher.
Peer review under responsibility of King Saud University. Production and hosting by Elsevier.
Abstract
This study was aimed to implement the one-pot pyrolysis for hybrid nanomaterial synthesis consisting of graphene quantum dots (GQDs) from solid citric acid and carbon dots (CDs) which was hydrothermally derived from the herbal plant extract of “Houttuynia cordata”, denoted as Carbon Dots mixed Graphene Quantum Dots (CDs@GQDs). The nanohybrid were structurally characterized by XPS, FT-IR, Fluorescence, and UV–Visible absorption spectroscopy, and their morphological images were also analyzed by HR-TEM and FE-SEM/EDX. The quantum yield was found to be 15 %, higher than that of intact CDs or GQDs. Upon excitation at a maximum wavelength of 355 nm, and emission in the 450 nm. In this case, it was observed that the nanohybrid exhibit a high degree of selectivity towards Cr6+ ion when employed as a fluorescence quenching sensor from screening test with different metal ions. Therefore, the optimization conditions of solution pH, concentration of nanohybrid, H2O2 concentration as an oxidizing agent, reaction duration time with the aid of ultrasonication were carried out in details and the permissible limit of Cr3+ presence in the target analyte was all undertaken in order to enhance the detection of Cr6+ species. Its linear calibration curve was such y = 0.37x + 55.7, with a coefficient of determination (r2) value of 0.9816. The limit of detection (LOD) and limit of quantification (LOQ) was found to be 17.2 nM, and 52.2 nM. Consequently, the nanohybrid as a green chelating agent in the selective assessment of ultra-trace amount of Cr6+ in spiked water sample model was also done with good recoveries in both bottled drinking water and tap water samples ranging from 102.86 to 114.23 %.
Keywords
Herbal plant extract
Graphene quantum dots (GQDs)
Carbon dots (CDs)
Biosensor
Chromium ion

1 Introduction
High quantities of heavy metals are commonly detected as water contaminants, particularly in groundwater located in areas that have been impacted by industrial activities. The source of toxicity lies in the fact that heavy metals not only contaminate drinking water, but also the soil, leading to their accumulation in plants and animals. This accumulation poses substantial health risks to human beings. Since heavy metal pollution has a negative effect on the ecology, agricultural productivity, and human health, it has become a major worry in recent years (Tariq et al., 2021). Chromium ions are also heavy metals that can enter into soil and water sources through wastewater and solid waste as a result of its use in metallurgy, electroplating, metal processing, and other industrial industries. The stable states of Cr3+ and Cr6+ are what exist when Cr is introduced to the environment. Cr3+ being slightly less toxic than Cr6+, it can still have negative health effects, especially on the skin and lungs. When compared to Cr3+, Cr6+ has higher levels of toxicity, carcinogenicity, and mutagenicity (Sokoll et al., 2015; Shobana et al., 2017; Kart et al., 2016; Chen et al., 2019; Iztleuov et al., 2020). The hazardous metal hexavalent chromium (Cr6+) especially can cause lung cancer in the human, is well-known (Anderson et al., 1983; Machle and Gregorius, 1948; Rahman et al., 2020; Dayan and Paine, 2001; Chaabane et al., 2017; Suchana et al., 2020). Therefore, the assessment of chromium characteristics holds significant significance in the prompt detection and diagnosis of these problems. Currently, various analytical methods have been utilized in the determination of Cr3+ and Cr6+ ions, such as high-performance liquid chromatography (HPLC) (Almaguer-Busso et al., 2009), solid phase extraction (Vassileva et al., 2000), inductively coupled plasma mass spectrometry (ICP-MS) (Cieslak et al., 2013; Onchoke and Sasu, 2016), voltammetry (Abbasi and Bahiraei, 2012), capillary electrophoresis (Himeno et al., 1998), RP-HPLC (Hossain et al., 2005), and flame atomic absorption spectrometry (FAAS) (Zhan et al., 2019). Despite the high sensitivity and selectivity of these techniques, they necessitate laborious sample preparation and pre-concentration procedures, costly instrumentation, and trained people. The challenge of developing straightforward analytical methods for the detection of Cr3+ and Cr6+ ions in natural samples persists. The utilization of light-emitting quantum-sized grapheme quantum dots (GQDs) and carbon dots (CDs) has recently garnered significant interest as a potential alternative in various industries (Guo et al., 2013; Posthuma-Trumpie et al., 2012; Wang et al., 2018; Gontrani et al., 2022; Manjunatha et al., 2023; Manjunatha et al., 2021). The utilization of GQDs and CDs in chemical sensing for the purpose of detecting metal ions is highly attractive due to their advantageous characteristics, including facile synthesis, elevated quantum yield, enhanced sensitivity and selectivity, compatibility with biological systems, adjustable emission properties, cost-effectiveness, excellent photostability, and absence of toxicity (Wang et al., 2011; Nugroho et al., 2022; Tao et al., 2012; Gao et al., 2016; Morozan and Jaouen, 2012). Furthermore, GQDs and CDs exhibit exceptional optical, electrical, and thermal characteristics, in addition to the aforementioned properties. Combining sensors with the capability to detect harmful metal ions is widely regarded as a highly favored approach (Nugroho et al., 2022; Lim et al., 2015; Varun et al., 2018). Due to this rationale, it is imperative for GQDs and CDs to enhance their surface properties in order to achieve high selectivity, excellent sensitivity, differential sensitivity for limit of detection, user-friendly sensor operation, and robust stability (Lei et al., 2021; Tetsuka et al., 2016; Haider et al., 2016). Houttuynia Cordata has been a subject of interest for individuals across various cultures since antiquity. Houttuynia cordata, commonly known as Houttuynia cordata, a colorful nature, is a rhizomatous, herbaceous, and perennial plant that is indigenous to regions such as China, Japan, Korea, and Southwest Asia (Tetsuka et al., 2016). Typically, it exhibits growth patterns in areas characterized by shade and high levels of moisture (Lu et al., 2006). Historically, Houttuynia cordata has been utilized for medicinal purposes by individuals. A substantial body of scientific evidence supports the notion that Houttuynia cordata, whether in its entirety or in the form of derived extracts, has noteworthy therapeutic properties. Houttuynia cordata possesses a diverse array of chemical compounds that exhibit distinct therapeutic effects and can be classified into many chemical classes, including alkaloids, essential oils, and flavonoids (Park et al., 2005; Chiang et al., 2003; Chang et al., 2001; Li et al., 2017; Ma et al., 2017; Chou et al., 2009; Ahn et al., 2017).
This study introduces a newly designed fluorescence sensor probe and presents a method for the specific detection of Cr6+ in drinking water samples (see graphical abstract in Fig. 1). The synthesis of sensor probe CDs@GQDs hybrid composite involves the combination of carbon dots derived from the Houttuynia cordata extract with GQDs obtained from citric acid using a straightforward, environmentally friendly, and economically viable one-pot pyrolysis process. Nevertheless, there is a scarcity of documented findings regarding the utilization of CDs with GQDs for Cr6+ detection. The optical characteristics of CDs@GQDs exhibit remarkable selectivity and stability in detecting Cr6+. This study extensively examined the impact of solution pH, masking agents, and interfering ions. Subsequently, the established technique was employed to ascertain the concentration of hexavalent chromium (Cr6+) ions in authentic water samples.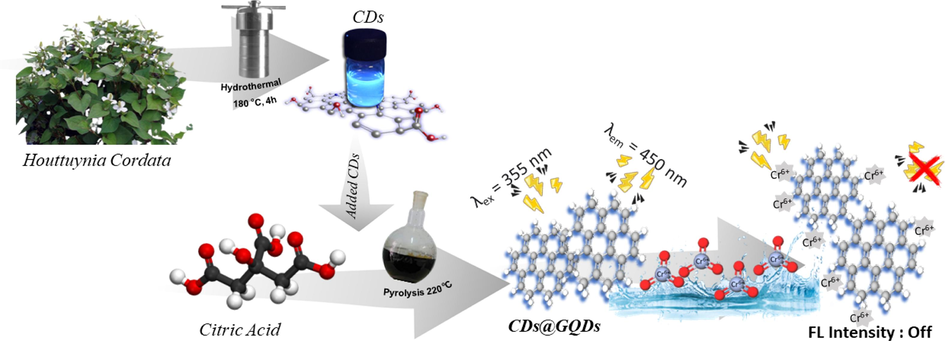
The graphical abstract of the as-synthetic CDs@GQDs hybrid composite for Cr6+ detection.
2 Materials and methods
2.1 Materials and reagents
All compounds utilized in this study were of analytical grade. The citric acid anhydrous (99.5 %) and sodium hydroxide mciropearls (99 %) used in this study were sourced from Carlo Erba, an Italian manufacturer. 50 % hydrogen peroxide was acquired from Paramount Chemical, an Australian supplier. The ethylenediaminetetraacetic acid (99.4 – 100.06 %) was procured from Sigma-Aldrich, a reputable supplier based in Germany. The procurement of paraffin oil liquid with density 25/25 was conducted through the acquisition from Ajex Finechem, an Australian supplier. The trials were conducted using deionized water obtained from the Simplicity Water Purification System, Model Simplicity 185, manufactured by Millipore in the United States.
2.2 Instruments and apparatus
The primary instrument employed for this study was a Shimadzu RF-5301PC Spectrofluorophotometer. The UV–visible spectrophotometer utilized in this study was the Agilent 8453 model. The following instruments were utilized in the experiment: the pH meter UB-10 UltraBasic, the analytical balance Model LX 220A, the quartz cell with a path length of 1 cm obtained from Fisher Scientific, and the Ultrasonic Cleaner Model VGT-2300. A measurement using attenuated total reflectance-Fourier transform infrared ATR-FTIR spectroscopy was conducted using a TENSOR27 system Fourier transform infrared spectrometer. The study employed transmission electron microscopy TEM with a Schottky field emission type electron gun. The EDX spectra were acquired using HITACHI S-3000 N scanning electron microscope (SEM). The citric acid pyrolysis experiment was conducted using a round bottom flask manufactured by Pyrex®. A heated plate equipped with a magnetic stirrer was used in conjunction with a paraffin oil bath. The CHNS method by using Thermoscientific Flash 2000 N/Protein analyzer.
2.3 Preparation of carbon dots (CDs) and graphene carbon dots (GQDs)
The preparation of carbon dots (CDs) involved the addition of 20 mL of Houttuynia cordata aqueous extract into a teflon cup for hydrothermal synthesis. The tank was then placed in an oven set at a temperature of 180 °C for a duration of 4 h. Following the completion of the synthesis process, centrifugation was carried out at a speed of 10000 rpm for a period of 10 min.
Graphene carbon dots (GQDs) has been prepared by one-pot synthesis pyrolysis method using 1 g citric acid into a 100 mL round bottom flask. The flask was then subjected to heating within the temperature range of 220–240 °C, utilizing a paraffin oil bath for a duration of around 5 min. Subsequently, the liquid combination was dissolved with the gradual addition of 50 mL of 0.25 M NaOH solution, with continuous agitation for a duration of 30 min.
2.4 Preparation of CDs@GQDs hybrid composite
5 mL of CDs and 1 g of citric acid add into a 100 mL round bottom flask. The flask was then subjected to heating witrahin the temperature range of 220–240 °C, utilizing a paraffin oil bath for a duration of around 5 min. Subsequently, the liquid combination was dissolved with the gradual addition of 50 mL of a 0.25 M NaOH solution, with continuous agitation for a duration of 30 min. The resultant hybrid nature of both CDs and GQDs, noted as “CDs@GQDs”, was kept cool in refrigerator (4 °C) until further use.
2.5 Screening test of various metal ions using fluorescence quenching effect
The fluorescence analysis using the CDs@GQDs was conducted with a Britton – Robinson buffer solution pH 12.2. In the subsequent trials, a solution of CDs@GQDs with a concentration of approximately 100 mgL-1 was thoroughly mixed in a 10 mL volumetric flask. Subsequently, different quantities ranging from nM to mM of Mn+ were introduced into a portion of the CDs@GQDs solution, resulting in a final volume of 10 mL at ambient temperature. Various metal ions (Cr3+, Zu, Zn, Mg, Fe2+, Cr6+, Ni, Co, Fe3+, Mn, Cd, Pb) were applied under this experimental condition in the same manner. The fluorescence quenching sensor of each solution including CDs@GQDs was measured promptly at the excitation/emission maximum wavelengths of λex/λem = 355/460 nm.
2.6 Optimization study for chromium ions selectivity
The selective optimization for chromium (VI) detection was studied in this research including a variety of tests, such as reaction time, temperature, the effect of interfering ions on Cr6+ using different NaCl concentrations, the effect of pH solutions, and the effect of EDTA concentration. The oxidation effect of Cr3+ →Cr6+ with hydrogen peroxide (H2O2) was also studied in such case having the Cr3+ species being presence in the sample.
2.7 Method validation
Evaluation of an analytical method is consistently assessed based on its appropriateness for the intended purpose, recovery capability, need for standardization, sensitivity, stability of the analyte, ease of analysis, necessary skill set, as well as time and cost considerations, in that particular sequence. It is of utmost importance to rigorously ascertain, via a systematic procedure, the suitability of the analytical method in question for its intended objective. The determination of the limit of detection (LOD), limit of quantitation (LOQ), and percentage recovery (% Recovery) are critical parameters in the process of method validation within the field of analytical chemistry. Both LOD and LOQ are utilized to characterize the minimum concentration of an analyte that can be accurately determined by an analytical method. On the other hand, the percentage recovery is employed to ascertain the proportion of the original material that is obtained following the completion of a chemical reaction. In this study, the determination of LOD is performed using the formula LOD = 3SD/S, while LOQ is calculated using the formula LOQ = 10SD/S. In these calculations, SD denotes the standard deviation of the blank readings multiplied by three, and S indicates the slope of the linear regression plot. The calculation of recovery is performed using the formula % recovery = Cfound / Cadded x 100. In this context, Cfound denotes the concentration of the analyte subsequent to the introduction of a known quantity of standard into the actual sample. Cadded signifies the concentration of the analyte inside the actual sample, while Cadded reflects the concentration of the known quantity of standard that was spiked into the real sample (Pimsin et al., 2022; Nugroho et al., 2023).
2.8 Applicable detection of Cr6+ in spiked water sample
In order to evaluate the effectiveness of a fluorescence sensor utilizing CDs@GQDs for the Cr6+ detection in an artificial system, the suitability of this developed method for analyzing real water samples, such as tap water and drinking water, was investigated. Drinking water were purchase from market in Khon Kaen university, and untreated tap water samples were obtained from the Khon Kaen district and stored in polyethylene bottles. In this experimental protocol, a volume of 1 mL of the water sample was combined with 1 mL of a solution containing CDs@GQDs at a concentration of 100 mgL-1. The resulting mixture was then placed into a 10.0 mL volumetric flask. Subsequently, the individual sample mixture was spiked with different concentrations of Cr6+ standard solution (25, 50 & 75 nM) in a manner consistent with the recovery study, prior to conducting the fluorescence measurements.
3 Results and discussion
3.1 Characterization of the as-synthesized CDs@GQDs hybrid composite
3.1.1 FT-IR and XPS spectroscopy
The CDs@GQDs synthesized using a one-pot pyrolysis method were subjected to analysis of functional groups, elemental atoms, and chemical bonds using Fourier transform infrared spectrometry (FTIR) and X-ray photoelectron spectroscopy (XPS). The FTIR spectral analysis, as depicted in Fig. 2a, provides confirmation of the presence of specific peaks at approximately 3300 cm−1, which can be attributed to the vibrations of O–H (Chou et al., 2009). Additionally, the peak observed at 2930 cm−1 indicates the presence of methyl, methylene, and aromatic hydrogens within the chemical structure of the sample (Chou et al., 2009). The peak at 2345 cm−1 is consistent with the typical asymmetric stretching of adsorbed CO2 (Ahn et al., 2017). Furthermore, the peak observed at 1000 cm−1 is assigned to C–O bonds. These findings provide evidence that the CDs@GQDs hybrid are the nanoparticle product obtained from a fine coupling of GQDs derived from the pyrolysis of citric acid in the presence of the hydrothermally derived CDs from the herbal extract.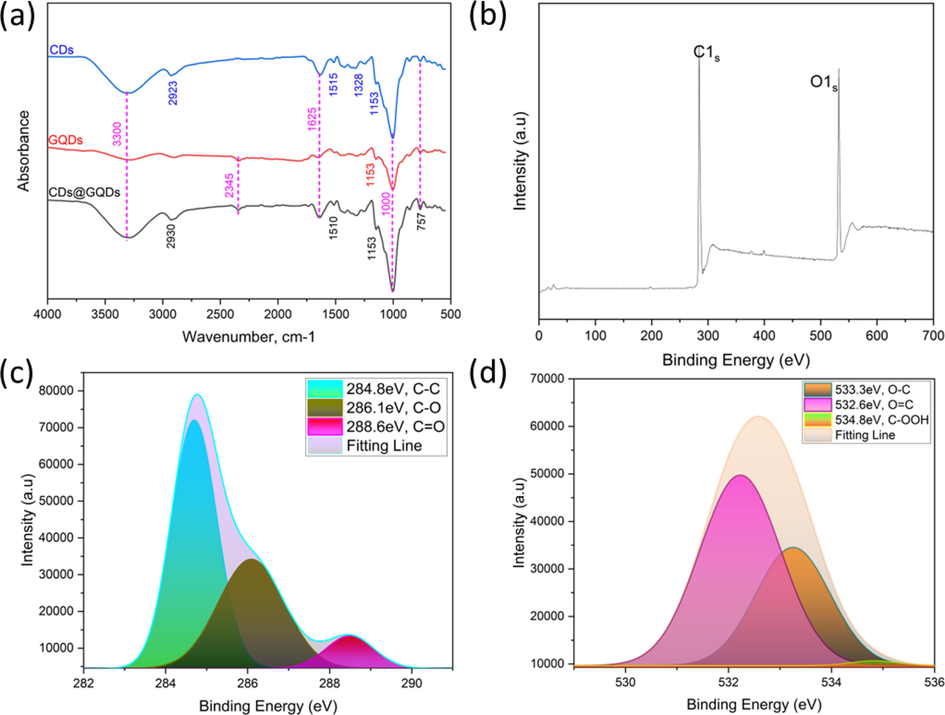
Spectroscopy characteristics of CDs@GQDs by (a) FTIR (b) XPS-Survey data of CDs@GQDs, and high resolution XPS spectra of (c) C1s and (d) O1s.
X-ray photoelectron spectroscopy (XPS) was utilized to ascertain the elemental compositions, carbon bonding, and oxygen bonding within the as-synthesized CDs@GQDs. Fig. 2b displays the survey spectrum of the CDs@GQDs. The observed peaks at approximately 284.04 and 532.08 eV may be attributed to the binding energy of carbon (C1s) and oxygen (O1s), respectively. In the case of C1s (Fig. 2c), the XPS analysis reveals the existence of C–C, C–O, and C = O functional groups. (Aumber et al., 2020) The deconvoluted binding energies corresponding to these groups are seen at 284.8, 286.1, and 288.6 eV, respectively. As depicted in Fig. 2d, the high-resolution XPS spectra of CDs@GQDs revealed a significant presence of oxygen functional groups. This observation suggests that the carbonization process of CDs@GQDs during pyrolysis was incomplete. Furthermore, the O1s spectra of CDs@GQDs exhibited three supplementary peaks at 533.3, 532.6, and 534.8 eV, which can be attributed to the O-C, O = C, and C-OOH bonds, respectively. (Aumber et al., 2020) The composition of the CDs@GQDs material consists of 57.91 % carbon and 42.09 % oxygen, as determined through the analysis of XPS spectra. Table 1 presents the elemental composition percentages of CDs, GQDs, and CDs@GQDs, as determined using CHNS analysis. The results indicate that the CDs@GQDs exhibit a carbon content of 60.31 % and a hydrogen one of 9.72 %.
Sample
C%
±SD, n = 3
H%
±SD, n = 3
CDs
53.46
1.06
11.87
1.45
GQDs
63.77
1.95
9.02
1.40
CDs@GQDs
60.31
1.41
9.72
1.17
3.1.2 HR-TEM and FE-SEM/EDX image analysis
The utilization of a field emission scanning electron microscope (FE-SEM) allows for the observation of a surface morphology with high resolution. This enables the examination of the surface texture variations of the manufactured carbon dots (CDs), graphene quantum dots (GQDs), and the hybrid CDs@GQDs. Furthermore, the FE-SEM analysis provides valuable insights into the distribution of elements within these materials. Fig. 3a displays a representative SEM picture of carbon dots (CDs). The CDs have a smooth, level surface and display a spherical appearance. Additionally, they possess the property of easily melting at room temperature. Fig. 3b illustrates the presence of broad ridges and a rough, yet regular, surface structure in GQDs. The successful functionalization of CDs and GQDs is demonstrated by the surface of CDs@GQDs, as depicted in Fig. 3c. The elemental compositions of CDs, GQDs, and CDs@GQDs are also verified by the energy-dispersive X-ray spectroscopy (EDX) as shown in Fig. 3d, e, and f, respectively. The CDs were discovered to have compositional constituents consisting of 76.7 % carbon (C) and 22.6 % oxygen (O), as depicted in Fig. 3d. The GQDs exhibited a compositional element consisting of 54.1 % carbon (C) and 44.2 % oxygen (O) (Fig. 3e). The compositional constituents of the CDs@GQDs were determined to be 64.2 % carbon (C) and 33.8 % oxygen (O) (Fig. 3f). It was reliable that the in situ GQDs produced in the presence of the CDs would attribute to disrupt their structural environment of the hybrid nanoparticles. In addition, transmission electron microscopy (TEM) examination was conducted to examine the structural and morphological characteristics of the hybrid samples, demonstrating homogeneous layer texture. The particle size of the CDs@GQDs is observed to be around ± 2.7 nm as shown in Fig. 3g.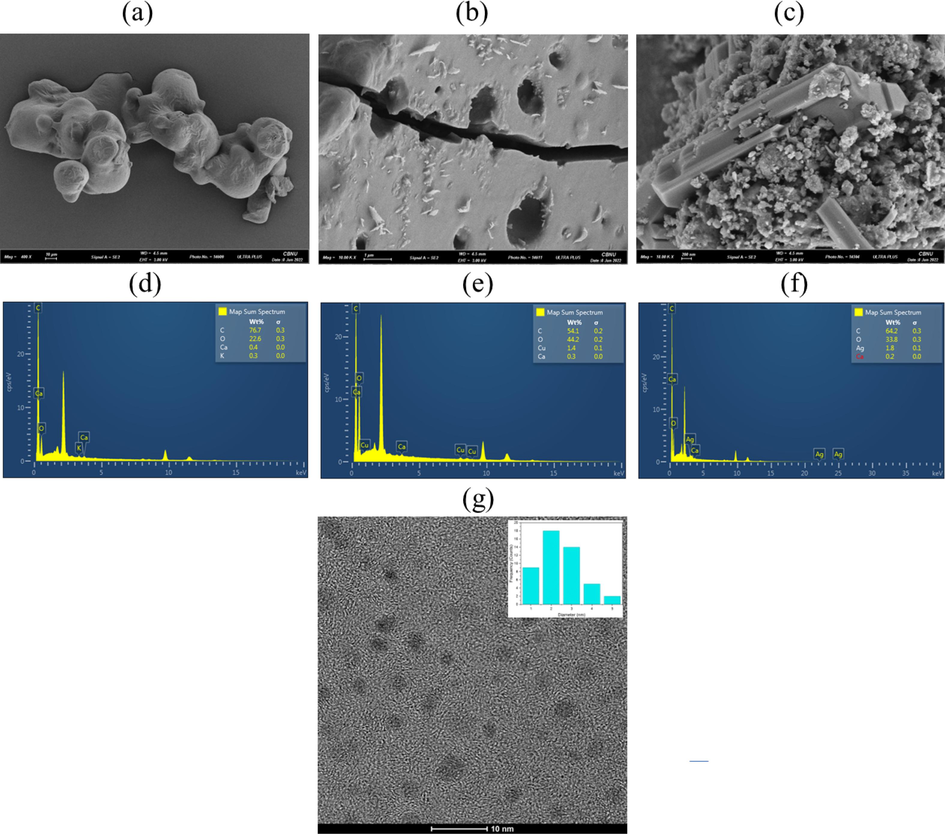
FE-SEM images of (a) CDs (b) GQDs & (c) CDs@GQDs, and EDX of (d) CDs (e) GQDs & (f) CDs@GQDs, and (g) TEM image of CDs@GQDs.
3.2 Optical properties of the CDs@GQDs
3.2.1 Fluorescence property and relative quantum yield
Fig. 4 depicts the fluorescence spectra of the carbon dots (CDs), graphene quantum dots (GQDs), and the hybrid composite CDs@GQDs. The CDs exhibit emission and excitation maximum wavelengths at 340 and 438 nm, respectively, with an intensity of 300 relative arbitrary unit. On the other hand, GQDs exhibit emission and excitation maximum wavelengths at 360 and 460 nm, respectively, with an intensity of 440 rel. arb. unit. Upon the CDs doped into GQDs, resulted the nanohybrid composite CDs@GQDs, the intensity significantly increases up to 980 rel.arb. unit with their emission and excitation wavelengths of 355 and 450 nm, respectively under the same slit width of the instrument. The quantum yields (Q) of CDs, GQDs, and CDs@GQDs were determined through a comparative analysis of their integrated fluorescence intensities and absorbance values in relation to quinine sulfate. The Q = 0.54 of the quinine standard solution, when dissolved in a 0.1 M H2SO4 solution, is used as reference. Table 2 presents a compilation of the quantum yields associated with various doping materials. The fluorescence quantum yields (FQ) of the synthesized CDs, GQDs, and the hybrid CDs@GQDs were determined to be 8 %, 13 % and 15 %, respectively. The FQ of CDs, GQDs and CDs@GQDs was calculated with the following equation from a|e - UV–Vis-IR Spectral Software (Fletcher, 1969; Pimsin et al., 2022). From diffused reflectance spectra, the calculation of band gap energy using Tauc Plot of CDs, GQDs and CDs@GQDs were done as shown in Fig. 4c and Fig. 4d, their band gap energy of CDs@GQDs (5.06 eV) is quite wider than those of CDs (4.94 eV) and GQDs (4.90 eV).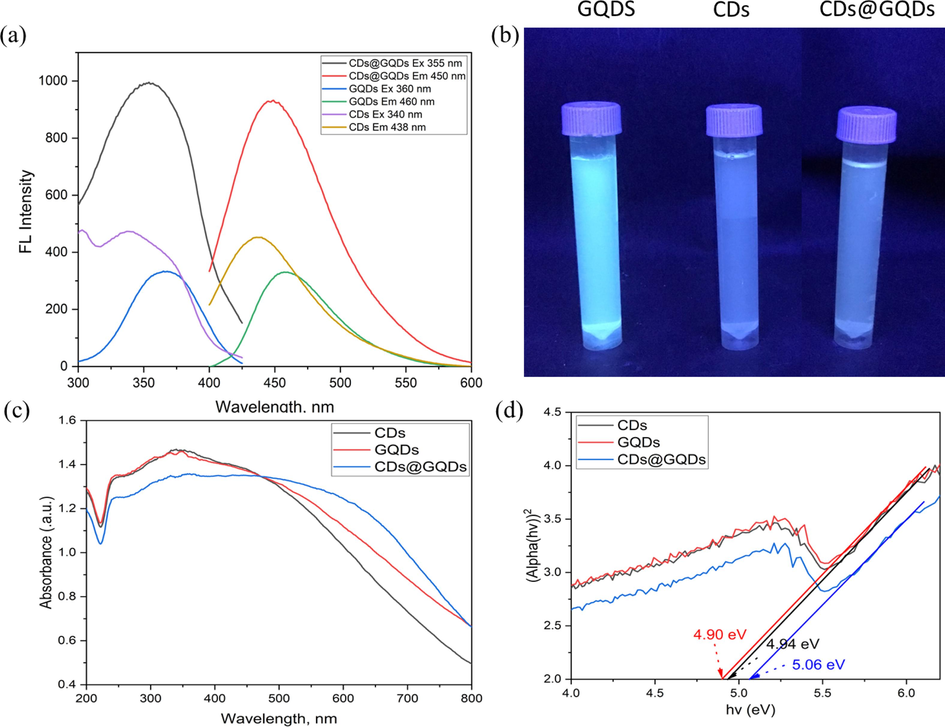
The Fluorescence spectra of CDs, GQDs and CDs@GQDs under the optimum conditions, (b) comparison of the instinct blue solution of CDs, GQDs and CDs@GQDs under commercial UV light. (For interpretation of the references to colour in this figure legend, the reader is referred to the web version of this article.)
Material
Quantum yield (%)
CDs
8
GQDs
13
CDs@GQDs
15
3.3 Fluorescence quenching effect of Cr6+using CDs, GQDs and CDs@GQDs
The selectivity test of the CDs for various metal ions (Cr3+, Zu, Zn, Mg, Fe2+, Cr6+, Ni, Co, Fe3+, Mn, Cd, Pb) is shown in the Fig. 5a. The CDs from Houttuynia cordata extract gave its selectivity with Fe2+. Fe2+ exhibits strong affinity towards of CDs, and it becomes high potential selectivity with the CDs. Fig. 5b shows the results of the metal ions detection experiments using GQDs, indicating that the GQDs have the quenching effect of Fe2+ and Cr6+ with having their intensity that are not significantly distinct. After CDs doped with the GQDs the selectivity for detection heavy metal ion was selective to detect hexavalent chromium (Cr6+) only as clearly shown on Fig. 5c. The quenching effect of CDs@GQDs as determined by F0 − F, where F0 and F are the fluorescent intensities of blank and with different concentrations of the metal ions shown in the Fig. 5d, respectively. The experiments were involved doing fluorescence quenching tests using different heavy metal ions (0.5 M). It was observed that the presence of Cr6+ ions resulted in a significant reduction of around 89 % in the fluorescence emission of the carbon dots. The significant and specific suppression of fluorescence exhibited by Cr6 + ions can be attributed to the formation of hydrogen bonds between Cr6 + and carbon dots. This interaction inhibits the release of fluorescence emissions, which results in a low intensity of fluorescence (Bu et al., 2016; Onchoke and Sasu, 2016).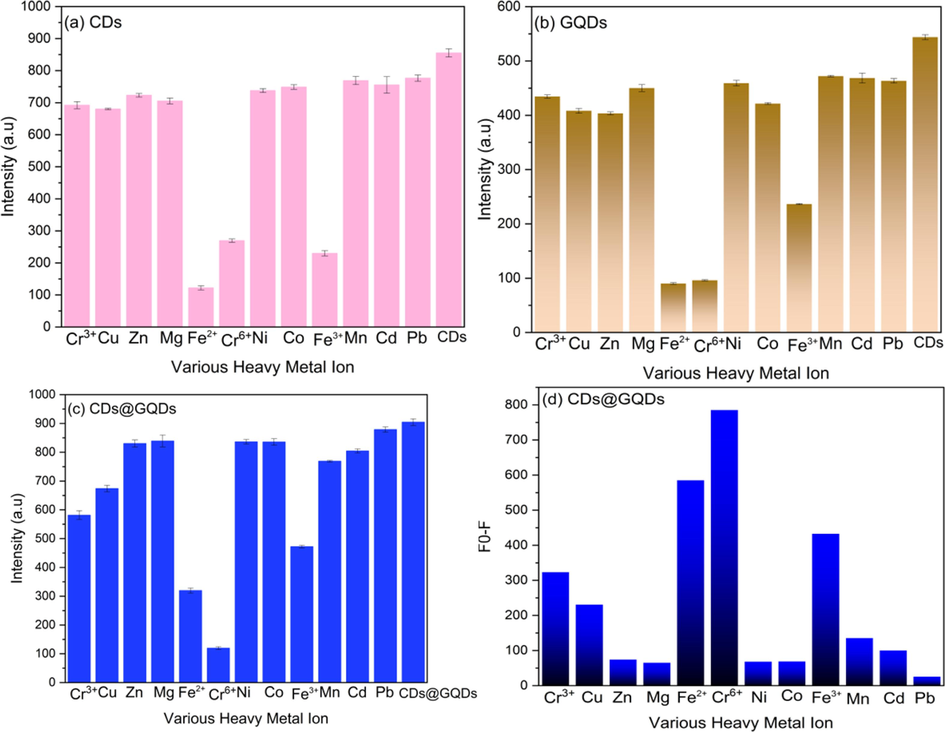
Comparison of the fluorescent intensities of various metal ions by using (a) CDs, (b) GQDs and (c) CDs@GQDs (n = 3), and (d) Fo - F of CDs@GQDs represents the quenching effect of heavy metal ions.
3.4 Effect of EDTA as general masking agent for heavy metals
In order to investigate the efficacy of EDTA as a broad-spectrum masking agent for the detection of heavy metal ions in an aqueous sample, various concentrations of EDTA (0.01, 0.1, 0.25, 0.5 and 1 M) were added into a solution containing 100 uL of CDs@GQDs. Additionally, 10 uL of Cr6+ ion with a concentration of 0.5 M were included in the solution. The resulting mixture was then adjusted to a final volume of 10 mL in a volumetric flask, after which fluorescence measurements were conducted. The obtained fluorescence spectra were subsequently recorded and depicted in Fig. 6. The addition of EDTA did not exhibit any significant alterations or any discernible impact on the reaction between Cr6+and the CDs@GQDs.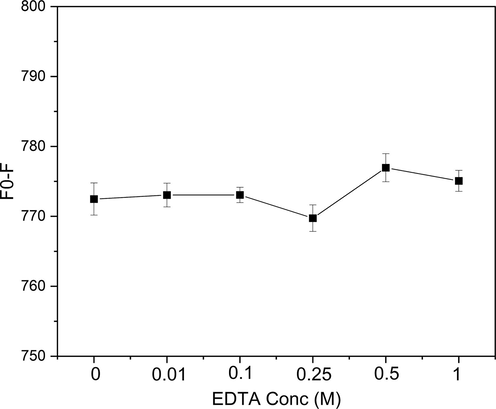
Effect of EDTA concentrations for Cr6+ detection.
3.5 Effect of solution pH
The effect of the solution pH towards the fluorescence quenching of CDs@GQDs was also studied by adding various pH values into 0.5 M of Cr6+. According to the results on Fig. 7, the solution pH ranges of 3 to 13 gave a significant effect for Cr6+ detection with the optimal condition pH 12. Therefore, the solution pH 12 was preferred for further study in this study.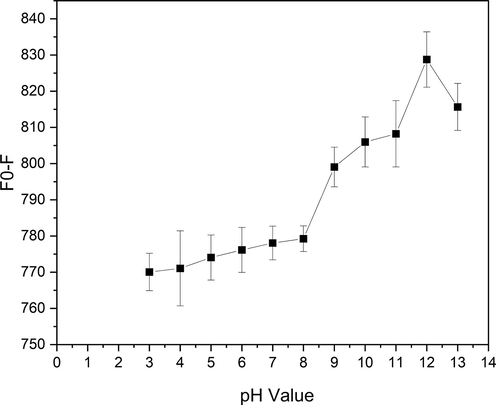
Effect of the solution pH on Cr6+ detection.
3.6 Effect of H2O2 in the oxidation of Cr3+ to become Cr6+expressed as total amount of Cr
The effect of Cr3+ on the determination of Cr6+ in the sample solution by this proposed fluorescence quenching sensor was studied. Three concentration ranges (0.5 uM, 0.5 mM & 0.5 M) of each Cr3+ and Cr6+ were prepared and mixed with CDs@GQDs as shown in Fig. 8a. It was found that Cr3+ mixed with Cr6+ did not show any effect for selectivity test. The oxidation effect of Cr3+ was studied by using various concentrations of H2O2. Fig. 8b shows when increasing the concentration of H2O2 with 0.5 M Cr3+, the optimum condition of H2O2 was about 15 %.
(a) Comparison of three concentration ranges of Cr3+ (0.5 uM, 0.5 mM & 0.5 M) and Cr6+ (0.5 uM, 0.5 mM & 0.5 M) via the fluorescence quenching effect of Cr3+ (b) Oxidation effect of H2O2 concentrations on Cr3+ vs Cr6+ (without H2O2) as reference.
3.7 Effect of reaction time and temperature of CDs@GQDs with Cr6+
The reaction between CDs@GQDs and 0.5 nM Cr6+ at different time intervals and temperatures was carried out. The results are presented in Fig. 9a. When CDs@GQDs were combined with Cr6+ under two different conditions, one involving sonication and the other without sonication, it was observed that the reaction time from 1 min until 15 min did not affect the desired intensity in two of condition. However, the temperature reaction of CDs@GQDs and Cr6+ had a significant impact on the fluorescence reaction especially at 45 °C the F0-F show higher than other conditions as shown in Fig. 9b.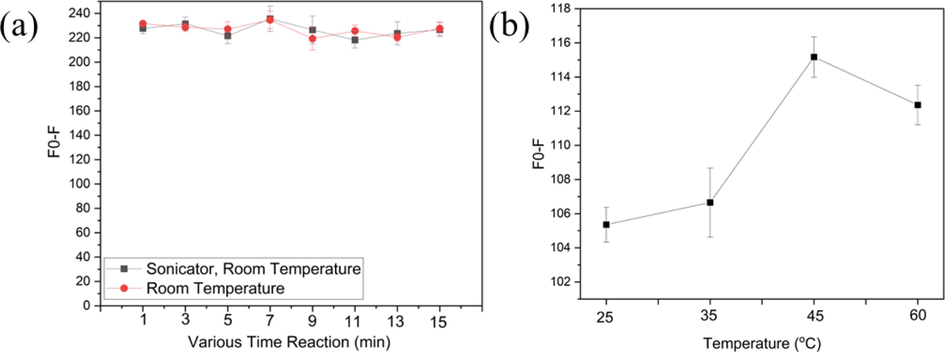
(a) Effects of various time duration reaction between normal condition and under sonicator at room temperature, and (b) the effect of heating temperature on the fluorescence quenching effect of Cr6+.
3.8 Effect of an ionic strength
The effect of sodium chloride (NaCl) as an ionic strength on the interactions between Cr6+ and the CDs@GQDs nanohybrid composite has been studied, various condition of NaCl has been applied (0.1, 0.5, 1, 2.5 and 5 M). Fig. 10 depicts the influence of a 5 M NaCl solution on the detection of Cr6+, somewhat leading to enhanced selectivity of the fluorescence quenching system.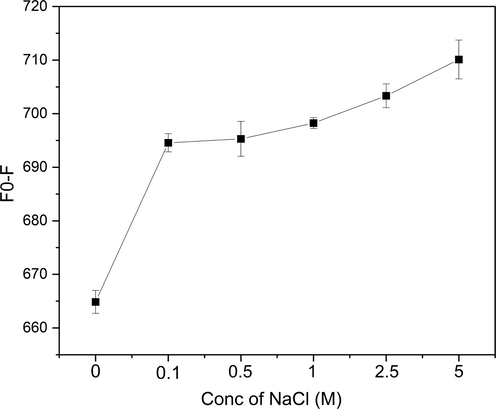
Effect of ionic strength using various concentrations of NaCl on the fluorescence quenching effect of Cr6+.
3.9 The analytical characteristics of the developed fluorescence sensing probe
With the aim to examine the effectiveness of the fluorescence quenching sensor in the target detecting of Cr6+, the developed methodology was subjected to a validation process for quantitative purposes. This validation method includes the evaluations of linearity, detection limit (LOD), quantification limit (LOQ), accuracy (as % recovery) and precision (as % reproducibility).
3.9.1 Linearity
A study on linearity was conducted to examine the impact of varying concentrations of Cr6+ on the fluorescence intensity of CDs@GQDs. Fig. 11 illustrates the fluorescence spectra of the CDs@GQDs at varying doses of Cr6+ and Cr3+ plus H2O2. The spectral analysis reveals that the fluorescence intensity of the CDs@GQDs exhibit a high degree of sensitivity in response to variation in the Cr6+ concentration. The fluorescence intensity exhibits a decrease as the concentration of Cr6+ increases. Therefore, the determination of the quenching efficiency of Cr6+ was conducted using the linear equation (Fo − F), where Fo represents the fluorescence intensity of the blank and F represents the fluorescence intensity with varying concentrations of the metal ion. The experiments were involved conducting a quenching test at low concentrations at nanoscale: 5, 25, 50, 75, and 100 nM of Cr6+ (with a regression line of y = 0.42x + 54.4 and an r2 value of 0.96) and Cr3+ plus H2O2 (with a regression line of y = 0.30x + 33.1 and an r2 value of 0.99) as shown in Fig. 11. These results indicate a strong correlation and accurate detection of the concentration of Cr6+ ions. The findings of this study suggest that the CDs@GQDs nanohybrid composite possess the potential to serve as a novel sensor with exceptional selectivity and sensitivity in the determination of Cr6+.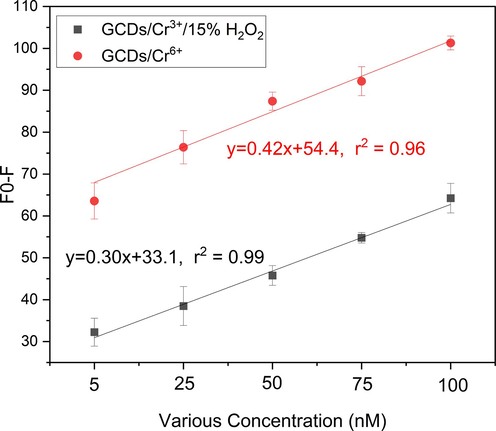
Linear calibration plots of Fo - F versus various concentrations (5–100 nM) of (a) Cr6+ (a) and (b) Cr3+ plus H2O2.
3.9.2 LOD and LOQ
The general statistical concept used to calculate the limit of detection (LOD) and limit of quantification (LOQ) were as follows: LOD = 3SD/S and LOQ = 10SD/S. In these calculations, SD represents the standard deviation of three times the blank readings, and S represents the slope of the linear regression plot. The compilation of LOD and LOQ calculations are given in Table 3. The findings derived from both two linear curves for the detection of Cr6+ are as follows: the detection concentration range spans from 5 to 100 nM, with a limit of detection (LOD) of 15.76 nM and a limit of quantification (LOQ) of 47.76 nM. Similarly, the utilization of Cr3+ plus H2O2 also enables the detection of a concentration range from 5 to 100 nM, with LOD of 7.59 nM and LOQ of 23.01 nM. From this finding, total contents of Cr ions can be obtained from those data summation as mentioned above (Pimsin et al., 2022; Nugroho et al., 2023).
Linear curve
Regression equation
R2
LOD (nM)
LOQ (nM)
Cr6+
y = 0.42x + 54.4
0.96
15.76
47.76
Cr3+ plus H2O2
y = 0.30x + 33.1
0.99
7.59
23.01
3.10 Application model for water sample analysis
The fluorescence quenching sensor was utilized to measure the concentration of chromium (VI) ions in some sample matrices, including drinking water and tap water, under the optimal conditions. The method accuracy was assessed by conducting a recovery study on the real water samples. The samples were augmented with three concentration ranges (25, 50, and 100 nM) of the Cr6+ standard solution. Next, the relative percentage recoveries were determined using the formula: % recovery = [Cfound / Cadded] x 100, where, Cfound represents the concentration of the analyte after adding a known amount of standard to the real sample and Cadded represents the concentration of the known amount of standard that was added to the real sample. The results of this calculation are presented in Table 4 and it’s shown that the % recovery of drinking water that has been collected (sample 1 until 3) after spike Cr6+.in the range (0 – 75 nM) is around 89.3 – 110 %, and for the ta water (sample 1 and 2) in range 98.02 % − 114.23 %, The variation in numerical values observed in the %recovery, accompanied by the occurrence of an amount spike of sample Cr6+, may be attributed to the potential influence of other minerals that can impact the operational efficacy of CDs@GQDs.
Sample
Cr6+ added (nM)
Concentration found
(±SD, n = 5)% Recovery
Drinking water 1
0
–
–
25
22.46 ± 2.98
89.85
50
53.42 ± 3.45
106.85
75
66.99 ± 3.17
89.32
Drinking water 2
0
–
–
25
27.56 ± 3.98
110.24
50
54.11 ± 4.65
108.23
75
72.65 ± 3.16
96.86
Drinking water 3
0
–
–
25
25.86 ± 1.06
103.44
50
51.43 ± 4.37
102.86
75
77.83 ± 2.73
103.77
Tap water 1
0
–
–
25
24.51 ± 1.46
98.02
50
53.88 ± 2.31
107.76
75
83.30 ± 1.11
111.06
Tap water 2
0
–
–
25
26.66 ± 3.07
106.63
50
57.11 ± 3.11
114.23
75
82.92 ± 2.16
110.56
4 Conclusion
This study aimed to employ the one-pot pyrolysis method to produce graphene quantum dots (GQDs) from solid citric acid in the presence of hydrothermally derived carbon dots (CDs) obtained from the Houttuynia cordata plant extract to become the so-called novel CDs@GQDs nanohybrid composite. The CDs@GQDs were subjected to several characterization and morphology image techniques including X-ray photoelectron spectroscopy (XPS), transmission electron microscopy (TEM), field emission scanning electron microscopy with energy-dispersive X-ray spectroscopy (FE-SEM/EDX), Fourier-transform infrared spectroscopy (FT-IR), fluorescence spectroscopy, and UV–Visible absorption spectroscopy. Their quantum yield (15 %) was also determined. The CDs@GQDs demonstrate a significant level of fluorescence intensity, reaching its peak wavelength at 450 nm, when subjected to excitation at 355 nm. The optimization parameters affecting the detection of ultra-trace analysis of Cr6+ were investigated in details, including the effects of solution pH, concentration of EDTA as masking agent, ionic strength, reaction time including temperature, and oxidation of Cr3+ with 15 % H2O2. The analytical properties of the developed approach were effectively validated. Consequently, the recovery study involving the spiked Cr6+ solution into real samples (drinking water and tap water), yielded the results with satisfied accuracy and reproducibility. Consequently, the successful application of the CDs@GQDs nanohybrid composite as a green chelating sensor has enabled the selective measurement of trace amounts of Cr6+ in real water samples, hence enhancing its sensitivity in nanoscale level.
Acknowledgements
The authors thank Materials Chemistry Research Center (MCRC), Department of Chemistry, Faculty of Science, and Center of Excellence for Innovation in Chemistry (PERCH-CIC), Khon Kaen University Consortium, Khon Kaen, Thailand for financial support.
Declaration of competing interest
The authors declare that they have no known competing financial interests or personal relationships that could have appeared to influence the work reported in this paper.
References
- Ultra trace quantification of chromium(VI) in food and water samples by highly sensitive catalytic adsorptive stripping voltammetry with rubeanic acid. Food Chem.. 2012;133:1075-1080.
- [Google Scholar]
- Alkaloids from Aerial parts of houttuynia cordata and their anti-inflammatory activity. Bioorganic Med. Chem. Lett.. 2017;27:2807-2811.
- [Google Scholar]
- A comparative study of global hexavalent chromium removal by chemical and electrochemical processes. Electrochem. Commun.. 2009;11:1097-1100.
- [Google Scholar]
- Effects of chromium supplementation on urinary Cr excretion of human subjects and correlation of Cr excretion with selected clinical parameters. J. Nutr.. 1983;113:276.
- [Google Scholar]
- High yield synthesis of graphene quantum dots from biomass waste as a highly selective probe for Fe3+ sensing. Sci Rep.. 2020;10:21262.
- [Google Scholar]
- Fluorescent carbon dots for the sensitive detection of Cr(vi) in aqueous media and their application in test papers. RSC Advances. 2016;6:95469-95475.
- [Google Scholar]
- Chaabane, M., Elwej, A., Ghorbel, I., Boudawara, T., Zeghal, N., Soudani, N., Citrus aurantium, L. 2017. Peel extract mitigates hexavalent chromium-induced oxidative stress and cardiotoxicity in adult rats. Pharmaceutical and Biomedical Research. 3, 8-18.
- Atileukemic activity of bidenspilosa l. Var. minor (Blume) sherff and houttuynia cordata thunb. Am. J. Chin. Med.. 2001;29:303-312.
- [Google Scholar]
- Molecular and epigenetic mechanisms of Cr (VI)-induced carcinogenesis. Toxicol. Appl. Pharmacol.. 2019;377:114636
- [Google Scholar]
- Anti-Herpes Simplex Virus Activity of Bidens Pilosa and Houttuynia Cordata. Am. J. Chin. Med.. 2003;31:355-362.
- [Google Scholar]
- The constituents and their bioactivities of houttuynia cordata. Chem. Pharm. Bull.. 2009;57:1227-1230.
- [Google Scholar]
- Highly sensitive measurement of whole blood chromium by inductively coupled plasma mass spectrometry. Clin. Biochem.. 2013;46:266-270.
- [Google Scholar]
- Mechanisms of chromium toxicity, carcinogenicity and allerginicity: Review of the literature from 1985 to 2000. Hum. Exp. Toxicol.. 2001;20:439.
- [Google Scholar]
- Quinine sulfate as A fluorescence quantum yield standard. J. Photochem. Photobiol. 1969:439-444.
- [Google Scholar]
- A fluorescent probe based on N-doped carbon dots for highly sensitive detection of Hg2+ in aqueous solutions. Anal. Methods.. 2016;222:965-971.
- [Google Scholar]
- Highly specific silver ion detection by fluorescent carbon quantum dots. Chemosensors. 2022;10:362.
- [Google Scholar]
- Hydrothermal synthesis of highly fluorescent carbon nanoparticles from sodium citrate and their use for the detection of mercury ions. Carbon.. 2013;52:583-589.
- [Google Scholar]
- Electrical-polarization-induced ultrahigh responsivity photodetec tors based on graphene and graphene quantum dots. Adv. Funct. Mater.. 2016;4:620-628.
- [Google Scholar]
- Simultaneous determination of chromium(VI) and chromium(III) by capillary electrophoresis. Anal Sci.. 1998;14:369-373.
- [Google Scholar]
- Rapid speciation analysis of Cr(VI) and Cr(III) by reversed-phase high-performance liquid chromatography with UV detection. J Chromatogr Sci.. 2005;43:98-103.
- [Google Scholar]
- The effect of sodium tetraborate on chromium-induced oxidative damages in rats lung tissue. Biomed Pharmacol J. 2020;13
- [Google Scholar]
- The therapeutic role of glutathione in oxidative stress and oxidative DNA damage caused by hexavalent chromium. Biol. Trace Elem. Res.. 2016;174:387-391.
- [Google Scholar]
- Effect of various mass ratios of graphene quantum dots doping on the photoelectric performance of ZnSe-GQDs nanocomposites. Mater Sci Semicond Process.. 2021;128:105740
- [Google Scholar]
- Sciences, A. antibacterial effect of the water extract of houttuynia cordata water extract against multi-drug resistant. Southeast Asian J. Trop. Med. Public Health. 2017;48:1260-1266.
- [Google Scholar]
- Anti-Inflammatory Effect of Houttuynia Cordata Injection. J. Ethnopharmacol.. 2006;104:245-249.
- [Google Scholar]
- Bioactive alkaloids from the aerial parts of houttuynia cordata. J. Ethnopharmacol.. 2017;195:166-172.
- [Google Scholar]
- Cancer of the respiratory system in the United States chromate-producing industry. Public Health Redp.. 1948;63:1114-1127.
- [Google Scholar]
- Antimicrobial and nonlinear optical studies of copper oxide nanoparticles. J. Electron. Mater.. 2021;50:3415-3421.
- [Google Scholar]
- Synthesis, structural features, and optical limiting application of silicon carbide nanoflakes. J Mater Sci: Mater Electron.. 2023;34:1885.
- [Google Scholar]
- Metal organic frameworks for electrochemical applications. Energy Environ Sci.. 2012;5:9269-9290.
- [Google Scholar]
- R. improving minutiae image of latent fingerprint detection on non-porous surface materials under UV light using sulfur doped carbon quantum dots from magnolia grandiflora flower. Nanomaterials.. 2022;12:3277.
- [Google Scholar]
- Highly sensitive fingerprint detection under UV light on non porous surface using starch-powder based luminol-doped carbon dots (N-CDs) from tender coconut water as a green carbon source. Nanomaterials. 2022;12:400.
- [Google Scholar]
- Fluorophores-rich natural powder from selected medicinal plants for detection latent fingerprints and cyanide. Science Progress. 2023;106:1.
- [Google Scholar]
- Determination of Hexavalent Chromium (Cr(VI)) Concentrations via Ion Chromatography and UV-vis Spectrophotometry in Samples Collected from Nacogdoches Wastewater Treatment Plant, East Texas (USA) Adv. Environ. Chem 2016:10.
- [Google Scholar]
- Determination of hexavalent chromium (Cr(VI)) concentrations via ion chromatography and UV-Vis spectrophotometry in samples collected from nacogdoches wastewater treatment plant, East Texas (USA) Advances in Environmental Chemistry 2016:1-10.
- [Google Scholar]
- Anti-inflammatory activity of herbal medicines: Inhibition of nitric oxide production and tumor necrosis factor-α secretion in an activated macrophage-like cell line. Am. J. Chin. Med.. 2005;33:415-424.
- [Google Scholar]
- Selective Fe(II)-fluorescence sensor with validated two-consecutive working range using N, S, I-GQDs associated with garlic extract as an auxiliary green chelating agent, RSC. Advances. 2022;12:14356-14367.
- [Google Scholar]
- Amorphous carbon nanoparticles: a versatile label for rapid diagnostic (immuno)assays. Anal. Bioanal. Chem.. 2012;402:593-600.
- [Google Scholar]
- Assessment of hexavalent chromium pollution in Buriganga and Dhaleshwari river water bodies adjacent to Tannery Estates in Bangladesh. MIST Int J Sci Tench. 2020;08:11-15.
- [Google Scholar]
- Transient gestational exposure to drinking water containing excess hexavalent chromium modifies insulin signaling in liver and skeletal muscle of rat progeny. Chem. Biol. Interact.. 2017;277:119-128.
- [Google Scholar]
- Biochemical parameters in Japanese quails Coturnix coturnix japonica infected with coccidia and treated with Toltrazuril. Pol. J. Vet. Sci.. 2015;18:79.
- [Google Scholar]
- Chromium exposure causes structural aberrations of erythrocytes, gills, liver, kidney, and genetic damage in striped catfish pangasianodon hypophthalmus. Biol. Trace Elem. Res. 2020:1-17.
- [Google Scholar]
- In vivo NIR fluorescence imaging, biodistribution, and toxicology of photoluminescent carbon dots produced from carbon nanotubes and graphite. Small Journ.. 2012;8:281-290.
- [Google Scholar]
- Mesopores silica nanotubes-based sensors for the highly selective and rapid detection of Fe2+ ions in wastewater, boiler system units and biological samples. Anal. Chim. Acta.. 2021;1180:331180
- [Google Scholar]
- Graphene/nitrogen - functionalized graphene quantum dot hybrid broadband photodetectors with a buffer layer of boron nitride nanosheets. Nanoscale.. 2016;47:19677-19683.
- [Google Scholar]
- Synthesis and spectroscopic studies of functionalized graphene quantum dots with diverse fluorescence characteristics. RSC Adv.. 2018;8:11446-11454.
- [Google Scholar]
- Chromium speciation analysis by solid-phase extraction on a high surface area TiO2. Anlst.. 2000;125:693-698.
- [Google Scholar]
- Carbon dots of different composition and surface functionalization: cytotoxicity issues relevant to fluorescence cell imaging. Exp. Biol. Med.. 2011;236:1231-1238.
- [Google Scholar]
- Facile one-step synthesis of highly luminescent N-doped carbon dots as an efficient fluorescent probe for chromium(vi) detection based on the inner filter effect. Ne J Chem.. 2018;42(5):3729-3735.
- [Google Scholar]
- Detection of hexavalent chromium by copper sulfide nanocomposites. Anal. Chem.. 2019;91:2058-2065.
- [Google Scholar]


