

Translate this page into:
Ultrasound-assisted fabrication and characterization of a novel UV-light-responsive Er2Cu2O5 semiconductor nanoparticle Photocatalyst
⁎Corresponding author. salavati@kashanu.ac.ir (Masoud Salavati-Niasari)
-
Received: ,
Accepted: ,
This article was originally published by Elsevier and was migrated to Scientific Scholar after the change of Publisher.
Peer review under responsibility of King Saud University.
Abstract
The photocatalytic procedure is one of the most favorable methods for the elimination of poisonous organic dyes to achieve clean drinking water. In this research, a fast sonochemistry method was accomplished to attain Er2Cu2O5 (ECO) nanoparticles with a progressive photo-degradation catalytic routine. Tetraethylenepentamine (TEPA) was operated as both alkaline and complexing agents to control growth of designed nuclei due to the formation of hydrogen bonds between active surface groups of TEPA and nuclei and, lastly stop nano-product accumulation. The ultrasonic time and power factors in sonochemistry reaction were improved to control the final nanostructures properties. The surface features of products were measured via diverse characterization systems of spectroscopic and microscopic. The elimination of dissimilar artificial dyes was carried out through Er2Cu2O5 nanoparticle catalysts. The outcome of altering of artificial pollutant, pollutant concentration, scavenger, nano-catalyst dosage and solution pH was titled on the proficiency of nano-catalyst utility. Optimized Er2Cu2O5 nanoparticles have an efficiency of 97% for degradation of erythrosine dye in an acidic medium. The possible mechanism of deletion dye by photocatalytic purpose was studied and concluded that •O2– radicals help UV-degradation of contamination.
Keywords
Nanostructures
Sonochemical
Er2Cu2O5
Photocatalyst

1 Introduction
A hazardous crisis is currently the deficiency of potable water sources due to the being of poisonous organic contaminations in aqueous backgrounds. Many procedures to eliminate artificial contaminations from potable sources are nanofiltration, biosorption, adsorbent and photo-degradation catalysts (Zhu et al., 2020; Ighalo and Eletta, 2020; Fujioka et al., 2021). Due to the preferences of extraordinary stability, low energy usage, environmental and economic friendly of photocatalysts, the UV and visible sensitive nanocatalysts have attracted more consideration (Saravanan et al., 2020). Nano photocatalysts absorb the photons, then the electrons and positive holes create at conduction and valence bands and eventually, the OH•, O2• and H2O2 oxidants could expertly oxidize pollutants into innocuous carbon dioxide and water specimens (Hitam and Jalil, 2020).
Various photocatalysts including graphene nanocomposites (Sayadi et al., 2021; Mandal et al., 2020), binary oxides (Hitam and Jalil, 2020; Aadil et al., 2021) and ternary nano-products (Zhao et al., 2020) have recently been studied. Erbium cuprate (Er2Cu2O5) semiconductor nano-sample has a suitable presentation in different requests due to its magnetic, electric and dielectric properties (Knebel et al., 1994; Chepurko et al., 1991; Garca-Muoz et al., 1991). So far, Er2Cu2O5 nano-sized structures have been mostly created via solid-state techniques (Garcia-Munoz et al., 1995; Kazei et al., 1990). There is a critical requirement to recommend an advantageous synthesis method in a rapid, low-cost and eco-friendly system.
Newly, the rapid sonochemistry method has been detected to the foundation of nano-samples with homogeneous size distribution (Li et al., 2021; Li et al., 2021). In this research, Er2Cu2O5 nanostructures were fabricated with an eco-friendly sonochemistry process as Uv-light-sensitive nano-catalyst in presence of basic and covering agent of tetraethylenepentamine (TEPA), for the first time. Ultrasonic waves help to chemical process completion in a short time through creation of high temperature and pressure in a reaction solution (Li et al., 2021) that led to quicker reaction speed, more homogeneity and smaller particle dimension (Peng et al., 2021). The active groups on TEPA surface can form hydrogen bonds to nuclei and adjust the growth and size of nano-samples. Marjan Abedi et al reported synthesis of heterometallic Ni(II)/K(I) metal–organic framework by the sonochemical route and considered photocatalytic degradation of bromocresol green under visible irradiation with degradation efficiency of 94% (Abedi et al., 2019). After categorization of gained nanostructures in different investigational conditions, nanocatalysts activity were evaluated to remove of dye pollutants under UV irradiations after 120 min. The result of pollutant, scavenger, contamination and nano-catalyst concentration was selected on changing ability of Er2Cu2O5 role. Also, Ethylenediaminetetraacetic acid (EDTA), Benzoic acid and benzoquinone as scavengers to trap active specimens were utilized to understand of removal mechanism of pollutants by photocatalytic process. To conclude, •O2– radicals degraded organic dyes.
2 Experimental
2.1 Sonochemistry fabrication of Er2Cu2O5 nano-products
Er2Cu2O5 nanostructures were synthesized by sonochemical route and TEPA alkaline agent according to previous research (Talebzadeh et al., 2021). Er(NO3)3·5H2O and Cu(NO3)2·5H2O powders were dissolved in deionized H2O based on stoichiometric ratios (1:1), separately and added together. Subsequently, an ultrasonic probe was dipped in a straight line to the reaction beaker for 30 min. Meanwhile, TEPA alkaline agent was added to previous cationic solution under ultrasonic waves to set the pH = 10. The made samples after centrifuging and drying were annealed at 900 °C for 4 h. To reach boosted photocatalytic routine through erbium cuprate nanostructures with promising dimension and morphology, the efficacy of annealing temperature, time and power sonochemistry reaction were examined (Table 1). Similarly, a blank examination without ultrasonic influences was performed. The concluding nano models were deliberated over various physical characterization routes. The related schematic of sonication synthesis of Er2Cu2O5 nanoparticles was illustrated in Scheme 1. To calculate power output, the solution temperature of the reaction was determined in diverse times during sonochemistry fabrication. According to the equation of Power = (dT/dt) cp M (Contamine et al., 1995); Where cp and M are the heat capacity (in J kg−1 K−1) and mass (in kg) of the solvent, the power output is computed 17.3 W for Er2Cu2O5 (sample No. 6) in a water solvent. Also, the energy requirement during ultrasonic preparation was calculated 10,380 j according to the equation of Energy (j) = power (W) * time (s).
Sample No
Calcination condition
Ultrasonic time (min)
Ultrasonic power (W)
1
700 °C, 4 h
30
85
2
900 °C, 4 h
–
–
3
900 °C, 4 h
30
85
4
900 °C, 4 h
20
85
5
900 °C, 4 h
10
85
6
900 °C, 4 h
10
60
7
900 °C, 4 h
10
45
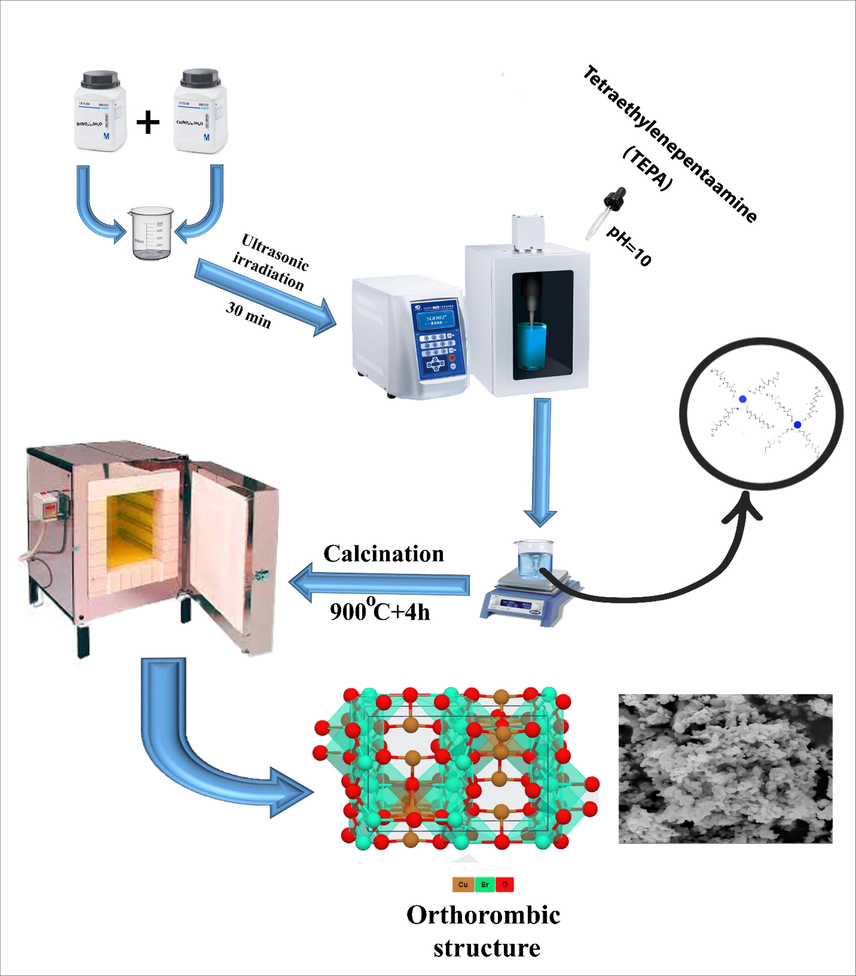
Schematic model for sonochemistry preparation of ECO nanoparticles in presence of TEPA alkaline and complexing agent.
2.2 UV-Photo sensitive catalytic examinations
The photo-degradation catalytic tests were done according to previous works (Talebzadeh et al., 2021) in a beaker set comprising 100 mL erythrosine and methyl violet solutions (10 ppm). For every test, 10 mg Er2Cu2O5 nano-ceramics were distributed in contamination result. The final solutions were kept in dark surroundings under magnetic stirring for 30 min. eventually, the reaction beaker was subjected to UVA (λ = 320–400 nm) and UVB (λ = 290–320 nm) waves. Influence of pollutant, scavenger, dye concentration, nano-catalyst loading and pH was checked out. After sampling and separating of nano-catalyst with centrifuging at the specified time, the sample absorbance was recorded by UV–Vis spectrometer. equation was utilized to compute the UV sensitive catalyst efficiency Which A0 and At are absorbance in times of start and t min.
3 Result and discussion
3.1 X-ray diffractogram results
X-ray diffractograms (XRD) of Er-Cu-O models fabricated by sonochemistry way in heat treatment of 700 °C for 4 h (ECO1) have been displayed in Fig. 1a. This temperature and time of heat process are not satisfactory for the creation of pure Er2Cu2O5 nanocomponents and sample includes the binary oxides of Er2O3 (JCPDS No = 77–0777) and CuO (JCPDS No = 41–0254). By proliferating calcination heat to 900 °C (ECO2) and without ultrasonic irradiation, the mixture of phases are formed consist of Er2O3 (JCPDS No = 77–0777), CuO (JCPDS No = 41–0254) and Er2Cu2O5 (JCPDS No = 83–0498) (Fig. 1b). Pure Orthorhombic Er2Cu2O5 structures were created at 900 °C for 4 h in presence of ultrasonic waves that have been described in Fig. 1c (ECO3). It was deduced that ultrasonic irradiation is a crucial tool for the production of pure Er2Cu2O5 nanocrystals. The Er2Cu2O5 structures are containing the key Bragg reflections at 2 theta of 17.9, 21.8, 27.2, 30.7, 31.6, 33.3, 33.8, 34.2, 45.2 and 48.2 related to (2 0 1), (2 0 2), (2 0 3), (1 1 2), (2 1 1), (2 0 4), (0 1 3), (4 0 1), (4 1 2) and (2 1 5) plans. The crystalline dimension of Er-Cu-O nanograins (ECO3) was accounted by way of the Scherer relation (Monshi et al., 2012) about 39 nm. Crystallographic parameters of ECO nanocrystals obtained from XRD patterns have been summarized in Table. 2.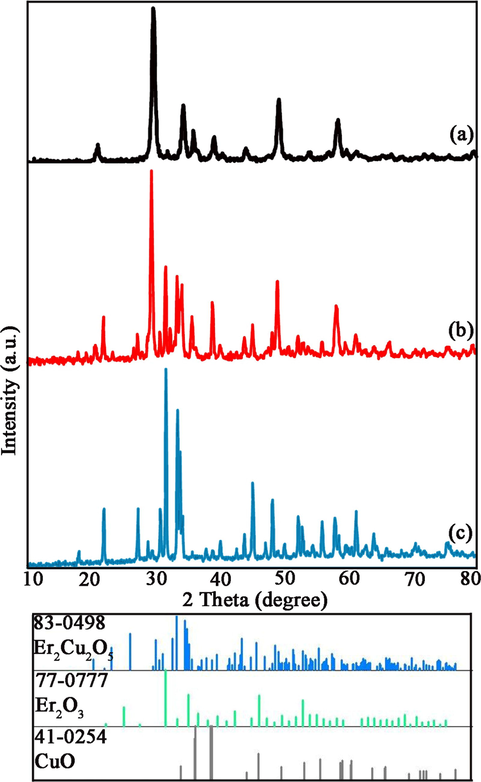
XRD patterns of Er2Cu2O5 samples No (a) 1, (b) 2 and (c) 3.
nanocrystal
JCPDS No
Crystal phase
Space group
Cell constants (Å)
a b c
Er2Cu2O5
83–0498
Orthorhombic
Pna21
10.7344
3.4577
12.3961
Er2O3
77–0777
Cubic
Ia-3
10.5360
10.5360
10.5360
CuO
41–0254
Monoclinic
C2/c
4.6850
3.4230
5.1320
3.2 Morphology examination (SEM & TEM)
In order to consider the impact of ultrasonic reaction time on shape, dimension and particle distribution of Er2Cu2O5 products, the reaction was carried out at different times of 10, 20 and 30 min and FESEM images of nano-products prepared have been displayed in Fig. 2a-f. As observed in Fig. 2, when precursors are exposed to ultrasonic waves for 10 min, particles with the wide size distribution of 30–200 nm are created. In times of 20 and 30 min, agglomerated products were appeared. The physical and chemical events are initiated during the cavitation bubble collapse of ultrasonic waves. A shock wave of implosive collapse of bubbles can propagate out into the precursor solution and speed up suspended solid particles. Inter-particle collisions can change particle size distributions and their shapes. On the other hand, pursuant to the Ostwald development, when the sonication period rises, the ultrasonic waves’ shock can be lead to particle evolution in the primary step. With boosts of the ultrasonic time of up to 20 and 30 min, the bulky shapes of particles are prearranged. Though, by growing the duration of ultrasound emission from a definite limit, the concentration of bubbles formed in the solution rises. This phenomenon acts as a barrier to the publication of ultrasound waves, and agglomerated products are formed. The ideal particle size was attained within 10 min of the wave transmission.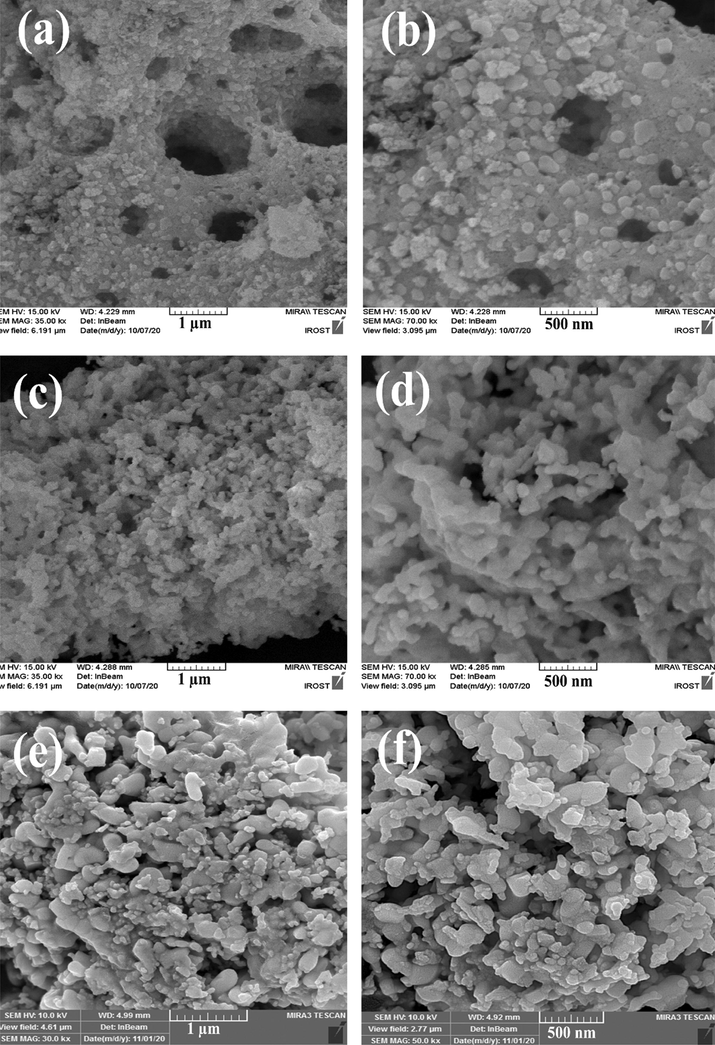
FESEM images of Er2Cu2O5 nano-samples fabricated via ultrasonic waves in various times of (a, b) 30, (c, d) 20 and (e, f) 10 min.
Ultrasonic wave power can affect the size, uniformity and shape of prepared nano-products (Hinman and Suslick, 2017) that SEM images of Er2Cu2O5 nanostructures in different powers of 60 and 45 W have been presented in Fig. 3a-d, correspondingly. The medium power of 60 W is ideal power for the fabrication of uniform small structures of Er2Cu2O5 because with creation of suitable bubble concentration in solution medium and finally active groups of radical help to obtain fine particles.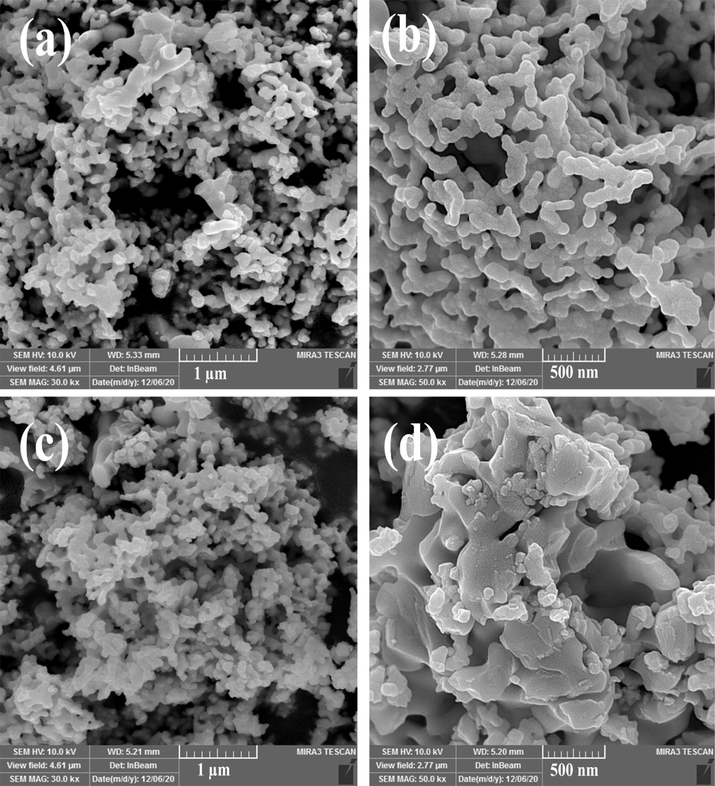
FESEM images of Er2Cu2O5 nanostructures fabricated via ultrasonic waves in various powers of (a, b) 60 and (c, d) 45 W.
FESEM images of Er2Cu2O5 structures prepared without ultrasonic waves have been displayed in Fig. 4a, b. agglomerated structures with irregular size and shape were formed in the precipitation route. Fig. 5a-e illustrate particle scale dispensation charts of samples created in dissimilar times and powers of ultrasonic irradiation (sample Nos. 3–7), respectively. As shown in Fig. 5a-e, Er2Cu2O5 nanoparticles synthesized through 10 min and 60 w ultrasonic waves (sample No. 6) have ideal particle size distribution.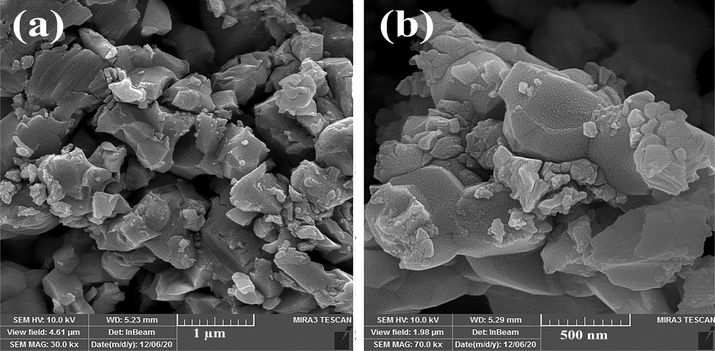
FESEM images of Er2Cu2O5 sample fabricated without ultrasonic irradiation (sample No. 2).
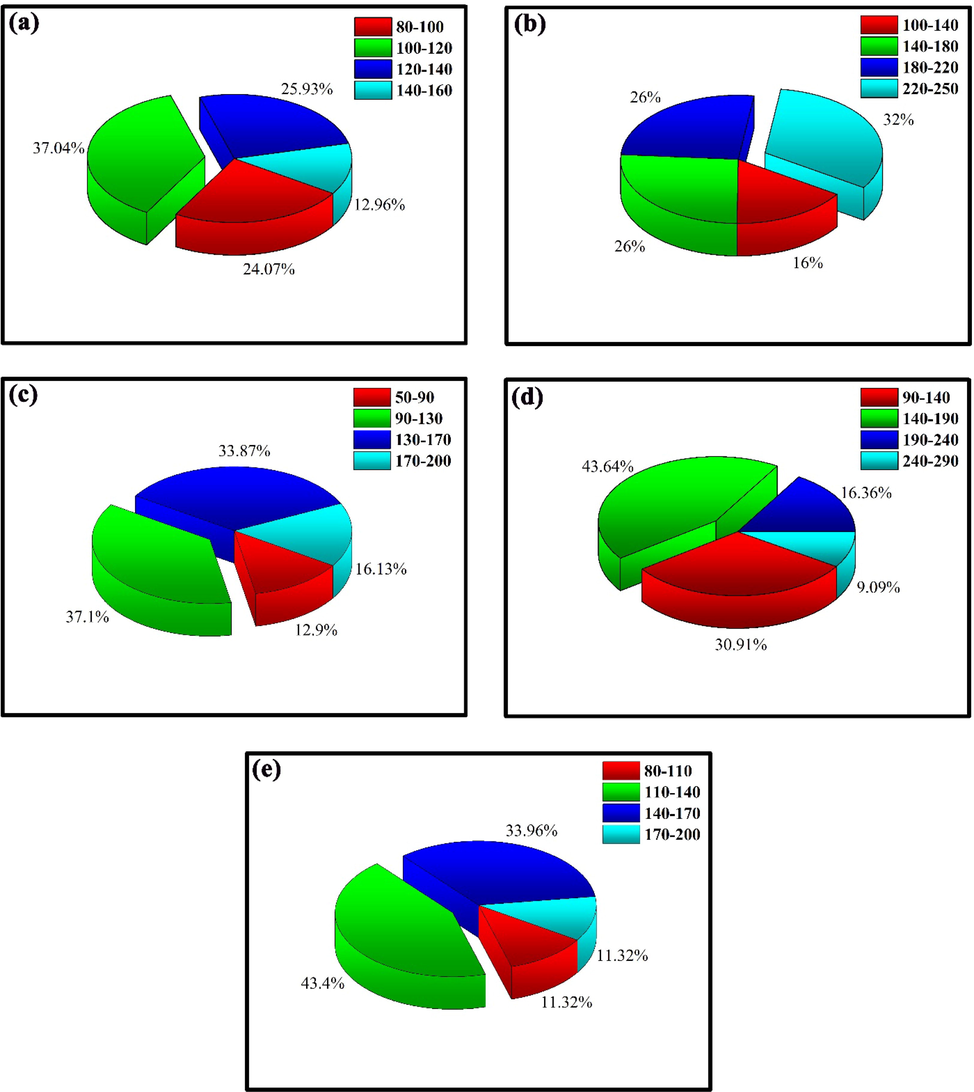
Particle size distribution charts of sample No of (a) 3, (b) 4, (c) 5, (d) 6 and (e) 7.
Fig. 6 depicts transmission microscopic pictures of improved Er2Cu2O5 nano model made-up via the sonochemistry route (ECO6). Ellipsoidal-shaped nano samples have scale of approximately 10–50 nm.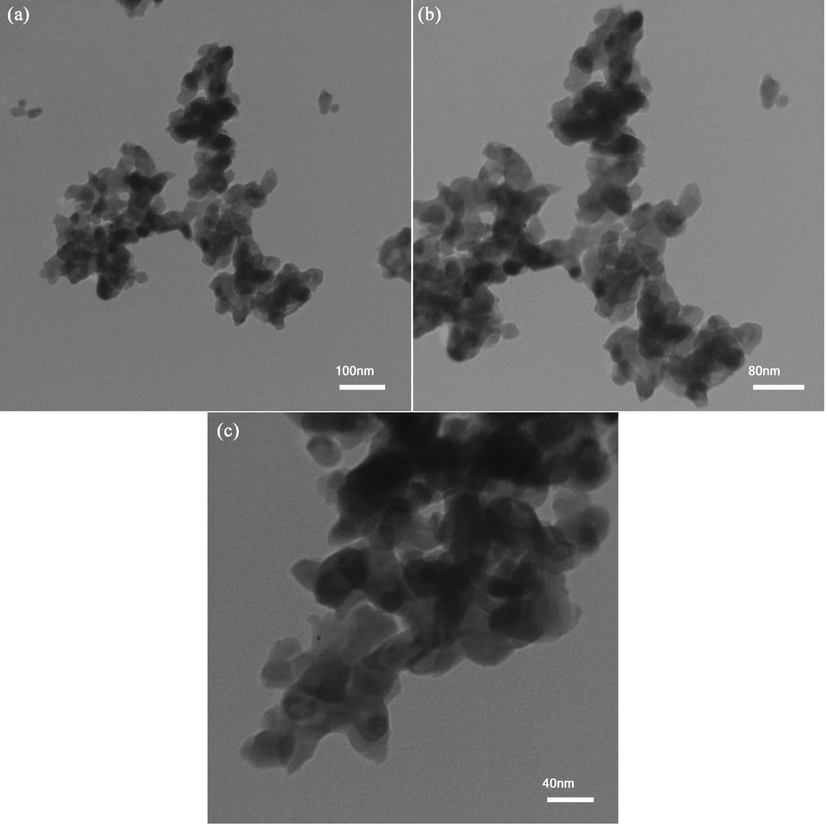
TEM images of optimized nano Er2Cu2O5 product (ECO6).
3.3 Mechanism of sonochemistry synthesis
Optimal designed nano Er2Cu2O5 materials are shaped with the ultrasonic treatment together with TEPA as both alkaline and covering agents. Pursuant to hot-spot principle, extreme pressure and temperature cause the formation of oxidizing components that help to rapid manufacture of optimized erbium cuprate nanoparticles (Gedanken, 2004). Water is pyrolyzed to H and OH radicals in presence of ultrasonic waves. The created radicals help to release of hydroxyl ions from TEPA. Then, Er(OH)3 and Cu(OH)2 precursors produced in an alkaline medium are calcined at 900 °C for 4 h and final product with optimal properties is synthesized. The reactions performed in the aquatic environment by ultrasound waves are described below:. H2O → H• + OH H• + H• → H2 OH• + OH• → H2O2 TEPA + H2O + H• → TEPA-H+ + OH Er3+ + OH– → Er(OH)3 Cu2+ + OH– → Cu(OH)2 Er(OH)3 + 2 Cu(OH)2 → Er2Cu2O5 nanoparticles + 5 H2O
3.4 EDX and FT-IR spectra analysis
The result of EDX spectrum of pure Er2Cu2O5 nanoparticles (ECO6) has been represented in Fig. 7a. In Fig. 7a, the entity of Er, Cu and O lines corroborate construction of net Er2Cu2O5 nanomaterial.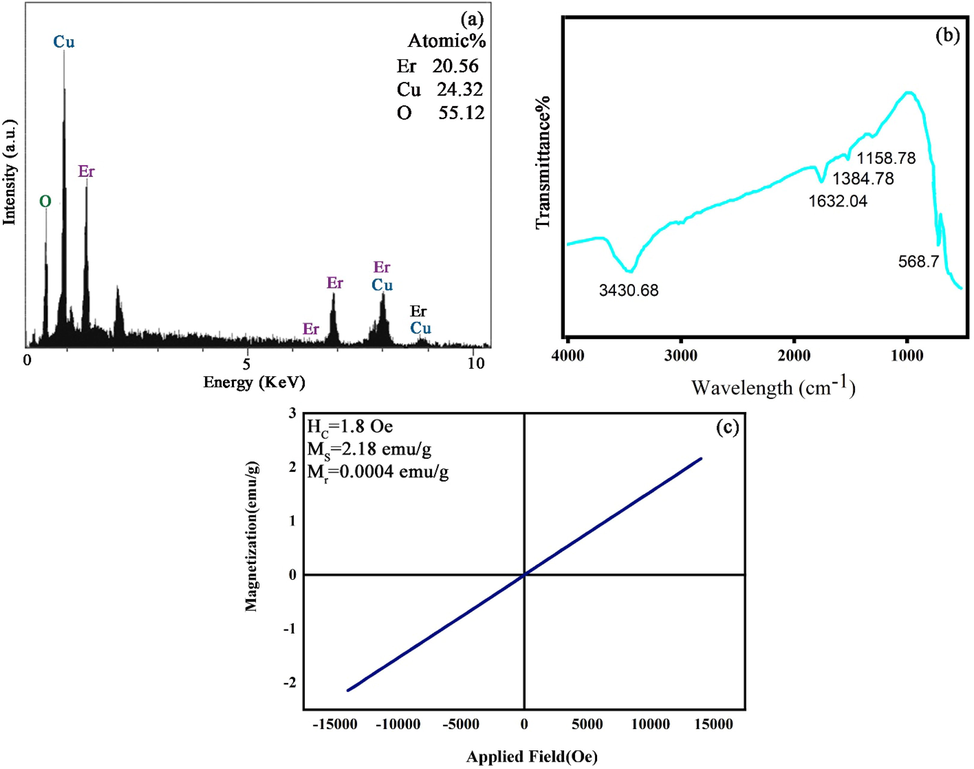
(a) EDS analysis, (b) FT-IR spectrum and (c) M−H curve of ECO6 nanoparticles.
FT-IR study of optimal designed nano Er2Cu2O5 materials (ECO6) has been performed in Fig. 7b. The platy sorption within 3430 cm−1 and a slight summit at 1632 cm−1 are allocated to shaking of O-H connections of water. All frequency attractions nearby 400–700 cm−1 and 1158 cm−1 can be correlated to Cu-O and Er-O connection (Gaafar et al., 2009; Erdoğan and Güllü, 2010). The FT-IR outcomes approve that a miniature amount of TEPA alkaline and covering mediator is appended to the Er2Cu2O5 product and following that preventing nanoparticles agglomeration.
3.5 Magnetic and porosity features
The magnetic properties of pure Er2Cu2O5 nanoparticles explored with VSM have been revealed in Fig. 7c. Ferromagnetic behavior was concluded from the hysteresis loop according to the earlier study (Garcia-Munoz et al., 1995). The vital magnetic parameters including coercivity, residue magnetization and supreme saturation magnetization of ideal Er2Cu2O5 product have been listed in Fig. 7c.
The BET analysis to specify important factors in porosity of pure Er2Cu2O5 nanoparticles surface have been exhibited in Fig. 8a, b. The reached erbium cuprate nanoparticles are assorted in IV group and H4 type which qualified to accumulated units with macro and mesoholes (Leofanti et al., 1998). As exposed in Fig. 8b, the accomplished nanostructures have a wide-ranging pore dimension. The particular surface area, hole volume and average hole dimension for the Er2Cu2O5 sample are 2.59 m2 g−1, 0.59 cm3 g−1 and 12.74 nm, correspondingly. From the presented data, it was realized that Er2Cu2O5 nanoparticles have satisfactory porosity for UV-sensitive catalytic act.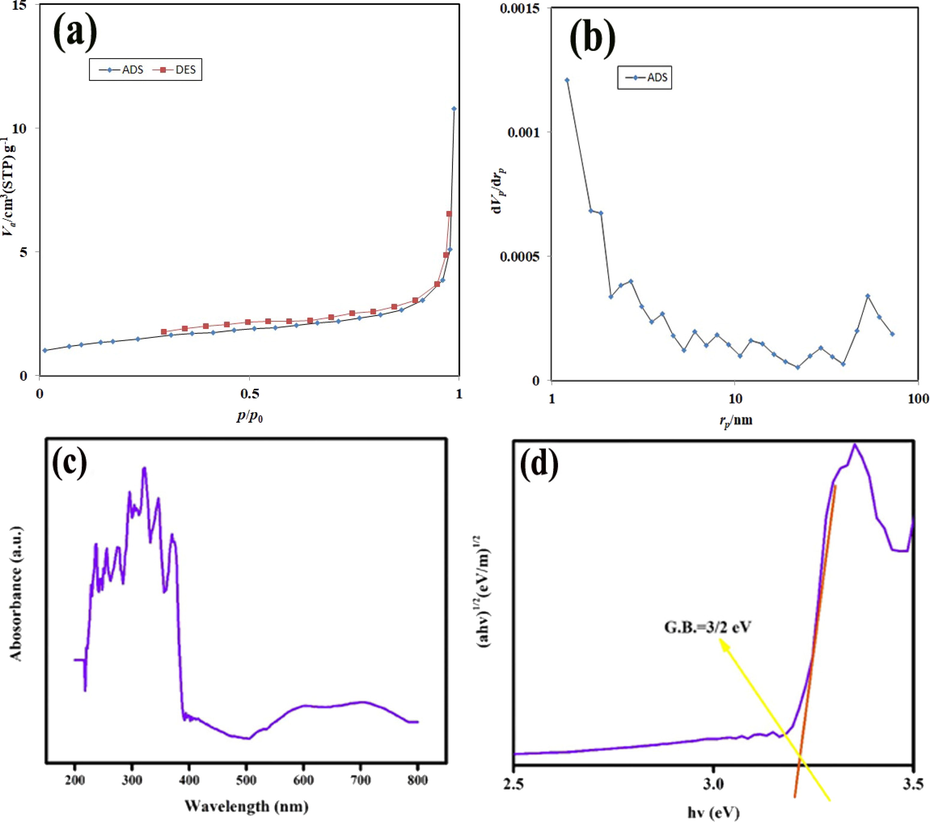
(a, b) N2 adsorption/desorption isotherm and pore size distribution, (c, d) UV–Vis diffuse absorption spectrum and linear portion of plots of (αhν)1/2 against (hν) of optimized Er2Cu2O5 nanoparticles (ECO6).
3.6 Electronic structures
To distinguish optical energy structure and bandgap of Er2Cu2O5 nano semiconductor, UV–Vis absorption spectroscopy was carried out that exposed in Fig. 8c, d. The characteristic absorption area is about 200–400 nm. The bandgap of Er2Cu2O5 nano specimen was tested by Tauc’s relation (Tauc et al., 1966; Paul et al., 2019; Ranjeh et al., 2020; Ghanbari and Salavati-Niasari, 2021; Selvamani et al., 2021; Al-Nayili et al., 2021; Kadhem and Al-Nayili, 2021; Al-Nayili and Albdiry, 2021) about 3.2 eV.
3.7 UV-sensitive catalytic efficacy
Due to the Er2Cu2O5 sample being in semiconductors group, the activity of ECO6 nanocatalyst was assessed subjecting UV wave for converting of water pollutants to harmless materials. The elements of contamination type, Er2Cu2O5 nanocatalyst dosage and different trappers were examined to realize the maximum degradation proportion. Fig. 9 indicates the UV-catalytic performance of ECO6 nanoparticles arranged using ultrasonication radiation for removing of various pollutants of thymol blue, erythrosine, acid red, methyl orange and eriochrome black T after 120 min. As illustrated in Fig. 9, degradation efficiency of erythrosine dye as drinking water pollutant is more than other dyes. Degradation percentage of erythrosine dye by ECO6 was obtained 99.3 % after 120 min. Also, to consider kinetic behaviors of samples according to Langmuir–Hinshelwood mechanism, the promising reaction rate coefficients can be expanded from Eq. (2):.
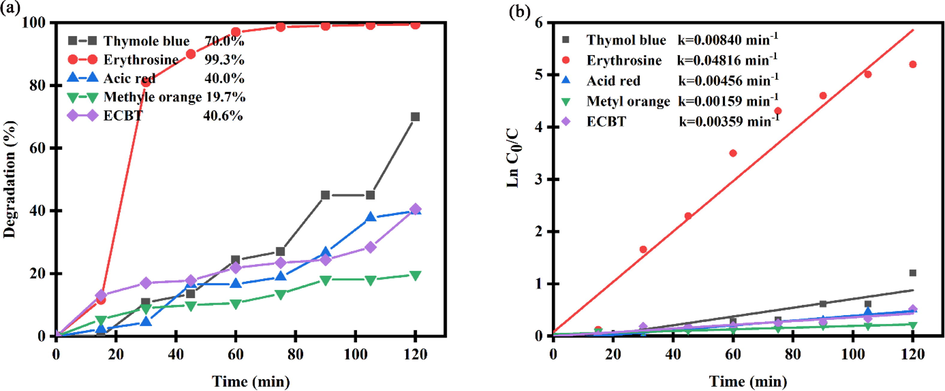
(a) Photocatalytic efficiency and (b) plots of ln(C/C0) vs time of Er2Cu2O5 nanocatalysts for removal different dyes under UV light.
Which C0 and Ct are dye concentration in times of start and t min and k is the pseudo-1st-order rate coefficient (min−1). According to linear dependences of ln(C0/Ct) versus time, the 1st-order rate constant k has been reached. As observed in Fig. 9b, the rate constant of k for erythrosine dye (k = 0.04816 min−1) is more than other pollutants that confirm catalytic degradation of erythrosine dye in presence of ECO nanoparticles is carried out with higher speed.
Fig. 10a-f unveil the consequences of UV-elimination of ECO6 nanocatalyst in dissimilar quantities of 0.03, 0.05 and 0.07 g in various pollutant concentrations of 10, 15 and 20 ppm. It is noticeable that degradation percentage of all examples is above of 90 %. Also, kinetic studies of ECO6 nanocatalyst in diverse pollutant dosages have been illustrated in Fig. 10 b, d and f.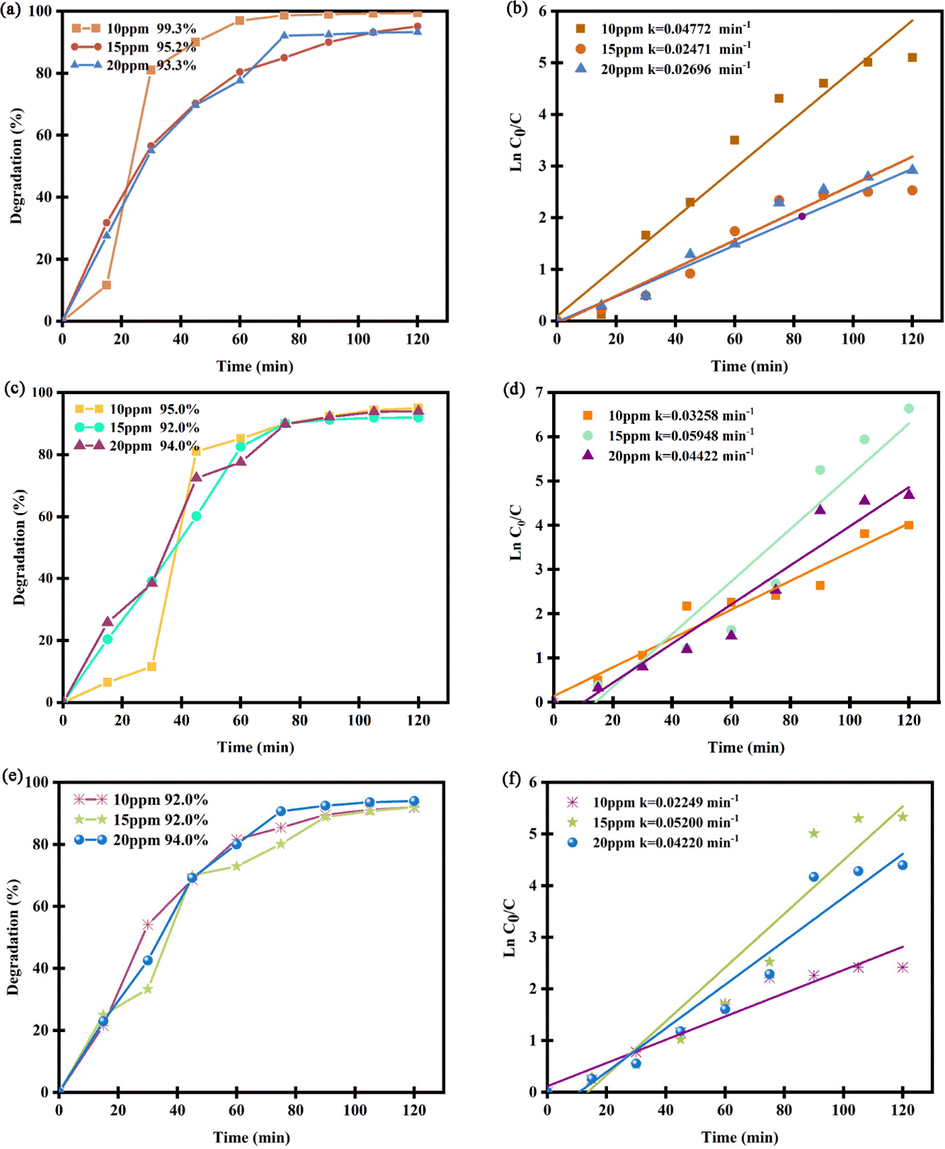
(a), (c), (e) Photocatalytic efficiency and (b), (d) and (f) plots of ln(C/C0) vs time in diverse dosages of Er2Cu2O5 nanocatalysts of 0.03, 0.05 and 0.07 g.
In Fig. 11a, photocatalytic performance of Er2Cu2O5 nanocatalysts in different pH of acidic (pH = 4), neutral (pH = 8) and alkaline (pH = 10) was studied for removal erythrosine dye under UV light. According to Fig. 11a, photocatalytic efficiency of ECO nanoparticles was obtained 95.04, 85.12 and 60.22% at pH of 4, 8 and 10. According to Fig. 11b, the optimum medium for performing photocatalytic tests is acidic circumstances with kinetic constant of 0.03639 min−1.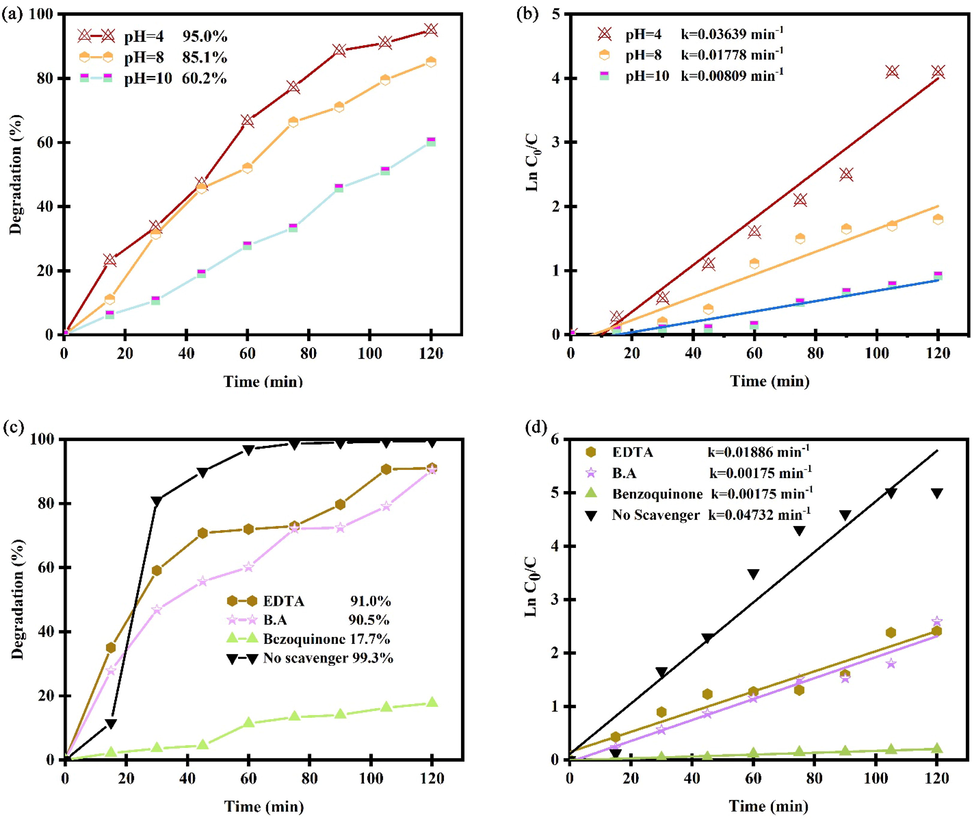
Photocatalytic efficiency and plots of ln(C/C0) vs time of Er2Cu2O5 nanocatalysts (a, b) in different pH and (c, d) in presence of three types of scavenger for removal erythrosine dye under UV light.
Fig. 11c, d displays the UV-degradation measurement and plots of ln(C/C0) vs time of ECO6 nanocatalyst in attendance of diverse trappers to ensnare of h+, •OH and •O2– active radicals (Paul et al., 2019; Ranjeh et al., 2020; Ghanbari and Salavati-Niasari, 2021; Selvamani et al., 2021; Al-Nayili et al., 2021; Kadhem and Al-Nayili, 2021; Al-Nayili and Albdiry, 2021). As illustrated, UV-degradation proficiency of erythrosine pollutant by Er2Cu2O5 nano-catalyst has prominently diminished with benzoquinone as a •O2– trapper. It is derived that •O2– radical element has the greatest influence in deletion water impurity. The erythrosine removal process with details via optimized Er2Cu2O5 by •O2– trapper has been shortened in follows:. ECO nano-catalyst + hν → ECO nano-catalyst* (e-CB + h+VB) O2 + e- → •O2 •O2– + e- + 2H+ → H2O2 H2O2 + e- → OH– + •OH h+ + H2O → •OH + 2H+ Erythrosine dye + (•O2– + •OH active agents) → product + H2O + CO2
Fig. 12a, b display the photocatalytic efficiency and plots of ln(C/C0) vs time of Er2Cu2O5 nanocatalysts for removal phenol dye under UV light. The catalytic yield of nanoparticles is about 90 % and speed constant is 0.00150 min−1. As presented in Fig. 13, after 5 times recycling photocatalytic activity, degradation efficiency fell gradually from 99.3 to 86.2%.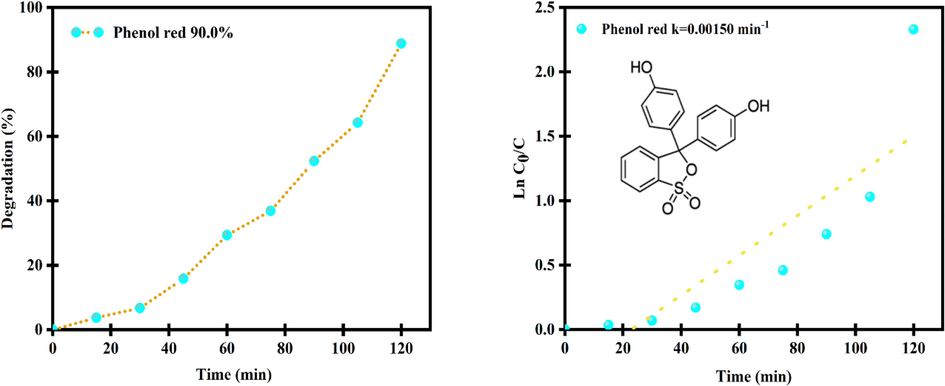
Photocatalytic efficiency and plots of ln(C/C0) vs time of Er2Cu2O5 nanocatalysts for removal phenol dye under UV light.
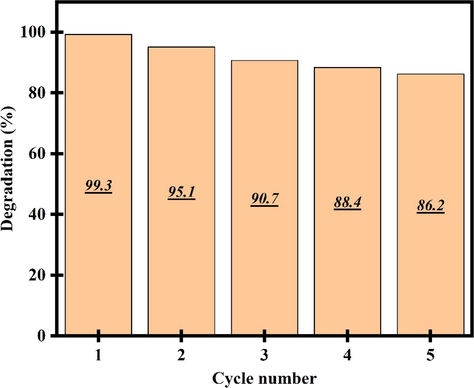
Recycling results of ECO nanoparticles after 5 cycles photocatalytic activity.
In Table 3, photocatalytic performance of Er2Cu2O5 nanoparticles was linked with other nanocatalysts (Ranjeh et al., 2020; Ghanbari and Salavati-Niasari, 2021; Selvamani et al., 2021). In this work, photo-degradation proficiency of Er2Cu2O5 nanoparticles was deliberate for the first period and concluded that ECO nanoparticles have promising photocatalytic activity among nanomaterials. The schematic design of photo-degradation mechanism of ECO6 has been illustrated in Scheme. 2.
Nanostructure
Pollutant dye
Irradiation
source
Photocatalytic
efficiency
Ref
Li2MnO3/LiMnBO3/MnFe2O4
acid red 88
UV–Visible
77–46.2%
(Ranjeh et al., 2020)
CuI/g-C3N4
rhodamine-methyl orange
Visible
78.6–76.6%
(Ghanbari and Salavati-Niasari, 2021)
MgTi2O5
crystal violet
UV
72%
(Selvamani et al., 2021)
La2Sn2O7
erythrosine
UV
84%
(Talebzadeh et al., 2021)
Er2Cu2O5
erythrosine
UV
97%
This work
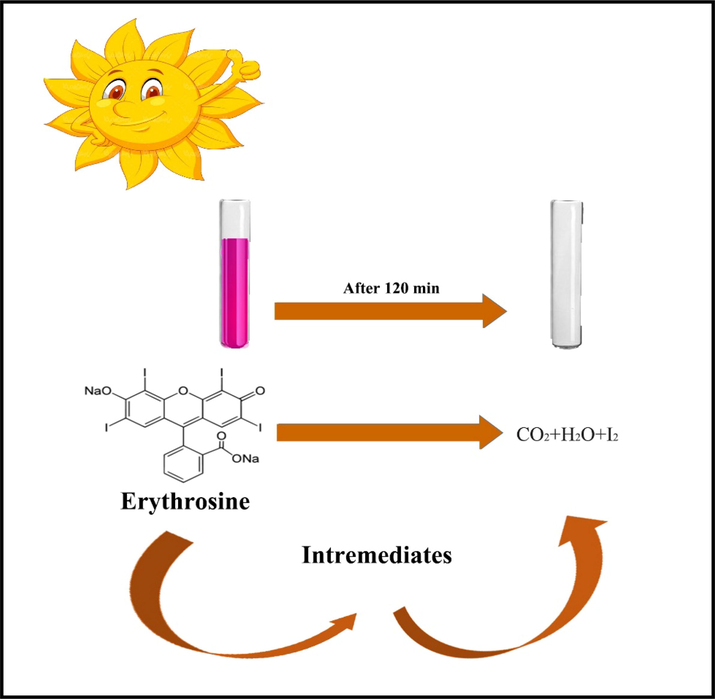
Photo-degradation mechanism of Er2Cu2O5 nano products.
4 Conclusions
Shortly, we were creatively fabricated Er2Cu2O5 nanoparticles through fast and simple sonochemistry route with improved UV-catalytic action to eliminate of consumption water contaminants. To achieve favorable properties of nano-products and finally enhanced photocatalytic efficiency, experimental parameters of calcination temperature, time and power of ultrasonic process were examined. After selecting optimal Er2Cu2O5 nanomaterials, photocatalytic reactions to remove of drinking water pollutants were performed. The influence of water pollutants, trappers, dye and Er2Cu2O5 nano-catalyst concentration was nominated on altering ability of erbium cuprate catalyst role. As an outcome, Er2Cu2O5 nanoparticles (ECO6) (ƞ=97%) have better efficiency for degradation of erythrosine dye. Furthermore, with evaluating of mechanism of UV-catalytic utility of Er2Cu2O5 nanoparticles using three forms of trappers of EDTA, Benzoic acid and benzoquinone to trap of radicals, it is concluded that •O2– radicals support UV-degradation of water impurity.
CRediT authorship contribution statement
Seyed Milad Tabatabaeinejad: Methodology, Investigation, Software, Formal analysis. Qahtan A. Yousif: Formal analysis, Methodology, Visualization. Hassan Abbas Alshamsi: Methodology, Writing – review & editing. Abbas Al-Nayili: Methodology, Software, Data curation. Masoud Salavati-Niasari: Formal analysis, Methodology, Writing – review & editing, Writing – original draft, Conceptualization, Supervision, Project administration, Investigation, Data curation, Validation, Resources, Visualization, Funding acquisition.
Acknowledgement
Financial support from the Iran National Science Foundation (INSF, 97017837) and University of Kashan, Grant No (159271/SMT2) is gradually acknowledged.
References
- Preparation of porous adsorbent via Pickering emulsion template for water treatment: A review. Journal of Environmental Sciences. 2020;88:217-236.
- [Google Scholar]
- Recent advances in the biosorption of pollutants by fish scales: a mini-review. Chemical Engineering Communications 2020:1-12.
- [Google Scholar]
- Submerged nanofiltration without pre-treatment for direct advanced drinking water treatment. Chemosphere. 2021;265:129056
- [Google Scholar]
- Photocatalysis for removal of environmental pollutants and fuel production: a review. Environmental Chemistry Letters 2020:1-23.
- [Google Scholar]
- A review on exploration of Fe2O3 photocatalyst towards degradation of dyes and organic contaminants. Journal of environmental management. 2020;258:110050
- [Google Scholar]
- Bi/SnO 2/TiO 2-graphene nanocomposite photocatalyst for solar visible light–induced photodegradation of pentachlorophenol. Environmental Science and Pollution Research. 2021;28:15236-15247.
- [Google Scholar]
- MnFe2O4 decorated reduced graphene oxide heterostructures: nanophotocatalyst for methylene blue dye degradation. Vacuum. 2020;173:109150
- [Google Scholar]
- Facile synthesis of binary metal substituted copper oxide as a solar light driven photocatalyst and antibacterial substitute. Advanced Powder Technology. 2021;32:940-950.
- [Google Scholar]
- Magnetic recyclable MnFe2O4/CeO2/SnS2 ternary nano-photocatalyst for photo-Fenton degradation. Applied Catalysis A: General. 2020;593:117443
- [Google Scholar]
- Dielectric constant and conductivity of Er2Cu2O5. Journal of alloys and compounds. 1994;216:99-103.
- [Google Scholar]
- Spectral studies of magnetic cuprates R2Cu2O5 (R= Tb, Er, Tm, Lu, Y) Solid state communications. 1991;79:569-572.
- [Google Scholar]
- Complex magnetic structures of the rare-earth cuprates R 2 Cu 2 O 5 (R= Y, Ho, Er, Yb, Tm) Physical Review B. 1991;44:4716.
- [Google Scholar]
- Magnetic behavior of R 2 Cu 2 O 5 cuprates studied by neutron diffraction. Physical Review B. 1995;51:6594.
- [Google Scholar]
- Metamagnetism of cuprates R2Cu2O5. Journal of Magnetism and Magnetic Materials. 1990;86:124-134.
- [Google Scholar]
- Sonochemical fabrication of inorganic nanoparticles for applications in catalysis. Ultrasonics Sonochemistry. 2021;71:105384
- [Google Scholar]
- Sonochemical catalysis as a unique strategy for the fabrication of nano-/micro-structured inorganics, Nanoscale. Advances. 2021;3:41-72.
- [Google Scholar]
- Effect of reaction condition on microstructure and properties of (NiCuZn) Fe2O4 nanoparticles synthesized via co-precipitation with ultrasonic irradiation. Ultrasonics Sonochemistry. 2021;71:105369
- [Google Scholar]
- A 3D heterometallic Ni (II)/K (I) MOF with a rare rna topology: synthesis, structural features, and photocatalytic dye degradation modeling. New Journal of Chemistry. 2019;43:17457-17465.
- [Google Scholar]
- La2Sn2O7/g-C3N4 Nanocomposites: Rapid and Green Sonochemical Fabrication and Photo-Degradation Performance for Removal of Dye Contaminations. Ultrasonics Sonochemistry. 2021;105678
- [Google Scholar]
- Modified Scherrer equation to estimate more accurately nano-crystallite size using XRD. World journal of nano science and engineering. 2012;2:154-160.
- [Google Scholar]
- Using sonochemistry for the fabrication of nanomaterials. Ultrasonics sonochemistry. 2004;11:47-55.
- [Google Scholar]
- Ultrasonic and FT-IR studies on Bi2O3–Er2O3–PbO glasses. Philosophical Magazine. 2009;89:2213-2224.
- [Google Scholar]
- Optical and structural properties of CuO nanofilm: its diode application. Journal of Alloys and Compounds. 2010;492:378-383.
- [Google Scholar]
- Optical properties and electronic structure of amorphous germanium, physica status solidi (b). 1966;15:627-637.
- CsPbBrCl2/g-C3N4 type II heterojunction as efficient visible range photocatalyst. Journal of hazardous materials. 2019;380:120855
- [Google Scholar]
- Li2MnO3/LiMnBO3/MnFe2O4 ternary nanocomposites: Pechini synthesis, characterization and photocatalytic performance. International Journal of Hydrogen Energy. 2020;45:21241-21251.
- [Google Scholar]
- Copper iodide decorated graphitic carbon nitride sheets with enhanced visible-light response for photocatalytic organic pollutant removal and antibacterial activities. Ecotoxicology and Environmental Safety. 2021;208:111712
- [Google Scholar]
- Preparation of MgTi2O5 nanoparticles for sonophotocatalytic degradation of triphenylmethane dyes. Ultrasonics Sonochemistry. 2021;75:105585
- [Google Scholar]
- Dealumination of Zeolite Frameworks and Lewis Acid Catalyst Activation for Transfer Hydrogenation. Arabian Journal for Science and Engineering. 2021;46:5709-5716.
- [Google Scholar]
- Dehydrogenation of Formic Acid in Liquid Phase over Pd Nanoparticles Supported on Reduced Graphene Oxide Sheets. Catalysis Surveys from Asia. 2021;25:324-333.
- [Google Scholar]
- AuPd bimetallic nanoparticles supported on reduced graphene oxide nanosheets as catalysts for hydrogen generation from formic acid under ambient temperature. New J. Chem.. 2021;45:10040-10048.
- [Google Scholar]


