

Translate this page into:
Unveiling the spatial metabolome and anti-atherosclerosis effects of Allium macrostemon Bunge and Allium chinense G. Don
⁎Corresponding authors at: Department of Pharmacy, the First Affiliated Hospital of Zhengzhou University, Zhengzhou 450052, China. jingyang_0101@163.com (Jing Yang), qzf1989@163.com (Zifei Qin)
-
Received: ,
Accepted: ,
This article was originally published by Elsevier and was migrated to Scientific Scholar after the change of Publisher.
Abstract
Abstract
Allium macrostemon Bunge (AMB) and Allium chinense G. Don (ACGD) are both the medicinal herbs of Allii Macrostemonis Bulbus (also named Xiebai in Chinese) for the treatment of coronary heart disease. However, the similarities and differences of anti-atherosclerosis effects and chemical profiles of AMB and ACGD still remain unclear. Similarly, comparative analysis of the spatial metabolomes of AMB and ACGD has rarely been performed. First, biochemical and pathological results demonstrated that AMB and ACGD extracts exhibited similar and close lipid-lowering activity and anti-atherosclerosis effect. Further, a total of 693 metabolites were identified or tentatively characterized by UHPLC-MS/MS and UHPLC-TOF/MS. And 365 differential compounds were determined between AMB and ACGD involving in carbohydrate and aldarate metabolism, purine metabolism, linoleic acid metabolism, α-linoleic acid metabolism, phenylalanine and tyrosine metabolism. Moreover, MALDI-TOF IMS-mediated spatial metabolome given the biosynthesis pathways of steroidal saponins, flavonoids, lignans for the first time. These compounds were rich in AMB tunic and outside scales, whereas they were mainly distributed in ACGD tunic, whole leaf scales, and rarely in developing flower buds. Taken together, these findings provided abundant information about pharmacological effects, chemical profiling and visual spatial distribution of AMB and ACGD, and would benefit the application and promotion of their relative products on the market.
Keywords
Allium macrostemon Bunge
Allium chinense G. Don
Anti-atherosclerosis effects
Primary and secondary metabolites
Spatial distribution
Biosynthesis pathway

1 Introduction
Due to potential health benefits and economic values, Allium macrostemon Bunge (AMB) and Allium chinense G. Don (ACGD) are two popular vegetables, crops and herbs with consumption of millions of tons per year in East Asia, South Asia, and the Far East, and are also cultivated in North American (Choi et al., 2012; Shahrajabian et al., 2020; Yao et al., 2016). Further, the National Food Composition Table in China has reported that AMB and ACGD are rich in natural sugars, amino acid, vitamins, carotene, and minerals (He et al., 2018b; Yao et al., 2016). And volatile organic sulfide compounds and steroidal saponin are the main characteristic secondary compounds in these two vegetables (Han et al., 2017; Kim et al., 2017; Ou et al., 2012; Yao et al., 2016). Previously, several researches have reported that the remarkable anti-platelet aggregation properties of these metabolites could reduce the risks of chronic pathologies (hyperlipidemia, coronary heart disease, etc.), analgesic activity, vasodilation effect, anti-myocardial ischemia, bactericidal activity and antidepressant-like activity (Han et al., 2017; Lee et al., 2010; Li et al., 2014; Sheng et al., 2008; Yang et al., 2021). In addition, some other active metabolites including neutral and acidic polysaccharides, ferulic acid esters of glucosyl-glucose and nitrogenous compounds were detected from these two herbs (Guo et al., 2022; Usui et al., 2017; Yao et al., 2016; Zhang et al., 2015).
Typically, AMB and ACGD are both the medicinal herbs of Allii Macrostemonis Bulbus (also named Xiebai in Chinese), and used in clinics as anti-thrombotic agents (Lin et al., 2016; Ou et al., 2012). However, AMB is more often processed into officinal herbs, while ACGD is developed into canned foods in the market. This has attracted increasing interests in the similarities and differences of chemical profiling and pharmacological effects. And our previous studies showed that steroidal saponins are the most abundant secondary metabolites in these two herbs, but the species and content levels share quite different patterns (Qin et al., 2016a, 2016b, 2018; Yao et al., 2016). There are multiple representative sapogenins including smilagenin, sarsasapogenin, tigogenin, diosgenin in AMB, while laxogenin is the characteristic sapogenin in ACGD (Qin et al., 2016a, 2018). In addition, a small portion of steroidal saponins exhibited significant concentration-dependant inhibitory activity towards platelet aggregation induced by arachidonic acid, adenosine diphosphate and collagen (Duan et al., 2022; Feng et al., 2019; Ling et al., 2021; Ou et al., 2012). However, no studies of these two crops regarding the comparison of anti-atherosclerosis effects and holistic chemical profiling of primary and secondary metabolites have been reported previously.
The qualitative and quantitative analyses of secondary metabolites are mainly based on the extraction of whole tissues, which could lose the spatial distribution information of the metabolites within the holistic tissues. Recently, a newly emerged technique named matrix-assisted laser desorption/ionization time-of-flight imaging mass spectrometry (MALDI-TOF MSI) enables the analysis of visual spatial distribution of individual metabolites in crops, fruits, vegetables and herbs (Dai et al., 2020; Duan et al., 2022; Li et al., 2022c). In addition, this approach also enables the identification and characterization of numerous secondary metabolites with structural diversity and wide polarity range, and allows rapid detection of frozen section samples on electrically conductive slides coated with indium tin oxide without tedious sample pretreatment and further chromatographic separation (Dai et al., 2020). In previous study, we have performed spatial distribution property of steroidal saponins in AMB and ACGD (Duan et al., 2022). And a greater intensity/mass of saponins in tunics and whole leaf scales of ACGD compared to the saponins mainly in tunics and outside leaf scales of AMB bulbs (Duan et al., 2022). However, the information concerning about spatial location of other secondary metabolites in these two vegetables still remains unknown. And a visualizable and practical analytical approach is urgently needed to gain the detailed insight on the spatial distribution of primary and secondary metabolites in biosynthetic networks in specific tissues.
In this study, we first investigated the lipid lowering and anti-atherosclerosis effects of AMB and ACGD extracts using high fat and high cholesterol induced atherosclerosis model ApoE−/− mice. Further, ultra-high-performance liquid chromatography tandem triple quad (triple time-of-flight) mass spectrometry (UHPLC-MS/MS or UHPLC-TOF/MS) methods were established to perform the chemical profiles of primary and secondary metabolites in these two crops. Multivariate data analysis was used to identify the differential metabolites between AMB and ACGD samples, and interpret the differential KEGG pathway. Moreover, this study presented the spatial distribution of various metabolites including flavonoids, lignans, coumarins, alkaloids in these two vegetables using MALDI MSI analysis. Meanwhile, our results enabled a visualization of several secondary metabolites involving in biosynthetic pathways. In total, this study provided a greater understanding of AMB and ACGD concerning about anti-atherosclerosis effects, and holistic chemical profiling of primary and secondary metabolites. And the combination of MALDI MSI and metabolomics was a novel and practical approach to better understand the biosynthetic pathways of secondary metabolites in AMB and ACGD.
2 Materials and methods
2.1 Materials and chemicals
The fresh bulbs of Allium macrostemon Bge. (AMB) and Allium chinense G. Don (ACGD) were collected from their genuine producing areas including Shenyang in Liaoning province and Xinjian in Jiangxi province of China, respectively. And they were taxonomically identified by Professor Xiaojian Zhang who works in department of pharmacy, first affiliated hospital of Zhengzhou University, China. Then, their surfaces were disinfected with 75% alcohol, and immediately stored at −80 °C before use.
The assay kits for testing triglyceride (TG), total cholesterol (TC), high-density lipoprotein cholesterol (HDL-C), low density lipoprotein cholesterol (LDL-C), lactic dehydrogenase (LDH), Creatine kinase-MB (CK-MB) were all obtained from Nanjing Jiancheng Bioengineering Institute (Nanjing, China). Rosuvastatin calcium tablets (RSV) were purchased from Chia-Tai Tianqing Pharmaceutical Group Co., Ltd (Nanjing, China). High fat and high cholesterol (HFHC) diets with 1.25% cholesterol (XT108C) and control diets (XT102C) were purchased from Jiangsu Synergetic Pharmaceutical Bioengineering Co., Ltd (Nanjing, China). 2,5-Dihydroxybenzoic acid (DHB), formic acid, and lithium trifluoroacetic acid (LiTFA) were purchased from Sigma-Aldrich (Shanghai, China). LC-MS grade acetonitrile, methanol and water were collected from Fisher Scientific (Fair Lawn, NJ). Other chemical reagents were of analytical grade.
2.2 Animal experiments
Male C57BL/6 mice (n = 6) and ApoE−/− mice (n = 24) with 8–10 weeks old weighing (20 ± 2) g were purchased from Zhengzhou Chuangsheng Biological Engineering Co., Ltd (Zhengzhou, China), and fed in the Experimental Animals Center of Zhengzhou University. The mice were fed in an animal room with constant temperature (23 ± 2) °C and (60 ± 5)% relative humidity under a 12 h dark/light cycle. They had free access to diets and water ad libitum for a week before the tests. The animal protocols were approved and conducted based on the guidelines of Laboratory Animal Ethics Committee of Zhengzhou University. All experimental procedures were in accordance with the Guide for the Care and Use of Laboratory Animals (National Institute of Health).
Five groups including control group (wild-type C57BL/6 mice, control diets, n = 6), model group (ApoE−/− mice, HFHC diets, n = 6), rosuvastatin group (ApoE−/− mice, HFHC diets, n = 6), AMB group (ApoE−/− mice, HFHC diets, n = 6) and ACGD group (ApoE−/− mice, HFHC diets, n = 6) were set in this study. According to recommended doses for human and mice in previous reports (Chinese Pharmacopoeia Commission, 2020; Lee et al., 2010; Qin et al., 2016a), the dosages for AMB and ACGD extracts in this study were both 600.0 mg/kg/day. And the RSV dosage for intragastric administration was 2.0 mg/kg/day. During HFHC modeling for 12 weeks, the mice were treated with 0.3%CMC-Na, 0.3%CMC-Na, RSV solution, AMB extracts and ACGD extracts for control group, model group, RSV group, AMB group and ACGD group, respectively. All mice were fasted overnight before experiments. Blood samples were collected through the extraction of eyeball method. And serum samples were obtained after centrifugation at 3000 rpm for 10 min. The assay kits were used to test the serum levels of TC, TG, HDL-C, LDL-C, LDH and CK-MB. The heart and aortic valve tissues were fixed in 4% paraformaldehyde in phosphate buffered saline (PBS) and further embedded in paraffin. The paraffin sections were used to perform hematoxylin-eosin staining, Masson staining and Oil Red O staining analysis.
2.3 Sample preparation and extraction
The fresh bulbs of AMB and ACGD were steamed penetrably and dried in the sun, respectively. The dried samples were freeze-dried by vacuum freeze-dryer (Scientz-100F). Then, the freeze-dried AMB and ACGD samples were crushed using a mixer mill (MM400, Retsch) with a zirconia bead for 90 s (30 Hz). The obtained lyophilized powders (100 mg) were dissolved in 70% methanol solution (1.2 mL), and vertexing the mixture for 30 s every 30 min for 6 times in total. The samples were stood in a 4 °C refrigerator overnight, and centrifugated at 13800 g for 10 min. The supernatants were filtrated with 0.22 μm membrane (SCAA-104, ANPEL, Shanghai, China) and injected into UHPLC-MS/MS or UHPLC- triple-TOF/MS system to acquire data.
2.4 UHPLC-MS conditions
The chromatographic separation was achieved using a UHPLC system (SHIMADZU Nexera X2) on an Agilent SB-C18 column (1.8 µm, 2.1 mm × 100 mm) with water and acetonitrile both including 0.1% formic acid. The gradient programs employed the starting conditions of 5% B. Within 9 min, a linear gradient to 95% B was programmed, and a composition of 95% B was kept for 1 min. Subsequently, a composition of 5.0% B was adjusted within 1.1 min and kept for 2.9 min. The flow rates and column temperature were 0.35 mL/min and 40 °C, respectively. The injection volume was 4 μL. The effluent was alternatively connected to an ESI-QTRAP/MS or an ESI-TOF/MS system.
The UHPLC system was coupled to a triple quadrupole-linear ion trap mass spectrometer (AB4500 Q TRAP system) equipped with an ESI turbo ion-spray interface, operating in both positive and negative ion modes, and controlled and processed by Analyst 1.6.3 software (AB SCIEX). The operation parameters were as follows: source temperature 550 °C; ion spray voltage 5500 V (ESI+)/−4500 V (ESI−); ion source gas I, gas II, curtain gas was set at 50, 60, and 25 psi, respectively; polypropylene glycol solutions with 10 and 100 μmol/L were used to carry out the instrument tuning and mass calibration in QQQ and LIT modes, respectively. And QQQ scans were performed under multiple reactions monitoring (MRM) modes with collision gas (nitrogen) set to medium. De-clustering potential (DP) and collision energy (CE) were optimized based on the characteristics of each metabolite. A specific set of optimized MRM transitions were monitored for each period according to the detected metabolites eluted within this period.
For the qualitative analysis, the UHPLC system was coupled to a triple time of flight (TOF) 6600 mass spectrometer (AB SCIEX) with ESI mode. The parameters were as follows: source temperature 650 °C; ion spray voltage 5.5 kV (ESI+) and 4.5 kV (ESI−); gas I 40 psi; gas II 80 psi; curtain gas pressure 25 psi. TOF/MS scan information dependent acquisition (IDA)-product ion scan mode was applied to collect data. The IDA principle for precursor ions filtering was that the top 15 most intense precursor ions with an intensity greater than 10 cps were selected after the dynamic background subtraction was opened. The m/z ranges and accumulation times for TOF-MS scan were 100–2000 Da and 250 ms, respectively, while these for TOF-MS/MS were 50–2000 Da and 50 ms, respectively. Meanwhile, a collision energy of 35 eV and a collision energy spread of 15 eV were set for TOF-MS/MS analysis.
2.5 Chemical profiling of primary and secondary metabolites
For the identification and characterization of metabolites in AMB and ACGD, a self-built database of primary and secondary metabolites was established and named Metware Database (Wuhan Metware Biotechnology Co., Ltd., Wuhan, China) (Chen et al., 2013; Li et al., 2022b). This database annotated the detailed retention times, primary and secondary MS data of metabolites by UHPLC-TOF/MS and UHPLC-MS/MS. During the analysis, the interference signals including repeated signals of Na+, K+, and NH4+ ions, the isotope signal, and repetitive signals of fragment ions, were first excluded to ensure the accuracy and specificity of metabolite annotations. Further, the structures of metabolites were elucidated in reference to Metware Database and several public databases including MassBank (https://www.massbank.jp), ChemSpider (https://www.chemspider.com/), and METLIN (https://metlin.scripps.edu/index.php) (Yan et al., 2019).
2.6 Multivariate data analysis
After the acquired experiment data was unit variance scaled, an unsupervised principal component analysis (PCA) between AMB and ACGD samples were carried out using the Metware Cloud, a free online platform for data analysis (https://cloud.metware.cn). Furthermore, after the data was processed with log transform (log2) and mean centering analysis, orthogonal partial least squares discrimination analysis (OPLS-DA) model was obtained, and the p values and variable importance in the projection (VIP) values were derived from OPLS-DA model. Meanwhile, a total of 200 permutations fitting was performed to avoid overfitting. Traditionally, the well-accepted principles for identifying the differential metabolites were that VIP values ≥1.0, fold change ≥2 or ≤0.5, and p values <0.05. In addition, normalized signal intensities of differentially expressed metabolites (unit variance scaling) were visualized as a color spectrum. The radar chart, bar chart and correlation net plot were also used to more visually display the differential metabolites between AMB and ACGD samples.
2.7 KEGG annotation and enrichment analysis
Identified differential metabolites between AMB and ACGD were annotated using KEGG Compound database (https://www.kegg.jp/kegg/compound/), whereas the annotated metabolites were then mapped to KEGG Pathway database (https://www.kegg.jp/kegg/pathway.html). The mapped pathways with significantly regulated metabolites were then fed into MSEA (metabolite sets enrichment analysis), and their significances were obtained by hypergeometric test’s p values. In addition, differential abundance score plot was used to better explain the differential metabolic pathways between AMB and ACGD groups.
2.8 Sample preparation for MALDI MSI assays
The fresh bulbs of AMB and ACGD were first crosscut. 0.5% CMC-Na solutions were used to fix the crosscut zone of fresh bulbs for cryosectioning. Leica CM1950 cryostat (Wetzlar, Germany) was used to crosscut the samples with 10 μm thickness at 20 °C. Afterwards, the cross sections were placed on electrically conductive slides coated with indium tin oxide (ITO), and the slides were dried in a vacuum desiccator for 0.5 h. Methanol-water solution (V/V, 9:1) containing 0.1 % LiTFA was used as the solvent to prepare DHB solution (15 mg/mL). Further, TM-Sprayer matrix spray apparatus was used to ensure that the DHB matrix solution was sprayed evenly on the ITO slide. The instrument parameters were as follows: temperature of 75 °C, flow rate of 0.1 mL/min, pressure of 8 psi; 24 cycles of sprays; and the drying time between each cycle was 10 s. The sprayed ITO slides were performed for data acquisition by MALDI timsTOF/MS.
2.9 MALDI MS imaging conditions
Bruker timsTOF flex MS system (Bruker Daltonics, Bremen, Germany) equipped with a smart beam 3D laser (10 kHz) was used to perform the MALDI MSI measurements. The laser power was set to 80%, and then it was fixed throughout the whole experiment. The mass ranges were m/z 200–1300 Da in positive ion mode. The imaging spatial resolution was set as 100 μm laser step size, and each MSI spectrum consisted of 500 laser shots. The MALDI mass spectra were first normalized with the Root Mean Square, and the signal intensity for each MSI image was displayed as the normalized intensity. Meanwhile, MS/MS fragmentations derived from the timsTOF flex MS system were used for further structural elucidation of the identified or tentatively characterized metabolites.
2.10 Statistical analysis
All data were presented as mean ± standard deviation (n = 6). The significant differences between treatment and control groups were obtained using Student’s t-test, and set at p < 0.05, p < 0.01 (**) and p < 0.001 (***).
3 Results
3.1 Morphologies of AMB and ACGD bulbs
As shown in Fig. 1A, the morphologies of fresh AMB and ACGD bulbs are significantly different. AMB bulbs are externally yellowish-white or pale yellowish-brown, and irregularly circular or ovoid with 0.5–2.0 cm in diameter and 1.5–3.0 cm high (Fig. 1A). In addition, the fresh ACGD bulbs are externally pale yellowish-brown or brown, and lightly compressed long-ovate with 1.0–3.0 cm in diameter and 2.0–7.0 cm high (Fig. 1A). The cross cutting and longitudinal cutting graphs showed that the AMB and ACGD bulbs both consisted of tunics, leaf scales, and developing flower buds (Fig. 1B). After the fresh bulbs of AMB and ACGD were both steamed penetrably, the samples were dried in the sun. The final appearances of dried AMB and ACGD samples were displayed in Fig. 1C. The morphological sizes of ACGD were obviously larger than those of AMB.
The appearance of two Allium varieties. (A) the morphology of fresh AMB and ACGD bulbs; (B) the cross section and longitudinal section of two fresh bulbs; (C) dried bulbs of AMB and ACGD samples.
3.2 Anti-atherosclerosis effects of AMB and ACGD extracts
In this study, the body, mesentery, epididymal fat, inguinal fat of HFHC-fed mice (with or without drug treatment) was weighed at the end of the experiment. As shown in Fig. 2A, mice in the model group exhibited a remarkable weight-gain compared to those in control group. Intervention with RSV, AMB or ACGD extracts for 12 weeks significantly reversed this increase of weight-gain in HFHC-fed mice as compared to those in model group. Consistently, a significant elevation in the weight of mesentery (Fig. 2B) and inguinal fat (Fig. 2D) was detected in the model mice with respect to the control mice, while no significant alterations of epididymal fat (Fig. 2C) were observed between model and control groups.
Effects of AMB and ACGD treatment on body weight, fat and metabolic lipid disorders in HFHC-induced AS development. (A) Representative mice pictures and final body weight; (B) appearance of mesentery and weight comparison; (C) comparison of epididymal fat; (D) comparison of inguinal fat; (E) Biochemical analyses including TG, TC, HDL-C and LDL-C; (F) levels of serum CK-MB and LDH in various experimental groups. Data are presented as mean ± SD (n = 6) (*p < 0.05, **p < 0.01, ***p < 0.001).
As shown in Fig. 2E, HFHC feeding induced a significant elevation of serum TG, TC, LDL-C levels with respect to the control group. AMB or ACGD extracts treatment significantly lowered these levels, compared with untreated model group. And the HDL-C level did not alter after oral administration of AMB or ACGD extracts. In addition, HFHC-fed mice exhibited high-level indicators of myocardial injury including LDH and CK-MB than those in control group (Fig. 2F). And RSV, AMB or ACGD extracts treatment could reduce the release of these myocardial injury factors in treated model mice.
Pathological results of heart tissue could visually show the course of atherosclerosis. In control group, the mice myocardium was uniformly stained and the cardiomyocytes were neatly arranged (Fig. 3A). Meanwhile, the morphology and structure of myocardial cells were complete. And there were fewer cell swelling or necrosis (Fig. 3A). For model group, the arrangement and distribution of myocardial cells was obviously loose and the gap between muscle fibers significantly became larger as a whole (Fig. 3B). In addition, some nuclei of myocardial cell were blurred or even disappeared. And obvious defects and blank areas could be observed (Fig. 3B). Furthermore, after intragastric administration of RSV (Fig. 3C), AMB extracts (Fig. 3D) or ACGD extracts (Fig. 3E), the morphology and arrangement of cardiac myocytes remarkably improved, implying their myocardial protection effects.
The HE staining results of mice heart tissues. (A) control group; (B) model group; (C) RSV group; (D) AMB extracts group; (E) ACGD extracts group. The scales were 2.5 mm and 100 μM (magnification, 25×).
Masson staining results demonstrated that model mice myocardial fibrosis was obviously aggravated along with some nuclei blurred or even disappeared (Fig. 4B) comparing with those in control group (Fig. 4A). In treatment group, the development of myocardial fibrosis got relief after oral administration of RSV (Fig. 4C), AMB extracts (Fig. 4D) and ACGD extracts (Fig. 4E). Moreover, visual changes of artery atherosclerotic plaques in heart aortic valve among multiple groups could be observed based on the oil red O staining results (Fig. 5). Obviously, fewer atherosclerotic plaques were detected in control mice (Fig. 5A), whereas massive plaques were deposited on the intima of the artery in model mice (Fig. 5B). RSV treatment (Fig. 5C) exhibited stronger anti-atherosclerotic plaque formation effects than those of AMB group (Fig. 5D) and ACGD group (Fig. 5E), following with the average lesion areas of plaques shown in Fig. 5F.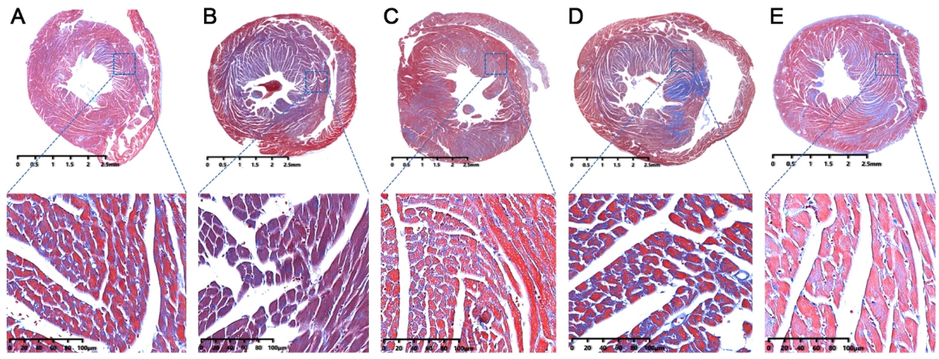
The Masson staining results of heart tissues in mice. (A) control group; (B) model group; (C) RSV group; (D) AMB extracts group; (E) ACGD extracts group. The scales were 2.5 mm and 100 μM (magnification, 25×).
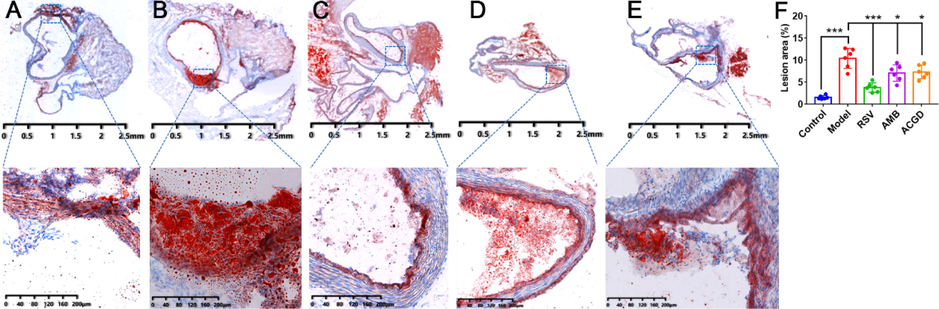
Photomicrographs of plaques at aortic valves stained with Oil red O. (A) control group; (B) model group; (C) RSV group; (D) AMB extracts group; (E) ACGD extracts group; (F) lesion area percentage of the total aorta. The scales were 2.5 mm and 200 μM (magnification, 12.5×). Data were shown as mean ± SD (n = 6). (*p < 0.05, ***p < 0.001).
3.3 Chemical profiling of primary and secondary metabolites in AMB and ACGD samples by UHPLC-MS/MS
The AMB and ACGD samples were both acquired the original data under multiple reaction monitoring (MRM) modes in positive and negative ion modes. And the MRM overlay chromatograms of AMB samples were shown in Fig. S1A and B as well as those of ACGD samples in positive ion mode (Fig. S1C) and negative ion modes (Fig. S1D). Further, the obtained data were browsed and processed under Analyst platform (AB SCIX). Identification and tentatively characterization of primary and secondary metabolites in these two vegetables were performed based on the retention time behaviors and mass spectra properties comparing with the reference standards in Metware Data Library.
A total of 693 metabolites including 42 carbohydrates and derivatives, 101 lipids, 115 amino acids and derivatives, 62 nucleotides and derivatives, 87 organic acids, 16 vitamins and derivatives, 119 phenolic acids, 48 alkaloids, 54 steroidal saponins, 11 flavonoids, 5 quinones, 15 lignans and coumarins, and 18 other compounds were profiled in AMB and ACGD bulbs by UHPLC-MS/MS (Table S1). The match levels 1 and 2 meant that the match scores were over 0.7 and 0.5–0.7 after comparing the MS/MS spectra and retention times of detected metabolites with those of reference standards in Metware Database, respectively. Match level 3 meant that the characterized metabolites had the same or similar parameters of Q1, Q3, de-clustering potential (DP), and collision energy (CE) of reference standards in Metware Database. Obviously, massive primary metabolites were firstly detected and characterized in AMB and ACGD (Table S1). And they were also the important compositions for growth, development, nutrition accumulation, defense against pests, biosynthesis of secondary metabolites, and so on. In addition, steroidal saponins were both the main characteristic and active components for AMB and ACGD as described previously (Qin et al., 2016a, 2016b, 2018).
3.4 Elucidation of secondary metabolites firstly detected from AMB and ACGD samples by UHPLC-TOF/MS
Except steroidal saponins, another 32 secondary metabolites mainly including 13 flavonoids, and 10 lignans and coumarins were detected and reported in AMB and ACGD for the first time (Table 1). Herein, we would elucidate their structure based on the retention times and fragmentation behaviors comparing with those of reference standards in Metware Database.
No.
Index
RT
(min)Formula
Ionization
Observed
Ion
(Q1, Da)Error
(ppm)TOF-MS/MS data
(Q3, Da)MALDI MSI data
Compounds
Origin
Ionization
Error
(ppm)
Flavonoids
1
mws1073
3.03
C27H30O15
[M + H]+
595.1642
−3.5
577.1556 559.1406 457.1132
427.1009 409.0916 379.0834617.1482
0
Apigenin-6,8-di-C-glucoside
AMB/ACGD
2
pmp001106
3.28
C27H30O15
[M + H]+
595.1642
−3.5
577.1738 457.1093 379.0781
617.1482
0
vitexin-2″-O-glucoside
ACGD
3
pmp000127
3.29
C28H32O16
[M + H]+
625.1750
−3.0
607.1772
625.1769
0
Chrysoeriol-6,8-di-C-glucoside
AMB/ACGD
4
Lmtp002474
3.30
C26H28O14
[M + H]+
565.1518
−6.9
547.1412 499.1220 427.1038
409.0822 391.0746587.1377
0
Apiin
ACGD
5
Lmzn001875
3.35
C33H42O19
[M − H]−
741.2213
−3.9
579.2049 417.1521
765.2182
−4.7
Naringenin-7-O-rutinoside
−4′-O-glucosideAMB/ACGD
6
MWSHY0181
3.78
C21H20O10
[M + H]+
433.1108
−6.2
415.1031 397.0920 313.0710
283.0600 149.0177433.1181
10.6
Vitexin
AMB/ACGD
7
Lmfn004093
4.19
C21H24O10
[M − H]−
435.1282
−2.1
315.0696 315.0696 297.0595
229.0846 153.0185475.1007
0
Phloretin-4′-O-glucoside
AMB/ACGD
8
MWSslk115
6.16
C15H10O3
[M + H]+
239.0697
−4.6
193.1238 151.0767 137.0586
277.0273
2.2
7-Hydroxyflavone
AMB/ACGD
9
MW0183341
/
C15H10O9S
[M + K]+
/
/
/
404.9691
2.0
Kaempferol 3-O-sulfate
AMB/ACGD
10
MW0192786
/
C29H32O18
[M + H]+
/
/
/
669.1662
−0.7
Quercetin-3-O-(6″-acetyl)-glucosyl-
(1 → 3)-galactosideAMB/ACGD
11
MW0192887
/
C36H42O24
[M + H − H2O]+
/
/
/
841.2012
−3.2
Kaempferol-3-O-(6″″-malonyl)-
sophorotriosideAMB/ACGD
12
MW0193305
/
C47H56O28
[M + H]+
/
/
/
1069.2945
−8.6
Chrysoeriol-7-O-(6″'-galloyl)-
rutinoside-4′-O-rutinosideAMB/ACGD
13
MW0111138
/
C33H34O24
[M + H]+
/
/
/
815.1573
6.8
Luteolin 7-O-[β-D-glucuronosyl-
(1 → 2)-β-D-glucuronide]-4′-O-β-D-
glucuronideAMB/ACGD
Alkaloids
14
pme2268
0.85
C7H7NO2
[M + H]+
138.0546
−6.5
94.0643 78.0361
/
/
Trigonelline
AMB/ACGD
15
pmp001017
4.75
C27H41NO2
[M + H]+
412.3193
−5.6
412.3063 255.2462 207.1465
434.2999
−8.2
Ebeinone
ACGD
16
pmp001018
4.80
C27H43NO2
[M + H]+
414.3354
−4.3
414.3122
452.2952
4.6
Puqiedinone
AMB/ACGD
Lignans and Coumarins
17
Lmtn003096
3.56
C26H36O11
[M − H]−
523.2161
−3.4
361.1619 249.0402
563.1895
0
Secoisolariciresinol 4-O-glucoside
AMB/ACGD
18
Cmpp003619
3.62
C10H8O4
[M + H]+
193.0505
2.1
161.0769 105.0735
/
/
6,7-Dihydroxy-4-methylcoumarin
AMB/ACGD
19
Cmqn003939
3.65
C34H46O18
[M − H]−
741.2601
−0.7
501.1739 179.0543 119.0333
781.2321
0
Liriodendrin
AMB/ACGD
20
Zmln002252
4.11
C10H8O6
[M − H]−
223.0243
0.0
208.0404 193.0180 149.0290
135.0471 121.0315 93.0382247.0249
12.1
Sideretin
AMB/ACGD
21
Zmhn001446
4.19
C28H36O13
[M − H]−
579.2073
−0.9
417.1538 339.1227 181.0492
603.2054
0
syringaresinol-4′-O-glucopyranoside
AMB/ACGD
22
Rfmb26201
4.52
C30H38O14
[M − H]−
621.2179
−0.6
417.1551 113.0146
645.2159
0
syringaresinol-4′-O-(6″-acetyl)-
-glucosideAMB/ACGD
23
MWS20152
5.27
C22H26O8
[M − H]−
417.1538
−2.6
402.1271 387.1046 181.0486
166.0254 151.0015457.1250
−3.3
Syringaresinol
AMB/ACGD
24
mws0097
5.48
C20H22O6
[M − H]−
357.1326
−3.4
342.1133 151.0439 136.0180
359.1487
−2.2
Pinoresinol
AMB/ACGD
25
Hmlp003129
5.81
C20H22O6
[M + H]+
359.1512
4.7
323.0866 207.0640 137.0584
359.1487
−2.2
Matairesinol
AMB/ACGD
26
MWSslk183
6.11
C15H10O4
[M + H]+
255.0657
0.0
237.0641 209.0702 181.0756
154.0669255.0639
−7.1
7,8-Dihydroxy-4-phenylcoumarin
AMB/ACGD
Quinones
27
Wmhn001575
2.34
C16H18O8
[M − H]−
337.0914
−2.7
175.0964 129.0908 59.0139
/
/
1,4,8-Trihydroxynaphthalene-
−1-O-glucosideAMB/ACGD
28
Zmdn011161
10.81
C15H12O3
[M − H]−
239.0698
−4.2
223.0258 149.0086 91.0208
/
/
Chrysophanol-9-anthrone
AMB/ACGD
Others
29
Smcp000882
2.01
C15H21NO7
[M + H]+
328.1381
−4.6
310.1287 292.1188 264.1227
166.0862 132.0797 120.0807/
/
N-benzoyl-2-aminoethyl-
-β-D-glucopyranosideAMB/ACGD
30
MWSslk216
2.91
C22H30O14
[M − H]−
517.1548
−1.7
397.1106 385.1099 235.0583
223.0593 193.0500 175.0390
541.1533
0
Sibiricose A5
AMB/ACGD
31
Cmsp003083
3.06
C26H32O11
[M + H]+
521.1993
−5.8
291.0944 161.0579 131.0489
/
/
Dehydrodiconiferyl alcohol-
−4-O-glucosideAMB/ACGD
32
ML10174588
9.19
C15H22O2
[M − H]−
233.1539
−1.3
233.1589
/
/
Confertifoline
AMB/ACGD
For peak 1, it gave the [M + H]+ ion at m/z 595.1642 (−3.5 ppm) by TOF/MS and the [M + Na]+ ion at m/z 617.1482 (0 ppm) by MALDI/TOF scan. Its TOF-MS/MS scan showed the fragment ions at 577.1556, 559.1406, 457.1132, 427.1009 and 409.0916 were same as described previously (Fig. S2) (Picariello et al., 2017). Therefore, Peak 1 was identified as apigenin-6,8-di-C-glucoside. Similarly, peak 6 was regarded as vitexin because they had similar [M + H]+ ion at m/z 433.1108 (−6.2 ppm) and characteristic ions at m/z 415.1031, 397.0920 and 313.0710 with previous report (Fig. S2) (Avula et al., 2021). In addition, peaks 2 and 4 were considered as vitexin-2″-O-glucoside and apigenin-6-C-(2″-glucosyl)-arabinoside due to the retention times and fragmentation patterns, respectively (Table 1 & Fig. S2) (Li et al., 2022a, Picariello et al., 2017). For peak 9, the MALDI-TOF/MS scan gave the [M + K]+ ion at m/z 404.9691 (2.0 ppm) with a formula of C15H10O9S. Kaempferol 3-O-sulfate exhibited the match score of 0.844 in the Metware Database (Fig. S2) (Meriçli, 1988). Similarly, peaks 10 and 11 were regarded as quercetin-3-O-(6″-acetyl)-glucosyl-(1 → 3)-galactoside and kaempferol-3-O-(6″″-malonyl)-sophorotrioside because they showed [M + H]+ and [M + H-H2O]+ ions at m/z 669.1662 (−0.7 ppm) and 841.2012 (−3.2 ppm) with match scores of 0.997 and 0.885 in Metware Database (Table 1 & Fig. S2).
For peak 23, it displayed [M − H]− ion at m/z 417.1538 (−2.6 ppm) by Q-TOF/MS and [M + K]+ ion at m/z 457.1250 (−3.3 ppm) by MALDI-TOF/MS (Table 1). The TOF-MS/MS scan gave the product ions at m/z 402.1271, 387.1046, and 181.0486 which kept in line with previous study (He et al., 2018a). Therefore, peak 23 was characterized as syringaresinol (Fig. S2). In the same way, peaks 21 and 22 were considered as syringaresinol-4′-O-glucopyranoside and syringaresinol-4′-O-(6″-acetyl)-glucoside based on the retention behaviors and diagnostic fragment ions (Table 1 & Fig. S2) (He et al., 2018a; Wang et al., 2017). Peak 18 showed [M + H]+ ion at m/z 193.0505 (2.1 ppm) and product ions at m/z 161.0769 and 105.0735 by MALDI-TOF/MS, while peak 26 gave the [M + H]+ quasi-molecular and fragment ions at 255.0657 (0 ppm), and 237.0641, 209.0702, 181.0756 and 154.0669 (Table 1 & Fig. S2). After matching with Metware Database, peaks 18 and 26 were tentatively characterized as 6,7-dihydroxy-4-methylcoumarin and 7,8-dihydroxy-4-phenylcoumarin, respectively (Kancheva et al., 2010).
Peaks 9–13 were mainly detected by MALDI-TOF/MS and not observed by TOF-MS (Table 1). Therefore, the TOF-MS/MS data of these five compounds were absent and they were deciphered based on MALDI-TOF/MS data and Metware Database. For other compounds, abundant TOF-MS/MS data and spectra were shown in Table 1 & Fig. S2, which benefited their structural elucidation.
3.5 Identification of differential primary and secondary metabolites between AMB and ACGD groups
First, the overlay total ion chromatograms (TICs) of QC samples in positive and negative ion modes (Fig. S3A and B) showed the high stability of the testing instrument. And the coefficients of variation in empirical cumulative distribution function also demonstrated the LC-MS data have a good stability (Fig. S3C). In addition, there were remarkable differences between AMB and ACGD samples because they could be significantly separated in unsupervised PCA plot with the first principal component (PC1) and second principal component (PC2) of 76.66% and 7.94% for the total variances (Fig. 6A). The fact that PC1 values of all samples were with ±2 × standard deviation also indicated that the instrument status was stable (Fig. S4A). And it was more reliable for the identification of differential metabolites if the correlation coefficients of intra-group samples relative to inter-group samples were higher (Fig. S4B).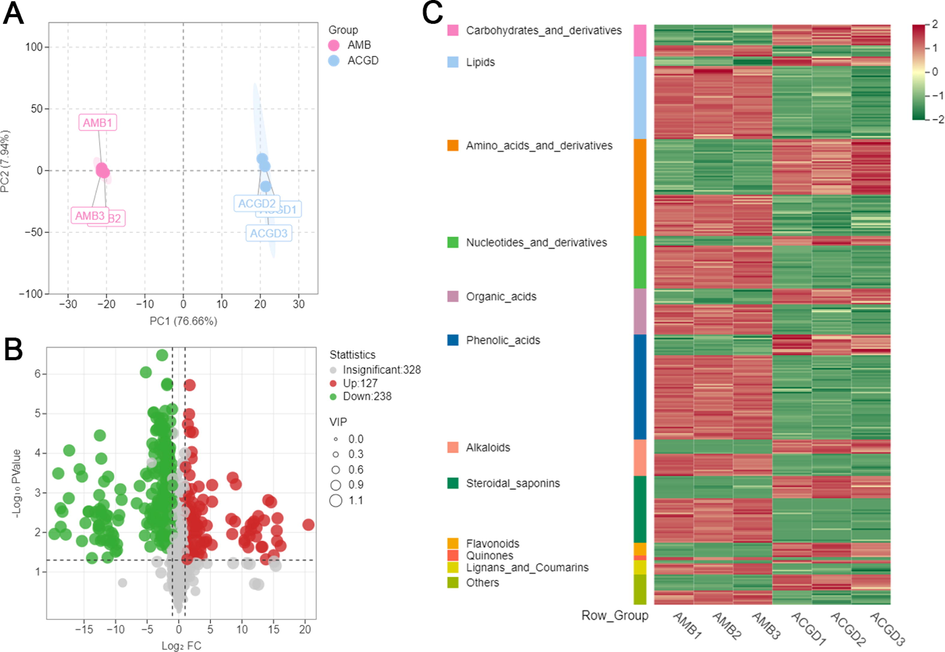
Multivariate data analysis of AMB and ACGD samples. (A) the principal component analysis (PCA) between AMB and ACGD samples by UHPLC-MS/MS; (B) Volcano plots of differentially metabolites between AMB and ACGD samples; (C) the heat-map of multiple differentially metabolites between these two herbs. The green dots represent down-accumulated compounds, and the red dots represent up-accumulated metabolites between these two vegetables.
Furthermore, orthogonal partial least squares discriminant analysis (OPLS-DA) model with T score of 76.5% and orthogonal T score of 8.6% was developed and applied to identify the most important contributors to grouping through deleting unrelated variances (Fig. S5A). The permutation validation results of R2X (0.851), Q2 (0.994, p < 0.005) and R2 (1, p < 0.005) showed the OPLS-DA model had a high separating capacity, and the permutations (n = 200) for this model did not overfit (Fig. S5B). Then, OPLS-DA S-plot was introduced to obtain the variable influence on projection (VIP) values (Fig. S5C). The data including the VIP values, p-values and fold-change values of tested metabolites was performed the volcano plot (Fig. 6B). A total of 365 metabolites (127 up-regulation and 238 down-regulation) were appraised as the differential variables between AMB and ACGD samples based on the three principles: VIP ≥ 1, p-value < 0.05, fold change ≥ 2 or ≤ 0.5 (Table S2).
As shown in Fig. 6C, a visual heat-map including 365 differential variables was emerged to better investigate the differences of primary and secondary metabolites between AMB and ACGD samples. These findings could understand the overall trends of each type of metabolites. To better present the contribution of differential metabolites, the radar chart and bar chart of Top40 fold changes differential metabolites were displayed in Fig. S6A and B, respectively. To better display the intra-group differences, histogram comparisons of Top40 fold change differential metabolites between AMB and ACGD samples were shown in Fig. S7. Obviously, primary metabolites (carbohydrates, amino acids, lipids, etc.) and secondary metabolites (steroidal saponins, flavonoids, alkaloids, etc.) fluctuated the most between AMB and ACGD groups. In addition, correlation net plot (Fig. S6C) also proved that these main secondary compounds were closely related to several primary metabolites. Therefore, it was necessary to interpret the biosynthesis pathways of primary and secondary metabolites in these two vegetables.
3.6 KEGG pathways of differential metabolites in AMB and ACGD samples
To better decipher the basic roles of these differentially regulated metabolites, we analyzed the KEGG metabolic pathways disturbed by these metabolites. As shown in Fig. S8A and B, the enrichment metabolic pathway analysis illustrated these differential metabolites were involved in many metabolic pathways including the biosynthesis of secondary metabolites, linoleic acid metabolism, purine metabolism, pyrimidine metabolism, tyrosine metabolism, and so on. And the differential abundance score (Fig. S8C) also showed the overall changes of the metabolites in linoleic acid metabolism, purine metabolism, tyrosine metabolism, α-linoleic acid metabolism and ascorbate and aldarate metabolism pathways were down-regulated in AMB than those in ACGD. On the contrary, the general trends of the primary metabolites derived from AMB for the vitamin B6 metabolism, glutathione metabolism, lysine metabolism were up-regulated than those in ACGD.
Actually, there were no significant differences between the levels of D-glucose, D-galactose, D-fructose, D-sucrose and raffinose in AMB and ACGD samples (Fig. 7A). In contrast, stachyose and manninotriose were both obviously up-regulated in ACGD along with the increased activity of β-fructofuranosidase. The activity of L-threonate 3-dehydrogenase could also be increased due to the remarkable elevation of 3-Dehydro-L-threonate. Similarly, the function of rhamnulose-1-phosphate aldolase may be improved in ACGD. In addition, the levels of D-glucuronate and D-glucurono-lactone decreased with the reduction of uronolactonase. The catalytic capacity of L-gulonolactone oxidase and glucuronolactone reductase may be partially inhibited because the levels of D-glucurono-lactone and D-ascorbate were both decreased.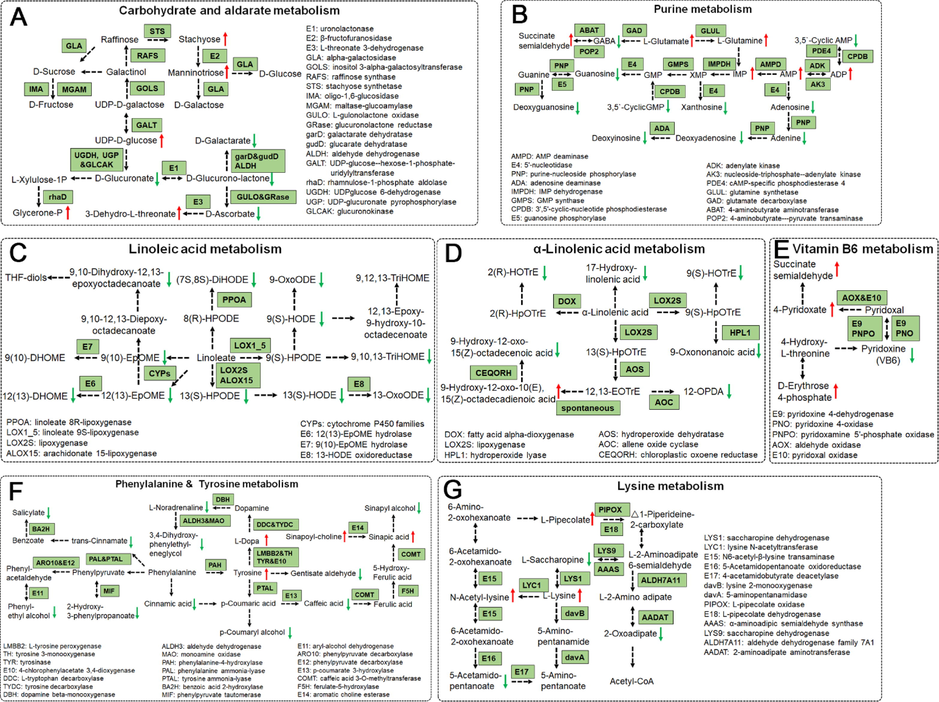
The main KEGG enrichment pathways of differential metabolites between AMB and ACGD samples. (A) carbohydrate and aldarate metabolism; (B) purine metabolism; (C) linoleic acid metabolism; (D) α-linolenic acid metabolism; (E) vitamin B6 metabolism; (F) phenylalanine & tyrosine metabolism; (G) lysine metabolism. Red and green arrows represent up-accumulated and down accumulated metabolites, respectively.
Purine metabolism was another important differential metabolic pathway between AMB and ACGD groups. As shown in Fig. 7B, most metabolites in purine metabolism pathways were down-regulated in AMB, such as guanosine, deoxyguanosine, 3,5′-cyclic-GMP, xanthosine, adenosine, adenine, deoxyadenosine, deoxyinosine, and so on. This trend kept in line with the total levels of nucleotides and their derivatives (Fig. 6C). These may be attributed to the decreased activities of 5′-nucleotidase, purine-nucleoside phosphorylase and AMP deaminase. On the contrary, several main precursors for purine synthesis including succinate semialdehyde, L-glutamate, and L-glutamine were markedly higher in AMB samples. And the more efficient catalytic activities of adenylate kinase, nucleoside-triphosphate-adenylate kinase, and AMP deaminase may result in higher levels of IMP, AMP and ADP.
Almost the metabolites in linoleic acid metabolism and α-linoleic acid metabolism were all down-regulated in AMB than those in ACGD (Fig. 7C and D). These findings also indicated that the most key enzymes including cytochrome P450 families, lipoxygenase, linoleate 8R-lipoxygenase, 12(13)-EpOME hydrolase, 13-HODE oxidoreductase, and arachidonate 15-lipoxygenase for linoleic acid metabolism were down-regulated in AMB. Similarly, the reduced functions of hydroperoxide lyase, allene oxide cyclase, and chloroplastic oxoene reductase may bring the decreased levels of primary metabolites for α-linoleic acid metabolism. In total, these phenomena were consistent with the overall trends of lipids expression in AMB and ACGD samples as shown in Fig. 6C.
For the metabolism of phenylalanine and tyrosine, the levels of most metabolites were lower in AMB than those in ACGD (Fig. 7F). For example, the metabolites of phenylalanine containing phenylethyl alcohol, 2-hydroxy-3-phenylpropanoate, trans-cinnamate, cinnamic acid, salicylate, and the main metabolites containing p-coumaryl alcohol, caffeic acid, gentisate aldehyde and sinapyl alcohol were all down-regulated in AMB. This may be contributed to the reduced activities of phenylalanine ammonia-lyase, tyrosine ammonia-lyase, benzoic acid 2-hydroxylase, and aryl-alcohol dehydrogenase in phenylalanine metabolism, and p-coumarate 3-hydroxylase, dopamine beta-monooxygenase, aldehyde dehydrogenase and monoamine oxidase in tyrosine metabolism. For the lysine metabolism (Fig. 7G), the possible elevated activity of lysine N-acetyltransferase resulted in increase of N-Acetyl-lysine. In addition, the reduction of 5-acetamido-pentanoate, L-saccharopine, and 2-oxoadipate were attributed to the lower catalysis function of 5-acetamidopentanoate oxidoreductase, saccharopine dehydrogenase and 2-aminoadipate aminotransferase, respectively. In addition, the inhibited function of pyridoxine 4-dehydrogenase and pyridoxamine 5′-phosphate oxidase may bring a drop of pyridoxine (vitamin B6), while aldehyde oxidase and pyridoxal oxidase may result in a rise of 4-pyridoxate for the metabolism of vitamin B6 (Fig. 7E).
3.7 Visualization and spatial distribution of biosynthesis pathways of several main secondary metabolites in AMB and ACGD
As shown in Fig. 1B, the fresh bulbs of AMB and ACGD both consisted of tunics, leaf scales and developing flower buds. Each leaf scale orderly and alternately arranged between tunics and the developing flower buds. Over 90% of the whole transverse section were occupied by the leaf scales both in AMB and ACGD. In addition, the biosynthesis of secondary metabolites (especially steroidal saponins and flavonoids) was one of the most important differential metabolic pathways in KEGG analysis (Fig. S8A). Herein, we would decipher the spatial distribution of several main secondary metabolites in AMB and ACGD combination with MALDI MSI visual images for the first time.
AMB and ACGD were both particularly rich in steroidal saponins. The basic building block of steroidal saponins were sapogenins which could be further glycosylated with different hexose and/or pentose groups. And their sapogenins and sugar substituents in AMB and ACGD samples were significantly different. In addition, the proposed biosynthetic pathway and visual ion images (including formula, adduct ions, errors, etc.) of saponins in fresh bulb sections of AMB and ACGD were shown in Fig. 8. The errors of these corresponding adduct ions were almost <10.0 ppm. Obviously, two smaller sections which reflect the typical structural patterns of the produced intermediates involved in these conversions were displayed in the biosynthetic pathway of steroidal saponins. A sequence started the reactions from acetyl-CoA to cholesterol by series of active enzymes (Fig. 8A), and further formed different types of sapogenins (Fig. 8B). The sapogenins were primarily to bind different glycosyl substituents to produce the representative steroidal saponins in AMB and ACGD bulbs. Hecogenin and laxogenin (C27H42O4, [M + H]+, m/z 431.3136, −5.8 ppm) were the characteristic sapogenins for AMB and ACGD, respectively (Fig. 8B). However, they had the same formula, and carbonyl substitution at different positions of sapogenins, the MALDI MS spectra gave their visual MSI images. A similar isomer situation also occurred for other steroidal saponins. In total, the MSI ion images demonstrated that most quasi-molecular ions were distributed in the tunic and outside leaf scale regions of AMB, while these same or similar ions were observed in tunic and the whole leaf scales of ACGD. These ions in AMB and ACGD were all rarely distributed in developing flower buds.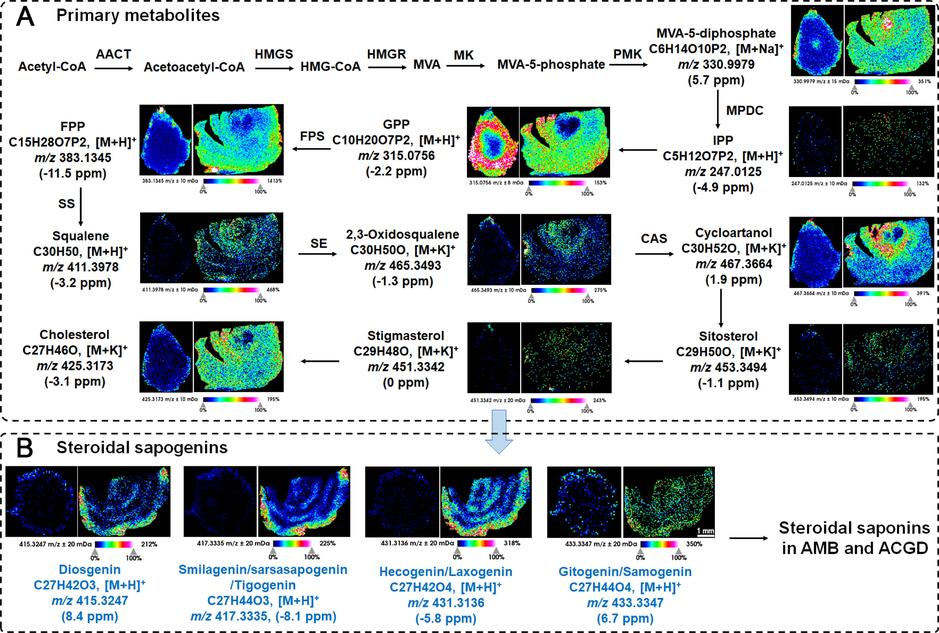
MALDI MSI-oriented visual distribution for steroidal saponins. (A) the spatial distribution of primary metabolites for the biosynthesis of steroidal saponins in AMB and ACGD samples; (B) the visual distribution of several sapogenins for steroidal saponins in these two herbs. The scale was 1 mm.
Besides, although several assays had been carried out to explore the biosynthetic pathway and localize synthetic enzymes of flavonoids, the information about the holistic spatial distribution of these products and intermediates in AMB and ACGD was limited. In the present study, we illustrated that MALDI MSI images could be used to visualize the accumulation sites of products and major intermediates in the biosynthetic pathway of flavonoids (Fig. 9). A total of 11 metabolites involved in the flavonoids biosynthetic pathway were visualized in AMB and ACGD bulbs, including apigenin-6,8-di-C-glucoside, vitexin-2″-O-glucoside, chrysoeriol-6,8-di-C-glucoside, and so on. This was the first time for the detection and report of these flavonoids from AMB and ACGD. As shown in Fig. 9, the distribution features of target metabolites in these two vegetables shared similarities and differences. For example, luteolin 7-O-[β-D-glucuronosyl-(1 → 2)-β-D-glucuronide]-4′-O-β-D-glucuronide ([M + H]+, m/z 815.1573, 6.8 ppm), vitexin 2″-glucoside ([M + Na]+, m/z 617.1482, 0 ppm) and quercetin-3-O-(6″-acetyl)-glucosyl-(1 → 3)-galactoside ([M + H]+, m/z 669.1662, −0.7 ppm) were all widely distributed in tunics and developing flower buds of AMB and ACGD bulbs. And several metabolites like kaempferol 3-O-sulfate ([M + K]+, m/z 404.9691, 2.0 ppm), naringenin-7-O-rutinoside-4′-O-glucoside ([M + Na]+, m/z 765.2182, −4.7 ppm) and chrysoeriol-6,8-C-glucoside ([M + H]+, m/z 625.1769, 0 ppm) were localized mainly tunics of AMB, and tunics and the whole leaf scales of ACGD bulbs.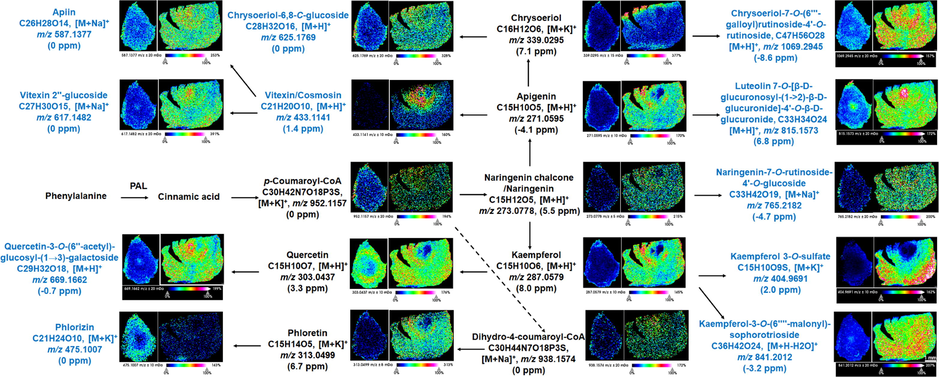
MALDI MSI images of several primary and secondary metabolites for the biosynthesis of flavonoids in AMB and ACGD fresh bulbs. The scale was 1 mm.
Except steroidal saponins and flavonoids, lignans and coumarins were another two important structural types of compounds in AMB and ACGD. And they had similar biosynthetic pathways with sinapic acid ([M + Na]+, m/z 247.0558, −9.7 ppm) and sinapyl alcohol ([M + K]+, m/z 249.0526, −1.2 ppm) as important intermediates mainly distributed in tunics and leaf scales of AMB and ACGD bulbs (Fig. S9). Then, a series of lignans including syringaresinol ([M + K]+, m/z 457.1250, −3.3 ppm), pinoresinol/matairesinol ([M + H]+, m/z 359.1487, −2.2 ppm), and their glycosides were represented in MALDI MSI images (Fig. S9A). They were mainly distributed in tunics and outside leaf scale of AMB, and located in tunics, the holistic leaf scale and rarely in developing flower buds of ACGD. The distribution characteristics of coumarins in AMB and ACGD was basically consistent with the spatial distribution of lignans. However, phellopterin ([M + K]+, m/z 339.0649, 4.1 ppm) was widely observed in the whole AMB and ACGD bulbs (Fig. S9B). And the spatial distribution of phellopterin displayed a clear descending trend from the developing flower buds to tunics and leaf scales in these two vegetables.
Moreover, the proposed biosynthetic pathway of rosmarinic acid in AMB and ACGD bulbs was visually observed in Fig. S10A. Tunics and outside leaf scales were the richest regions of rosmarinic acid ([M + Na]+, m/z 383.0771, 7.3 ppm) in these two bulbs, and it was also partially presented in developing flower buds. Meanwhile, the intermediates including salvianic acid A ([M + K]+, m/z 237.0147, −7.6 ppm) and isorinic acid ([M + H]+, m/z 345.1009, 9.6 ppm) were also mainly distributed in tunics and leaf scales. In addition, the intensity of alkaloids in AMB and ACGD were relatively poor. Therefore, ebeinone ([M + Na]+, m/z 434.2999, −8.3 ppm) and puqiedinone ([M + K]+, m/z 452.2952, 4.6 ppm) were sporadically spaced in the whole bulbs (Fig. S10B). Besides, several glycosylation products of phenolic acids were detected in MALDI MSI images (Fig. S10C). For instance, salicylic acid-2-O-glucoside ([M + K]+, m/z 339.0481, −0.3 ppm) was mainly observed in tunics and developing flower buds of AMB and ACGD bulbs. For 4-O-β-D-glucosyl-4-coumaric acid ([M + Na]+, m/z 349.0925, 7.4 ppm), the inside leaf scales were the most abundant areas of ACGD bulbs. The other metabolites including arbutin ([M + Na]+, m/z 295.0801, 2.4 ppm), 1-O-feruloyl-D-glucose ([M + H]+, m/z 357.1164, −6.2 ppm), sibiricose A5 ([M + Na]+, m/z 541.1533, 0 ppm) were mainly distributed in tunics and leaf scales of these two crops.
4 Discussion
In this study, one of the most important findings was that comparative analysis about lipid lowering, ameliorating myocardial damage (Fig. 2), and reducing the formation of atherosclerotic plaque (Fig. 5) of AMB and ACGD extracts. To our knowledge, the high-dose essential-oil extract of ACGD could significantly decrease serum and hepatic levels of TC, TG, and LDL-C, and increase serum HDL-C levels in high-fat-diet Wistar rats or ApoE−/− mice (Lin et al., 2016; Qin et al., 2023). Except for these, this was the first time for the evaluation of these two herbal extracts on the anti-atherosclerosis effects using classical high fat and high cholesterol-induced ApoE−/− model mice. And AMB and ACGD extracts exhibited close pharmacological activities in this study. The anti-atherosclerosis effects (Fig. 5) and anti-thrombotic effects were both closely associated with traditional application of these two herbs for the prevention and treatment of chest stuffiness and pains (similar to angina pectoris) (Duan et al., 2022; Feng et al., 2019; Ling et al., 2021; Ou et al., 2012). Traditionally, AMB or ACGD was regarded as the monarch drug in numerous prescriptions including Gualou Xiebai Baijiu decoction, Gualou-Xiebai-Banxia decoction, DanLou tablet for the treatment of coronary heart disease (Lin et al., 2018; Lin et al., 2020; Lin et al., 2021).
Sulfur-containing compounds and steroidal saponins are likely to their main effective components responsible for anti-atherosclerosis activity (Yao et al., 2016). For example, AMB and ACGD volatile oils both showed similar anti-atherosclerosis effects previously (Qin et al., 2023). And dimethyl disulfide, one important component in AMB and ACGD volatile oils, exhibited significant vasodilation effects through PKA/NO pathway (Han et al., 2017). In addition, several spirostanol saponins in these two herbs exhibited potent anti-inflammatory effects and antiplatelet aggregation activity (Wang et al., 2016; Duan et al., 2022). Macrostemonoside A in AMB and ACGD showed the lipid lowering activity, hypoglycemic effect, and reducing the formation of visceral fat (Xie et al., 2008). These provided direct evidences that sulfur-containing compounds and steroidal saponins in AMB and ACGD extracts benefited the anti-atherosclerosis activity. Further, several compounds including flavonoids, lignans, coumarins, and alkaloids were firstly detected from AMB and ACGD (Table 1). The contribution of these compounds to their anti-atherosclerosis effects needed to be explored in further study.
Although AMB and ACGD exhibited very close pharmacological effects, multivariate data analysis showed several differential metabolic pathways involving in carbohydrates, lipids, amino acids, and nucleotides were revealed between AMB and ACGD bulbs (Fig. 6C). As prescribed previously, the carbohydrate profiles also determined the nutritional value of Allium bulbs (Kısa et al., 2022; Krähmer et al., 2021). Unsaturated fatty acids and their derivatives played a regulatory role in plant stress tolerance (Wei et al., 2022). Amino acids and their derivatives showed the similar compositions and content levels in AMB and ACGD, and they could improve the absorption and utilization of nutrients by crops and promote crop growth (He et al., 2018b). AMP and other purines usually participated in oxidative phosphorylation, which acted as the most efficient source of energy in plant, fruits and vegetables (Ashihara et al., 2018). These features also determine their similarities and differences in growth and development, stress tolerance, bulbs maturation, and secondary metabolites formation.
Another novelty of this study was that the proposed biosynthetic pathways of sapogenins (Fig. 8), flavonoids (Fig. 9), lignans (Fig. S9A), coumarins (Fig. S9B), and rosmarinic acid (Fig. S10A) in AMB and ACGD bulbs were visualized by MALDI-TOF MSI analysis for the first time. This spatial information benefit the understanding about the potential functional links of primary and secondary metabolites in the growth and developing process of AMB and ACGD (Li et al., 2021). In the current study, most primary and secondary metabolites in AMB and ACGD fresh bulbs shared similar spatial distribution patterns (Duan et al., 2022). Their distribution regions were tunics and outside leaf scale of AMB bulbs, while the tunics, whole leaf scales and developing flower buds were their abundant areas in ACGD bulbs (Figs. 8, 9, S9 and S10). These visual spatial findings would benefit the understanding about the accumulation of functional and medicinal metabolites in different tissues of these two herbs.
However, there is also a major limitation for MALDI-TOF MSI technology. It is that the isomeric components cannot be efficiently separated for individual adduct ion image, resulting that each visual MSI image is an overlap of two or more isomers of metabolites (Duan et al., 2022; Li et al., 2022c). This means that high intensity of target metabolites in spatial MSI images does not represent the abundant concentrations. This is because MALDI MSI-oriented in situ detection could map the spatial location of multiple metabolites in tissues, and these metabolites are lack of efficient chromatographic separation (Duan et al., 2022; Li et al., 2022c). This elicits a huge disrupt to distinguish the quasi-molecular ions with same m/z values, further resulting ambiguity understanding of chemical profiling and spatial distribution of metabolites in AMB and ACGD. Actually, smilagenin, sarsasapogenin and tigogenin were isomers with same [M + H]+ ion at m/z 417.3335 (Fig. 8B) as well as vitexin and cosmosin (Fig. 9). Recently, a MS/MS imaging experiment was successfully employed to distinguish the isomeric metabolites with minor distinct fragment ions in MS/MS spectra (Li et al., 2021). Similarly, MALDI-TOF MS/MS MSI for the diagnostic ions of characteristic metabolites could partially solve the elucidation of isomers in AMB and ACGD. Meanwhile, it is still necessary to quantitatively analyze the metabolites in different tissues of AMB and ACGD bulbs by conventional analytical approaches including HPLC, UHPLC, LC-MS/MS.
5 Conclusion
In conclusion, AMB and ACGD extracts both exhibited significant lipid lowering, ameliorating myocardial damage, and anti-atherosclerotic plaque formation effects in HFHC-diets induced atherosclerosis modeling ApoE−/− mice. Further, chemical characterization and differences between AMB and ACGD bulbs were performed by UHPLC-MS/MS. Moreover, MALDI-TOF MSI images firstly provided visual spatial distribution of several metabolites involving in the biosynthetic pathways of sapogenins, flavonoids, lignans and coumarins. Taken together, the current work enriched our understanding about the traditional pharmacological effects, holistic chemical profiling of metabolites, and visual spatial distribution involving in the biosynthetic pathways of metabolites in AMB and ACGD bulbs.
6 Authorship contributions
Zifei Qin, Jing Yang, Zhihong Yao and Xiaojian Zhang conceived and designed the experiments. Songyang Li, Pei Lin, Han Xing and Xinqiang Li performed the experiments and analyzed the data. Xinsheng Yao finished the identification of herbal materials. Songyang Li, Jing Yang and Zifei Qin wrote and revised the paper. All authors have read and agreed with the manuscript.
Acknowledgements
This study was financially supported by the National Key R&D Program of China (2020YFC2008300 and 2020YFC2008304), Young Elite Scientists Sponsorship Program by Henan Association for Science and Technology (2022HYTP045), and the Foundation of He'nan Educational Committee (21A350014). And we would thank Wuhan Metware Biotechnology Co. Ltd. for their contribution and assistance for visual MALDI MSI images in this study.
Declaration of Competing Interest
The authors declare that they have no known competing financial interests or personal relationships that could have appeared to influence the work reported in this paper.
References
- Quantitative determination and characterization of polyphenols from Cissus quadrangularis L. and dietary supplements using UHPLC-PDA-MS, LC-QToF and HPTLC. J. Pharm. Biomed. Anal.. 2021;199:114036.
- [CrossRef] [Google Scholar]
- A Novel Integrated Method for Large-Scale Detection, Identification, and Quantification of Widely Targeted Metabolites: Application in the Study of Rice Metabolomics. Mol. Plant.. 2013;6:1769-1780.
- [CrossRef] [Google Scholar]
- Pharmacopoeia of the People Republic of China. 2020;1:392.
- Systematics of disjunct northeastern Asian and northern North American Allium (Amaryllidaceae) Botany. 2012;90:491-508.
- [CrossRef] [Google Scholar]
- A novel spatial-resolution targeted metabolomics method in a single leaf of the tea plant (Camellia sinensis) Food Chem.. 2020;311:126007
- [CrossRef] [Google Scholar]
- Visual authentication of steroidal saponins in Allium macrostemon Bge. and Allium chinense G. Don using MALDI-TOF imaging mass spectrometry and their structure activity relationship. Arab. J. Chem.. 2022;15(10):104138.
- [CrossRef] [Google Scholar]
- Effect of Furostanol Saponins from Allium Macrostemon Bunge Bulbs on Platelet Aggregation Rate and PI3K/Akt Pathway in the Rat Model of Coronary Heart Disease. Evid. Based Complementary Altern. Med.. 2019;2019:9107847.
- [CrossRef] [Google Scholar]
- Characterization of polysaccharide fractions from Allii macrostemonis bulbus and assessment of their antioxidant. LWT. 2022;165:113687
- [CrossRef] [Google Scholar]
- Vasodilation effect of volatile oil from Allium macrostemon Bunge are mediated by PKA/NO pathway and its constituent dimethyl disulfide in isolated rat pulmonary arterials. Fitoterapia. 2017;120:52-57.
- [CrossRef] [Google Scholar]
- Comparative study on the composition of free amino acids and derivatives in the two botanical origins of an edible Chinese herb “Xiebai”, i.e., Allium chinense G. Don and Allium macrostemon Bunge species. Food Res. Int.. 2018;106:446-457.
- [CrossRef] [Google Scholar]
- Application of characteristic ion filtering with ultra-high performance liquid chromatography quadrupole time of flight tandem mass spectrometry for rapid detection and identification of chemical profiling in Eucommia ulmoides Oliv. J. Chromatogr. A. 2018;1554:81-91.
- [CrossRef] [Google Scholar]
- Structure–activity relationship of dihydroxy-4-methylcoumarins as powerful antioxidants: Correlation between experimental & theoretical data and synergistic effect. Biochimie. 2010;92(9):1089-1100.
- [CrossRef] [Google Scholar]
- Allimacrosides A-E, new steroidal glycosides from Allium macrostemon Bunge. Steroids. 2017;118:41-46.
- [CrossRef] [Google Scholar]
- Assessment of Antimicrobial and Enzymes Inhibition Effects of Allium kastambulense With In Silico Studies: Analysis of Its Phenolic Compounds and Flavonoid Contents. Arab. J. Chem.. 2022;15(6):103810
- [CrossRef] [Google Scholar]
- Application of ATR-FTIR spectroscopy for profiling of non-structural carbohydrates in onion (Allium cepa L.) bulbs. Food Chem.. 2021;360:129978.
- [CrossRef] [Google Scholar]
- Antidepressant-like activity of the aqueous extract of Allium macrostemon in mice. J. Ethnopharmacol.. 2010;131(2):386-395.
- [CrossRef] [Google Scholar]
- Unveiling spatial metabolome of Paeonia suffruticosa and Paeonia lactiflora roots using MALDI MS imaging. New Phytol.. 2021;231(2):892-902.
- [CrossRef] [Google Scholar]
- Unraveling the mystery of efficacy in Chinese medicine formula: New approaches and technologies for research on pharmacodynamic substances. Arab. J. Chem.. 2022;15(11):104302
- [CrossRef] [Google Scholar]
- Comparative metabolomics study of Tartary (Fagopyrum tataricum (L.) Gaertn) and common (Fagopyrum esculentum Moench) buckwheat seeds. Food Chem.. 2022;371:131125.
- [CrossRef] [Google Scholar]
- Metabonomic analysis of Allium macrostemon Bunge as a treatment for acute myocardial ischemia in rats. J. Pharm. Biomed. Anal.. 2014;88:225-234.
- [CrossRef] [Google Scholar]
- LC-MS-based untargeted metabolomics reveals chemical differences of Cannabis leaves from different regions of China. Ind. Crops Prod.. 2022;176:114411
- [CrossRef] [Google Scholar]
- Antihyperlipidemic activity of Allium chinense bulbs. J. Food Drug Anal.. 2016;24(3):516-526.
- [CrossRef] [Google Scholar]
- Metabolites profile of Gualou Xiebai Baijiu decoction (a classical traditional Chinese medicine prescription) in rats by ultra-performance liquid chromatography coupled with quadrupole time-of-flight tandem mass spectrometry. J. Chromatogr. B. 2018;1085:72-88.
- [CrossRef] [Google Scholar]
- Characterization of chemical profile and quantification of representative components of DanLou tablet, a traditional Chinese medicine prescription, by UHPLC-Q/TOF-MS combined with UHPLC-TQ-MS. J. Pharm. Biomed. Anal.. 2020;180:113070
- [CrossRef] [Google Scholar]
- Qualitative and quantitative analysis of the chemical profile for Gualou-Xiebai-Banxia decoction, a classical traditional Chinese medicine formula for the treatment of coronary heart disease, by UPLC-Q/TOF-MS combined with chemometric analysis. J. Pharm. Biomed. Anal.. 2021;197:113950
- [CrossRef] [Google Scholar]
- Allium macrostemon Saponin Inhibits Activation of Platelet via the CD40 Signaling Pathway. Front. Pharmacol.. 2021;11:570603
- [CrossRef] [Google Scholar]
- Flavonolignans, Kaempferol 3-Sulphate and Other Flavonoids from Silybum marianum subsp. anatolicum. Planta Med.. 1988;54(01):44-45.
- [CrossRef] [Google Scholar]
- Inhibition of Platelet Activation and Aggregation by Furostanol Saponins Isolated From the Bulbs of Allium macrostemon Bunge. Am. J. Med. Sci.. 2012;344(4):261-267.
- [CrossRef] [Google Scholar]
- Comparative analysis of C-glycosidic flavonoids from Prosopis spp. and Ceratonia siliqua seed germ flour. Food Res. Int.. 2017;99:730-738.
- [CrossRef] [Google Scholar]
- Study on chemical profiles and metabolites of Allii Macrostemonis Bulbus as well as its representative steroidal saponins in rats by ultra-performance liquid chromatography coupled with quadrupole time-of-flight tandem mass spectrometry. Food Chem.. 2016;192:499-515.
- [CrossRef] [Google Scholar]
- Quantification and semiquantification of multiple representative components for the holistic quality control of Allii Macrostemonis Bulbus by ultra high performance liquid chromatography with quadrupole time-of-flight tandem mass spectrometry. J. Sep. Sci.. 2016;39(10):1834-1841.
- [CrossRef] [Google Scholar]
- Diagnostic ion-oriented identification and simultaneous quantification of chemical components in Allium chinense G. Don. J. Sep. Sci.. 2018;41(23):4253-4271.
- [CrossRef] [Google Scholar]
- Characterization of volatile organic compounds with anti-atherosclerosis effects in Allium macrostemon Bge. and Allium chinense G. Don by head space solid phase microextraction coupled with gas chromatography tandem mass spectrometry. Front. Nutr.. 2023;10:996675.
- [CrossRef] [Google Scholar]
- Chinese Onion (Allium Chinense), an evergreen vegetable: A brief review. Pol. J. Agron.. 2020;42:40-45.
- [CrossRef] [Google Scholar]
- Characteristics of an endophytic pyrene-degrading bacterium of Enterobacter sp. 12J1 from Allium macrostemon Bunge. Int. Biodeterior. Biodegrad.. 2008;62(2):88-95.
- [CrossRef] [Google Scholar]
- Ferulic acid esters of glucosylglucose from Allium macrostemon Bunge. J. Asian Nat. Prod. Res.. 2017;19(3):215-221.
- [CrossRef] [Google Scholar]
- Spirostanol saponins from Chinese onion (Allium chinense) exert pronounced anti-inflammatory and anti-proliferative activities. J. Funct. Foods. 2016;25:208-219.
- [CrossRef] [Google Scholar]
- Syringaresinol-4-O-β-d-glucoside alters lipid and glucose metabolism in HepG2 cells and C2C12 myotubes. Acta Pharm. Sin. B. 2017;7(4):453-460.
- [CrossRef] [Google Scholar]
- Poplar glycosylphosphatidylinositol-anchored lipid transfer proteins respond to osmotic stress by regulating fatty acid biosynthesis. Ind. Crops Prod.. 2022;179:114683
- [CrossRef] [Google Scholar]
- Novel effects of macrostemonoside A, a compound from Allium macrostemon Bunge on hyperglycemia, hyperlipidemia, and visceral obesity in high-fat diet-fed C57BL/6 mice. Eur. J. Pharmacol.. 2008;599(1):159-165.
- [CrossRef] [Google Scholar]
- A comparative UHPLCQqQ-MS-based metabolomics approach for evaluating Chinese and North American wild rice. Food Chem.. 2019;275:618-627.
- [CrossRef] [Google Scholar]
- Allium macrostemon Bunge exerts analgesic activity by inhibiting NaV1.7 channel. J. Ethnopharmacol.. 2021;281:114495.
- [CrossRef] [Google Scholar]
- Phytochemistry and pharmacology of Allii Macrostemonis Bulbus, a traditional Chinese medicine. Chin. J. Nat. Med.. 2016;14:481-498.
- [CrossRef] [Google Scholar]
- A comparative study of the neutral and acidic polysaccharides from Allium macrostemon Bunge. Carbohydr. Polym.. 2015;117:980-987.
- [CrossRef] [Google Scholar]
Appendix A
Supplementary material
Supplementary material to this article can be found online at https://doi.org/10.1016/j.arabjc.2023.104772.
Appendix A
Supplementary material
The following are the Supplementary material to this article:Supplementary data 1
Supplementary data 1


