

Translate this page into:
Uranium recovery from Uro area phosphate ore, Nuba Mountains, Sudan
*Corresponding author. Tel.: +966 5052099808 majidadam@yahoo.com (Abdelmajid A. Adam)
-
Received: ,
Accepted: ,
This article was originally published by Elsevier and was migrated to Scientific Scholar after the change of Publisher.
Available online 21 December 2010

Peer review under responsibility of King Saud University.
Abstract
This study was carried out in a laboratory scale to recover uranium from Uro area phosphate ore in the eastern part of Nuba Mountains in Sudan. Phosphate ore samples were collected, and analyzed for uranium abundance. The results showed that the samples contain a significant concentration of uranium with an average of 310.3 μg/g, which is 2.6 times higher than the world average of phosphate. The green phosphoric acid obtained from the samples was found to contain uranium in the range of 186–2049 μg/g, with an average of 603.3 μg/g, and about 98% of uranium content of the phosphate ore was rendered soluble in the phosphoric acid. An extraction process using 25% tributylphosphate, followed by stripping process using 0.5 M sodium carbonate reported that more than 98% of uranium in the green phosphoric acid exists as uranyl tricarbonate complex, moreover, sodic decomposition using 50% sodium hydroxide showed that about 98% of the uranium was precipitated as sodium diuranate concentrate that is known as the yellow cake (Na2U2O7). Further purification and calcinations of the yellow cake led to the formation of the orange powder of uranium trioxide (UO3). The chemical analysis of the obtained uranium concentrates; yellow cake and uranium trioxide proved their nuclear purity and that they meet the standard commercial specification. The obtained results proved that uranium from Uro phosphate ore was successfully recovered as uranium trioxide with an overall recovery percentage of 93%.
Keywords
Uranium recovery
Yellow cake
Uranium trioxide
Multivariate analysis
Sudan

- TBP
-
tributylphosphate
- IMBK
-
isobutyl methyl ketone
- S
-
stripping coefficient
- A/O
-
organic to aqueous volume ratio
- EMF
-
electromotive force
Abbreviations
1 Introduction
The phosphate deposits, which are the prime source of phosphate used in the manufacture of phosphate fertilizers and phosphoric acid, contain low concentrations of uranium in fine-grained apatite. This type of deposit is considered to be an unconventional source of uranium; this offers the phosphate industry an attractive opportunity to recover uranium as a by-product of fertilizers and, therefore, has greatly renewed interest in the wet-process phosphoric acid as a significant source of uranium (IAEA, 1990; Becker, 1993).
In Sudan, there is a great need to obtain cheap and safe sources of phosphoric acid and phosphate fertilizers. The need to fertilizers increases annually with the increase of Sudan population and the global demand of grains. Brinkman (1986) discovered two types of phosphate deposits in Kurun and Uro areas in the center of eastern part of Nuba Mountains. Presently, phosphate ores from Kurun and Uro areas became the subject of intensive studies by several investigators. The natural radionuclide content of phosphate ores has been documented by several works (Sam and Holm, 1995; Sam et al., 1999). Sam reported that Uro area phosphate ores generally have a high concentration of 238U, and he found that 238U and its decay products are the principle contributors of radioactivity in these phosphate deposits, with activity concentrations ranging from 1225 to 13745 Bq/kg. Adam and Eltayeb investigated uranium abundance in Kurun and Uro areas; they found that uranium abundance in Uro phosphate is five time higher than in Kurun phosphate (Adam and Eltayeb, 2009). Due to its significant concentration of uranium, we must show more interest to Uro phosphate.
The main objectives of this work are to,
-
apply uranium extraction technology in a laboratory scale on phosphate ore samples from Uro area,
-
investigate in a systematic manner the behavior of the uranium extracted from Uro phosphate ores,
-
study the correlation and association between uranium and metallic impurities in uranium concentrates using multivariate statistical methods, such as single and bivariate analysis, and cluster analysis,
-
provide basic data for the evaluation of the economic feasibility of the extraction of uranium from Uro phosphate ores, and for the development of metallurgical process and pilot-plant scale.
2 Area description
The present work is confined to the center of the eastern part of the Nuba Mountains in the state of Kordofan, (Sudan) between Abu Giubiha and El Rashad towns at the intersection of North east of the coordinate 11° 45′ north and 31° 22′ east (Whiteman, 1971). The Uro deposits consist of volcanic sedimentary rocks, omphiolyte assemblage, and quaternary sediments that include rocks that belong to green schist facies consisting of a variety of schists, e.g. chlorite phyllite, chlorite schist, mica schist, graphite schist, marbles and quartz (Sam et al., 1999). The major phosphate rock constituents in Uro deposits are high-grade gneisses and low-grade volcanic sedimentary rocks. The ore mineralogy in these deposits is characterized by open space-filling texture and structure. The identified minerals include aluminophosphate, hydrated phosphate, limonite goethite, quartz, kaolinite, and zeolotes. The phosphate minerals include apatite, turquoise, crandallite, wavellite, woodhouseite, and variscite (Brinkman, 1986). Fig. 1 shows the location map of the study area.
Map of Sudan showing the location of the study area. ■ The study area.
3 Materials and methods
3.1 Materials
All chemicals used throughout this work were of analytical grade and used as supplied. Deionized water was used to prepare all the solutions.
A total of 15 composite surface rock phosphate samples were collected from Uro phosphate deposits. Chisel and hammer were used to break off the phosphate chips, which were then collected in cloth bags. Samples were crushed in a jaw crusher and then ground to very fine powder.
3.2 Methods
3.2.1 Digestion of phosphate ore samples
One gram of the dried finely ground phosphate ore was digested in concentrated nitric acid at a low temperature for 2 h. After evaporating the samples twice to dryness with nitric acid, the residue was treated with 1:1 hydrochloric acid to remove adhering matter. Insoluble materials (mainly silica) were then removed by filtration; then the filter paper was washed with hydrochloric acid till free from iron. The filter paper was then ignited in a platinum crucible, and the residue was treated with 48% hydrofluoric acid. Finally, the residue was heated with 1:1 sulphuric acid to expel nitric acid and was added to the filtrate to form the leash liquor solution.
3.2.2 Preparation of the samples for XRF analysis
The phosphate ore samples were ground to a fine powder of a mean particle diameter of 50 μm. Approximately 500 mg of each sample was moistened with 5–6 drops of binder (10% styropore in toluene), thoroughly homogenized and allowed to dry, then pressed into pellets (100 mg/cm2) for analysis. The concentration of the detected elements was calculated from the measured net intensity of the corresponding fluorescent X-rays combined with elemental sensitivity factor and the coefficient of absorption in the residual matrix of the specimen through iteration procedure (Jenkens et al, 1981; Hassan, 1989; Ogunleye et al, 2002).
3.2.3 Phosphoric acid preparation and purification
Exactly 500 g of the Uro phosphate ore sample powder was digested with 195 ml of 98% sulphuric acid, at a temperature ranging between 80 and 85 °C, then 55 ml of distilled water was added, then the mixture was stirred for 4 h. The produced crude phosphoric acid was left to cool at room temperature, in order to precipitate additional solids from the phosphoric acid and then the acid was filtered through a filter paper. The crude phosphoric acid was passed through two packed pyrite (BaSO4) columns (with a flow rate of 1 ml/min) to trap most of the insoluble inorganic matters, then passed through two packed activated charcoal columns to remove all the insoluble organic and humic matters present in the acid. Hydrogen peroxide (30%) was added as an oxidizing agent until the oxidation potential (EMF) reached 490 mV for complete oxidation of tetravalent uranium to the hexavalent state (IAEA, 1989, 1993). Finally, the obtained green phosphoric acid “Green acid” was analyzed for uranium content and P2O5%.
3.2.4 Uranium recovery from purified phosphoric acid
Uranium(VI) was quantitatively extracted with 50 ml of 25% TBP solution in kerosene from 75 ml aliquot of green phosphoric acid with 20 ml of 2 M nitric acid and 5 ml of 2% sodium fluoride solution, at room temperature, by shaking thoroughly for 5 minutes, in three batches. Iron(III) was previously extracted from the solution as iron(III) oxinate with three portions (10 ml each) of 1% 8-hydroxyquinoline in chloroform. The extracted phase was scrubbed three times with 10 ml of deionized water and the aqueous phase was discarded. Uranium was stripped from the loaded organic extracted phase at room temperature by shaking with 12.5 ml of 0.5 M sodium carbonate. The pregnant strip solution was transferred to a small beaker. Uranium(VI) was quantitatively analyzed in two phases. The TBP solvent was treated with sulphuric acid and water, while the solvent was regenerated for further use.
3.2.5 Precipitation of the yellow cake
The pH of the loaded sodium carbonate solution was adjusted to 3 using concentrated sulphuric acid, then liquor was boiled for an hour, in order to destroy all carbonates. Sodium hydroxide solution (50%) was then added until the pH of the solution reached 12, to precipitate all uranium as sodium diuranate concentrate. The produced uranium concentrate was filtered, washed with deionized water, and dried at 110 °C. Uranium content in the barren filtrate was analyzed to determine the precipitation efficiency. Uranium and metallic impurities were determined in the crude yellow cake concentrate for specification.
3.2.6 Refining of the crude yellow cake
A well-blended representative yellow cake sample was weighed, wetted with water, and dissolved in concentrated nitric acid. Uranium(VI) was quantitatively extracted from the aqueous feed solution at room temperature using 25% TBP in kerosene, at A/O of 2:1, in three batches. After phase disengagement, the loaded organic phase was scrubbed using acid solution, in order to eliminate the co-extracted elements. Uranium was re-extracted from the loaded scrubbed solvent solution at room temperature by 0.5 M sodium carbonate solution at A/O of 1:4, in two batches. To convert sodium uranyl tricarbonate solution (pH ≈8) to uranyl nitrate (pH ≈2), Uranium peroxide UO4·2H2O was precipitated from the uranyl nitrate solution by adding 30% hydrogen peroxide, then the precipitate was filtered and washed several time with a dilute solution of 3% hydrogen peroxide. The obtained uranium peroxide was calcinated in two thermal stages; the first is de-hydration at 300 °C obtaining UO4. The second is de-oxygenation at 450 °C to obtain nuclear grade UO3. A sample from the obtained uranium trioxide was chemically analyzed for specification.
3.3 Instrumentation
3.3.1 AAS analysis
A Perkin–Elmer Atomic absorption spectrometer, with flame atomizer using air and acetylene was used for the determination of trace elements in the leash liquor solution. Conventional hollow cathode lamps were used. The operating parameters were those recommended by the instrument manufacturer. The burner position, flame conditions and aspiration rate were optimized for maximum absorbance (John and Van 1980; Sabiha-Javied et al, 2009). Each element was then analyzed accordingly in every sample. The validation of the setting was tested on a certified reference material provided from the Institute for Reference Materials and Measurements (IRMM) (sample code: BCR-143R).
3.3.2 XRF analysis
A micro-computer-energy-depressive X-ray fluorescence spectrometer, with Molybdenum secondary target and a molybdenum filter, fitted with Cd-109 excitation source, (t1/2 = 1.34 years, E = 22.2 keV and 88.0 keV), coupled with a Si(Li) detector and multi-channel analyzer to data counting was used to analyze the samples for major elements. The concentration of detectable elements was made from the measured net intensity of the corresponding fluorescent X-rays combined with elemental sensitivity factor and coefficient of absorption in the residual matrix of the specimen through iteration procedure (Jenkens et al, 1981; Hassan, 1989; Ogunleye et al, 2002). The method has been successfully applied to the certified reference material (BCR-143R).
3.4 Statistical analysis
Multivariate correlation coefficient, cluster analysis of uranium, and major and trace elements were carried out in order to observe the elemental associations in the uranium concentrates; yellow cake and uranium trioxide. To achieve this purpose, the statistical analysis “Statistical Program for the Social Science (SPSS/PC)” was used (SPSS Inc., 1998). The applied statistical analyses are:
-
Single variate statistics: Single variate statistics was used to describe the statistical characteristics of the data. These include: range, arithmetical mean, measures of dispersion of the data, and standard deviation (σ).
-
Bivariate statistics: Bivariate correlation analysis is also carried out, as bivariation statistics in order to examine the mutual relations and strength of association between pairs of elements through calculation of the linear Pearson correlation coefficient “r”.
-
Hierarchical cluster analysis: Cluster analysis comprises a series of multivariate methods, which are used to find true groups of data. In clustering, the objects are grouped such that similar objects fall into the same class. Hierarchical clustering joins the most similar observations, and then successively the next most similar observations. The levels of similarity at which observations are merged are used to construct a dendrogram. Some measure of similarity must be computed between every pair of objects. In this work, a cluster analysis using Ward’s method to calculate the Euclidean distance between the variables average is used.
4 Results and discussion
Table 1 compares the results obtained from an average of triplicate measurements of the reference material with actual reference material values. The findings are in good agreement with the reference values of some trace element within ±2% experimental error. The small percent deviation value shows that the AAS setting for elemental analysis was perfect.
Substance
Reference value (μg/g)
Measured value (μg/g)
±% Deviation
Cd
71.80
70.45
−1.88
Co
12.30
12.55
+2.03
Cu
130.60
131.32
+0.55
Hg
1.10
1.07
−2.73
Mn
904.00
889.00
−1.66
Ni
299.00
295.00
−1.34
Pb
179.70
183.15
+1.92
Zn
1055.00
1070.00
+1.42
4.1 Phosphate ore analysis
Table 2 shows the uranium content and the percentage of the major elements as oxides in phosphate ore samples. Fig. 2 shows the mean values of the percentage of the major elements as oxides in phosphate ore samples. Table 2 shows that uranium content is very high in all of the collected samples relative to the average uranium content in the earth crust (2.7 μg/g) and shale rocks (3 μg/g) (Turekian and Wedepohl, 1961). Moreover, the phosphate samples show very high content of uranium relative to the world average (120 μg/g) (Adams et al, 1959). The maximum uranium in Uro phosphate is 1055 μg/g, with an average of 310.3 μg/g and a standard deviation of 281.8. These values indicate that there is a significant uranium abundance in Uro phosphate, which is 2.6 times higher than the average of world phosphate. The estimated total phosphorus as P2O5% is in the range of 16.4–25% with an average of 20.3%, which generally indicates that the Uro phosphate ores are typical phosphate ores. Table 2 also shows that phosphorous, silicon and aluminum are the most abundant elements; this is clearly represented in Fig. 2. PO: phosphate ore sample.
Sample No.
U (μg/g)
P2O5%
SiO2%
Al2O3%
Fe2O3%
CaO%
MgO%
Na2O%
K2O%
1PO
100.100
22.600
44.326
22.367
2.543
7.020
0.248
0.250
0.077
2PO
128.900
16.800
53.687
26.770
1.389
4.130
0.052
0.512
0.066
3PO
94.200
18.200
40.890
19.438
1.000
4.650
0.180
0.200
0.055
4PO
1055.000
16.780
49.643
25.120
1.044
2.800
0.163
0.373
0.023
5PO
245.000
20.320
50.070
22.065
3.070
2.540
0.274
0.105
0.040
6PO
136.500
17.700
32.300
17.490
0.945
1.500
0.200
0.555
0.070
7PO
175.300
25.000
37.111
15.000
0.900
7.417
0.110
0.400
0.038
8PO
555.600
20.900
49.000
21.000
1.035
6.395
0.355
0.217
0.064
9PO
220.380
24.250
39.700
18.400
2.158
5.235
0.340
0.300
0.050
10PO
164.610
19.300
36.385
24.495
1.350
4.710
0.208
0.372
0.048
11PO
800.240
23.620
39.160
20.170
1.022
5.000
0.173
0.108
0.020
12PO
322.460
21.500
38.122
23.070
0.865
6.211
0.032
0.422
0.029
13PO
204.600
23.300
33.500
18.880
2.147
3.794
0.310
0.540
0.056
14PO
112.000
17.880
50.600
17.130
3.030
7.042
0.100
0.215
0.070
15PO
339.500
16.400
35.500
25.105
1.500
2.055
0.400
0.380
0.041
Mean
310.300
20.300
42.000
21.100
1.600
4.700
0.210
0.330
0.050
Min.
94.200
16.400
32.300
15.000
0.865
1.500
0.032
0.105
0.020
Max.
1055.000
25.000
53.687
26.770
3.070
7.417
0.400
0.555
0.077
Std. Dev.
281.841
2.960
6.980
3.424
0.784
1.898
0.111
0.146
0.018
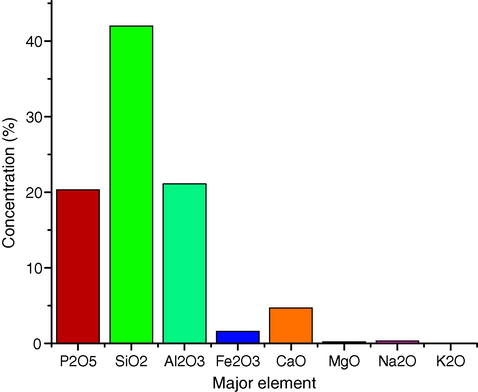
The mean values of the major elements in phosphate ore samples.
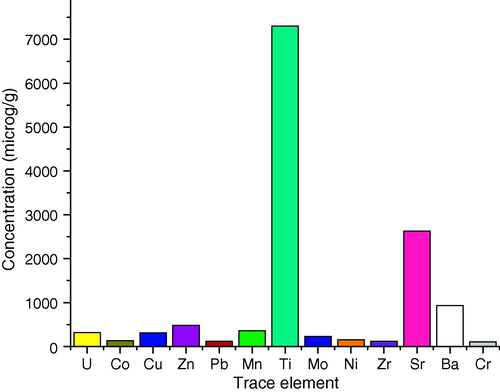
Table 3 shows that titanium, strontium and barium are the most abundant trace elements in the samples. Moreover, Fig. 3 shows that all samples contain a significant concentration of titanium with a mean value of 7300 μg/g. The mean values of concentration of the trace elements show that they exist in the decreasing order as: Ti > Sr > Ba > Zn > Mn > U > Cu > Mo > Ni > Co > Pb > Zr > Cr. PO: phosphate ore sample.
Sample No.
Co
Cu
Zn
Pb
Mn
Ti
Mo
Ni
Zr
Sr
Ba
Cr
1PO
73.72
328.50
518.38
80.00
355.00
5524.84
110.04
104.50
121.54
2113.00
375.23
54.23
2PO
158.77
291.05
542.41
153.87
321.36
5867.20
195.12
111.20
129.12
2587.33
1100.00
76.39
3PO
111.43
305.03
433.30
65.00
376.34
8811.50
168.60
142.25
88.76
1894.00
688.30
166.23
4PO
88.37
345.45
486.43
85.04
301.50
7000.00
243.00
194.12
185.35
3345.50
736.84
99.00
5PO
138.50
388.33
500.44
121.16
344.50
7433.63
295.50
207.38
145.40
2845.20
900.41
173.20
6PO
166.73
258.80
516.00
130.00
417.76
6122.32
236.40
119.00
87.12
2277.25
1126.60
78.83
7PO
116.23
327.45
484.51
155.48
488.52
5716.33
205.17
173.72
84.36
2550.00
877.70
143.78
8PO
104.27
240.00
408.00
91.95
256.04
7245.50
134.85
122.05
168.37
2000.48
413.54
187.43
9PO
185.00
258.61
427.41
98.34
285.14
9593.10
311.45
175.00
135.53
2259.30
1477.43
100.00
10PO
125.32
405.11
567.00
143.50
342.71
8382.00
278.41
138.66
106.43
2871.45
1200.00
120.00
11PO
172.83
277.56
532.12
68.34
485.32
6714.50
144.35
103.14
74.30
3223.00
984.41
37.12
12PO
142.38
290.00
488.20
126.00
350.05
6892.11
165.44
187.00
140.20
3211.00
1109.50
87.25
13PO
100.06
287.48
447.50
100.05
317.23
7844.29
274.00
150.50
65.32
2638.21
811.50
66.39
14PO
165.00
331.00
373.84
153.84
526.40
8037.40
321.48
158.32
132.31
2534.50
1178.50
144.71
15PO
79.00
300.71
410.00
176.45
210.00
8315.50
241.11
178.34
65.43
3100.70
985.00
33.65
Mean
128.51
309.00
475.70
116.60
358.52
7300.01
221.66
151.01
115.30
2630.06
930.99
104.54
Min.
73.72
240.00
373.84
65.00
210.00
5524.84
110.04
103.14
65.32
1894.00
375.23
33.65
Max.
185.00
405.11
567.00
176.45
526.40
9593.10
321.48
207.38
185.35
3345.50
1477.43
187.43
Std. Dev.
35.93
46.37
56.43
35.28
88.56
1204.28
67.30
34.18
37.20
463.82
296.16
49.39
The mean values of the trace elements in phosphate ore samples.
The Pearson correlation coefficients for uranium and eight major element oxides and trace elements are shown in Tables 4 and 5, respectively. Table 4 shows that no correlation exists between uranium and any major element oxide, while Table 5 shows that uranium has strong positive correlation with Sr (+0.57), and a moderate positive correlation with Zr (+0.37). This indicates the close relationship between uranium and these two elements in Uro phosphate minerals. The variation of uranium content appears to be generally controlled by the variations of Sr and is not related to the abundance of any major element.
P2O5
SiO2
Al2O3
Fe2O3
CaO
MgO
Na2O
K2O
U
P2O5
1.00
SiO2
−0.32
1.00
Al2O3
−0.52
0.34
1.00
Fe2O3
0.08
0.35
−0.10
1.00
CaO
0.55
0.18
−0.35
0.08
1.00
MgO
0.11
−0.23
0.00
0.25
−0.31
1.00
Na2O
−0.18
−0.40
0.10
−0.34
−0.29
−0.17
1.00
K2O
−0.17
0.16
−0.18
0.37
0.16
0.13
0.18
1.00
U
−0.05
0.20
0.29
−0.36
−0.18
0.05
−0.22
−0.67
1.00
U
Co
Cu
Zn
Pb
Mn
Ti
Mo
Ni
Zr
Sr
Ba
Cr
U
1.00
Co
−0.14
1.00
Cu
−0.09
−0.24
1.00
Zn
0.04
0.12
0.36
1.00
Pb
−0.40
0.10
0.23
−0.04
1.00
Mn
−0.15
0.45
0.14
0.13
0.02
1.00
Ti
−0.07
0.12
0.04
−0.53
−0.07
−0.32
1.00
Mo
−0.19
0.32
0.35
−0.25
0.43
0.01
0.56
1.00
Ni
0.14
−0.10
0.37
−0.32
0.27
−0.20
0.37
0.55
1.00
Zr
0.37
0.01
0.12
−0.07
−0.18
−0.24
−0.04
0.02
0.28
1.00
Sr
0.57
0.01
0.34
0.29
0.24
−0.02
−0.06
0.19
0.43
0.03
1.00
Ba
−0.22
0.76
0.02
0.07
0.47
0.16
0.39
0.65
0.25
−0.14
0.30
1.00
Cr
−0.14
0.03
0.23
−0.31
−0.05
0.12
0.22
0.15
0.28
0.45
−0.42
−0.18
1.00
Table 6 shows uranium content and P2O5% for phosphoric acid solutions prepared from the corresponding phosphate ore samples. The obtained green phosphoric acid was found to contain uranium in the range of 185.8–2048.8 μg/l. The specifications of phosphoric acid are given in Table 7. This table indicates that during the manufacturing of phosphoric acid by digestion with sulphuric acid at 75–85 °C, around 98% of uranium content in the phosphate ore samples recovers in phosphoric acid. PA: phosphoric acid solution sample.
Sample No.
Uranium content (μg/g)
P2O5%
1PA
194.79
24.70
2PA
251.87
19.50
3PA
185.76
22.30
4PA
2048.81
18.88
5PA
478.24
20.82
6PA
268.91
21.90
7PA
347.80
26.70
8PA
1075.64
24.80
9PA
438.56
26.68
10PA
325.27
23.60
11PA
1525.26
24.42
12PA
639.12
25.66
13PA
398.56
25.80
14PA
220.42
19.40
15PA
649.80
18.34
Mean
603.25
22.90
Min.
185.76
18.34
Max.
2048.81
26.70
Std. Dev.
989.25
2.94
Correlation coefficient
−0.151
Phosphoric acid type
Crud acid
Green acid
P2O5%
22.500
22.900
Uranium (μg/g)
603.050
603.250
Density (g/ml)
1.295
1.291
Acidity (mole/l)
4.530
4.520
EMF (mV)
385.000
490.000
Uranium recovery from ore
97.9%
4.2 Uranium recovery from phosphoric acid
The recovery of uranium(VI) from the prepared green phosphoric acid solution is based on liquid–liquid solvent extraction, which involves two processes: extraction and stripping process. The extraction process was performed by the extraction of uranium(VI) with 25% TBP solution in kerosene in three stages using an A/O of 2:1. Uranium is extracted with this organic solvent as uranyl nitrate in nitric medium according to the following equation: The organic solvent TBP is a neutral organophosphorus extractant exhibiting satisfactory extractive properties towards uranium in nitrate solution. It was diluted with kerosene as an inert diluent to induce quick and clear phase separation and high extraction performance. This extraction using TBP requires phosphoric acid with special specifications and high quality. For example, the solid content in acid should be reduced from 1–4 wt.% to less than 0.01 wt.%. Also most of the organic and humic matter should be removed and uranium should be oxidized to the hexavalent state (Khaled and Ali, 2000). If humic matter is still present in the phosphoric acid, it will contact the kerosene-based organic solvent, and the resulting mixture is allowed to settle; an oily, viscous emulsion will form at the interface between the organic and aqueous layers. If this interfacial emulsion (also, named “gunk”) was allowed to collect at the interface of the two layers; it would soon interfere with the normal operation; uranium extraction. TBP is not selective for uranium; so many elements are co-extracted with uranium(VI) by TBP, especially the ions of Sc(III), V(V), Fe(III), Co(II), Ni(II), and Zr(IV). Therefore, these ions will represent serious interference in the uranium(VI) extraction with TBP. Stripping the loaded uranium organic phase with 0.5 M sodium carbonate will remove the interference of Sc(III), V(V), Co(II) and Ni(II), but not that of Fe(III) and Zr(IV). To eliminate the interferences due to Zr(IV), sodium fluoride solution was added as a masking agent for Zr(IV). This agent masks zirconium and prevents its extraction from aqueous phase by TBP in kerosene. The interference due to Fe(III) was removed by extraction as iron(III) oxinate complex from the acidic aqueous solution using 8-hydroxyquinoline in chloroform (Korkish and Hubuer, 1976). After the uranium extraction process, the P2O5 entrained by the pregnant organic solvent from the extraction was completely removed by scrubbing the loaded extract with water in one stage. P2O5 must be eliminated because: it is a contaminate of the yellow cake concentrate, and striping process is carried out with a carbonate solution, which would be neutralized by P2O5 (IAEA, 1990).
The stripping process is the opposite of extraction in the sense that uranium is now brought back to the aqueous phase using suitable chemical reagents. Several reagents can be used to strip uranium from the loaded solvent. A trial was made to determine the stripping coefficient (S) from the loaded organic solvent (TBP) using distilled water, acidic and alkaline solutions. In this test, the A/O phase ratio and the mixing time were fixed at unity and 5 min, respectively, in a single stage. Table 8 shows the stripping coefficient for different strip solutions. From this table it is clearly seen that the complete stripping recovery of uranium content (more than 99.8%) was obtained with 0.5 M sodium carbonate solution in which uranium reports as uranyl tricarbonate complex ion [UO2(CO3)3]4−. Therefore, sodium carbonate solution is a very suitable strip solution for the quantitative back-extraction (stripping) of uranium from an organic phase, and the uranyl tricarbonate complex ion is soluble and extremely stable (Harvinderpal et al., 2004). In this work, uranium was stripped from the organic scrubbed phase in two stages using an aqueous alkaline solution of 0.5 M Na2CO3 at an A/O phase ratio of 1:4 as sodium uranyl tricarbonate according to the following equation:
Table 9 shows uranium content in the strip solution samples recovered from phosphoric acid, with mean recovery of 97.8%. SS: strip solution sample.
Strip solution
Uranium content (μg/l)
Stripping coefficient (S)
Recovery%
Organic phase
Aqueous phase
H2O
240.00
150.00
1.67
62.5
0.2 M (NH4)2CO3
240.00
235.00
47.00
97.9
0.5 M Na2CO3
240.00
239.50
479.00
99.8
0.1 M HCl
240.00
120.80
1.00
50.3
0.1 M NaOH
240.00
229.30
21.50
95.5
4 M H3PO4
240.00
220.00
11.00
91.7
Sample No.
Uranium concentration (g/l)
Uranium recovery (%) from PA
Efficiency of the precipitation (%)
Strip solution
Raffinate solution (after sodic decomposition)
1SS
0.573
0.017
98.00
97.03
2SS
0.744
0.025
98.50
96.64
3SS
0.543
0.005
97.50
99.08
4SS
6.000
0.078
97.70
98.70
5SS
1.390
0.029
97.00
97.91
6SS
0.788
0.008
97.70
98.98
7SS
1.030
0.022
98.50
97.86
8SS
3.130
0.044
97.00
98.59
9SS
1.283
0.032
97.50
97.51
10SS
0.963
0.015
98.70
98.44
11SS
4.490
0.090
98.20
98.00
12SS
1.879
0.060
98.00
96.81
13SS
1.162
0.008
97.20
99.31
14SS
0.645
0.008
97.50
98.76
15SS
1.910
0.069
98.00
96.39
Mean uranium recovery (%) from PA
97.80
Mean precipitation efficiency (%)
98.00
4.3 Yellow cake precipitation
Uranium in the loaded sodium carbonate stripping solution was precipitated as sodium diuranate (Na2U2O7) by applying sodic decomposition using 50% sodium hydroxide solution at pH of 12.0, according to the following equation: The slurry was then subjected to filtration where the filtered product; sodium diuranate (Na2U2O7), represents an intermediate product called “yellow cake” (Gupta et al., 2004). During the precipitation of sodium diuranate concentrate, sodium carbonate was produced and it was recycled to use as strip solution. The precipitation efficiency of the yellow cake was calculated by the following equation: where F is uranium concentration in the strip (feed) solution. R is uranium concentration in the raffinate solution.
The result is shown in Table 9, which indicates that by applying sodic decomposition up on stripping carbonate solution, generally, about 98.0% of uranium in the strip solution was precipitated as sodium diuranate concentrate (Na2U2O7).
In order to analyse crude yellow cake, firstly, sodium diuranate samples were dissolved in nitric acid according to the following equation:
Secondly, uranium was quantitatively separated from the yellow cake nitrate solution using 25% TBP extractant in kerosene, then uranium was stripped from the loaded organic phase and determined. Finally, trace elements of P, K, Ca, Mg, Mn, Cr, Fe, Co, Ni, Cu, Zn, Cd, Mo, and Pb had been properly determined in raffinate aqueous phase solution. Table 10 indicates that mean uranium concentration in the sodium diuranate concentrate is 70.35%. This concentration of uranium and that of the comparative concentrations of impurities on the obtained yellow cake agree well with the standard commercial sodium diuranate illustrated in Table 14. YC: yellow cake sample.
Sample No.
U (%)
Na (%)
Concentration (μg/g)
P
K
Ca
Mg
Mn
Cr
Fe
Co
Ni
Cu
Zn
Cd
Mo
Pb
1YC
69.33
5.52
57.23
27.56
39.85
16.84
8.11
1.64
7.85
6.43
16.31
10.34
11.06
4.00
4.78
10.34
2YC
69.47
5.78
57.12
33.16
42.11
23.84
8.51
2.24
11.84
6.85
18.50
10.50
11.58
4.50
3.34
10.00
3YC
71.21
6.25
63.20
27.74
51.04
14.38
10.53
2.65
12.68
6.03
13.47
11.23
13.78
4.15
3.50
9.17
4YC
71.35
4.89
69.39
29.16
53.89
22.25
9.34
3.44
8.85
5.78
14.66
12.45
16.66
5.35
5.00
9.54
5YC
70.50
4.96
54.82
25.12
41.37
17.65
7.11
3.11
9.23
5.43
11.49
9.05
12.42
7.12
5.16
14.10
6YC
70.14
5.80
53.83
35.50
40.76
15.07
7.31
3.93
10.11
5.05
12.23
10.24
10.60
6.39
3.61
12.10
7YC
69.24
5.86
60.06
32.54
40.62
28.42
8.55
2.98
10.50
5.13
14.50
15.25
11.53
3.15
4.85
12.54
8YC
70.20
5.62
61.14
30.84
45.37
26.24
10.32
2.45
12.45
7.43
18.29
14.40
15.64
4.33
3.84
13.00
9YC
70.73
5.05
56.00
28.21
46.19
19.59
8.75
1.85
8.43
7.43
15.31
14.84
17.70
6.54
2.37
14.13
10YC
70.60
5.63
58.50
27.31
49.31
21.38
10.04
4.32
9.14
6.49
14.58
13.12
13.50
7.14
2.25
9.45
11YC
70.50
6.30
52.38
25.03
43.33
20.50
7.22
4.85
10.56
6.00
13.33
12.00
11.34
4.60
4.28
12.43
12YC
71.38
6.11
54.42
31.50
51.18
15.34
5.82
3.15
9.43
5.15
10.05
10.34
15.00
5.49
5.17
10.40
13YC
69.49
5.60
65.18
36.18
48.00
27.04
6.23
3.05
11.00
4.86
11.50
10.50
14.13
5.34
4.74
10.00
14YC
71.16
5.80
70.00
26.73
47.00
17.14
9.43
1.67
9.50
6.18
17.25
16.34
15.50
3.15
4.10
11.85
15YC
69.95
4.83
66.73
33.42
39.48
14.32
10.23
3.67
8.43
5.76
11.53
11.20
16.71
3.75
3.10
13.45
Mean
70.35
5.60
60.00
30.00
45.30
20.00
8.50
3.00
10.00
6.00
14.20
12.12
13.81
5.00
4.01
11.50
Min.
69.24
4.83
52.38
25.03
39.48
14.32
5.82
1.64
7.85
4.86
10.05
9.05
10.60
3.15
2.25
9.17
Max.
71.38
6.30
70.00
36.18
53.89
28.42
10.53
4.85
12.68
7.43
18.50
16.34
17.70
7.14
5.17
14.13
St. Dev.
0.72
0.46
5.54
3.47
4.50
4.58
1.46
0.92
1.44
0.79
2.51
2.12
2.24
1.29
0.93
1.69
Constituent
Na2U2O7 % (μg/g)
UO3 % (μg/g)
UF4 % (μg/g)
Total U
70.0
82.2
76.0
UO3
97.0
UF4
96.2
SO4
Fe
35.0
45.0
55.0
Ni
15.0
6.0
35.0
Cr
10.0
5.0
9.0
B
0.20
0.1
Mn
5.0
<10
<10
Cd
0.20
<0.1
<0.1
Mo
1.0
<10
<10
Si
20.0
18
Th
50.0
Ag
1.0
Cu
10.0
P
50.0
Dy
0.10
Gd
0.05
Mg
40.0
V
30.0
The major metallic impurities in the obtained yellow cake concentrate are phosphorus, calcium, potassium and magnesium (Fig. 4). The decreasing order of mean concentrations of metallic impurities is: P > Ca > K > Mg > Ni > Zn > Cu > Pb > Fe > Mn > Co > Cd > Mo > Cr. Uranium has a strong positive correlation coefficient with Ca (+0.74). High positive correlations have also been found between other metallic impurities. Zinc correlates positively with U (+0.52), P (+0.56) and Ca (+0.52). Manganese correlates positively with Co (+0.57), Ni (+0.53) and Cu (+0.5) (Table 11).
Metallic impurities concentrations in yellow cake samples.
U
Na
P
K
Ca
Mg
Mn
Cr
Fe
Co
Ni
Cu
Zn
Cd
Mo
Pb
U
1.00
Na
0.05
1.00
P
0.17
−0.31
1.00
K
−0.48
−0.01
0.13
1.00
Ca
0.74
0.13
0.36
−0.16
1.00
Mg
−0.47
0.02
0.11
0.26
0.03
1.00
Mn
0.14
−0.20
0.52
−0.21
0.10
−0.02
1.00
Cr
0.11
0.13
−0.25
0.04
0.04
−0.02
−0.16
1.00
Fe
−0.08
0.59
0.01
0.24
0.14
0.37
0.14
0.00
1.00
Co
0.06
−0.13
−0.04
−0.37
0.02
0.11
0.57
−0.43
0.08
1.00
Ni
−0.19
0.04
0.18
−0.19
−0.08
0.38
0.53
−0.55
0.24
0.77
1.00
Cu
0.16
0.04
0.38
−0.19
0.16
0.36
0.50
−0.27
0.02
0.42
0.54
1.00
Zn
0.52
−0.50
0.56
−0.03
0.52
−0.06
0.38
−0.23
−0.22
0.32
0.01
0.41
1.00
Cd
0.26
−0.29
−0.47
−0.11
0.21
−0.12
−0.31
0.35
−0.25
−0.03
−0.36
−0.36
0.02
1.00
Mo
−0.03
0.08
0.04
−0.01
0.03
0.13
−0.57
−0.04
−0.03
−0.59
−0.28
−0.28
−0.25
−0.21
1.00
Pb
−0.13
−0.38
−0.24
−0.11
−0.58
−0.05
−0.03
−0.03
−0.22
0.14
−0.06
0.23
0.16
0.06
−0.08
1.00
The correlation found between metallic impurities and uranium in yellow cake samples can be observed qualitatively in Fig. 5. Cluster analysis to show elemental association in the yellow cake produced a dendrogram that formed two-groups : the first group includes: Na, Co, Cd, Cr, Mo, Mn, Fe, Cu, Pb, Ni, Zn, K, and Mg, and the second group is formed by the elements U, P, and Ca. The first group is divided into two sub-groups: (a) Na, Co, Cd, Cr, Mo, Mn, Fe, Cu, Pb, Ni, and Zn; (b) K and Mg. The sub-group (a) consisting of 10 metallic impurities has elements of the transition elements (except Na) that have chemical similarity. The sub-group (b) consisting of K and Mg, which are coherent because they are reactive metals from group I and II in the periodic table that have chemical similarities. The second group is divided into two sub-groups: (a) U and P; (b) Ca. The second group shows the close relationship between U and P on the one hand and their association with Ca on the other.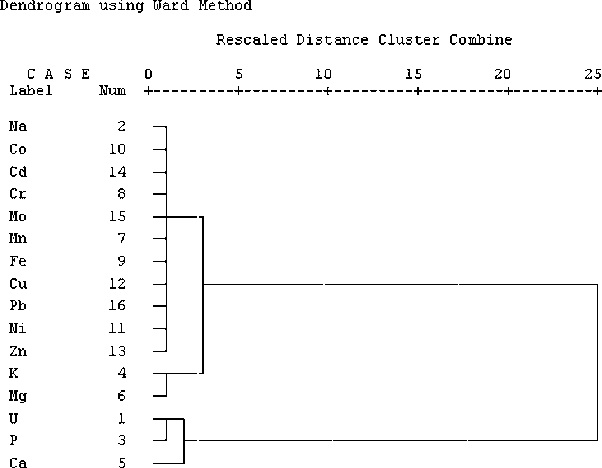
Dendrogram showing metallic impurities and uranium association in yellow cake samples.
4.4 Refining of uranium yellow cake concentrate
Chemical analysis of the obtained yellow cake intermediate product; sodium diuranate, indicates the presence of many metallic impurities. Most of these are substantially harmful and may cause serious problems during fabrication and performance of the nuclear fuel (IAEA, 1990). Therefore, uranium must be refined to meet rigid international standard specification of nuclear purity. In this approach, solvent extraction technique is almost exclusively adopted for uranium refining and purification, and TBP is the most common commercial process applied for uranium extraction from nitrate solution (IAEA, 1993). In the present work, TBP was used to refine crude yellow cake in order to obtain nuclear pure uranium trioxide. Performing of the refining of uranium yellow cake concentrate was carried out through five steps. Firstly, the intermediate product was dissolved in concentrated nitric acid to obtain the liquid uranyl nitrate, which is used as feed liquor for extraction process. Secondly, uranium was quantitatively extracted from aqueous nitrate feed solution using 25% TBP in three batches using the extraction phase ratio A/O of 2:1. Thirdly, uranium loaded organic phase was scrubbed using 1 M nitric acid solution at A/O phase ratio of 1:5, through single contact. Scrubbing is extremely needed for further removal of the co-extracted impurities. Then, uranium was stripped from the loaded scrubbed organic phase by using 0.5 M Na2CO3 in two batches applying stripping phase ratio A/O of 1:4. Fourthly, uranium was precipitated from the acidified carbonate solution using 30% hydrogen peroxide. Hydrogen peroxide has been reported as a very selective precipitant for uranium from acidic solutions (IAEA, 1993). It is reasonable to precipitate uranium peroxide (UO4·2H2O) from the stripped sodium uranyl tricarbonate liquor at pH 2. Advantage of such precipitation came from the great minimization of impurities in the obtained uranium precipitate. Finally, the orange powder of nuclear grade uranium trioxide (UO3) was obtained by calcination of uranium peroxide in controlled furnace, in two thermal stages:
The chemical analysis of the metallic impurities in the obtained uranium trioxide (UO3) product summarized in Table 12 is in great agreement with that of nuclear purity specification (Table 14). UT: uranium trioxide sample.
Sample No.
U (%)
Concentration (μg/g)
Na
P
K
Ca
Mg
Mn
Cr
Fe
Co
Ni
Cu
Zn
Cd
Mo
Pb
1UT
84.04
9.74
1.75
4.25
1.80
0.80
1.64
0.03
4.75
0.06
4.10
0.12
0.61
0.08
0.15
1.87
2UT
84.35
9.24
1.85
4.15
2.35
0.85
1.14
0.03
4.45
0.06
4.10
0.08
0.66
0.05
0.13
1.85
3UT
83.22
9.18
1.50
4.02
1.96
1.26
1.42
0.02
4.92
0.05
4.78
0.09
0.64
0.05
0.11
2.34
4UT
83.63
9.04
2.25
4.11
1.84
1.02
1.23
0.01
4.91
0.04
4.97
0.12
0.65
0.07
0.15
2.27
5UT
83.10
8.88
2.12
3.95
2.30
0.98
1.50
0.04
5.66
0.04
5.14
0.07
0.65
0.08
0.14
2.31
6UT
84.17
8.74
2.64
3.93
2.35
0.95
1.05
0.05
5.52
0.05
5.02
0.08
0.65
0.08
0.10
1.94
7UT
82.98
9.17
2.16
4.15
2.12
1.05
1.26
0.04
5.23
0.06
4.00
0.10
0.66
0.06
0.14
1.90
8UT
82.81
9.36
2.55
4.24
2.00
1.15
0.95
0.03
5.74
0.05
4.25
0.12
0.68
0.06
0.10
1.87
9UT
83.55
8.02
1.97
4.33
1.90
1.20
0.94
0.02
5.06
0.05
4.60
0.13
0.63
0.06
0.13
2.30
10UT
83.71
8.71
1.90
3.84
1.84
1.21
1.33
0.02
4.87
0.03
4.65
0.10
0.64
0.09
0.15
2.27
11UT
83.25
9.50
1.85
3.82
1.88
0.94
1.45
0.02
4.25
0.06
4.76
0.13
0.64
0.07
0.14
2.18
12UT
84.00
9.36
2.05
4.32
2.27
0.93
1.50
0.03
4.41
0.04
4.17
0.12
0.62
0.07
0.14
2.05
13UT
84.82
8.84
2.00
4.18
2.16
0.97
1.26
0.04
5.00
0.05
4.23
0.07
0.63
0.09
0.12
1.91
14UT
83.61
8.43
1.76
4.00
2.31
0.85
1.50
0.04
5.50
0.06
5.06
0.08
0.65
0.09
0.14
1.94
15UT
83.50
8.80
1.66
4.20
2.43
0.84
1.26
0.03
4.76
0.04
5.11
0.09
0.68
0.05
0.11
1.90
Mean
83.65
9.00
2.00
4.10
2.10
1.00
1.30
0.03
5.00
0.05
4.60
0.10
0.65
0.07
0.13
2.06
Min.
82.81
8.02
1.50
3.82
1.80
0.80
0.94
0.01
4.25
0.03
4.00
0.07
0.61
0.05
0.10
1.85
Max.
84.82
9.74
2.64
4.33
2.43
1.26
1.64
0.05
5.74
0.06
5.14
0.13
0.68
0.09
0.15
2.34
St. Dev.
0.55
0.44
0.31
0.16
0.22
0.15
0.21
0.01
0.46
0.01
0.42
0.02
0.02
0.01
0.02
0.19
The major metallic impurities in the obtained uranium trioxide are Na, Fe, Ni and K (Fig. 6). The metallic impurities in the decreasing order of mean abundance are: Na > Fe > Ni > K > Ca > Pb > P > Mn > Mg > Zn > Mo > Cd > Co > Cr. Table 13 shows that uranium correlates positively with Cd (+0.36), and iron correlates with P (+0.54) and Cr (+0.52). In addition, chromium has a strong positive correlation with Ca (+0.70). Cluster analysis of metallic impurities and uranium in uranium trioxide samples produced two-group dendrogram of element association (Fig. 7). The first group includes all of the estimated metallic impurities, while the second group includes only uranium. This indicates that uranium in uranium trioxide concentrate has no association with any metallic impurities.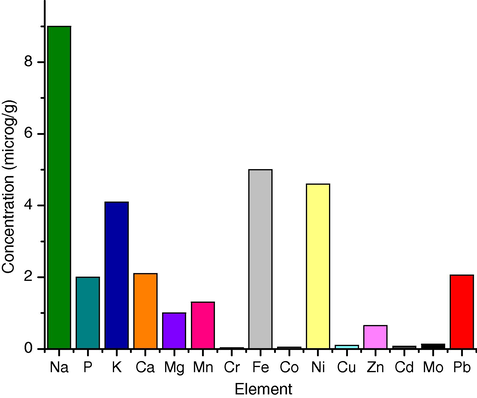
Metallic impurities concentrations in uranium trioxide samples.
U
Na
P
K
Ca
Mg
Mn
Cr
Fe
Co
Ni
Cu
Zn
Cd
Mo
Pb
U
1.00
Na
−0.07
1.00
P
−0.07
−0.03
1.00
K
0.16
0.04
0.03
1.00
Ca
0.22
−0.21
0.09
0.06
1.00
Mg
−0.43
−0.28
0.11
−0.10
−0.50
1.00
Mn
0.03
0.41
−0.56
−0.25
−0.06
−0.40
1.00
Cr
0.23
−0.11
0.34
−0.04
0.70
−0.41
0.01
1.00
Fe
−0.35
−0.39
0.54
−0.07
0.19
0.24
−0.31
0.51
1.00
Co
0.03
0.27
−0.12
0.10
0.01
−0.36
0.05
0.28
−0.05
1.00
Ni
−0.23
−0.48
−0.05
−0.54
0.20
0.01
0.07
−0.04
0.29
−0.37
1.00
Cu
−0.32
0.27
0.07
0.30
−0.68
0.22
−0.08
−0.65
−0.36
0.03
−0.26
1.00
Zn
−0.46
−0.11
0.27
−0.10
0.42
0.03
−0.50
0.14
0.38
−0.05
0.26
−0.25
1.00
Cd
0.36
−0.19
0.18
−0.38
−0.09
−0.17
0.37
0.32
0.25
−0.15
0.15
−0.23
−0.45
1.00
Mo
0.04
0.11
−0.28
−0.12
−0.39
−0.18
0.57
−0.34
−0.36
−0.04
−0.12
0.28
−0.49
0.39
1.00
Pb
−0.33
−0.29
−0.18
−0.37
−0.45
0.62
0.11
−0.59
−0.06
−0.49
0.47
0.21
−0.27
0.03
0.29
1.00
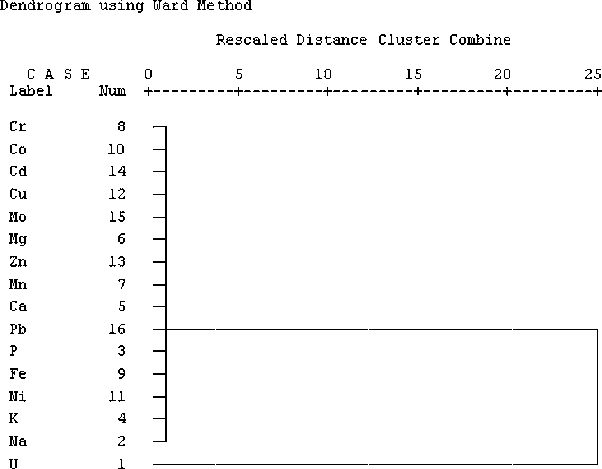
Dendrogram showing metallic impurities and uranium association in uranium trioxide samples.
5 Conclusion
Based on the obtained results of the foregoing study, the following conclusions can be derived:
-
By digesting the phosphate ore samples from Uro area with sulphuric acid, around 98% of the uranium content in the ore was reported soluble in the obtained phosphoric acid.
-
An excellent uranium extraction from the green purified phosphoric acid was attained by using 25% tributylphosphate in kerosene in three batches at A/O phase ratio of 1:2, and 5 minutes mixing time.
-
Effectively uranium stripping process, with a recovery percentage above 98% from the pregnant organic solvent was accomplished by using 0.5 M Na2CO3 solution in two batches at A/O phase ratio of 1:4, where uranium reports in the stripping solution in the form of soluble sodium uranyl tricarbonate.
-
By applying sodic decomposition upon stripping carbonate solution, generally, about 98% of uranium in the strip solution was precipitated as sodium diuranate concentrate (Na2U2O7).
-
The specification of the obtained uranium concentrates; yellow cake and uranium trioxide, is agree well with the standard commercial specification, and have proved their nuclear purity.
-
The overall recovery percentage of uranium from ore was 93%.
-
Cluster analysis indicates that uranium is associated with a group of two metallic impurities; P and Ca, in yellow cake concentrate, while in uranium trioxide concentrate; no association with any of the metallic impurities is noted.
References
- The Journal of Argentine Chemical Society. 2009;97:166.
- Physics and Chemistry of the Earth. 1959;3:298.
- Phosphates and Phosphoric Acid, Fertilizer Science and Technology. New York, USA: Marcel Decker Inc.; 1993.
- Brinkman, K., 1986. The geology and mineralization of basement complex in the northeast Nuba Mountains, Sudan, Hanover (unpublished report).
- Hydrometallurgy. 2004;71:429.
- Hydrometallurgy. 2004;73:63.
- Hassan, A.R., 1989. Prospecting methods for uranium and other associated mineralization in the Nuba Mountains, Sudan. M.Sc. Thesis, University of Khartoum, Sudan.
- IAEA, 1989. The recovery of uranium from phosphoric acid, Technical Reports Series No. 533, International Atomic Energy Agency, Vienna, Austria.
- IAEA, 1990. Manual laboratory testing for uranium ore processing, Technical Reports Series No. 313, International Atomic Energy Agency, Vienna, Austria.
- IAEA, 1993. Uranium extraction technology, Technical Reports Series No. 359, International Atomic Energy Agency, Vienna, Austria.
- Quantitative X-ray Spectrometry. New York, USA: Marcel Decker Inc.; 1981.
- Analytical Atomic Absorption Spectroscopy. Toronto: Academic Press Inc.; 1980.
- Hydrometallurgy. 2000;56:309.
- Talanta. 1976;23:283.
- Journal of Environmental Radioactivity. 2002;62:39.
- Microchemical Journal. 2009;91:94.
- Science of the Total Environment. 1995;162:173.
- Journal of Environmental Radioactivity. 1999;42:65.
- SPSS-Statistical Program for the Social Science, 1998. Standard Version 9.0 for Windows, SPSS Inc., Chicago, IL, USA.
- Geological Society of America Bulletin. 1961;72:175.
- The Geology of the Sudan Republic. Oxford, Britain: Clarendon Press; 1971.


