

Translate this page into:
Valorization of Zea mays hairs waste extracts for antioxidant and anticorrosive activity of mild steel in 1 M HCl environment
⁎Corresponding authors. sarra.aourabi1@gmail.com (S. Aourabi), kabdalsamad@taibahu.edu.sa (K.M. Emran)
-
Received: ,
Accepted: ,
This article was originally published by Elsevier and was migrated to Scientific Scholar after the change of Publisher.
Peer review under responsibility of King Saud University.
Abstract
The extraction of Zea mays hairs (Z. mays) was carried out by soxhlet and ultrasound techniques and through three solvents. Phytochemical tests and quantitative analysis of total phenols content (TPC) and flavonoids content (FC) for all extracts were also determined. The antioxidant activity, for different fractions, was determined by using three methods; DPPH•, FRAP and TAC. All extracts were rich in polyphenols and the analysis of TPC and FC showed that the hydro-ethanolic extract obtained by ultrasound was characterized by a significant amount of TPC and FC. The n-butanolic fraction was rich in FC and also had a very high antioxidant capacity. On the other hand, the inhibiting effect of hydro-ethanolic extract, n-butanolic fraction and standard (flavone) on mild steel corrosion in 1 M HCl solution was investigated by electrochemical measurements. The polarization curves along with EIS diagrams indicated that flavone was the major molecule responsible for inhibition and acted as mixed-type inhibitor with predominant control of cathodic reaction. The antioxidant activity of BF was well correlated to corrosion inhibition efficiency.
Keywords
Zea mays hairs
Phenolic fraction
Flavonoids
Antioxidant activity
Corrosion inhibition

1 Introduction
Aromatic and medicinal plants have a considerable content of bioactive compounds with specific biochemical or organoleptic properties, allowing their use in pharmaceutical, cosmetic and food industries (Khiya et al., 2019). Currently, the recovery of bio-waste is mainly studied in the field of green chemistry because of a great interest as a source of high value-added compounds. Over the last decades, the various extracts and essential oils of plants have been of great interest because they have been sources of natural products. Z. mays hairs (Corn silk) is a collection of the stigmas (fine, soft, yellowish threads) from the female flowers of the maize plant contains proteins, vitamins, carbohydrates, Ca2+, K+, Mg2+ and Na+ salts, volatile oils, and steroids, alkaloids, saponins, tannins, and flavonoids, flavones, flavones glycosides (Newal et al., 1996; Panizza, 1997; Pedretti, 1980; Velazquez et al., 2005; Amine et al., 2018). The phenolic molecules particularly quercetin, rutin and flavone glycosides have a strong antioxidant activity (Azevedo and Pereira, 2013; Amine et al., 2018). Various researchers have found a positive correlation between the total phenols content, flavonoids content and antioxidant tests (Piluzza and Bullitta, 2011). The obtaining phenolic molecules often require many long and costly steps; the most important of which is extraction. One of the major challenges of analytical chemistry consists of technological innovation and development of new extraction methodologies (Chemat et al., 2012). Currently, the use of plants as a source of corrosion inhibitors is widely recognized for their acceptable environmental and ecological properties. Consequently, to prevent or to delay the corrosion of metals (Khiya et al., 2019). This corrosion is generally inhibited by the interaction of functional groups having oxygen, nitrogen, aromatic resins and sulphur with lone pair of electrons to interact with metal surface (Chung and Kim, 2019) by forming a protective film onto the mild steel surface. These protective films are formed by chemical and/or physical adsorption which slows down reduction and/or oxidation reactions occurring during corrosion. Most of the synthetic compounds used as inhibitors, have good anti-corrosive action, but most of them are highly toxic to human beings and to the environment (Sikine et al., 2018). The attempts to highlight environmentally friendly processes are reoriented to the use of natural products. These bioactive compounds are extracted from aromatic herbs, spices and medicinal plants. The inhibitors are organic or inorganic in nature, some act as cathodic and anodic inhibitors to reduce or prevent corrosion (Dwivedi et al., 2017; Dariva, 2014; Singh et al., 2016; Dutta et al., 2015). This work includes some research studies that have used natural substances; extract of Chamaemelum mixtum (Ben Hmamou et al., 2012), ethanolic extract of Ammi visnaga (Aourabi et al., 2018), different extract of Ammi visnaga (Aourabi et al., 2019); extract of Black Pepper (Dahmani et al., 2010).
The objective of this article was to apply ultrasound extraction method known for its effectiveness in extracting phenolic molecules, and to compare it with conventional technique (Soxhlet). Hence, to determine the phenolic compounds responsible for the inhibitory action of Z. mays hairs, we proposed to study the phenolic fraction, and to identify the presence of major molecule in flavonoids fraction. In addition, the antioxidant property of different extracts was also studied by DPPH▪, Ferric-reducing Antioxidant power (FRAP) and Total Antioxidant Capacity (TAC) for the purpose to correlate the antioxidant capacity with anticorrosive activity. The anticorrosive activity of hydro-ethanolic extract elaborated by ultrasound, n-butanolic fraction and standard (flavone) and ascorbic acid for antioxidant activity were investigated by electrochemical measurements (polarization curves and impedance spectroscopy).
2 Materials and methods
2.1 Materials
2.1.1 Vegetal material
Z. mays hairs, Poaceae female used for this investigation was collected in September 2018 at Taounate region. The botanical identification of species was carried in Laboratory of Biotechnology and Preservation of Natural Resources (BPNR), University Sidi Mohamed Ben Abdellah, Fez, Morocco. The Z. mays hairs were dried at room temperature.
2.1.2 Metallic matrix and corrosive solution
The material, used in this study, is mild steel, the composition of which is given elsewhere (Aourabi et al., 2018). The acid solution was prepared by dilution of an analytical reagent grade 37% HCl with doubly distilled water. Appropriate concentrations of different inhibitors were prepared with 1 M HCl addition.
2.2 Methods
2.2.1 Methods of extraction
The extraction methods used, in this work, are based on Soxhlet and ultrasound techniques. For soxhlet method, dried Z. mays hairs powder was successively extracted with different solvents such as pure ethanol and 70% ethanol by soxhlet for 12 h. For the extraction, 40 g of dried powdered sample was extracted with 400 mL of the solvent (pure ethanol and 70% ethanol). The obtained extracts were collected separately and kept for further analysis. On the other hand, the extraction, via the ultrasonic method, of Z. mays hairs were obtained by ultrasound (45 Hz, 50 W, 25 °C), mixing the dry powder (40 g) with 400 mL of different solvents (water, ethanol and ethanol/water 70:30) for 45 min. The extracts were filtered concentrated under reduced pressure. Then, we carried out the fractionation of flavonoids from the hydro-ethanolic extract obtained by ultrasound method. The HE was dissolved in warm water and then partitioned sequentially with petroleum ether (PF), ethyl acetate (AF), n-butanol (BF) and water (WF). The different fractions were collected separately and concentrated using a rotary flash evaporator to remove the solvent. All fractions (PF, AF, BF and WF) were stored at 4 °C for subsequent analyses.
2.2.2 Quantitative and qualitative analyses of extracts
The different extracts obtained by two methods of extraction were subjected to preliminary screening of phytochemical constituents. The procedures were described by Judith (2005), Dohou et al. (2003), Diallo (2005). The total phenolic and the flavonoids content was determined according to Liu and Yao (2007) and Chang et al. (2002).
2.2.3 Electrochemical methods of analysis
The electrochemical measurements were determined following the same operating protocol described in reference (Aourabi et al., 2019).
2.3 Antioxidant activity
The antioxidant analysis was monitored using three of the most recognized methods in literature. Firstly, DPPH▪ radical scavenging activity was determined according to Rumbaoa et al. (2009). Secondly, ferric-reducing Antioxidant power (FRAP). In fact, the reductive potential has been examined by the transformation of Fe3+ to Fe2+ in the presence of an antioxidant this test is realized according to Oyaizu (1986). Thirdly, the determination of total antioxidant capacity (TAC) of the extracts was evaluated by Phosphomolybdenum method (Prieto et al., 1999).
In addition, we used the HPLC technique for identification of flavonoids. Indeed, the analysis of the presence of phenolic compounds (flavone) in the n-butanolic (BF) was carried out by HPLC (reverse phase) and the type of waters 600E coupled to a fluorescence detector equipped with an injection loop with a C18 column (length = 150 mm; diameter = 4.6 mm, 5 μm particle size). The analysis was carried out in Laboratory of Agricultural & Food Industry, IAV HASSAN II. The flow rate of the mobile phase was 1.5 mL/min. Detection was performed at two wavelengths: the excitation wavelength was 254 nm and the detection wavelength was 348 nm. The mobile phase was Acetic acid: Methanol (5:95 v/v). The HPLC conditions are listed in Table 1.
Sample
Mobile phase
Column
Injection volume
Flow rate
Detection/Fluorescence
Flavone
Acetic acid:Methanol (5:95 v/v)
C18
5 μL
1.3 mL /mn
Excitation at 254 nm and detection at 348 nm
3 Resultants and discussion
3.1 Phytochemical screening
The preliminary phytochemical screening for different extracts obtained by two methods of extraction showed the presence important of phyto-constituents such as flavonoids, phenols and glycoside in ethanolic and hydro-ethanolic extracts, respectively. On the other hand, the presence low of flavonoids, phenols and glycoside were observed in aqueous extract, also the presence low of alkaloids and tannins in three extracts, hence the presence of steroids and terpenoids only in ethanolic and hydro-ethanolic extracts, these results are in agreement with (Markom et al., 2007; Lafka et al., 2007). The objective of this section is to determine the polyphenols existing in the various extracts, following the example of the used extraction methods, in order to develop the main molecules that can be determined and fractionated. Table 2 shows the results of phytochemical analysis of various extracts of Z. mays hairs. where ++: Important presence, -: Absence, +: Low presence
Composition
Ethanolic extract
Aqueous extract
Hydro-ethanolic extract
Alkaloids
+
+
+
Flavonoids
++
+
++
Glycoside
++
+
++
Steroids
+
–
+
Tannins
+
+
+
Terpenoids
+
–
+
Phenols
++
+
++
3.2 Extraction yields of TPC and FC issued from soxhlet and ultrasound techniques
In order to compare the performance of the two extraction techniques studied, we first compared the yields obtained by each technique; then, the concentrations of polyphenols and flavonoids contained in the different extracts (Ethanolic, Aqueous and Hydro-ethanolic) from each extraction method were evaluated. The different results obtained are grouped in Table 3. The values are expressed as means ± SD
Technique
Ethanolic
Aqueous
Hydro-ethanolic
Soxhlet
Extraction yield %
27.73
–
32.35
TPC (mg EGA/g extract)
45.50 ± 2.4
–
95.47 ± 2.2
FC (mg EQ/g extract)
19.58 ± 1.3
–
28.42 ± 1.7
Ultrasound
Extraction yield %
20.10
18.3
22.6
TPC (mg EGA/g extract)
93.43 ± 3.4
35.34 ± 4.4
230.94 ± 3.2
FC (mg EQ/g extract)
18.4 ± 2.6
7.33 ± 2.6
57.22 ± 3.5
It is noted that the technique of extraction of Z. mays hairs by ultrasound with three solvents gives a yield varying between 18.3 and 22.6%. The highest yield is obtained by the mixed solvent (70:30) more than the pure solvent (Markom et al., 2007; Lafka et al., 2007). Soxhlet extraction allowed the highest efficiency compared to ultrasound extraction, which can be explained by the heating applied during the operation as well as the long extraction time (Markom et al., 2007). These two parameters (heating and time) have the main disadvantage of conventional soxhlet extraction by exposing the heat-labile compounds contained in the plant to partial or total degradation (Jennan, 2015; Schinor et al., 2004). Therefore, it can be said that ultrasonic extraction is the most efficient in terms of time and conservation of heat-labile products (Biesaga, 2011; Sanghi and Kannamkumarath, 2004; Zhang et al., 2009).
The concentration of total phenols in the various extracts produced by ultrasound are higher than those obtained by soxhlet. So, the phenol content in different extracts obtained by ultrasound varies from 35.34 to 230.94 mg EGA/g extract. The total phenolic content is in the following order: Hydro-ethanolic > Ethanol > Aqueous. In another hand, the total phenolic content in different extracts obtained by soxhlet is in the following order: Hydro-ethanolic > Ethanol. The finding results show that ethanol/water mixture is a good solvent for phenolic extraction from Z. mays hairs is in agreement with previous investigations (Aourabi et al., 2019; Solihah et al., 2012; Benali et al., 2020). Solihah et al. (2012) revealed that the addition of 20% water in ethanol has increased the extraction of total phenolic compounds of medicinal plant materials up to 54%. In addition, It has been (Benali et al., 2020) found that the amount of total phenolic and flavonoids compounds extracted from Andrographis paniculata powder was observed higher when a mixture of ethanol and water was used as the extracting solvent rather than single solvent of pure ethanol or water. The FC content in different extracts was in the following order: Hydro-ethanolic > Ethanol > Aqueous. We notice that the ethanol extract therefore contains higher flavonoids than the aqueous extracts because the flavonoids can be diffused more in ethanol pure than the water (Mello et al., 2010). According to these results, one concluded that the hydro-alcoholic extract obtained by ultrasound is characterized by the highest content of FC and TPC compared to the other extracts obtained by the soxhlet method. For this reason, we were interested in the fraction of flavonoids from the hydro-ethanolic extract by using ultrasound method.
3.3 Extraction yields of TPC and FC issued from fractionation of flavonoids
Table 4 shows the extraction yield, TPC and FC of each fraction from Z. mays hairs. The extraction yield of all fractions vary from 1 to 10%. Among all the fractions, BF obtains the highest extraction yield (10%) while PF yielded the lowest (1%). The TPC of all fractions from Z. mays hairs vary from 23.59 to 296.20 mg EGA/g extract. The highest FC is detected in BF, whereas the lowest content was found in PF. TPC of Z. mays hairs extracts is found to be arranged in the following descending order: BF > AF > WF > PF. Based on these results, the FC of all fractions from Z. mays hairs has the same descending order as with the TPC. The FC of Z. mays hairs extracts is in good correspondence with the TPC (R2 = 0.977), so it can be presumed that the flavonoids are the major phenolic compounds present in Z. mays hair (Maksimovic and Kovacevic, 2003). The values are expressed as means ± SD. where: PF: Petroleum ether fraction; AF: Ethyl acetate fraction; BF: n-butanolic fraction; WF: water fraction
Fraction
Yield extraction %
TPC (mg GAE/g extract)
FC (mg QE/g extract)
PF
1.00
23.59 ± 3.21
11.41 ± 1.21
AF
8.00
196.74 ± 4.42
163.86 ± 1.70
BF
10.00
296.20 ± 5.82
200.35 ± 2.11
WF
3.00
47.91 ± 2.43
27.73 ± 2.82
3.4 Antioxidant activity
3.4.1 DPPH▪ method
Antioxidant activity of Z. mays hairs extracts is conducted by using the DPPH• free radical method. The scavenging activities of the different fraction are shown in Table 5. The BF extract exhibited higher level of scavenging activity followed by AF when compared to the other fractions. In the BF fraction, the IC50 of inhibition is of 58.7 μg/mL and PF is characterized by the lowest inhibition (IC50 = 100.4 μg/mL) compared to BHT (49.6 μg/mL) respectively. Meanwhile, the DPPH▪ scavenging activity of all fractions shows similar trend with the content of total phenolic compounds (R2 = 0.9213) and total flavonoids (R2 = 0.9417), in all the fractions, indicates that the phenolic compounds, particularly flavonoids that present in all fractions of Z. mays hairs are the major constituents which can scavenge the DPPH▪ radical, due to the presence of the hydroxyl groups in their structure and their electron donating ability (Amine et al., 2018; Ardestani and Yazdanparast, 2007). The flavonoids are believed to reside in their free radical-scavenging capacity and their antioxidant activity increases with an increase in the number of hydroxyl groups (Sultana et al., 2009). It has been suggested that higher level of flavonoids content in BF fraction contribute to the strong scavenging activity. This phenomenon is also observed in other plants (Aourabi et al., 2019; Ardestani and Yazdanparast, 2007; Li et al., 2008; Bozan et al., 2008; Saleem et al., 2001).
Fraction
DPPH•
FRAP
TAC
PF
100.4
95.7
93.4
AF
62.4
30.3
56.8
BF
58.7
25.6
43.5
WF
95.2
85.6
73.8
BHT
49.6
18.4
34.7
3.4.2 FRAP method
The potassium ferricyanide reduction method is used to evaluate the reducing power of polyphenols, which constitutes a widely used method in measuring antioxidant activity of phenolic compounds. In this way, the antioxidants present in the test solution can reduce the Fe3+ ferricyanide complex to ferrous form by donating an electron according to the following mechanism (Fig. 1).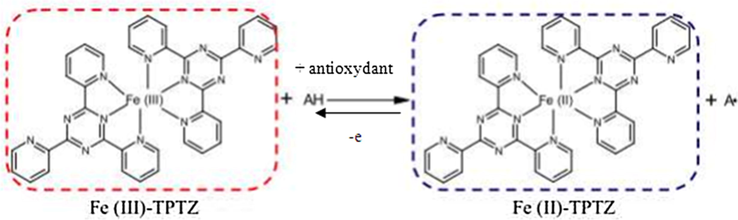
Reaction mechanism of the FRAP test.
In the present study, as shown in Table 5, the BF derived from Z. mays hairs exhibits the strongest reducing power (25.8 μg/mL) and has no significant difference when compared to BHT (18.4 μg/mL), while PF yield remains the lowest (66.3 μg/mL). The reducing power of all fractions can be presented in the following order: BHT > BF > AF > WF > PF. Significant correlation has been found between the FRAP activity and the TFC (R2 = 0.847), indicating that the reducing power of all the fractions is highly related to the amount of phenolic compounds especially flavonoids that present in the fractions, which can serve as electron donor to achieve the radical chain reaction.
3.4.3 TAC method
The total antioxidant activity of fractions is measured by monitoring the absorbance of the reaction mixture at 695 nm. A high absorbance value of the reaction mixture indicates a stronger total antioxidant activity. Table 5 shows the total antioxidant activities of all fractions and the positive standard of BHT. All the fractions show a potent total antioxidant activity, which is concentration-dependent. The BF, at a concentration of 100 μg/mL, exhibits the strongest total antioxidant activity while PF yield is the lowest. The values of all the fractions (PF, AF, BF, WF and BHT) through total antioxidant activity test are arranged in the following descending order: BHT > BF > AF > WF > PF. Significant correlation has been found between the total antioxidant activity and the TPC (R2 = 0.909) and FC (R2 = 0.920) of all fractions. The results obtained in this investigation reveal that the total antioxidant activity may be attributed to the presence of phenolic and flavonoids constituents in all fractions (Thoo et al., 2013).
3.4.4 HPLC for n-butanolic fraction
According to HPLC analysis, the n-butanolic fraction is rich in flavonoids, especially flavones, this result is in agreement with Amine et al. (2018) showing that the n-butanolic fraction of Z. mays (China) is rich in two flavone glycoside.
3.5 Electrochemical tests
The objective of this part is to determine the family of molecules or major molecule responsible for the inhibiting action of Z. mays. To do so, we studied the corrosion inhibiting effect of hydro-ethanolic extract (HE), n-butanolic fraction (BF) and standard (flavone).
3.5.1 Potentiodynamic polarization study
The typical potentiodynamic polarization curves for mild steel in 1 M HCl in the absence and presence of different concentrations of HE and BF (0.05–0.15 g L−1), respectively, as well as flavone (8 × 10⁻³−1.5 × 10⁻² mol L−1), have been carried out, in order to gain information about the kinetics of the cathodic and anodic reactions as shown in Fig. 2. The choice of concentrations of flavone molecule is determined from the percentage of flavone in the fraction n-butanolic (HPLC) and molecular weight of the molecule as well as the mass concentration of HE and BF for the quantity of the standard treated which is compatible with the quantity of flavone in the fraction.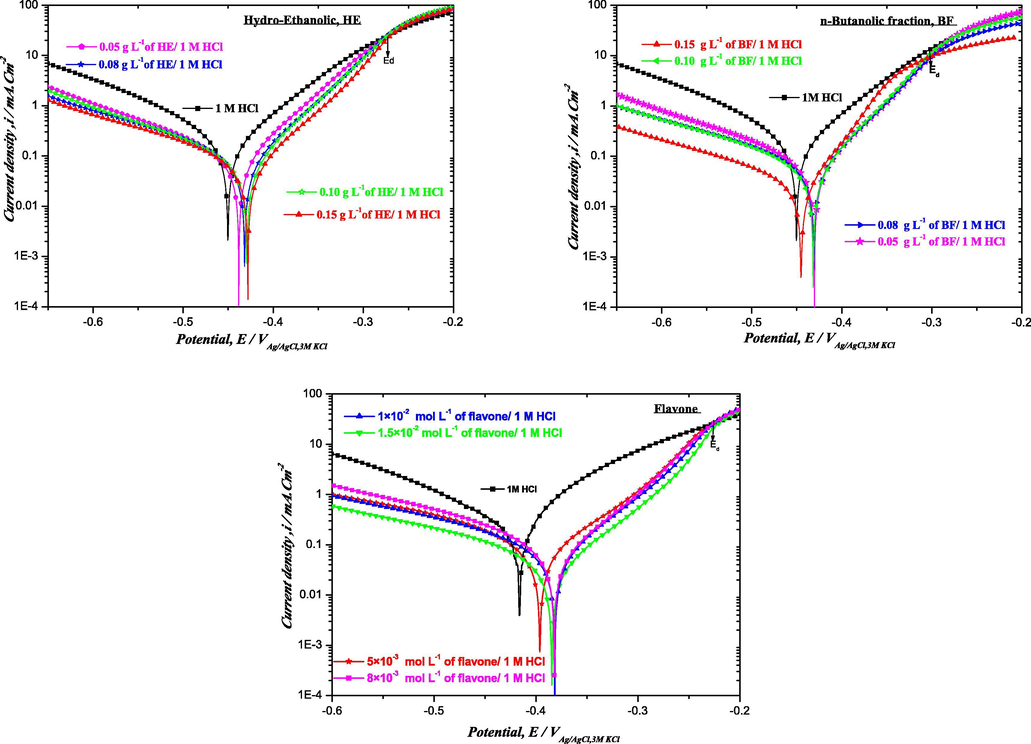
Polarization curves of mild steel in 1 M HCl at different concentrations of HE, BF and flavone at 298 K.
Analysis of the polarization curves shows that in the presence of the different inhibitors, the anodic region does not exhibit Tafelian behavior. Only cathodic regions have a wide range of linearity, indicating that Tafel law is well verified in the cathode domain and that hydrogen reduction is controlled by pure activation kinetics (Evens et al., 1996). Corrosion current densities can then be estimated by extrapolating only the right-hand side of Tafel cathodic to the corrosion potential. Also, it can be seen that the addition of these three inhibitors causes a decrease in anodic and cathodic current densities; this decrease is proportional to the inhibitor contents. The polarization curves for the HE inhibitor show a decrease in partial current densities, which is all the more remarkable in the anodic domain than in the cathode region. In addition, a slight shift, in corrosion potential, is registered towards more noble values. As a result, inhibitor HE can be classified as a mixed type inhibitor with a slight anodic predominance.
However, in the presence of BF and flavone inhibitors, the appearance of the curves (log i = f(E)) is almost identical. On note a decrease in current densities in both cathodic and anodic branches, the corrosion potentials are shifted towards less noble values. Then, these two inhibitors can be considered as mixed type with a slight anodic predominance.
In addition, in the anodic region, inhibition of BF and HE as well as flavone depend on the applied potential. Indeed, HE, BF and flavone act as corrosion inhibitors only at low anodic overvoltage below Ed ≈ 0.275, Ed ≈ 0.295, Ed ≈ 0.235 VSCE, respectively. Therefore, current densities increase significantly in the presence of HE, BF and flavone with higher potential than Ed (Jayaprakasha et al., 2008; Chetouani et al., 2006). This can be interpreted by the desorption of inhibiting molecules due to a high polarization of the working electrode, and consequently the mechanism of the metallic dissolution reaction is modified leading to the removal and/or deformation of the HE, BF and flavone film on the surface of the mild steel. This potential is generally defined as the desorption potential. The electrochemical parameters extrapolated from Tafel and Stern& Geary are given in Table 6. where, Ecorr: mVAg/AgCl, icorr: µA cm−2, ßc: mV dec−1, Rp: Ω cm2.
Tafel Data
Stern&Geary data
Cinh
Ecorr
icorr
|ßc|
ɳpp%
Rp
ɳ S&G%
Blank
1 M HCl
−416.2
337.1
147.1
–
82
–
HE (g L−1)
0.05
−445.5
82.5
170.4
75.52
249
67.06
0.08
−431.3
73.2
193.9
78.28
407
79.85
0.10
−432.1
70.9
190.6
78.96
416
80.28
0.15
−430.3
33.8
193.5
89.97
679
87.92
BF (g L−1)
0.05
−437.9
101.1
162.1
70.00
218
62.38
0.08
−440 0.1
63.4
174.7
81.19
373
78.01
0.10
−438.6
59.8
158.5
82.26
415
80.24
0.15
−436.6
57.3
159.7
83.00
438
81.27
Flavone (mol L−1)
8 × 10⁻³
−395.47
145.2
238.3
56.92
178
53.93
5 × 10⁻³
−382.92
128.1
200.7
61.99
205
60.00
1 × 10⁻²
−384.52
101.1
223.7
70.08
260
68.46
1.5 × 10⁻²
−381.26
63.8
227.1
81.01
420
80.47
It is clear from Table 6 that HE addition noticeably decreases icorr and ηpp% considerably increases from 73.99 to 89.34%. This suggests that the corrosion rate is reduced due to the formation of a barrier film onto the mild steel surface by adsorption of polyphenolic molecules. For the n-butanolic fraction obtained by fractionation of the hydro-alcoholic extract, it is noted that after the addition of BF, the current density decreases and therefore the percentage of corrosion inhibition increases to 81.93% at 0.15 g L−1. So, at the same concentration the hydro-ethanolic extract has a corrosion inhibition difference of 7.41% when compared to n-butanolic fraction rich in flavonoids essentially the flavone. Then, the inhibition action of HE is due to the intense presence of flavonoids specially flavone (HPLC with a percentage of 22.4%) confirmed by the electrochemical study which shows that the flavone standard gives an inhibiting efficiency of 79.88% at 1.5 × 10⁻² mol L−1. The plot, in the linear scale of potential variation as a function of current, in the immediate vicinity of the corrosion potential; Ecorr ± 25 mV, allows the determination of Rp which is equal to the slope |ΔE/ΔI|. In addition, it can be observed that the inhibiting efficiencies calculated by Stern&Geary method show the same trend as those determined by extrapolating the straight line of cathodic Tafel to corrosion potentials. Hence, the results collected by this technique bear witness to those obtained by Tafel method.
3.5.2 EIS study
To confirm the results extracted from the potentiodynamic polarization measurements and to acquire more information on the inhibition mechanism, EIS measurements are performed. The Nyquist and Bode diagrams (to reveal the phenomena that occur at high frequencies masked in the Nyquist representation) for the mild steel in 1 M HCl solutions in the absence and presence of HE, BF and flavone after 30 min of immersion at the corrosion potential are shown in Fig. 3.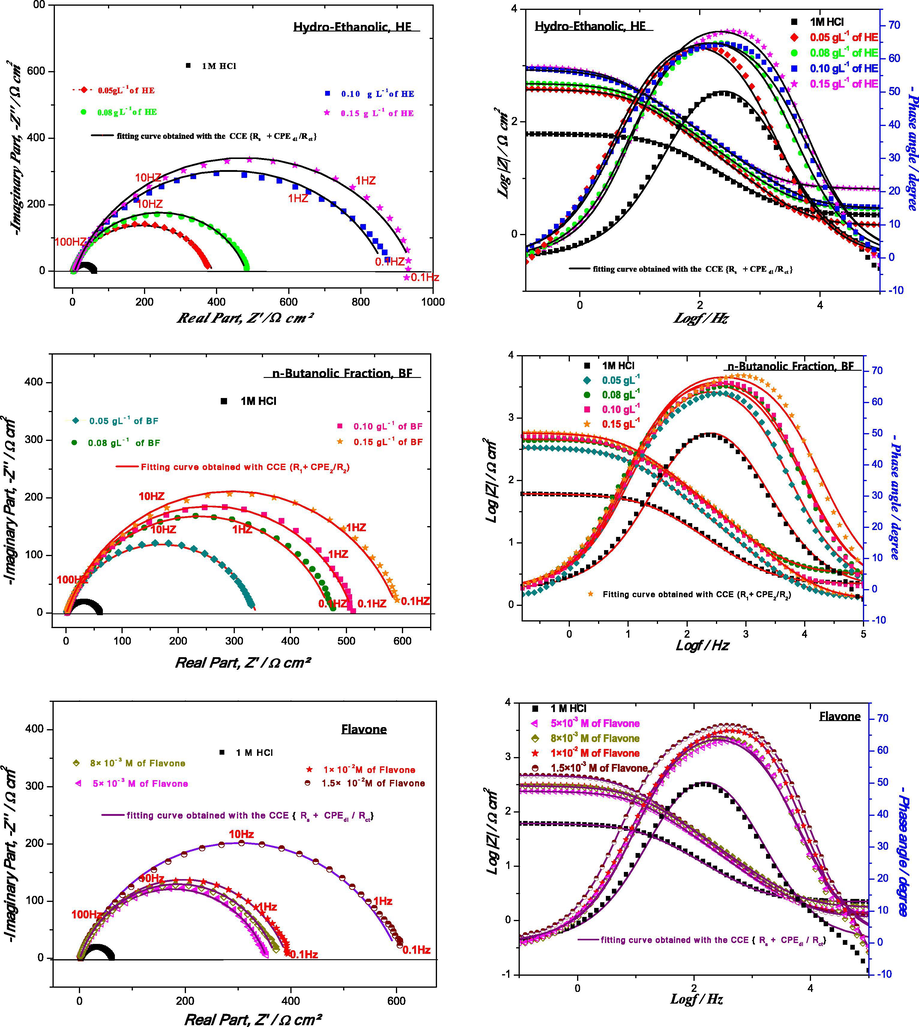
Nyquist and Bode plots of the mild steel in 1 M HCl without and with different concentrations of HE, BF and flavone at 298 K (Rs + CPEdl/Rct).
The presence of a single loop in the representation of Nyquist led us to first choose the Rs + CPEdl/Rct circuit shown in Fig. 4 to model the electrochemical interface and the behavior of HE, BF and flavone inhibitors in 1 M HCl medium. However, this model does not allow a good fit of the measured data for HE and BF inhibitors.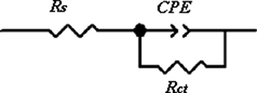
Equivalent electrical circuit used to fit the impedance data for mild steel in 1 M HCl with or without HE, BF and flavone.
According to Fig. 3, we observe a better superposition of the experimental and simulated spectrum in the representation of Nyquist and Bode for the flavone standard which shows that Rs + CPEdl/Rct is a better circuit to model the behavior of the electrochemical interface in the presence of flavone. On the other hand, for the HE and BF inhibitors, there is clearly a poor superposition of the experimental and simulated spectra in Bode representation, which certainly indicates the presence of a second time constant, attributed to an extra phenomenon that takes place. Several equivalent circuit models were tested using the EC-Lab (V11.20) software, only the Re + CPEdl/(Rct + CPEf/Rf) model shown in Fig. 5 allows a perfect match between experimental and theoretical data. Generally, the adjustment of impedance spectra by an equivalent electrical circuit can be ambiguous.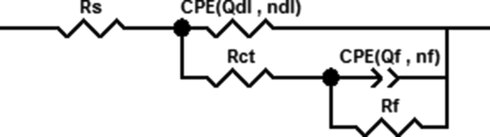
Equivalent circuit used to fit the impedance data for mild steel in 1 M HCl with or without HE and BF.
Indeed, it is sometimes possible to obtain several sets of parameters that are mathematically satisfactory but whose physical meaning may be meaningless (Qian et al., 2013). Moreover, the only loop observed on the Nyquist diagrams (Fig. 6) in the presence of the studied inhibitors could be explained by two time constants badly separated. The time constant located at high frequencies (CPEdl) could be attributed to the adsorption of inhibiting molecules onto the metal surface simultaneously with charge transfer, while the low frequency loop (CPEf) could be linked to the relaxation of inhibition process (Bentiss et al., 2004; Li et al., 2008). Note that the improvement in protective power is characterized on the Nyquist diagram by an increase in the size of the loops.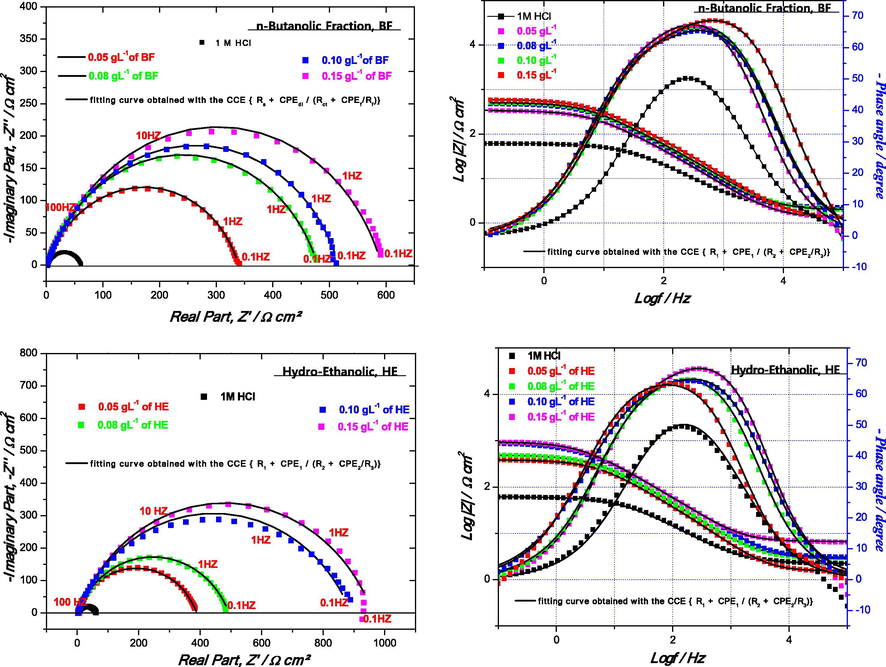
Nyquist and Bode plots of the mild steel in 1 M HCl without and with different concentrations of HE, BF at 298 K by (RS + CPEdl/(Rct + CPEf/Rf)).
The electrochemical impedance parameters for mild steel in 1 M HCl in the presence of HE, BF and flavones inhibitors are reported in Table 7. The resistance values are estimated directly from the adjusted impedance diagrams, while the values of the pseudo-capacitances (Cdl, Cf) are determined by the following Equations (1, 2) according to (Velazquez et al., 2005; Bentiss et al., 2004):
where Rf, Rct, RP and Rs in Ω cm−2,Qf and Qdl in µF sn−1 cm−2 ,Cdl in µF cm−2.
Cinh
Rs
Rct
Qdl
ndl
Cdl
Rf
Qf
nf
Cf
RP
ɳEIS%
Blank
1 M HCl
1.14
58
373.3
0.767
118.80
–
–
–
–
59
HE g (L−1)
0.05
1.51
85
71.17
0.894
–
302
157
0.669
34.97
387
85.01
0.08
2.89
90
62.93
0.882
–
401
130
0.670
30.35
491
88.18
0.10
3.04
94
50.86
0.886
–
795
90
0.672
24.69
888
93.46
0.15
6.63
144
51.73
0.881
–
811
86
0.676
24.00
955
93.92
BF (g L−1)
0.05
1.31
135
101
0.854
–
203
186
0.712
49.94
439
86.62
0.08
2.15
142
72
0.877
–
336
148
0.720
34.04
478
87.71
0.10
1.97
145
71
0.855
–
368
98
0.735
29.91
513
88.55
0.15
1.31
150
50
0.876
–
440
90
0.743
29.62
590
90.05
Flavone (mol L−1)
5 × 10⁻³
0.88
347
104
0.783
50.21
–
–
–
–
347
83.06
8 × 10⁻³
0.89
367
115
0.791
41.60
–
–
–
–
367
83.98
1 × 10⁻²
1.11
393
102
0.794
40.23
–
–
–
–
393
85.04
1.5 × 10⁻²
1.71
586
52
0.799
20.68
–
–
–
–
586
89.52
The inhibition efficiency is calculated as follows by Equation (3):
In uninhibited medium, the total resistance corresponds to the charge transfer resistance (RP = Rct), while in inhibited solution, the value of RP is given by the sum of two resistances: (RP = Rct + Rf). is the total resistance for the blank which corresponds only to charge transfer.
As shown in Table 7, Rct and Rf increase with rise of HE and BF concentration as well as flavone. It should be noted that the n-butanolic fraction generates an inhibitory action against corrosion due to presence of flavonoids family especially flavone. On the other hand, there is no significant difference between the inhibitions obtained by BF and molecule flavone which shows that the flavone molecules are responsible for the inhibition effect of BF, and consequently, for the hydro-ethanolic extracts of Z. mays hairs. In parallel, it is observed a decrease in pseudo-capacities related to the electrochemical double layer and the adsorption of inhibitory molecules onto the metallic surface in conjunction with the increase in inhibiting efficiency. This shows a progressive adsorption of the inhibiting molecules forming a protective film that prevents the infiltration of aggressive species through the inhibitor film. Indeed, we observe an increase in the values ndl with rise of inhibitor concentration associated with a certain decrease in the heterogeneity of the surface resulting from the adsorption of inhibitors on the active centers (Popova, 2007). Therefore, based on these data and the present results, it is noted that the hydro-ethanolic extract of Z. mays hairs plant gives better inhibition when compared to other studies (Ben Hmamou et al., 2012; Aourabi et al., 2018, 2019; Dahmani et al., 2010). It should be noted that the inhibiting efficiencies calculated by EIS method follow the same trend as those obtained from Tafel and LPR method, with some differences indicating the different approximations on which each of them are based.
The adsorption is influenced by various factors such as nature and surface charge of the metal, the number of adsorption sites and the chemical composition of the used inhibitor. BF is rich in flavonoids especially flavone. The flavonoids components can absorb on metallic surface based on donor–acceptor interactions between π-electrons of aromatic ring and vacant d-orbits of Fe (Krilov et al., 1986). The large number of flavone in BF may react with iron, which adsorb on the metal surface, forming organo-metallic complex, such as Fe–flavone according to the reported mechanism (Lopez et al., 2003).
3.5.3 Correlation between inhibition efficiency and antioxidant activity
The relationships between the percentage activity of DPPH▪ and FRAP as well as inhibition efficiency
(calculated from Tafel, EIS and LPR) are analyzed by comparing the trends of percentage activity (%) and those of inhibition efficiency by Origin 6.0. The correlation between percentage activity (%) and inhibition efficiency of BF are plotted in Fig. 7.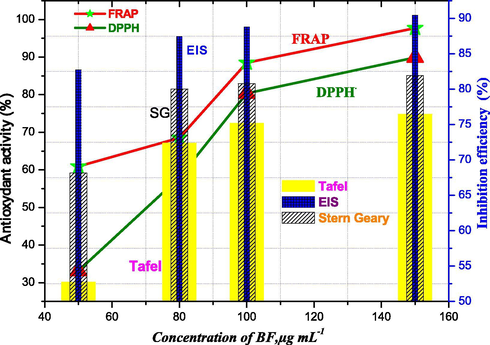
The trends of antioxidant activity and inhibition efficiency calculated by Tafel, EIS and S&G methods.
Fig. 7 shows the evolution of antioxidant activity measured by two methods (DPPH▪ and FRAP) and the anticorrosive activity as a function of the concentrations of n-butanol fraction. It is noted that the percentage of antioxidant activity of BF derived from the FRAP method is higher than that obtained by DPPH• method. Otherwise, one observes that when the percentage of antioxidant activity increases, the inhibiting efficiency calculated by Tafel, EIS and LPR increases as well with concentration. Accordingly, the correlation between antioxidant and anticorrosion activities of n-butanolic fraction may be imputed to the presence of flavonoids. These last are responsible for both reduction of Fe3+ to Fe2+ and scavenging of free radicals as well as the corrosion inhibition through the presence of functional (O—H, C—O, C⚌O) and aromatic ring groups (Brug et al., 1984) in their main structure. These results are in agreement with those reported in references Kang and Jain (2011) and Ghahremani et al. (2012). In order to confirm the highlighted correlation, we have set ourselves the consideration of a pure antioxidant agent. Our choice was ascorbic acid. Corrosion inhibition was investigated by electrochemical impedance measurement.
3.5.4 EIS study for ascorbic acid
The EIS measurement is used to gather the information related to kinetics and adsorption mechanism of ascorbic acid on the mild steel surface at 298 K.
The Nyquist plots without and with the presence of various concentrations of ascorbic acid are shown in Fig. 8. In order to extract qualitative information, the impedance spectra are fitted using the modified Randles equivalent circuit presented in Fig. 4. According to the above-mentioned equivalent circuit, an excellent agreement between the experimental and simulated curves is obtained for all impedance spectra with χ2 = 0.05.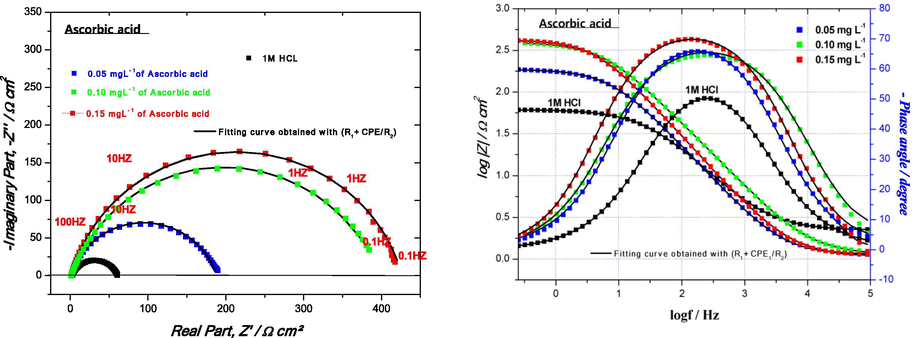
Nyquist and Bode plots of the mild steel in 1 M HCl without and with different concentrations of ascorbic acid at 298 K by Rs + CPE/Rct.
As shown in Fig. 8, the impedance spectra of mild steel recorded in uninhibited as well as in inhibited media show only one depressed capacitive loop, which is generally associated to the charge transfer process. The depression in the impedance plots is characteristic of solid electrodes and is usually ascribed to frequency dispersion which is attributed to the heterogeneity of the metal surface, which results from surface roughness due to the corrosion process, impurities, and dislocations and also from the adsorption of inhibitors (Beniken et al., 2018). As a consequence, in this case the impedance behavior of the electric double layer is better described by a constant phase element (CPE) instead of a pure double layer capacitor Cdl for more accurately fit of the experimental data set. Moreover, the addition of ascorbic acid to the corrosion medium leads to an increase in size of the semicircle with increase of the inhibitor concentration indicating an increase in corrosion resistance, accordingly the inhibiting effect increases as well. The corresponding EIS parameters such as Rs, Rct, Cdl, n, and ɳEIS% obtained by fitting the experimental data are illustrated in Table 8. where Cinh in (mg L−1), Rs&Rct in (Ω cm2), Q in (µF sn−1 cm−2), Cdl in (µF cm−2).
Cinh
Rs
Rct
Qdl
ndl
Cdl
χ2
ηEIS %
Blank
1 M HCl
1.14
58.7
373.3
0.767
118.8
0.011
–
Ascorbic acid
0.05
1.13
186.5
261.2
0.790
136.8
0.05
68.11
0.10
1.14
398.3
181.7
0.823
110.8
0.08
85.06
0.15
1.11
425.3
167.7
0.838
82.2
0.07
86.01
It can be seen from Table 8 that the addition of ascorbic acid increases the values of charge transfer resistance (425 Ω cm2 at 0.15 mg L−1). This behavior can be due to the formation of a protective layer on the metal surface which prevents further corrosion of mild steel. Furthermore, the adsorption of inhibitor onto the mild steel surface leads to a decrease in its double layer capacitance Cdl values, which can be attributed to an increase in thickness of the double layer (Bentiss et al., 2005). Also, it is to be noted that the addition of ascorbic acid leads to decrease in n values when compared to that obtained in uninhibited solution; which can be explained by an increase of the initial surface heterogeneity resulting from the adsorption of inhibitor molecules on the metal surface.
Thus the presence of a pure antioxidant leads to an increase in the resistance of the metal against corrosion and consequently the inhibiting efficiency increases thanks to the presence of heteroatoms and functional groups which facilitate adsorption onto the metal surface. Several authors have studied the inhibiting effect of ascorbic acid (Sekine et al., 1988; Fuadi, 2019; Anejjar et al., 2017; Ferreira et al., 2004). This study confirms the correlation obtained between the antioxidant activity of the n-butanolic fraction and the inhibition efficiency of the same fraction mainly due to flavonoids and especially flavone.
3.6 Effect of temperature
The temperature is an important kinetic factor that impacts the inhibition efficiency and can modify the adsorption of inhibitor onto the electrode surface. In order to study the effect of this parameter on corrosion inhibition characteristics, the experiments are conducted by EIS in the range of temperature 298–333 K in the absence and the presence of BF at 0.15 g L−1 in 1 M HCl as shown in Fig. 9 (a, b). It should be noted that a good correlation between the experimental and simulated data is obtained by the circuit (Re + CPE1/(Rf + CPE2/Rct) previously adopted for BF inhibitor, which perfectly attests to the existence of two relaxation phenomena in the operated frequency domain.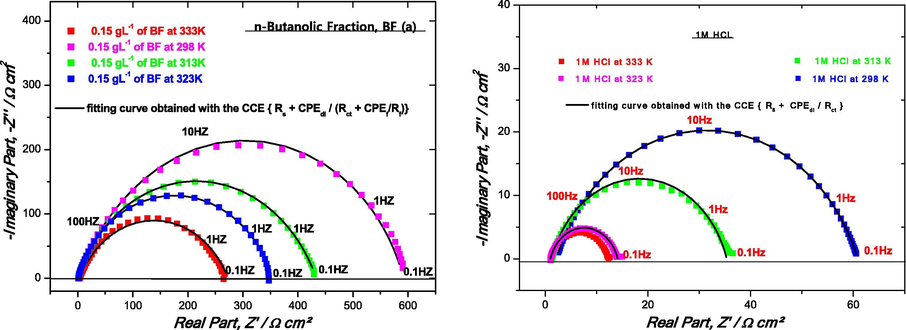
Nyquist (a, b) diagrams for mild steel in 1 M HCl solution at different temperatures in the presence (a) and absence (b) of 0.15 g L−1 of BF.
The electrochemical parameters deduced from the impedance spectra are summarized in Table 9. where Rf, Rct, RP and Rs in Ω cm−2, Qf and Qdl in μF sn−1 cm−2, Cdl in μF cm−2.
Cinh
Rs
Rct
Qdl
ndl
Cdl
Rf
Qf
nf
Cf
RP
ɳEIS%
Blank
298
1.14
58
373
0.769
118.8
–
–
–
–
58
–
313
1.28
34
450
0.760
120.2
–
–
–
–
34
–
323
1.01
13
604
0.757
127.8
–
–
–
–
13
–
333
1.23
11
690
0.752
138.4
–
–
–
–
11
–
BF
298
1.31
150
50
0.876
–
440
90
0.743
29.62
590
90.05
313
1.27
66
41
0.861
–
388
136
0.672
31.71
454
87.22
323
1.10
55
65
0.849
–
299
148
0.670
32.17
354
83.61
333
3.39
45
65
0.843
–
224
185
0.666
37.59
269
78.43
From these results, we note the important diminution of (Rct = RP) and Rf values when the temperature of blank solution increases and enhances the Cdl, Qf and Qdl values both in uninhibited and inhibited solutions. In the presence of the tested inhibitor, the dissolution of mild steel is extensively retarded. The inhibition efficiencies are found to decrease with increasing solution temperature from 298 to 323 K. This behavior can be interpreted on the basis of inhibitor desorption from the mild steel surface.
The values of activation energy Ea are estimated using Arrhenius Equation (4):
Since the corrosion rate is inversely proportional to RP, the values of ln (1/RP) and ln(RP*T)−1 are plotted as a function of 1000/T in Fig. 10 (a, b) for the mild steel corrosion in 1 M HCl solutions in the absence and presence of BF at 0.15 g L−1.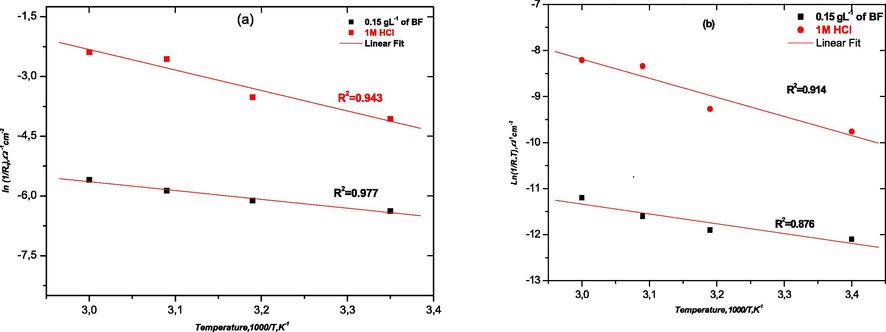
Arrhenius plots of mild steel obtained in 1 M HCl in the absence (a) and presence of 0.15 g L−1 of BF (b).
The kinetic parameters such as enthalpy and entropy of dissolution process may also be evaluated from the temperature effect as well as Ea which are listed in Table 10. An alternative formulation of Arrhenius equation is called transition state, given by Eq. (5):
Inhibitor
Ea/kJ mol−1
/kJ mol−1
/J K−1 mol−1
Blank
42.6
34.40
−162.07
BF
18.4
17.70
−238.40
The activation energy value in the presence of 0.15 g L−1 of BF is lower than the one in uninhibited solution. The decrease of Ea in the presence of BF indicates the easier adsorption of flavonoids especially flavone on mild steel surface. Indeed, the lowered Ea in inhibited systems when compared to the blank has been reported to be indicative of chemical adsorption mechanism (Abdel-Gaber et al., 2006).
Moreover, the positive sign of the enthalpy in the absence and presence of inhibitor reflects the endothermic nature of the metal dissolution process, which suggests the slow dissolution of mild steel. The entropy of activation in the absence and presence of the inhibitor are largely negative. This indicates that the activated complex in the rate determining step represents an association rather than a dissociation step, meaning that, a decrease in disordering is taking place on going from reactants to the activated complex.
3.7 Adsorption isotherms
The study of isotherms describing the type of adsorption of a corrosion inhibitor is of paramount importance, as it can provide important clues about the nature of the metal-inhibitor interaction, the Langmuir, Temkin, El-Awady and Freundlich models were then tested to select the most suitable isotherm to model the adsorption of inhibitor on mild steel. The linearized equation of the above models is described in Table 11.
Isotherm
Conventional form
Linearized form
Langmuir
Temkin
El-Awady
Freundlich
The values of θ corresponding to different values of flavone at 298 K are determined from electrochemical impedance spectroscopy θEIS according to Eq. (6).
The standard free energy of adsorption, ΔG°ads was calculated according to Eq. (7):
Fig. 11 illustrates the graphical representation of the linear equations of the different isotherms tested and their correlation factors.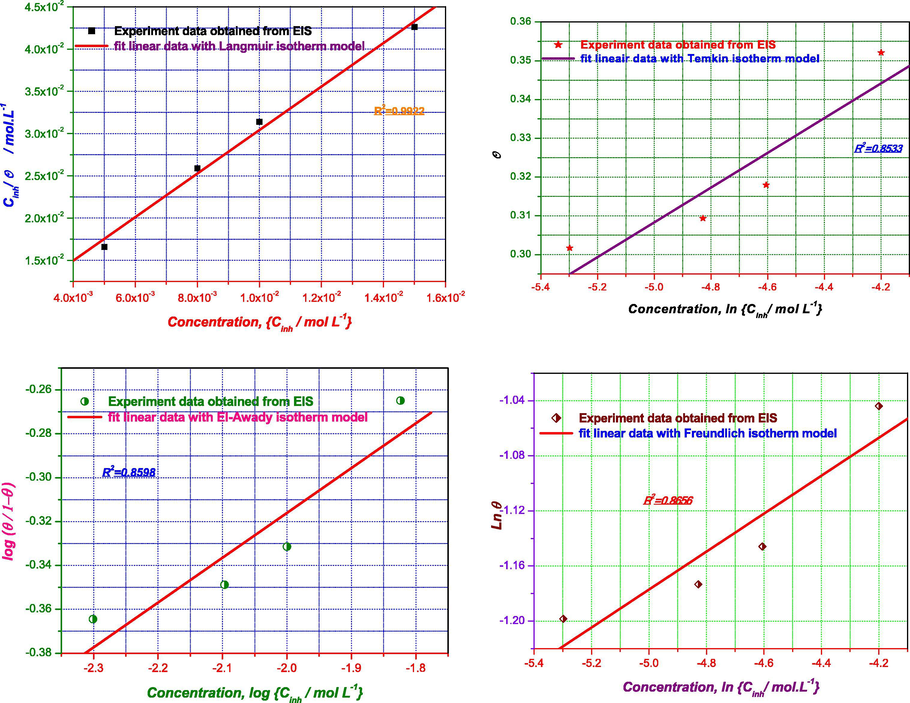
Plots of the adsorption isotherm models of flavone for mild steel surface in 1 M HCl at 298 K obtained from EIS data.
The adsorption parameters deduced from the undertaken isotherms are recorded in Table 12.
Isotherm
Kads/L mol−1
ΔG°ads/kJ mol−1
R2
p-value
Isotherm property
Langmuir
2.14 102
−23.20
0.9922
0.0038
Slope
2.57
Temkin
1.44 105
−39.40
0.8533
0.0762
a
−11.20
El-Awady
2.84 100
−38.10
0.8598
0.0727
1/y
4.90
Freundlich
6.13 10−1
−8.74
0.8656
0.0696
q
0.13
Examination of Table 12 shows that both the R2 coefficient of determination and the p-value are acceptable and it appears that the Langmuir isotherm is suitable to explain the mode of adsorption of flavone molecules. Nevertheless, the slope of the corresponding curve is far from being unitary. Therefore, the Langmuir model cannot be used to explain the mode of adsorption.
Moreover, the statistical parameters resulting from the application of the Temkin, El Awady and Freundlich models (R2, p-value) are respectively of the order of 0.85 and > to 0.05. Thus, any interpretation of thermodynamic quantities such as these isotherms is automatically meaningless. As a result, the different isotherms considered in the present study are unable to describe the mechanism of adsorption of flavone molecules on the mild steel surface.
3.8 Overview on antioxidant and anticorrosion activities of Zea mays
The valorization of various extracts of Z. mays hairs in both antioxidant and anticorrosive activities has been undertaken by several researchers (Andrews and Kwofie, 2010; Nurraihana et al., 2018; Ayah et al., 2018; Orubite et al., 2017; Zhang et al., 2015; Bani-Hani, 2017; Rehan, 2003). However, neither fractionation of phenolic compounds issued from Z. mays plant nor study of the behavior of the major component, as corrosion inhibitor, were reported in the literature. Table 13 collects the inhibiting efficiencies of extracts, derived from weight loss corrosion tests, at the optimum concentration, on different materials matrix, in acidic media as well as the IC50 values derived from DPPH• method.
Extract
Metal Matrix
Studied Method
Factor
Corrosive medium
Optimum concentration
Inhibition efficiency
Extraction method
Part of plant
IC50
Ref.
Electrolyte of Maize
CAEL and NULUX
–
pH, Mass loss
–
–
–
–
–
-
(Andrews and Kwofie, 2010)
Hexane Ethyl acetate fraction
–
–
Temperature, Solvent to material ratio, Solvent, Extraction time
–
–
–
Ultrasound
–
12.86% 83.89%
(Nurraihana and Wan Rosli, 2018)
Methanolic Aqueous
Mild steel
Weight loss
Temperature
0.5 M HCl
0.5 (w/v)
95.07% 79.43%
Soxhlet Decoction
Aerial
–
(Ayah et al., 2018)
Water extract
Mild steel
Weight loss (AAS) Analysis
Temperature Immersion time
0.1 M HCl
20% (v/v)
77.7%
Decoction
Aerial
–
(Orubite et al., 2017)
Polysacharides derivatives (ETAPS-EMPZPS-CPPD)
Mild steel
Weight loss PP EIS
Temperature
1 M HCl
2 g/L
48.8% 64.7% 59.1%
Synthesis
–
–
(Zhang et al., 2015)
Water extract (date palm, phoenix dactylifera, henna, Lawsonia inermis , and corn, Zea mays)
Steel Aluminum, Copper Brass
Weight loss
NaCl NaOH
–
–
–
Leaves
–
(Bani-Hani, 2017)
The study brought by Andrews and Kwofie (2010); treats the corrosion rate of the two plates named CAEL, and NULUX in an electrolyte prepared from Maize with pH variation. The results show that the average corrosion rate was higher in CAEL than in NULUX during the exposure period and that the corrosion rate is influenced by the pH variation. However, in the present study, the effect of mild steel corrosion is undertaken in 1 M HCl immersed for 30 min in a solution of hydro-ethanolic, n-butanolic and flavone extracts.
The study provided by Nurraihana et al. (2018) aims to optimize the phenolic extraction of corn silk and to identify the phenolic compounds issued from fractionation by experimental design. The results show that the optimal conditions were 30 min extraction time, an extraction temperature of 50 °C, a solid-solvent ratio of 1:10 and 40% ethanol). In this study the ethyl acetate fraction was found to be richer in flavonoids and had the highest free radical scavenging activity and the highest amount of phenolic compounds. However, in this study, we are interested by the determination of the antioxidant activity of different fractions and to define the family of molecules responsible for the inhibiting action on mild steel.
The study developed by Ayah et al. (2018) shows that the methanolic and aqueous extracts have a maximum efficiency of 95.07% and 79.43% at a concentration of 0.5 (w/v) at 313 K. Adsorption on the metallic surface is done by the physisorption mechanism. While, our study shows that the maximum efficiency of the n-butanolic fraction was reached at a temperature of 298 K and that the inhibitory efficiency decreases with increasing temperature as well as the adsorption of the active molecules follows the chemisorption mechanism.
Orubite et al. (2017) have studied the inhibiting efficiency of the water extract of Z. mays, extracted by the decoction method on the corrosion of mild steel in a 0.5 M HCl solution. The results show that the maximum of inhibition reached only 77.7% and was achieved at a concentration of 20% (v/v) at 303 K by the weight loss method. The thermodynamic parameters show that the adsorption of molecules on the metal surface followed the Langmuir isotherm. Indeed, no study has been carried out on the extraction yields and biological activity of the aqueous extract as well as the anticorrosion activity of the molecules responsible for corrosion. On the other hand, this study treats the anticorrosion activity of the hydro-ethanolic extract, the n-butanolic fraction and a synthesized molecule (flavone) in order to determine the molecules responsible for the corrosion inhibition of mild steel in a 1 M HCl solution. Therefore, the present study presents a comparative study between the two extraction methods, a fractionation of the polyphenols and then an analysis of the antioxidant activity of the different fractions.
Zhang et al. (2015) studied polysacharide derivatives synthesized as corrosion inhibitors for mild steel in 1 M HCl. The results suggest that the inhibitors were mixed inhibitors with predominantly anodic inhibition and that the adsorption process followed the Langmuir isotherm adsorption model. However, in this work, we studied the inhibitory effect of a synthesized molecule (flavone) to determine the family of molecules responsible for the inhibitory action of the hydro-ethanolic extract of Z. mays. Bani-Hani (2017), has studied the recovery of agricultural waste in several areas e.g. cement brick manufacture, energy production, use in water and wastewater treatment as adsorbent, fertilizers, animal feed stocks, and extraction of industrial chemicals for huge and important applications such as corrosion inhibitors. This study aims to value Z. mays hair as a mild steel corrosion inhibitor and as an antioxidant. Rehan (2003), was interested by the inhibitory effect of the aqueous extract of several plants on the corrosion of four metals in sodium chloride and hydroxide. The results show that the aqueous extract of Z. mays has minimal efficiency when compared to other plants. Whereas, in this study, we presented an in-depth study on corrosion inhibition by the hydro-ethanolic extract.
In summary, this study aimed to make a comparative study between two extraction methods (Soxhlet and ultrasounds) of Z. mays hair by three solvents and then to target the solvent that extracts polyphenols well to make the fractionation of polyphenols (flavonoids). Then we performed a quantitative analysis and antioxidant activity for different fractions to determine which one is rich by active molecules. Then, the study of the corrosion inhibiting effect was carried out on the hydro-ethanolic, n-butanolic and flavone extracts for mild steel in 1 M HCl medium by electrochemical methods (PP, EIS). We studied the inhibitory effect of n-butanolic to determine the family of molecules responsible for the inhibitory action of the hydro-ethanolic extract of Z. mays, while the study of the effect of flavone aims to determine the adsorption mechanism on the mild steel surface. The thermodynamic study showed that the adsorption occurs according to the chemisorption mechanism and that the adsorption mechanism does not follow any isotherm model. Finally, this study aimed to correlate the antioxidant activity with the anticorrosion activity while the other studies did not address this issue.
4 Conclusion
In this study, we proved that ultrasound extraction allows a better extraction of phenolic compounds when compared to soxhlet extraction. Furthermore, the solvent ethanol:water (70:30) remains the best solvent to extract phenolic compounds compared to the other tested solvents. The process of fractionation of flavonoids from the hydro-ethanolic extract (ultrasound) shows that the n-butanolic fraction is rich of polyphenols, especially flavone according to HPLC, and that only ensures a better antioxidant activity compared to the other fractions. Electrochemical studies of the hydro-ethanolic extract (ultrasound) show that the inhibiting efficiency increases with rise of concentration, and that this inhibiting action is due to flavonoids, especially flavone. Also the results showed that there is a correlation between antioxidant and anticorrosive activities of n-butanolic fraction. Neither Langmuir's ideal hypothetical model nor the chosen non-ideal models (Temkin, El Awady, Freundlich) are able to explain the mode of adsorption of flavone molecules on the matrix surface of mild steel.
Declaration of Competing Interest
The authors declare that they have no known competing financial interests or personal relationships that could have appeared to influence the work reported in this paper.
References
- Corros. Sci.. 2006;48:2765.
- Mor. J. Chem.. 2018;6(1):1-13.
- Leonardo El J. Pract. Technol.. 2010;7:97.
- Appl. J. Envi. Eng. Sci.. 2017;3 ISSN: 2509-2065
- Anal. Bioanal. Electrochem.. 2018;10:912.
- Int. J. Electrochem. Sci.. 2019;14:6376.
- Food Chem.. 2007;104:21.
- J. Appl. Sci. Environ. Manage. 2018;22:439.
- Mol Pain. 2013;9:53.
- J. Ind. Pol. Cont. 2017;33:1622.
- Der Pharma Chem.. 2012;4:1496.
- Mor. J. Chem.. 2020;8(2):552-559.
- J. Bio. Tribo. Corros.. 2018;4:34.
- Corros. Sci.. 2004;46:2781.
- Corros. Sci.. 2005;47:2915.
- J. Chrom A.. 2011;1218:2505.
- Food Chem.. 2008;109:426.
- J. Electroanal. Chem. Interfacial Electrochem.. 1984;176:275.
- J. Food Drug Anal.. 2002;10:178.
- Int. J. Mol. Sci.. 2012;13:8615.
- Corros. Sci.. 2006;48:2987.
- Chin. J. Chem. Eng.. 2019;27:717.
- Int. J. Electrochem. Sci.. 2010;5:1060.
- Dariva, C.G., Galio, A.F., 2014. Mechanisms and Applications. Chapter 16, 365.
- Bull. Soc. Pharm.. 2003;142:61.
- Corros. Sci.. 2015;98:541.
- RSC Adv.. 2017;7:4580.
- Free Radic. Biol. Med.. 1996;20:933.
- Mater. Chem. Phys.. 2004;83:129.
- Hort. Envi. Biot.. 2012;53:116.
- Bioresour. Technol.. 2008;99:4484.
- Jennan, S., 2015. Thèse de doctorat en chimie, Université Sidi Mohamed Ben Abdellah - Fez Morocco.
- Corros. Sci.. 2011;53:569.
- J. King. Saud. Univ. Sci.. 2019;31:322.
- Wood Sci. Technol.. 1986;20:369.
- Food Chem.. 2007;104:1214.
- J. Appl. Electrochem.. 2008;38:289.
- J. Food Drug Anal.. 2008;16:73.
- Food Chem.. 2007;102:732.
- Electrochem. Acta. 2003;48:845.
- Fitoterapia. 2003;74:44.
- Sep. Puri. Tech.. 2007;52:487.
- J. Food Eng.. 2010;96:533.
- Newal, C.A., Anderson, L.A., Phillipson, J.D., 1996. Herbal medicines. A guide for health-care professionals, Pharmaceutical Press, London.
- J. Food Meas. Charact. 2018
- [CrossRef]
- IOSR J. Appl. Chem.. 2017;10:51.
- Jpn. J. Nutr.. 1986;44:307.
- Soã Paulo 1997
- Studio Editorial, Milan 1980
- Pharm. Biol.. 2011;49:240.
- Corros. Sci.. 2007;49:2144.
- Anal. Biochem.. 1999;269:337.
- Corros. Sci.. 2013;75:184.
- Materialwissenschaft und Werkstofftechnik. 2003;34:232.
- J. Food Comp. Anal.. 2009;22:546.
- Z Naturforsch.. 2001;56:973.
- J. Anal. Chem.. 2004;59:1032.
- Ultrason. Sonochem. 2004;11:415.
- Corros. Sci.. 1988;28:987.
- Mor. J. Chem.. 2018;6(2):342-353.
- J. Mol. Liq.. 2016;216:164.
- Int. Food Res. J.. 2012;19:1533.
- Molecules. 2009;14:2167.
- Int. Food Res. J.. 2013;20:1103.
- Phytomedicine. 2005;12:363.
- Desalination. 2015;372:57.
- Innov. Food Sci. Emerg. Techn.. 2009;10:54.


