

Translate this page into:
Visible light driven photocatalytic activity of ZnO/CuO nanocomposites coupled with rGO heterostructures synthesized by solid-state method for RhB dye degradation
⁎Corresponding author. krmurthin@yahoo.co.in (K. Ramamurthi)
-
Received: ,
Accepted: ,
This article was originally published by Elsevier and was migrated to Scientific Scholar after the change of Publisher.
Peer review under responsibility of King Saud University.
Abstract
Metal oxide frame works along with carbon materials have been attracting tremendous attention of researches as the potential materials for energy and environmental remediation. In the present work heterostructures of (ZnO/CuO)/rGO ternary nanocomposites were synthesized by solid-state method. The crystalline structure of the nanoparticles was obtained from the XRD analysis. Optical band gap of the ZnO nanoparticles (3.1 eV) is tuned to 2.8 eV in the synthesized (ZnO/CuO)/rGO ternary nanocomposites. Field emission scanning electron microscope images of the (ZnO/CuO)/rGO ternary nanocomposites revealed formation of well-developed flowers like morphology of (ZnO/CuO) nanoparticles on rGO sheets. Photoluminescence spectroscopy analysis of (ZnO/CuO)/rGO ternary nanocomposites show enhancement in the electron-hole pair separation and thereby diminishing electron-hole pairs recombination rates effectively. In the present work, the photocatalytic activity of the ZC3G15 ternary nanocomposites show 99% and 93% of degradation efficiency respectively against RhB dye and 4-chlorophenol for 20 min under visible light irradiation. Thus, the simple solid-state method provides the effective ternary nanocomposites heterostructures light harvesting material for energy and environmental remediation.
Keywords
Powders: solid state reaction
Nanocomposites
X-ray methods
Optical properties
Reduced graphene oxide
Photocatalytic activity

1 Introduction
During the last two decades textiles and other industries have been releasing diversified hazardous water pollutants into aquatic environment and this issue has gained importance due to the concern over the rapid global climate changes (Ayrault et al., 2014; Belenguera et al., 2014; Trenberth et al., 2014). Several methods have been used to treat polluted water such as filtration, adsorption and incineration techniques but they cannot completely degrade the organic pollutants (Khin et al., 2012). Recently, nanotechnology based photocatalyst processes are proved to be efficient, economical and environmentally friendly in removing organic pollutants from water using abundantly available solar light irradiation (Li et al., 2018; Gong et al., 2018; Qian et al., 2018; Tong et al., 2012). During the photocatalytic reaction oxidation of organic pollutants is accelerated by the presence of a catalyst (Safardoust-Hojaghan and Salavati-Niasari, 2017; Shi et al., 2017). Semiconducting metal oxides nanoparticles are proved as suitable candidates for photocatalytic applications since the electron-hole pairs created in this process degrade the dye molecules (Khin et al., 2012). Hence, researchers have been interested in synthesizing various semiconducting nanoparticles and composite materials with controllable morphology, particle size, and crystal-facets which play a major role in improving the catalytic properties for energy (Sheng et al., 2019; Zhang et al., 2017; Song et al., 2017; Antony et al., 2018; Kirubasankar et al., 2018; Idrees et al., 2019; Wang et al., 2018; Liu et al., 2018) and environmental remediation (Djurisic et al., 2014; Seker et al., 2000; Sanchez et al., 2011 ). Many surfactants such as stearic acid, N-Cetyl-N,N,N-trimethylammonium bromide (CTAB), triton X-100, sodium dodecylsulphate (SDS) are used to control the nanoparticles size and morphology. However, Vidyasagar and Arthoba Naik (2016), reported that the PEG possessing uniformly ordered chain structures [H—(O—CH2—CH2)n—OH] is easily absorbed at the surface of metal oxide colloids and confine the growth rate in certain facets. Further, the growth rate of the colloids in certain facet will be confined. Hence in the present work PEG 400 is used as a size controlling agent.
The n-type ZnO nanoparticles, possess a direct band gap of ∼3.7 eV and large exciton binding energy (60 meV) at room temperature (Chen et al., 2012; Zawadzka et al., 2014). The ZnO properties showing anisotropic growth, high electron mobility and the possibility for tuning the morphology (Karunakaran and Vinayagamoorthy, 2017; Al-Mayman et al., 2017) make it a promising candidate for photocatalysis (Lu et al., 2011), gas sensing (Fan et al., 2014) and dye sensitized solar cells (Qiu et al., 2010) applications. Irradiation of UV light (about 10% of the total solar spectrum) excites the electrons from the wide band gap ZnO (Linsebigler et al., 1995). However the ZnO nanoparticles restrict the photocatalytic efficiency due to the fast recombination rates of the photogenerated electron-hole pairs (Zhou et al., 2014). Hence, in this work efforts have been taken to improve the photocatalytic activities of ZnO nanoparticles under the visible light irradiation by tuning its band gap from ultraviolet to visible region and reducing the recombination rates of photogenerated electron-hole pairs. Recently, researchers are interested in synthesizing metal oxides nanocomposites using different types of semiconductors to effectively separate the charge carriers (electron-hole pairs) by modifying their chemical and electrical properties (Rolison, 2003; Arai et al., 2007). Thus the studies on the preparation of ZnO based nanocomposites show tuning the band gap from ultraviolet to visible region, effectively enhances the charge carrier separation and the photocatalytic activity (Zhang et al., 2012; Wei et al., 2013).
The CuO, a p-type semiconductor, possesses direct band gap in the range of about 1.2–1.79 eV (Mageshwari et al., 2015; Chen et al., 2014; Chtouki et al., 2019) and due to its narrow band gap, CuO is used as a co-catalyst with ZnO (Zhang et al., 2012; Wei et al., 2013) in order to enhance the photocatalytic activity under sun light irradiation (Qamar et al., 2015). Chabri et al. (2016) reported that the ZnO/CuO nanocomposites significantly reduced the recombination rates and enhanced photocatalytic activity. Hassanpour et al. (2017), reported that the hollow CuO/ZnO spherical nanocomposites synthesized by microwave method showed degradation of 41% and 73% respectively against rhodamine B (RhB) and methylene blue (MB) dyes for 120 min under the UV light irradiation. Li and Wang (2010) reported that the nanostructured ZnO-CuO composites, prepared through a simple one-step homogeneous co-precipitation method under low temperature (80 °C), without using any organic solvents or surfactants, shows ∼97% of RhB dye degradation under the simulated sunlight from a 300 W Xe lamp for a time period of 120 min. Zhang et al. (2012) reported that the ZnO and ZnO-CuO composites hollow spheres fabricated using colloidal carbon spheres as templates show 98% degradation efficiency of MB under the 800 W Xe-arc lamp for a time period of 90 min.
Nevertheless, the ZnO/CuO nanocomposites also suffer from the electron-hole pair recombination rates. To overcome the electron-hole pair recombination rates in order to enhancing the degradation efficiency of the ZnO/CuO binary nanocomposites we used reduced graphene oxide (rGO) to form the (ZnO/CuO)/rGO ternary nanocomposites. rGO is one of the members of the carbon family 2D one atom thick monolayer of sp2 bonded carbon atoms which shows high thermal conductivity, electron mobility (2 × 105 cm2 V−1 s−1) and specific surface area of 2965 m2 g−1 (Marcano et al., 2010; Tien et al., 2013) when compared with that of the other carbon structures of multiwall carbon nanotubes and fullerene (Zhao et al., 2019; Yang et al., 2019). rGO is a supporting material for metal oxides and forms hybrid nanocomposites in order to suppress the electron-hole pairs recombination. Hence, researchers are interested in preparing semiconducting metal oxides nanocomposites with rGO to enhance the electron transport rates and prevent charge recombination rates which in turn are useful to enhance the degradation efficiency of the catalysts. Hsieh and Ting (2018) reported that the novel ternary nanocomposites of Cu-doped ZnO/reduced graphene oxide (1.25Cu—ZnO-G10) prepared by microwave-assisted hydrothermal method show 93% and 98% of methylene blue degradation for a time period of 120 min under UV (40 W) and solar simulator (300 W) irradiations respectively. Therefore studies to improve the photocatalytic efficiency of (ZnO/CuO)/rGO nanocomposites under the visible light irradiation would be encouraging as the visible portion of sun light is relatively larger when compare with that of UV portion. Therefore systematic investigations on tuning the band gap of ZnO by preparing (ZnO/CuO)/rGO ternary nanocomposites to enhance the photocatalytic activity is essential. Hence, in the present work synthesis of ZnO/CuO binary nanocomposites photocatalyst with flower like 3D morphology, composed of ZnO nanorods integrated with CuO nanoparticles, is reported by a simple one-step polyethylene glycol 400 (PEG 400) assisted solid-state synthesis method. Further, the synthesis of (ZnO/CuO)/rGO ternary nanocomposites heterostructures by solid-state method and their structural, optical and morphological properties and the photocatalytic activity against RhB dye under the visible light irradiation are reported.
2 Materials and methods
2.1 Materials
Analytical reagent grade zinc acetate dihydrate (Zn (CH3COO)2·2H2O), copper (II) acetate monohydrate (Cu (CH3COO)2·H2O), sodium hydroxide (NaOH), polyethylene glycol 400 (PEG 400), graphite powder, potassium permanganate (KMnO4), concentrated hydrochloric acid (HCl), concentrated sulfuric acid (H2SO4) and phosphoric acid (H3PO4), hydrogen peroxide (H2O2) and hydrazine hydrate (H6N2O) were purchased from Sisco Research Laboratories Pvt. Ltd. – India and were used without further purification.
2.2 Synthesis of graphene oxide and reduced graphene oxide
Graphene oxide (GO) was synthesized following the improved method (Marcano et al., 2010). In a typical synthesis process concentrated H2SO4 (360 mL) and concentrated H3PO4 (40 mL) were mixed properly under vigorous stirring and then 3 g of graphite powder was added slowly to the solution and the solution was continuously stirred for 3 h. Subsequently KMnO4 (18 g) ground properly was slowly added to the solution under vigorous stirring and then the solution was continuously stirred for 12 h at 50 °C using a hot plate magnetic stirrer. During this reaction process the solution color was changed from dark purple to green and then to dark brown. Further the dark brown solution was poured into a beaker of 400 mL capacity kept with ice bar. Subsequently 3 mL of H2O2 was added to this solution and stirred for 2 h. Residue particles collected were washed with HCl for three times and further washed with ethanol and distilled water for several times. These particles were dried at 60 °C in a hot air oven which yielded GO. Further rGO was prepared by chemical reduction method (Tien et al., 2013). In a typical synthesis method, prepared GO (0.1 g) was dispersed in distilled water (93 mL) and 7 mL of hydrazine hydrate was added to the GO solution under vigorous stirring. Then the solution was transferred to Teflon-lined stainless steel autoclave and the autoclave was heated at 180 °C for 12 h in a muffle furnace. Further the residue particles were washed several times with distilled water and ethanol. Then the residue particles were collected and dried at 50 °C for 24 h in a hot air oven. The resultant powder was used for further studies.
2.3 Synthesis of ZnO and CuO nanoparticles
ZnO and CuO nanoparticles were prepared by solid state synthesis method. To prepare the ZnO nanoparticles, zinc acetate dihydrate (2 g) and sodium hydroxide (2 g) were separately ground for five minutes and were mixed together with 5 mL of polyethylene glycol 400 (PEG 400). Further it was ground for 30 min. The resultant colloidal form of particles were washed with distilled water and ethanol for several times and then dried at 60 °C for 12 h. Further the dried particles were annealed at 350 °C for 3 h. Synthesis steps as explained above were adopted to prepare the CuO nanoparticles by solid state method; in this process copper acetate monohydrate (2 g) was used as the precursor salt.
2.4 Synthesis of ZnO/CuO binary and (ZnO/CuO)/rGO ternary nanocomposites
The ZnO/CuO binary nanocomposites were prepared by solid state method. In a typical synthesis process, 2 g of zinc acetate dihydrate and 2 g of sodium hydroxide were separately ground for five minutes and were mixed together with 5 mL of PEG 400. Further it was ground for 30 min. Subsequently, copper acetate monohydrate (15.7 mg) was added to this and ground for 30 min. Then the resultant colloidal form of particles were washed with distilled water and ethanol for several times and then dried at 60 °C for 12 h. Further the dried particles were annealed at 350 °C for 3 h and the sample is named as ZC1. The above synthesis process was followed but the amount of copper acetate monohydrate was changed to 31.4 mg and 62.8 mg in separate experiments and the final products of ZnO/CuO binary nanocomposites obtained in the separate experiments are named as ZC2 and ZC3 respectively.
The ZC3 binary nanocomposites possessing a direct optical band gap of 2.9 eV show enhanced degradation efficiency. Hence, (ZnO/CuO)/rGO ternary nanocomposites were synthesized by employing the solid state method. In the synthesis process, 2 g of zinc acetate dihydrate and 2 g of sodium hydroxide were separately ground for five minutes and were mixed together with 5 mL of PEG 400. Further it was ground for 30 min. Subsequently, copper acetate monohydrate (62.8 mg) was added and ground for 30 min. Further, 5 mg, 10 mg, 15 mg and 20 mg of rGO were added in the colloidal in separate experiments and ground for 30 min to mix the rGO uniformly. Then the resultant colloidal form of particles were washed with distilled water and ethanol for several times and then dried at 60 °C for 12 h. Then dried particles were annealed at 350 °C for 3 h. The samples prepared from 5, 10, 15 and 20 mg of rGO adding with ZC3 are named as ZC3G5, ZC3G10, ZC3G15 and ZC3G20 respectively.
2.5 Characterization
The X-ray diffraction technique (PANalytical’s X’Pert Pro with Cu Kα radiation) was used to investigate structural properties. Field Emission Scanning Electron Microscopy and Energy Dispersive X-ray analysis (FEI Quanta FEG200) were employed respectively to study the surface morphology and elemental composition of synthesized samples. The crystalline nature was confirmed by high resolution transmission electron microscopy (PHILIPS, model-CM200, operated at a 200 kV accelerating voltage). X-ray photoelectron spectroscopy (XPS) was carried out to investigate the electronic environment and valence states of elements in nanocomposite (PHI 5000 versa probe UL VAC instrument). Absorption properties of the samples were measured by UV–Vis spectroscopy analysis in Diffuse Reflectance Spectral (DRS) mode (Shimadzu, UV-2600 spectrophotometer). Structure, crystallinity and defects of the synthesized nanoparticles were analyzed by Renishaw (UK) In Via Raman microscope with the incident wavelength of 633 nm from He-Ne Laser. The electron-hole pairs separation capacity of the synthesized nanoparticles was obtained by photoluminescence spectra recorded from Model S4 PIONEER BRUKER spectrometer (excitation wavelength of the sample is about λ = 360 nm). Quantachrome Nova-1000 surface analyzer was used to analyze the surface area, pore size, and pore volume of the synthesized nanoparticles.
2.6 Photocatalytic activity test
Photocatalytic activity of the synthesized ZnO and CuO nanoparticles and ZnO/CuO binary and (ZnO/CuO)/rGO ternary nanocomposites was tested against Rhodamine B (RhB) dye aqueous solution. The degradation experiments were carried out employing immersion type photoreactor constructed by a double layer quartz tube container. Photocatalytic activity was carried out using 150 W (Heber Scientific Suppliers) tungsten lamp (λ > 400 nm) and the radiation intensity measured by lux meter was ∼23000 lx. The aqua RhB dye solution (100 mL; 5 ppm) was prepared and the absorption spectrum recorded using UV–visible spectrometer showed maximum absorption intensity at 554 nm. Then the synthesized sample (0.1 g) was added to the RhB dye solution and the solution was continuously stirred for 30 min under dark conditions to analyze the adsorption and desorption equilibrium between the catalyst and RhB dye. The synthesized samples (0.1 g) were added in the separate experiments with the aqua RhB dye solution (100 mL; 5 ppm) and was continuously stirred for 20 min under the visible light irradiation and at every 5 min interval UV–visible absorption spectrum was recorded to analyze the degradation efficiency of the catalysts. Photocatalytic degradation percentage (%D) was calculated from the formula %D = ((Co − C)/Co) × 100 where, Co is the initial concentration of the dye solution and C is the concentration of the dye solution at every 5 min interval during the photocatalytic reaction.
3 Results and discussion
3.1 X-ray diffraction analysis
The X-ray diffraction (XRD) pattern of ZnO, CuO, GO and rGO are shown in Fig. 1a. The ZnO nanoparticles show well developed XRD peak at 2θ = 31.74°, 34.43° and 36.23° corresponding to (1 0 0), (0 0 2) and (1 0 1) planes respectively and XRD peak at 2θ = 47.52°, 56.56°, 62.87°, 66.44°, 67.98° and 69.16° due to (1 0 2), (1 1 0), (1 0 3), (2 0 0), (1 1 2) and (2 0 1) planes respectively. The XRD pattern confirm that the synthesized ZnO nanoparticles belong to the hexagonal wurtzite structure (JCPDS data card No. 79-2205). The XRD pattern of CuO nanoparticles show well developed peaks at 2θ = 32.54°, 35.53°, 38.71°, 46.29°, 48.81°, 51.37°, 53.45°, 58.26°, 61.54°, 65.82°, 66.30° and 68.02° due to (1 1 0), ( −1 1 1), (1 1 1), ( −1 1 2), ( −2 0 2), (1 1 2), (0 2 0), (2 0 2), ( −1 1 3) and (0 2 2) planes respectively which confirm monoclinic structure of CuO (JCPDS data card No. 89-2529). The XRD peak observed at 2θ = 10.27° in GO is due to (0 0 1) plane which indicates the presence of oxygen functionalities; the corresponding interlayer spacing obtained from Bragg’s equation (Goswami, 1996) is 0.86 nm. The rGO shows a weak broad XRD peak of (1 0 0) plane centered at 2θ = 25.75° due to the random arrangement of graphene sheets in the rGO (Xiong et al., 2010).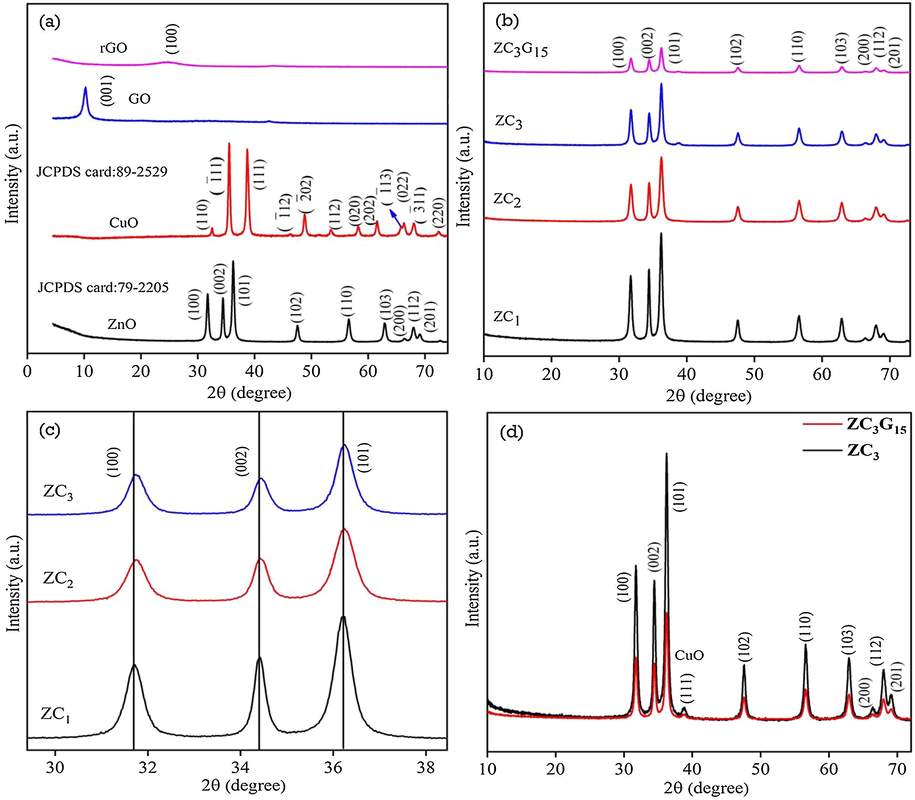
XRD pattern of (a) ZnO, CuO, GO and rGO; (b) ZC1, ZC2, ZC3 binary and ZC3G15 ternary nanocomposite; (c) magnification images of binary nanocomposite; (d) XRD pattern of ZC3 binary and ZC3G15 ternary nanocomposites.
The XRD pattern of ZC1, ZC2 and ZC3 binary nanocomposite and ZC3G15 ternary nanocomposite are shown in Fig. 1b. The XRD peak intensity of ZC2 and ZC3 binary nanocomposites is diminished than that of ZC1 nanocomposites. This may be due to the formation of CuO crystallite arrangement in the binary nanocomposite of ZC3. The ZC3G15 ternary nanocomposites show relatively diminished XRD peak intensity than that of the binary nanocomposites; this may be due to the coupling of binary nanocomposites with rGO sheets which slightly diminished the crystallite arrangement and form the ternary nanocomposites. Further, XRD pattern reveal that the ZC1, ZC2 and ZC3 binary nanocomposites show a slight shift in 2θ of (1 0 0), (0 0 2) and (1 0 1) planes towards higher angle side (Fig. 1c). The XRD pattern of ZC3 binary and ZC3G15 ternary nanocomposites show (Fig. 1d) well developed XRD peaks of ZnO nanoparticles and the small hump observed at 2θ = 38.5° is related to (1 1 1) plane of CuO nanoparticles.
The average crystallite size (D) was calculated using Debye-Scherrer formula,
where λ is the wavelength of X-rays (1.5406 Å), β is the full width at half maximum in radian and θ is the Braggs diffraction angle in degree (Goswami, 1996). The crystallite size of ZnO, binary and ternary nanocomposites was calculated from the (1 0 1) plane and the results are given in Table 1. Pure ZnO nanoparticles show an average crystallite size of 30.4 nm which is increased to 33 nm, 35.5 nm and 37.6 nm for binary nanocomposites of ZC1, ZC2, and ZC3 respectively. The ternary nanocomposites (ZC3G15) show an average crystallite size of 39.6 nm. Lattice constants a = b and c of ZnO and that of the ZnO in (ZnO/CuO) binary and (ZnO/CuO)/rGO ternary nanocomposites were evaluated from (1 0 0) and (0 0 2) planes respectively, using the relation,
and 2dsinθ = nλ (Goswami, 1996) where h, k and l are Miller indices of the planes, d is the interplanner distance and λ (1.5406 Å) is the wavelength of X-rays. The evaluated lattice constant values are presented in Table 1 which agree well with the standard values of ZnO a = b = 3.250 Å and c = 5.207 Å (JCPDS data card No. 79-2205). Further it is evident that the lattice parameters of ZnO in these samples acquire nearly the same values.
Sample name
(1 0 1) plane
a (Å) from (1 0 0) plane
c (Å) from (1 0 1) plane
c/a ratio
2θ (deg)
Intensity (a.u.)
D (nm)
ZnO
36.23
8249
30.35
3.2542
5.2080
1.6003
ZC1
36.24
9025
32.97
3.2592
5.2109
1.5987
ZC2
36.24
5425
35.36
3.2562
5.2109
1.6002
ZC3
36.24
5218
37.64
3.2562
5.2065
1.5989
ZC3G15
36.24
3261
39.59
3.2567
5.2063
1.5986
3.2 X-ray photoelectron spectroscopy analysis
The electronic environment and valence states of elements of ZC3G15 ternary nanocomposite were analyzed by X-ray photoelectron spectrum (XPS) and the results are presented in Fig. 2. The XPS survey spectrum (Fig. 2a) shows distinctive peaks related to zinc, copper, oxygen and carbon which confirm the formation of ZC3G15 ternary nanocomposites. The Zn 2p core spectrum (Fig. 2b) exhibits two peaks at 1022.3 eV and 1045.4 eV which are attributed to the binding energy of Zn 2p3/2 and Zn 2p1/2 respectively (Jo et al., 2016). The XPS spectrum (Fig. 2c) shows the Cu 2p3/2 peak at 943.14 and the Cu 2p1/2 peak at 963.20 eV which are the characteristic peaks of Cu(II) (Senthil Kumar et al., 2017). The O1s spectrum shows two peaks at 531 eV and 532.4 eV due to the oxygen atoms coordinated with Zn atoms and presence of an OH group or a water molecule on the surface of nanocomposites (Jo et al., 2016; Kumar et al., 2014). The C 1s spectrum (Fig. 2e) shows four peaks at 285 eV, 285.9 eV, 286.6 eV and 289. 8 eV which are related to the C—C, C—OH, C⚌O and O—C⚌O respectively (Wu and Ting 2013; Luo et al., 2011; Akhavan, 2010).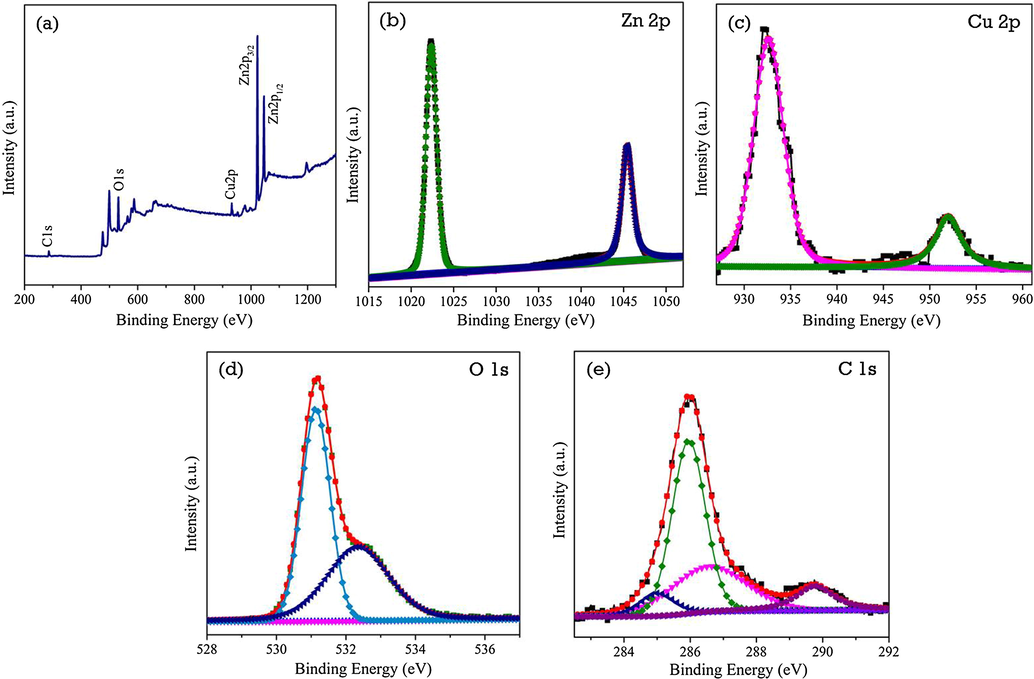
XPS analysis of ZC3G15 ternary nanocomposites (a) survey spectrum; (b) Zn 2p; (b) Cu 2p; (c) O 1s and (e) C 1s core spectra.
3.3 UV–Visible spectroscopy analysis
UV–Visible absorption spectra of the as synthesized nanoparticles were recorded in diffuse reflectance spectral (DRS) mode. Fig. 3a shows the absorption spectra of the synthesized ZnO, CuO (inset Fig. 3a), ZC1, ZC2 and ZC3 of binary nanocomposites and ZC3G15 ternary nanocomposites recorded at room temperature. The binary nanocomposites of ZC1, ZC2 and ZC3 show enhancement in the absorption when compare with that of ZnO nanoparticles in the order of ZC3 > ZC2 > ZC1 > ZnO. The ZC3G15 ternary nanocomposites show enhanced absorption than that of the binary nanocomposites. In the present work the relatively enhanced visible light absorption in the sample ZC3G15 represents the generation of relatively more photo-excited electrons and the possibility to increasing degradation efficiency of RhB dye. The ZnO nanoparticles show absorption edge at 400 nm whereas the absorption edge is shifted to 435 nm and 442 nm in the ZC3 binary and ZC3G15 ternary nanocomposite respectively.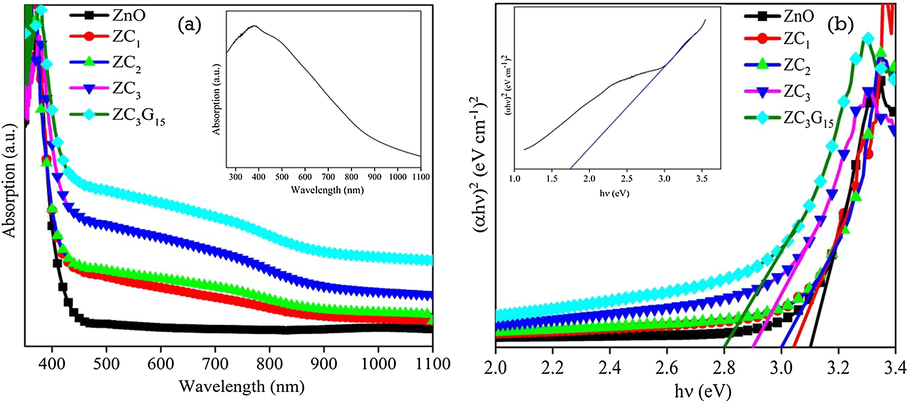
Absorption spectra of (a) ZnO, CuO, binary and ternary nanocomposite; (b) hν vs (αhν)2 plot of ZnO, CuO, binary and ternary nanocomposites.
Fig. 3b shows the direct optical band gap (Eg) of ZnO and CuO (inset Fig. 3b), binary nanocomposites and ternary nanocomposites obtained from the relation, αhν = A(hν − Eg)1/2 (Tauc and Grigovici, 1974) where A is a constant, α is the absorption coefficient and hν is the energy of the incident photon. Tauc’s plot was drawn between (αhν)2 and hν and the value of Eg was obtained by extrapolating the linear region of the plot to α = 0 (Fig. 3b). CuO nanoparticles show direct a band gap of about 1.75 eV. The Eg of ZnO nanoparticles is decreased from 3.1 eV to 2.9 eV for the ZC3 binary nanocomposites. Further the band gap of ZC3G15 ternary nanocomposites is reduced to 2.8 eV. The ZC3 binary and ZC3G15 ternary nanocomposites show enhanced absorbance in the visible light region. The Eg of the ZnO nanoparticles is shifted from ultraviolet to visible region due to formation of ZC3 and ZC3G15 nanocomposites which suggest the suitability of ZC3 and ZC3G15 for improved photocatalytic activity in the visible light irradiation.
3.4 Morphological analysis
Field Emission Scanning Electron Microscope (FESEM) images of the ZnO, CuO, GO and rGO are shown in Fig. 4a–d. ZnO nanoparticles show sheet like and nanoneedles like structures; the length and thickness of the sheet is ∼600 nm and 50 nm respectively (Fig. 4a). CuO nanoparticles show spherical shaped structures with an average size of ∼100 nm (Fig. 4b). The layered sheet like structures of GO is observed from Fig. 4c. Further, the layered structure of GO sheet is exfoliated by chemical reduction method and then formed thin layers of rGO (Fig. 4d). Morphology of ZC1 binary nanocomposites is effectively modified from nanosheets (Fig. 4a) to nanorods structure (Fig. 5a). Morphology of the ZC2 binary nanocomposites shows (Fig. 5b) agglomerated spherical structures revealing both the ZnO nanorods and spherical shaped CuO nanoparticles. The ZC3 binary nanocomposites (Fig. 5c) show effective changes in the morphology of ZnO from nanorods to flower like structures. The morphology of the ZC3G15 ternary nanocomposites shows flower like structures similar to that of ZC3 binary nanocomposites (Fig. 5d). The binary nanocomposites (ZC3) are incorporated over the thin layer of rGO structure. The selected portions circled in Fig. 5d show the presence of rGO nanosheets. Elemental composition of the synthesized nanoparticle was analyzed from the Energy Dispersive X-ray Analysis (EDXA) and the results are shown in Fig. 6. ZnO nanoparticles show presence of Zn and O (Fig. 6a) and the GO shows the presence of C and O (Fig. 6b). The ZC3 binary nanocomposites show the presence of Zn, Cu and O (Fig. 6c) whereas the ZC3G15 ternary nanocomposites show the presence of Zn, Cu, O and C (Fig. 6d).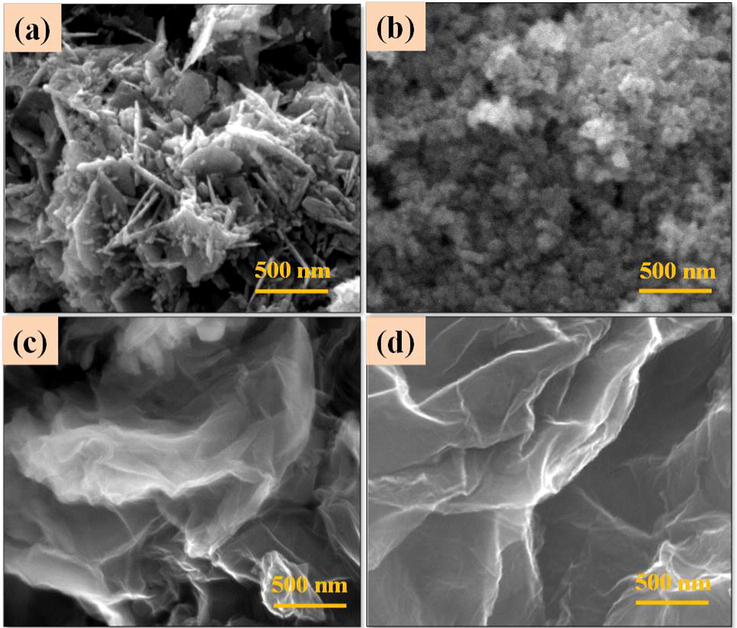
FESEM images of (a) ZnO; (b) CuO; (c) GO; (d) rGO.
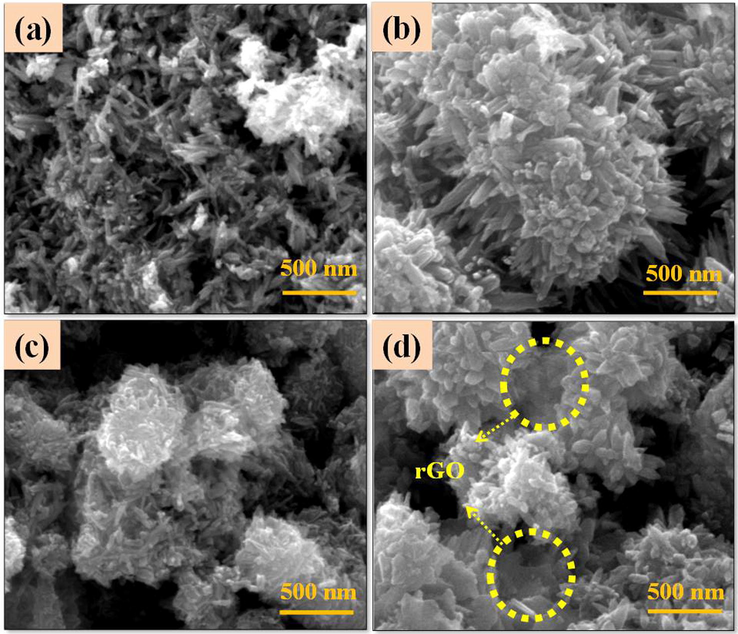
FESEM images of binary nanocomposite (a) ZC1; (b) ZC2; (c) ZC3 and (d) ZC3G15 ternary nanocomposites.
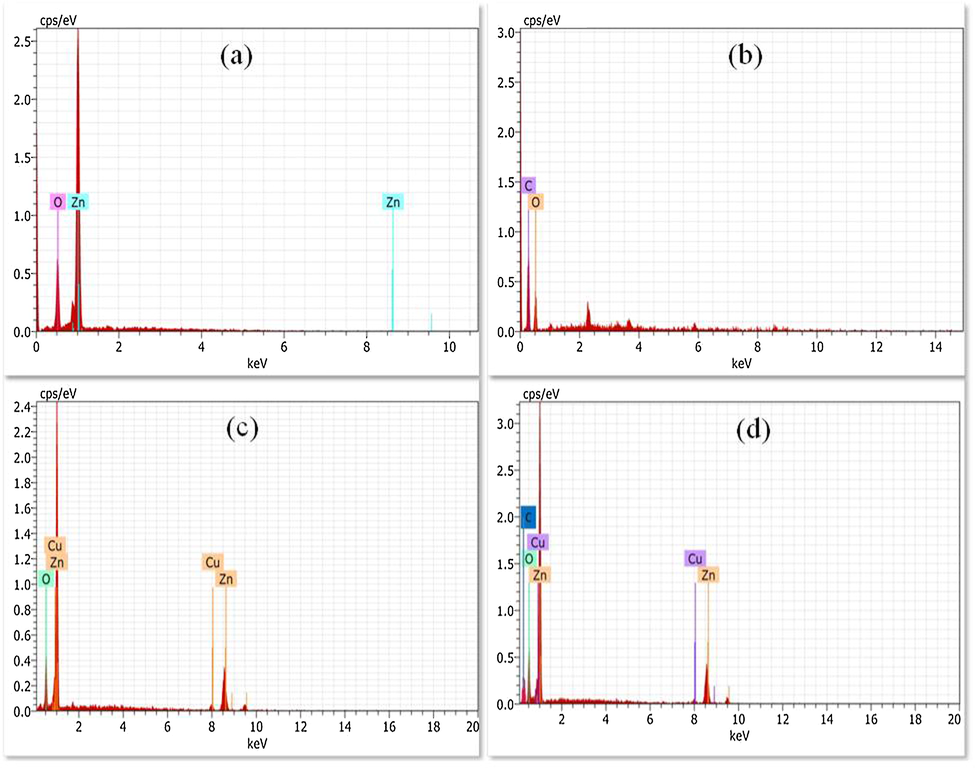
EDS spectra of (a) ZnO; (b) GO; (c) ZC3; (d) ZC3G15 ternary nanocomposites.
3.5 Transmission electron microscopy analysis
Structure and size of the synthesized ZnO, ZC3 binary and ZC3G15 ternary nanocomposites were analyzed by Transmission Electron Microscopy (TEM) and the images are given in Fig. 7. The TEM image of ZnO nanoparticles shows sheet like structures (Fig. 7a); the average length and thickness of the nanosheets is ∼250 nm and ∼50 nm respectively. High Resolution TEM (HRTEM) analyses show (Fig. 7b) that the lattice fringes spacing value is 0.247 nm and this value matches well with the d value (0.247 nm) obtained from Bragg’s equation from the XRD peak of (1 0 1) plane of the present work. Selected Area Electron Diffraction (SAED) pattern of the ZnO nano-flakes is shown in Fig. 7c which confirms that the prepared nano-flakes are polycrystalline nature. The TEM analysis of ZC3 binary nanocomposite shows flower like structures (Fig. 7d) and its HRTEM image (Fig. 7e) reveals that the ZC3 binary nanocomposite lattice fringes values are 0.247 nm and 0.232 nm and the values match well with the d value of 0.247 nm of ZnO nanoparticles (1 0 1) plane and 0.232 nm of CuO nanoparticles (1 1 1) plane of the present work obtained from the Bragg’s equation. The SAED pattern shows that ZC3 binary nanocomposites are polycrystalline nature (Fig. 7f). The TEM image of the ZC3G15 ternary nanocomposites shows (Fig. 7g) the presence of flower like structures of ZC3 binary nanocomposite on rGO. The HRTEM image of the ternary nanocomposite (Fig. 7h) shows lattice fringe values of 0.247 nm and 0.232 nm which agree well with the value of d obtained from Bragg’s equation of the ZnO (1 0 1) plane (0.247 nm) and the CuO (1 1 1) plane (0.232 nm). The SAED pattern of the ZC3G15 ternary nanocomposites (Fig. 7i) reveal that the synthesized ZC3G15 ternary nanocomposites is polycrystalline in nature.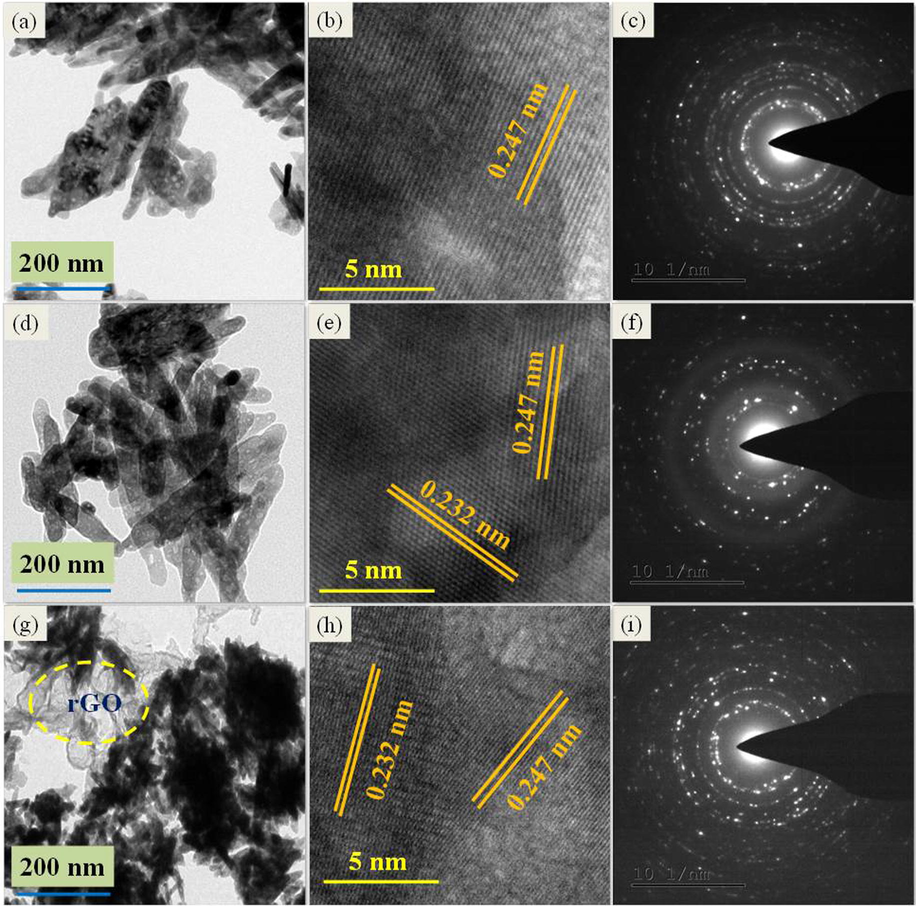
ZnO sheets images of: (a) TEM, (b) HRTEM, (c) SAED pattern; ZC3 binary nanocomposite of: (d) TEM, (e) HRTEM, (f) SAED pattern; ZC3G15 ternary nanocomposites of: (g) TEM, (h) HRTEM and (i) SAED pattern.
3.6 Brunauer–Emmett–Teller surface area analysis
The Brunauer–Emmett–Teller (BET) analysis was carried out to analyze the surface area, pore size and pore volume of the optimized ZC3G15 ternary nanocomposites which showed a maximum degradation efficiency of ∼99% against RhB dye. The N2 adsorption-desorption isotherms of the ZC3G15 ternary nanocomposite is presented in Fig. 8 which reveals that the BET surface area is 75.5 m2 g−1. The pore size and pore volume of ZC3G15 ternary nanocomposites are 1.91 nm and 0.245 cc/g respectively (inset in Fig. 8). It is confirmed in the present work that the ZC3G15 ternary nanocomposites exhibit a type (IV) isotherms with H3 hysteresis loops which is useful for photocatalytic application (Strandwitz et al., 2010). The ZC3G15 ternary nanocomposites possess larger surface area and small pore diameter which are useful for a potential photocatalyst.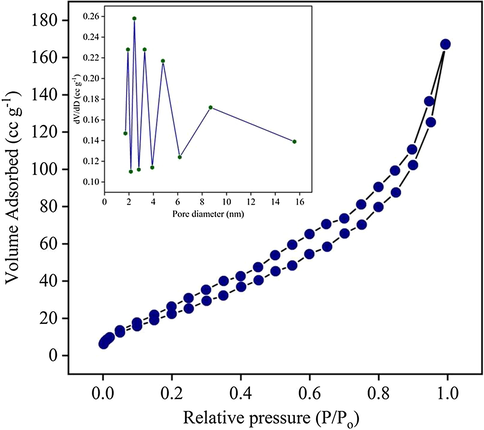
Brunauer–Emmett–Teller (BET) surface area analysis of the ZC3G15 ternary nanocomposites (Inset: The corresponding pore size distribution profile).
3.7 Photoluminescence spectroscopy
The room temperature Photoluminescence (PL) emission spectra of the ZnO, ZC3 and ZC3G15 are presented in Fig. 9. Pudukudy et al., (2014) observed PL emission peak at 432 nm is due to excitonic band-to-band radiative emission. The PL spectra of ZC3 binary nanocomposite shows an emission peak at 432 nm which confirms optical band gap is shifted towards the visible region. Further, the PL intensity subsequently is decreased in ZC3 binary nanocomposites when compare with that of ZnO; thus confirming the electron-hole pairs recombination rate is decreased. However, the PL intensity of ZC3G15 ternary nanocomposites observed at 442 nm is effectively reduced when compared with that of ZC3 binary nanocomposites. This evidently shows that ZC3G15 ternary nanocomposites effectively separate the photo-excited charge carriers and suppress the electron-hole pair recombination rates. Thus the modifications in the optical properties of ZC3G15 ternary nanocomposites are expected to enhance the photocatalytic degradation efficiency under the visible light irradiation.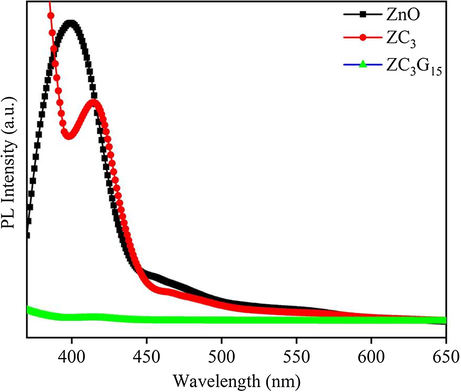
PL spectral analysis of ZnO, ZC3 binary and ZC3G15 ternary nanocomposites.
3.8 Raman spectral analysis
Typical Raman spectra of the ZnO, ZC3 binary and ZC3G15 ternary nanocomposites were recorded at room temperature and are shown in Fig. 10. The ZnO nanoparticles show that Raman peak at 438 cm−1 (Fig. 10a) is due to polar optical phonon (E2 high) mode of wurtzite hexagonal phase (Pudukudy et al., 2014). Further the ZC3 binary nanocomposites show (Fig. 10a) a vibrational peak of ZnO at 438 cm−1 with diminished intensity. This may be due to the formation of ZnO/CuO binary nanocomposites. Additionally, two Raman peaks identified at 286 cm−1 and 617 cm−1 in ZC3 binary and ZC3G15 ternary nanocomposite are related to Ag and Bg modes of CuO (Irwin et al. 1990; Wang et al., 2012) respectively.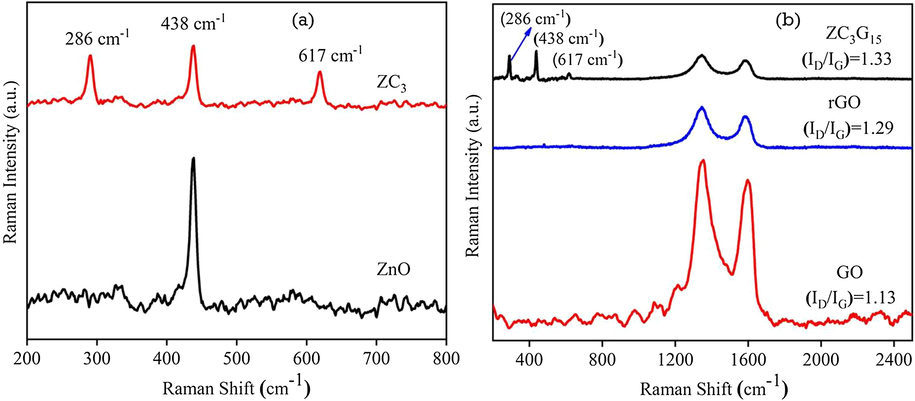
Raman spectral analysis of (a) ZnO and ZC3 binary nanocomposites; (b) GO, rGO, ZC3G15 ternary nanocomposites.
Structure ordering (graphitization) of GO, rGO and ZC3G15 is confirmed by the Raman spectral analysis and the results are presented in Fig. 10b. The two peaks observed at 1353 cm−1 and 1596 cm−1 in GO are related to defects in the graphitic structure (D-band) and sp2 hybridized carbon atoms in graphitic structure (G-band) respectively (Zhou et al., 2012). The intensity ratio of (ID/IG) in GO is 1.13. As GO is reduced to rGO the intensity ratio (ID/IG) of rGO is increased from 1.13 to 1.29 which suggests the decrease in the average size of sp2 domains (Ahsanulhaq et al., 2007). The sample ZC3G15 shows Raman peaks at 286 cm−1 and 617 cm−1 which are related to Ag and Bg modes of CuO and peak at 438 cm−1 (E2 high) is related to that of ZnO nanoparticles (Pudukudy et al., 2014). Additionally, ZC3G15 ternary nanocomposites possess relatively higher (ID/IG) intensity ratio between D band at 1345 cm−1 and G band at 1581 cm−1 is about 1.33 due to surface defects of rGO; thus indicating the structural defects are slightly increased during the formation in ZC3G15 ternary nanocomposites (Herring et al., 2012). Thus increase in the defect sites in rGO may prevent the agglomeration of the nanoparticles and enhance the strong interaction between binary nanocomposites and rGO sheets in ZC3G15 ternary nanocomposites.
3.9 Photocatalytic activity
Photocatalytic activity of ZnO and CuO, ZC3 binary nanocomposite and ZC3G5, ZC3G10, ZC3G15 and ZC3G20 ternary nanocomposites was tested against RhB dye under visible light irradiation for a time period of 25 min and the results are shown in Fig. 11a, b. The prepared RhB solution was irradiated under the visible light irradiation for 25 min which revealed only 2% self-degradation. Bare ZnO and CuO nanoparticles show ∼7% and 40% of the RhB dye degradation respectively for a time period of 25 min. Further, ZC3 binary nanocomposites show relatively enhanced degradation efficiency of ∼55% against RhB dye for 25 min; the enhancement of degradation efficiency is due to the formation of heterojunction in the ZC3 binary nanocomposites. The photocatalytic activity of ZC3G5, ZC3G10, ZC3G15 and ZC3G20 ternary nanocomposites was tested against RhB dye in a total time period of 25 min under visible light irradiation and results are shown in Fig. 11b. The ZC3G5, ZC3G10, ZC3G15 and ZC3G20 ternary nanocomposites show degradation efficiency of about 80%, 91%, 97% and 94% respectively against RhB dye in a time of 25 min. Thus in the present work the ZC3G15 ternary nanocomposites show remarkable photodegradation efficiency up to 97% against RhB dye in a time period of 25 min.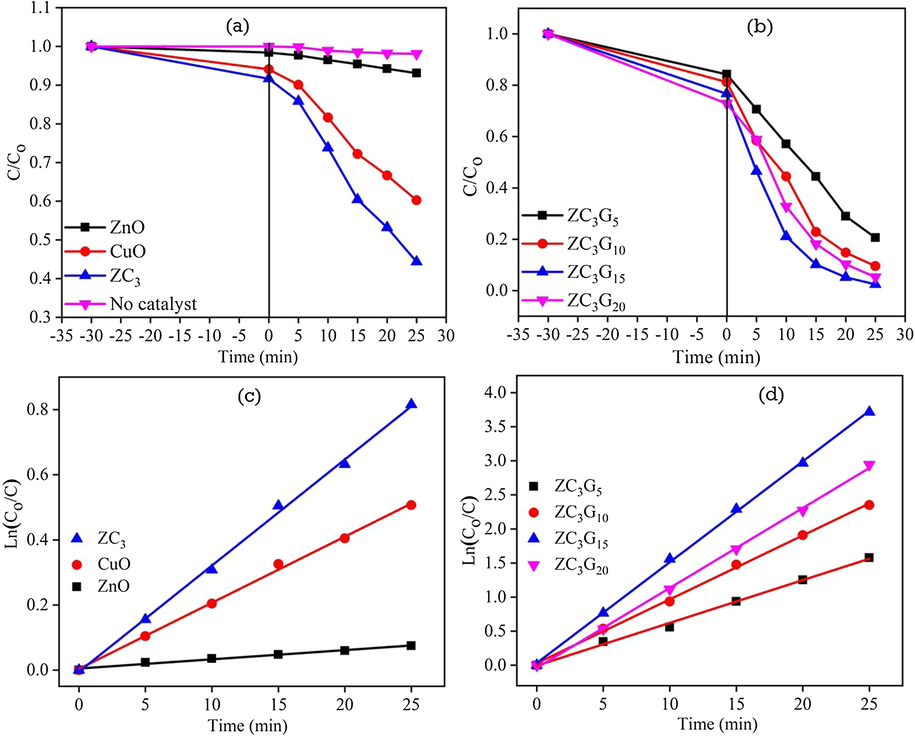
Photodegradation efficiency of the synthesized catalysts: (a, b) (Co/C) versus time plot; (c, d) Ln(Co/C) versus time plot.
It is well known that the kinetics of light-induced degradation of organic pollutants follow a first-order reaction model, obeying Langmuir-Hinshelwood model (Bayati et al., 2010; Bechambi et al., 2016). The kinetics of the photodegradation is described by the equation; Ln(Co/C) = kt, where Co is the initial concentration of RhB dye and C is the RhB dye concentrations at different time interval and k is the rate constant (Du et al., 2008). Fig. 11c, d show the graph between Ln(Co/C) as a function of irradiation time which shows optimized ZC3G15 ternary nanocomposites possessing relatively high reaction rate constant k = 0.1480 min−1 when compared with that of the other synthesized samples. The rate constant (k) values of the synthesized samples are given in Table 2 and the order of photodegradation for different samples obtained is: ZC3G15 > ZC3G20 > ZC3G10 > ZC3G5 > ZC3 > CuO > ZnO. Thus, the ZC3G15 ternary nanocomposites show relatively enhancement in the degradation efficiency to 97% against RhB dye under the visible light irradiation for 25 min. Hence, steps were taken to improve the degradation efficiency of the ZC3G15 ternary nanocomposites by varying pH of the RhB dye solution, concentration of RhB dye and photocatalyst dosage under the visible light irradiation.
Sample name
R2
k (m−1)
ZnO
0.9825
0.0028
CuO
0.9974
0.0203
ZC3
0.9975
0.0326
ZC3G5
0.9958
0.0627
ZC3G10
0.9982
0.0938
ZC3G15
0.9992
0.2464
ZC3G20
0.9986
0.1173
3.9.1 Effect of solution pH
Photodegradation efficiency of the RhB dye solution of different pH value was evaluated under the visible light irradiation for 20 min and the results are shown in Fig. 12a. In the process 100 mg of ZC3G15 ternary nanocomposites is mixed with 100 mL (5 ppm) of RhB dye solution and pH of the RhB solution was varied from 3 to 12 (using 0.1 M of diluted HCl/NaOH). The pH of the RhB dye solution was adjusted to 3, 5 and 7 which shows the degradation efficiency of about 62%, 65% and 89% respectively for a time period of 20 min. Low pH level of the RhB dye solution provides positively charged H+ ions, thus under the acidic pH condition, RhB dye degradation efficiency is relatively less. In contrast, increase in the pH of the RhB dye solution to 9 and 11 shows increase in the degradation efficiency to 94% and 99% respectively for a time period of 20 min. This may be due to increase in the pH of the RhB dye solution increases the formation of hydroxyl ions (OH–) which react with the holes to form hydroxyl radicals (•OH) and thereby increases the degradation of RhB (Silambarasan et al., 2014). Further increasing the RhB dye solution pH to 13 shows diminished photodegradation efficiency of about 77%; this may be due to the absorption of hydroxyl ions on the photocatalyst surface reduces the photo degradation efficiency (Harish et al., 2014). Linear relationship between Ln(Co/C) and irradiation times shows (Fig. 12b) the rate constant k and correlation co-efficient of the RhB dye reaction. The RhB dye solution shows relatively higher reaction rate constant of about 0.2486 m−1 at pH 11; this may be due to the presence of relatively higher OH– ions which highly react with holes and form •OH radicals.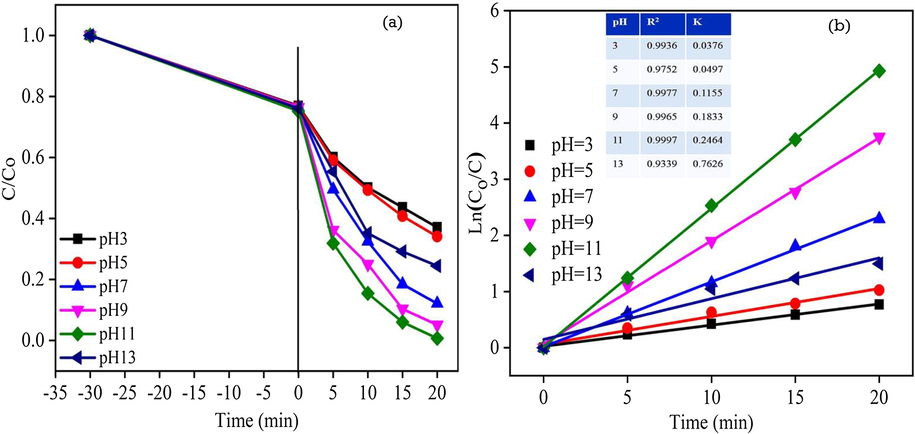
Effect of pH on RhB dye degradation efficiency: (a) (Co/C) versus time plot; (b) Ln(Co/C) versus time plot for ZC3G15 ternary nanocomposites.
3.9.2 Effect of RhB dye concentration
As the solution pH 11 exhibited 99% photodegradation efficiency for 20 min, the degradation efficiency of the ZC3G15 ternary nanocomposites was tested against different concentration of 5, 10, 15, and 20 ppm of RhB dye solution adjusted to pH 11 and the result are presented in Fig. 13a. The ZC3G15 ternary nanocomposites show the degradation efficiency of about 99%, 86%, 64% and 57% respectively for 5, 10, 15, and 20 ppm of RhB dye. In the present work 5 ppm of RhB dye possesses relatively enhancement in the degradation efficiency to 99% for 20 min. Further, increase in the RhB dye concentration increases the absorption of dye molecules on the catalysis surface which act as a barrier to prevent the light intensity reaching the catalyst surface; thus reducing the formation of electron-hole pairs generation (Qamara et al., 2011). Fig. 13b shows the linear relationship between Ln(Co/C) and irradiation time which provides the rate constant k and correlation co-efficient R2 of the RhB dye degradation. However 5 ppm of the RhB dye solution shows relatively higher rate constant value of about 0.2464 m−1 when compared with that of other RhB dye concentrations.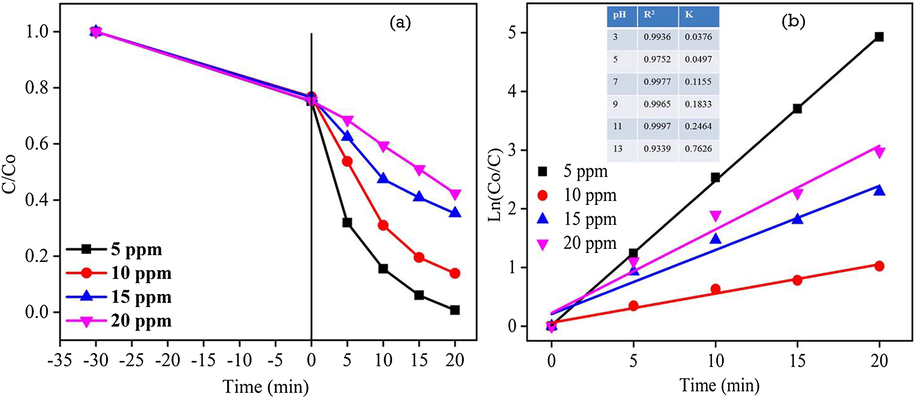
Effect of different concentration on RhB dye degradation efficiency: (a) (Co/C) versus time plot; (b) Ln(Co/C) versus time plot for ZC3G15 ternary nanocomposites.
3.9.3 Effect of photocatalyst dosage
Photocatalytic degradation of RhB dye was carried out using 50 mg, 100 mg, 150 mg and 200 mg of ZC3G15 ternary nanocomposites in 100 mL of RhB solution (5 ppm; pH = 11) for 20 min and the corresponding results are presented in Fig. 14a. However, in the presence of ZC3G15 ternary nanocomposites of 50 mg, 100 mg, 150 mg and 200 mg in the RhB dye solution the degradation efficiency observed is 72%, 99%, 83% and 64% respectively for a time period of 20 min. Thus the present work shows that 100 mg of ZC3G15 is optimal level which relatively enhanced the degradation efficiency against RhB dye. Further, increasing the catalysts above the optimal level decreases the degradation efficiency against RhB dye. This may be due to the photodegradation efficiency of the organic pollutants is strongly influenced by number of active sites of the catalysis and the photo-absorption ability of the catalysis (Grzechulska and Morawski, 2002). On the other hand the excess amount of catalyst reduces the light penetration owing to the shielding effect of the suspended particles which reduces the RhB dye degradation (Daneshvara et al., 2003). The graph drawn between Ln(Co/C) and irradiation time (Fig. 14b) shows the apparent rate constant k and correlation co-efficient R2 of the RhB dye degradation. It is observed from Fig. 14b that 100 mg of the catalysis possesses relatively higher rate constant about 0.2464 m−1 than that of other amount catalysis. The photocatalytic activity of the ZC3G15 ternary nanocomposites is 88, 12 and 7.5 times higher than that of ZnO, CuO and ZC3 binary nanocomposites respectively under the visible light irradiation. Further, to analyze the stability of ZC3G15 ternary nanocomposites, recycle process was carried out up to five cycles and the results are presented in Fig. 14c. In the first cycle, ZC3G15 ternary nanocomposites show ∼99% of photocatalytic degradation efficiency for 20 min. Then ZC3G15 ternary nanocomposites were collected at the end of each cycles and used for the next cycles which shows the RhB dye degradation is 97%, 95%, 94% and 91% respectively in the second, third, fourth and fifth cycles of the experiment for a time period of 20 min.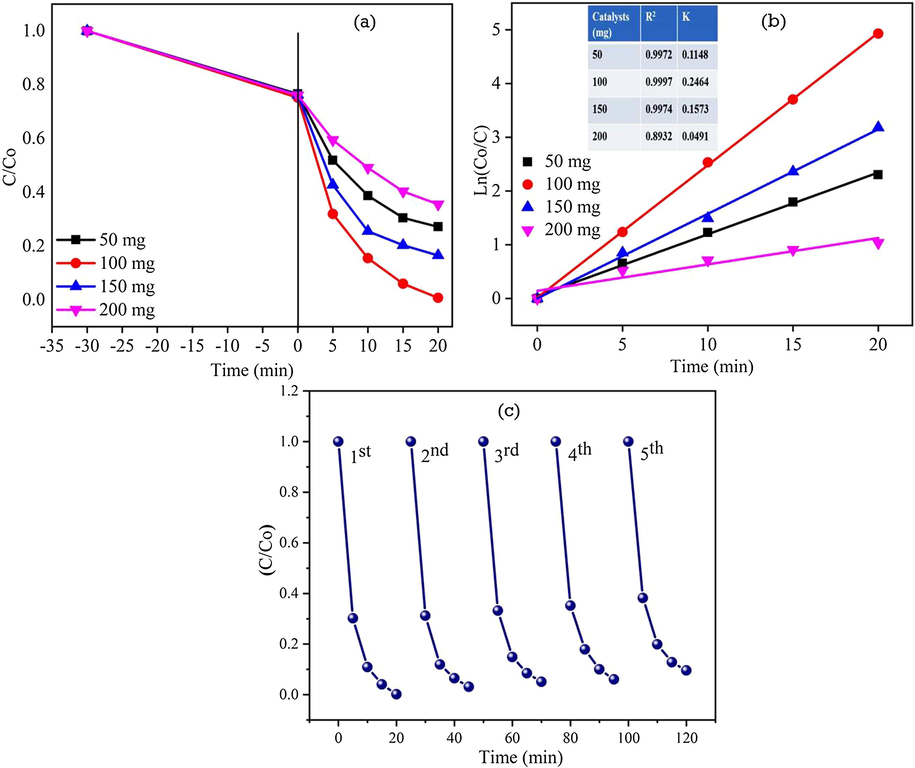
Effect of catalysis dosage on degradation efficiency against RhB dye: (a) (Co/C) versus time plot; (b) Ln(Co/C) versus time plot for ZC3G15 ternary nanocomposites and (c) recycle test of the ZC3G15 ternary nanocomposites against RhB dye.
3.9.4 Scavengers test
The photocatalytic reaction is mainly occurred due to the involvement of the active species of electrons (e−), holes (h±), superoxide radical anions (O2•−) and hydroxyl radicals (•OH) (Zhou et al., 2014). In the present work scavengers test was carried out to understand the active species involved in the RhB dye degradation in the presence of ZC3G15 ternary nanocomposites and the results are presented in Fig. 15a. The scavenger test was carried out using benzoic acid (BA; 0.5 mM), disodium ethylenediaminetetraacetate (EDTA; 10 mM) and under the N2 atmosphere which act as a hydroxyl (•OH), holes (h±) and superoxide (O2•−) scavengers. The ZC3G15 ternary nanocomposites show 99% of RhB dye degradation for 20 min. The RhB dye degradation is reduced to 12%, 97% and 87% respectively in the presence of BA, EDTA and N2 flow for 20 min under the visible light irradiation. It is confirmed in the present work hydroxyl (•OH) radical are the main reactive species for the degradation of RhB dye under the visible light irradiation.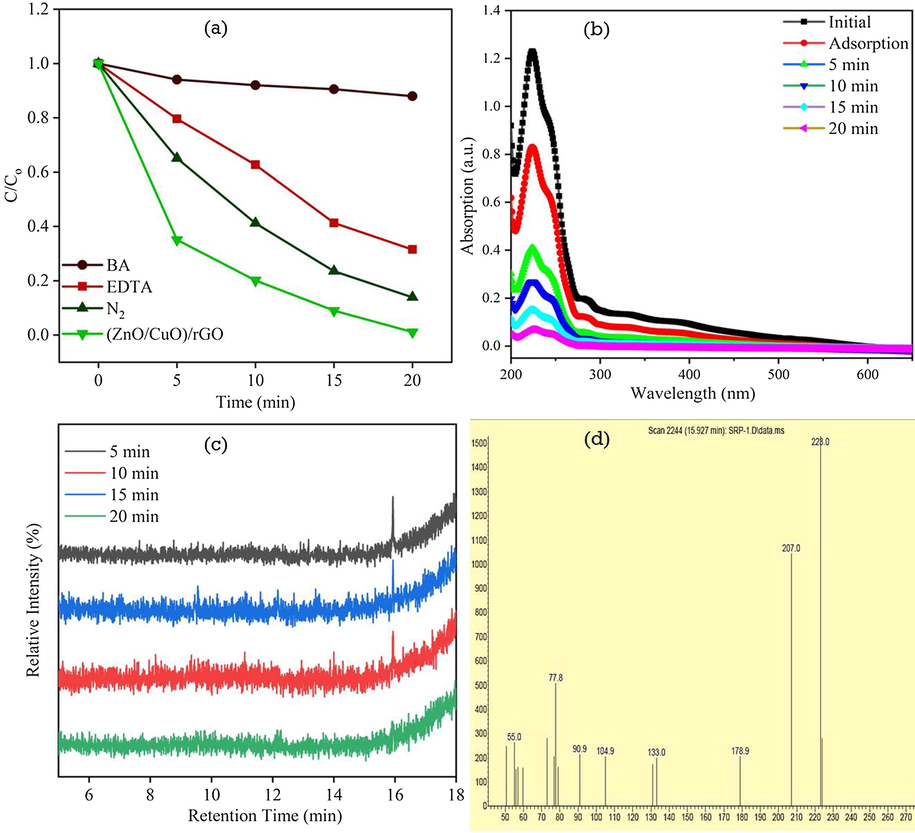
(a) The effect of different scavengers on the photodegradation of RhB dye; (b) The absorbance spectra of 4-CP photodegradation in the presence of ZC3G15 ternary nanocomposites; (c) GC of ZC3G15 ternary nanocomposites photodegradation of RhB dye and (d) mass spectra of the species observed in MS.
3.9.5 Photocatalytic activity against 4-chlorophenol
The ZC3G15 ternary nanocomposites were tested against colorless 100 mL aqua solution 4-chlorophenol (4-CP) (2.5 × 10⁻⁴ M) and the corresponding absorption spectra is presented in Fig. 15b. The initial aqua solution of 4-CP shows the maximum absorption peak intensity at 223 nm. Further photocatalytic activity was carried out in the presence of ZC3G15 ternary nanocomposites which show 4-CP absorbance peak at 223 nm is effectively decreases with increasing the irradiation time. However the ZC3G15 ternary nanocomposites show photodegradation efficiency of 93% for a time period of 20 min under the visible light irradiation.
3.9.6 Gas chromatography-mass spectroscopy analysis
The Gas Chromatography-Mass Spectroscopy (GC–MS) analysis was carried out for ZC3G15 ternary composites to analyze the intermediate products during the RhB dye degradation process. The GC–MS results of the ZC3G15 ternary nanocomposites against RhB dye were obtained for a period of 5, 10, 15 and 20 min respectively and results are presented in Fig. 15c,d. Gas Chromatography (GC) (5 min irradiation time) shows a peak at Fig. 15c shows at 15.95 min of retention time is due to the formation of 1,2 benzenedicarboxylic acid (confirmed by GC–MS library) and the corresponding Mass Spectroscopy (MS) is shown in Fig. 15d. Further increase in the irradiation time to 10, 15 and 20 min decreased the predominant peak intensity (15.95 min of retention time) thus confirming the degradation of 1,2 benzenedicarboxylic acid. The sample irradiated for 20 min shows no peak related to 1,2 benzenedicarboxylic acid which confirms a complete degradation of 1,2 benzenedicarboxylic acid. The present work results agree well with the previous reports (Cui et al., 2015; Li et al., 2007).
rGO as being a good conductor, conducts the photogenerated electrons under the visible light irradiation and improves the stability of the ternary nanocomposites. It is worth to note that ZC3G15 ternary nanocomposite shows the degradation efficiency of 52.5, 7.2 and 4.5 times higher than that of ZnO, CuO and ZC3 binary nanocomposites. Further, ZC3G15 ternary nanocomposites show 93% of 4-CP degradation for 20 min. Thus the present work reveals that the ZC3G15 ternary nanocomposites is an effective visible light driven photocatalysts for photocatalytic applications against RhB dye and 4-CP. Hsieh and Ting (2018), reported on novel ternary nanocomposites of Cu-doped ZnO/reduced graphene oxide (1.25Cu-ZnO-G10) prepared by microwave-assisted hydrothermal method which shows 93% and 98% of methylene blue degradation for a time period of 120 min under UV (40 W) and solar simulator (300 W) irradiations respectively. In the present work, ZC3G15 ternary nanocomposites prepared by the simple solid state method shows 99% and 93% of degradation efficiency against RhB dye and 4-CP for a time period of 20 min under the visible light irradiation (150 W tungsten lamp).
3.9.7 Possible ways for charge transfer mechanism
The possible ways of charge transfer mechanism in the ZC3G15 ternary nanocomposites under the visible light irradiation is shown in Fig. 16. Under the visible light irradiation ZC3G15 ternary nanocomposites absorb the visible light and hence excite the electrons from valence band (VB) of CuO to its conduction band (CB). These electrons migrate to the CB of ZnO because the CB edge potential of CuO (−0.8 eV) is negatively higher than that of ZnO (−0.5 eV) (Roy et al., 2010; Fu et al., 2008). Further, the conduction band electrons in ZnO migrate to the rGO, as the work function of rGO (−0.08 eV vs normal hydrogen electrode potential) is lower than that of the ZnO (Dai et al., 2015). Meanwhile the holes in the VB of ZnO are transferred to the VB of CuO, thus the recombination rate is suppressed. In the ZC3G15 ternary nanocomposites rGO’s acts as an electron conductor and used to separate the photo-excited electron-hole pairs as confirmed by the PL spectral analysis (Fig. 9). The ZC3G15 ternary nanocomposites show a maximum degradation efficiency of 99% for 20 min. Above this optimum level of rGO (15 mg) in the ternary nanocomposites decreased the degradation efficiency; this may be due to the excess amount of rGO present in ternary nanocomposites which reduces the intensity of visible light necessary for the generation of photo induced electron-hole pairs.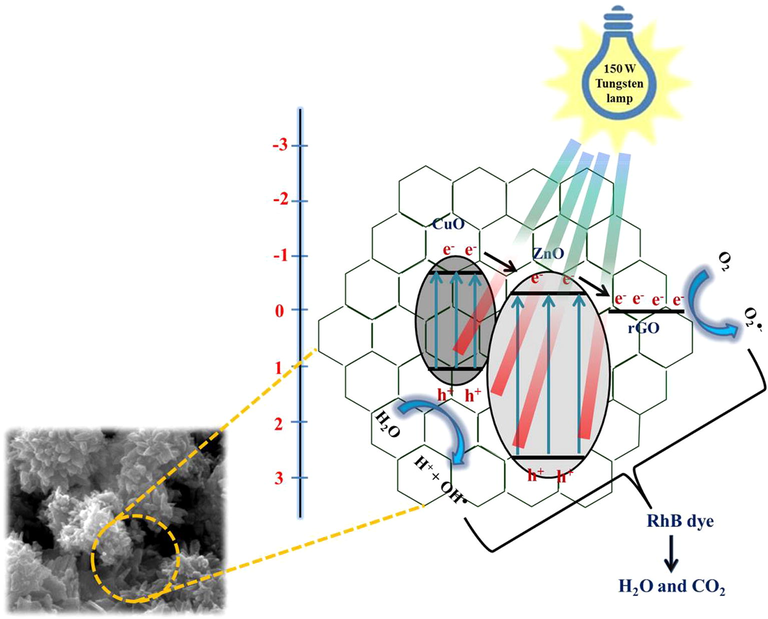
Possible way for charge transfer mechanism in ZC3G15 ternary nanocomposites under visible light irradiation.
3.9.8 Possible ways for growth mechanism
The mechanism involved in the growth of ternary nanocomposites enhanced the photocatalytic RhB dye degradation activities which can be explained as follows. The solid state growth mechanism can be discussed on the basis of two stages: (1) crushing of the precursor materials and (2) controlling the process of agglomeration (Fig. 17). (1) Crushing of the precursor materials: The precursor materials of zinc acetate dihydrate and sodium hydroxide were separately ground for five minutes each, in order to reduce their size and to effectively mix them together with PEG 400. (2) Controlling the process of agglomeration: Again the mixed precursor materials were ground for 30 min with PEG 400, a widely used surfactant agent. PEG 400 covers the nanoparticles and reduces the surface tension and there by prevents the agglomeration of nanoparticles. Further, the ground particles were washed with distilled water and ethanol. As PEG 400 is hydrophilic in nature, it dissolves in water easily and hence can be removed easily from the final product (Ma et al., 1990). The morphology of ZnO nanoparticles synthesized using PEG 400 shows sheet like structures (Fig. 4a). The morphology of CuO nanoparticles synthesized using PEG 400 show the spherical shaped structures (Fig. 4b). The ZC3 binary nanocomposites synthesized using PEG 400 show flowerlike structures consisting nanorods (Fig. 5c). The (ZnO/CuO)/rGO ternary nanocomposites were synthesized using PEG 400 with the addition of rGO at different amounts (5 mg, 10 mg, 15 mg and 20 mg). As the rGO provides high surface area and the combination of the binary nanocomposites with rGO (15 mg) forms the ternary nanocomposites with enhanced photo-degradation efficiency against RhB dye and 4-CP.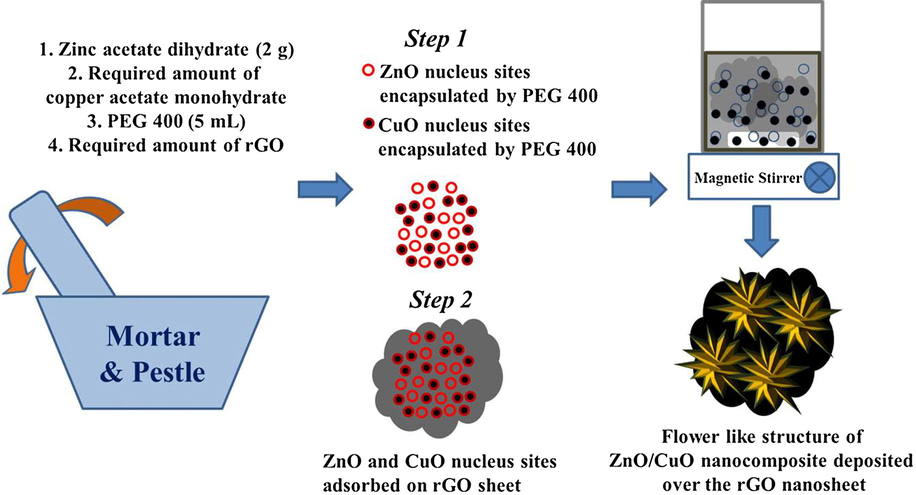
Possible way for growth mechanism of the (ZnO/CuO)/rGO nanocomposites by solid state method.
4 Conclusions
In the present work, solid-state method was followed to synthesis the visible light active (ZnO/CuO)/rGO ternary nanocomposites heterostructures and subjected to analyze the photodegradation efficiency against RhB dye and 4-CP. The optical band gap of ZnO is tuned from 3.1 eV to 2.8 eV for ZC3G15 ternary nanocomposite. The morphology of the ternary nanocomposites of ZC3G15 show formation of flower like structures of (ZnO/CuO) on the rGO sheets. Hence the ZC3G15 ternary nanocomposites possess enhancement of visible light absorption capacity and also diminish the electron hole pair recombination rates due to the addition of rGO. The ZC3G15 ternary nanocomposite shows RhB dye (pH = 11) degradation of about 99% under visible light irradiation in a time period of 20 min. Further the recycle process confirms that ZC3G15 ternary nanocomposites show 91% of the degradation efficiency in the fifth cycle which confirms better stability. The ZC3G15 ternary nanocomposites show 93% of degradation efficiency against 4-CP for 20 min under the visible light irradiation. Thus the present work shows a novel design of metal oxide frame work along with rGO as a promising material for photocatalytic application under the visible light irradiation.
Acknowledgements
One of the authors (N. K) thanks SRM Institute of Science and Technology, Chennai for the award of SRMIST Junior Research Fellowship to carry out the research work. The authors thank Prof. B. Neppolian, Research Institute, SRMIST for his support during the progress of this work.
References
- Growth of aligned ZnO nanorods and nanopencils on ZnO/Si in aqueous solution: growth mechanism and structural and optical properties. Nanotechnology. 2007;18:115603
- [CrossRef] [Google Scholar]
- TiO2-ZnO photocatalysts synthesized by sol–gel auto-ignition technique for hydrogen production. Int. J. Hydrogen Energy. 2017;42:5016-5025.
- [CrossRef] [Google Scholar]
- X-ray photoelectron spectroscopy, Raman and photoluminescence studies on formation of defects in Cu:ZnO thin films and its role in nonlinear optical features. Laser Phys.. 2018;28:095405
- [CrossRef] [Google Scholar]
- Efficient complete oxidation of acetaldehyde into CO2 over CuBi2O4/WO3 composite photocatalyst under visible and UV light irradiation. J. Phys. Chem. C. 2007;111:7574-7577.
- [CrossRef] [Google Scholar]
- Remanence of lead pollution in an urban river system: a multi-scale temporal and spatial study in the Seine River basin, France. Environ. Sci. Pollut. Res.. 2014;21:4134-4148.
- [CrossRef] [Google Scholar]
- How photocatalytic activity of the MAO-grown TiO2 nano/micro-porous films is influenced by growth parameters? Appl. Surf. Sci.. 2010;256:4253-4259.
- [CrossRef] [Google Scholar]
- Photocatalytic degradation of bisphenol A in the presence of Ce–ZnO: evolution of kinetics, toxicity and photodegradation mechanism. Mater. Chem. Phys.. 2016;173:95-105.
- [CrossRef] [Google Scholar]
- Patterns of presence and concentration of pesticides in fish and waters of the Júcar River (Eastern Spain) J. Hazard. Mater.. 2014;265:271-279.
- [CrossRef] [Google Scholar]
- Mesoporous CuO–ZnO p–n heterojunction based nanocomposites with high specific surface area for enhanced photocatalysis and electrochemical sensing. Catal. Sci. Technol.. 2016;6:3238-3252.
- [CrossRef] [Google Scholar]
- Multi-walled carbon nanotubes supported Cu-doped ZnO nanoparticles and their optical property. J. Nanopart. Res.. 2012;14:817.
- [CrossRef] [Google Scholar]
- Enhanced visible-light photoactivity of CuWO4 through a surface-deposited CuO. J. Phys. Chem. C. 2014;118:9982-9989.
- [CrossRef] [Google Scholar]
- Characterization and third harmonic generation calculations of undoped and doped spin-coated multilayered CuO thin films. J. Phys. Chem. Solids. 2019;124:60-66.
- [CrossRef] [Google Scholar]
- Photodegradation of Rhodamine B over Ag modified ferroelectric BaTiO3 under simulated solar light: pathways and mechanism. RSC Adv.. 2015;5:30372-30379.
- [CrossRef] [Google Scholar]
- A high efficient graphitic-C3N4/BiOI/graphene oxide ternary nanocomposite heterostructured photocatalyst with graphene oxide as electron transport buffer material. Dalton Trans.. 2015;44:7903-7910.
- [CrossRef] [Google Scholar]
- Photocatalytic degradation of azo dye acid red 14 in water: investigation of the effect of operational parameters. J. Photochem. Photobiol., A. 2003;157:111-116.
- [CrossRef] [Google Scholar]
- Strategies for improving the efficiency of semiconductor metal oxide photocatalysis. Mater. Horiz.. 2014;1:400-410.
- [CrossRef] [Google Scholar]
- The effect of surface OH-population on the photocatalytic activity of rare earth-doped P25-TiO2 in methylene blue degradation. J. Catal.. 2008;260:75-80.
- [CrossRef] [Google Scholar]
- Synthesis and gas sensing performance of Dandelion-Like ZnO with hierarchical porous structure. Ind. Eng. Chem. Res.. 2014;53:12737-12743.
- [CrossRef] [Google Scholar]
- Photocorrosion inhibition and enhancement of photocatalytic activity for ZnO via hybridization with C60. Environ. Sci. Technol.. 2008;42:8064-8069.
- [CrossRef] [Google Scholar]
- Triple layered core–shell ZVI@carbon@polyaniline composite enhanced electron utilization in Cr(VI) reduction. J. Mater. Chem. A. 2018;6:11119-11128. 10.1039/C8TĂ6A
- [Google Scholar]
- Photocatalytic decomposition of azo-dye acid black 1 in water over modified titanium dioxide. Appl. Catal. B. 2002;36:45-51.
- [CrossRef] [Google Scholar]
- Controlled synthesis and morphological investigation of self-assembled CuO nanostructures. Mater. Lett.. 2014;121:129-132.
- [CrossRef] [Google Scholar]
- Nano-sized CuO/ZnO hollow spheres: synthesis, characterization and photocatalytic performance. J. Mater. Sci.: Mater. Electron.. 2017;28:14678-14684.
- [CrossRef] [Google Scholar]
- Enhanced photocatalytic activity of ZnO–graphene nanocomposites prepared by microwave synthesis. J. Nanopart. Res.. 2012;14:1277.
- [CrossRef] [Google Scholar]
- Characterization and photocatalytic performance of ternary Cu-doped ZnO/Graphene materials. Appl. Surf. Sci.. 2018;427:465-475.
- [CrossRef] [Google Scholar]
- Polyborosilazane derived ceramics - nitrogen sulfur dual doped graphene nanocomposite anode for enhanced lithium ion batteries. Electrochim. Acta. 2019;296:925-937.
- [CrossRef] [Google Scholar]
- Raman scattering from single crystals of cupric oxide. Physica C. 1990;166:456-464.
- [CrossRef] [Google Scholar]
- Synthesis of MoS2 nanosheets loaded ZnO–g-C3N4 nanocomposites for enhanced photocatalytic applications. Chem. Eng. J.. 2016;289:306-318.
- [CrossRef] [Google Scholar]
- Superparamagnetic core/shell Fe2O3/ZnO nanosheets as photocatalyst cum bactericide. Catal. Today, Mater. Photocatal. Degrad Contam. Environ. Concern. 2017;284:114-120.
- [CrossRef] [Google Scholar]
- A review on nanomaterials for environmental remediation. Energy Environ. Sci.. 2012;5:8075-8109.
- [CrossRef] [Google Scholar]
- In situ grown nickel selenide on graphene nanohybrid electrodes for high energy density asymmetric supercapacitors. Nanoscale. 2018;10:20414-20425.
- [CrossRef] [Google Scholar]
- Cost-effective and eco-friendly synthesis of novel and stable N-doped ZnO/g-C3N4 core–shell nanoplates with excellent visible-light responsive photocatalysis. Nanoscale. 2014;6:4830-4842.
- [CrossRef] [Google Scholar]
- Facile synthesis and photocatalytic activity of ZnO–CuO nanocomposite. Superlatt. Microstruct.. 2010;47:615-623.
- [CrossRef] [Google Scholar]
- Detection of intermediates in the TiO2-assisted photodegradation of Rhodamine B under visible light irradiation. J. Environ. Sci.. 2007;19:892-896.
- [CrossRef] [Google Scholar]
- Superhydrophobic/superoleophilic polycarbonate/carbon nanotubes porous monolith for selective oil adsorption from water. ACS Sustain. Chem. Eng.. 2018;6:13747-13755.
- [CrossRef] [Google Scholar]
- Photocatalysis on TiO2 surfaces: principles, mechanisms, and selected results. Chem. Rev.. 1995;95:735-758.
- [CrossRef] [Google Scholar]
- Electrically conductive polymer composites for smart flexible strain sensors: a critical review. J. Mater. Chem. C. 2018;6:12121-12141.
- [CrossRef] [Google Scholar]
- Hierarchical ZnO microarchitectures assembled by ultrathin nanosheets: hydrothermal synthesis and enhanced photocatalytic activity. J. Mater. Chem.. 2011;21:4228-4234.
- [CrossRef] [Google Scholar]
- Evaluation criteria for reduced graphene oxide. J. Phys. Chem. C. 2011;115:11327-11335.
- [Google Scholar]
- PEG 400, a hydrophilic molecular probe for measuring intestinal permeability. Gastroenterology. 1990;98:39-46.
- [CrossRef] [Google Scholar]
- Improved photocatalytic activity of ZnO coupled CuO nanocomposites synthesized by reflux condensation method. J. Alloy Compd.. 2015;625:362-370.
- [CrossRef] [Google Scholar]
- Synthesis, characterization and photocatalytic activity of annealing dependent quasi spherical and capsule like ZnO nanostructures. Appl. Surf. Sci., Photocatal. Mater. Energy Environ. Appl.. 2014;319:221-229.
- [CrossRef] [Google Scholar]
- Synthesis, characterization, and sunlight mediated photocatalytic activity of CuO coated ZnO for the removal of nitrophenols. ACS Appl. Mater. Interfaces. 2015;7:8757-8769.
- [CrossRef] [Google Scholar]
- Synthesis of nanostructured NiO and its application in laser-induced photocatalytic reduction of Cr(VI) from water. J. Mol. Catal. A: Chem.. 2011;341:83-88.
- [CrossRef] [Google Scholar]
- Highly efficient uranium adsorption by salicylaldoxime/polydopamine graphene oxide nanocomposites. J. Mater. Chem. A. 2018;6:24676-24685.
- [CrossRef] [Google Scholar]
- Facile hydrothermal preparation of hierarchically assembled, porous single-crystalline ZnO nanoplates and their application in dye-sensitized solar cells. J. Mater. Chem.. 2010;20:1001-1006.
- [CrossRef] [Google Scholar]
- Catalytic nanoarchitectures–the importance of nothing and the unimportance of periodicity. Science. 2003;299:1698-1701.
- [CrossRef] [Google Scholar]
- Toward solar fuels: photocatalytic conversion of carbon dioxide to hydrocarbons. ACS Nano. 2010;4:1259-1278.
- [CrossRef] [Google Scholar]
- Degradation of methylene blue as a pollutant with N-doped graphene quantum dot/titanium dioxide nanocomposite. J. Clean. Prod.. 2017;148:31-36.
- [CrossRef] [Google Scholar]
- Ecotoxicity of, and remediation with, engineered inorganic nanoparticles in the environment. TrAC Trends Anal. Chem., Charact., Anal. Risks Nanomater. Environ. Food Samples II. 2011;30:507-516.
- [CrossRef] [Google Scholar]
- Surface chemistry of prototypical bulk II−VI and III−V semiconductors and implications for chemical sensing. Chem. Rev.. 2000;100:2505-2536.
- [CrossRef] [Google Scholar]
- CuO/ZnO nanorods: an affordable efficient p-n heterojunction and morphology dependent photocatalytic activity against organic contaminants. J. Alloy. Compd.. 2017;701:562-573.
- [CrossRef] [Google Scholar]
- Sol-gel synthesized hexagonal boron nitride/titania nanocomposites with enhanced photocatalytic activity. Appl. Surf. Sci.. 2019;465:154-163.
- [CrossRef] [Google Scholar]
- In situ synthesis of Z-scheme Ag3PO4/CuBi2O4 photocatalysts and enhanced photocatalytic performance for the degradation of tetracycline under visible light irradiation. Appl. Catal. B. 2017;209:720-728.
- [CrossRef] [Google Scholar]
- Investigation of photocatalytic behavior of l-aspartic acid stabilized Zn(1–x)MnxS solid solutions on methylene blue. Appl. Catal. A. 2014;476:1-8.
- [CrossRef] [Google Scholar]
- Two-step hydrothermally synthesized carbon nanodots/WO3 photocatalysts with enhanced photocatalytic performance. Dalton Trans.. 2017;46:15769-15777.
- [CrossRef] [Google Scholar]
- In situ photopolymerization of pyrrole in mesoporous TiO2. Langmuir. 2010;26:5319-5322.
- [CrossRef] [Google Scholar]
- Liquid Semiconductors. New York: Plenum Press; 1974. p. :159-220.
- One-pot synthesis of a reduced graphene oxide–zinc oxide sphere composite and its use as a visible light photocatalyst. Chem. Eng. J.. 2013;229:126-133.
- [CrossRef] [Google Scholar]
- Nano-photocatalytic materials: possibilities and challenges. Adv. Mater.. 2012;24:229-251.
- [CrossRef] [Google Scholar]
- Surfactant (PEG 400) effects on crystallinity of ZnO nanoparticles. Arab. J. Chem.. 2016;9:507-510.
- [CrossRef] [Google Scholar]
- Overview of carbon nanostructures and nanocomposites for electromagnetic wave shielding. Carbon. 2018;140:696-733.
- [CrossRef] [Google Scholar]
- A room temperature chemical route for large scale synthesis of sub-15 nm ultralong CuO nanowires with strong size effect and enhanced photocatalytic activity. CrystEngComm. 2012;14:5914-5922.
- [CrossRef] [Google Scholar]
- CuO nanoparticle modified ZnO nanorods with improved photocatalytic activity. Chin. Phys. Lett.. 2013;30:046202
- [CrossRef] [Google Scholar]
- Preparation and characteristics of graphene oxide and its thin films. Surf. Coat. Technol. Taiwan Assoc. Coat. Thin Film Technol. (TACT 2011). 2013;231:487-491.
- [CrossRef] [Google Scholar]
- Photocatalytic degradation of dyes over graphene–gold nanocomposites under visible light irradiation. Chem. Commun.. 2010;46:6099-6101.
- [CrossRef] [Google Scholar]
- Long-term antibacterial stable reduced graphene oxide nanocomposites loaded with cuprous oxide nanoparticles. J. Colloid Interface Sci.. 2019;533:13-23.
- [CrossRef] [Google Scholar]
- Transparent amorphous zinc oxide thin films for NLO applications. Opt. Mater.. 2014;37:327-337.
- [CrossRef] [Google Scholar]
- Preparation and photocatalytic activity of hollow ZnO and ZnO–CuO composite spheres. Mater. Lett.. 2012;67:303-307.
- [CrossRef] [Google Scholar]
- Heterostructured TiO2/WO3 nanocomposites for photocatalytic degradation of toluene under visible light. J. Electrochem. Soc.. 2017;164:H1086-H1090.
- [CrossRef] [Google Scholar]
- The reaction thermodynamics during plating Al on graphene process. Materials. 2019;12:330.
- [CrossRef] [Google Scholar]
- Preparation of visible light-driven g-C3N4@ZnO hybrid photocatalyst via mechanochemistry. Phys. Chem. Chem. Phys.. 2014;16:17627-17633.
- [CrossRef] [Google Scholar]
- Hydrothermal preparation of ZnO-reduced graphene oxide hybrid with high performance in photocatalytic degradation. Appl. Surf. Sci.. 2012;258:6204-6211.
- [CrossRef] [Google Scholar]


