

Translate this page into:
Waste marble dust-filled sustainable polymer composite selection using a multi-criteria decision-making technique
⁎Corresponding author. sht@inf.elte.hu (Tej Singh)
-
Received: ,
Accepted: ,
This article was originally published by Elsevier and was migrated to Scientific Scholar after the change of Publisher.
Peer review under responsibility of King Saud University.
Abstract
This research works with the optimal design of marble dust-filled polymer composites using a multi-criteria decision-making (MCDM) technique. Polylactic acid (PLA) and recycled polyethylene terephthalate (rPET)-based composites containing 0, 5, 10, and 20 wt% of marble dust were developed and evaluated for various physicomechanical and wear properties. The results showed that the incorporation of marble dust improved the modulus and hardness of both PLA and rPET. Moreover, a marginal improvement in flexural strength was noted while the tensile and impact strength of the matrices were deteriorating due to marble dust addition. The outcomes of wear analysis demonstrated an improvement in wear resistance up until 10 wt% filler reinforcement, after which the incidence of dust particles peeling off from the matrix was observed, thereby reducing its efficiency. The best tensile modulus of 3.23 GPa, flexural modulus of 4.39 GPa, and hardness of 83.95 Shore D were obtained for 20 wt% marble dust-filled PLA composites. The lowest density of 1.24 g/cc and the highest tensile strength of 57.94 MPa were recorded for neat PLA, while the highest impact strength of 30.94 kJ/m2 was recorded for neat rPET. The lowest wear of 0.01 g was obtained for the rPET containing 5 wt% marble dust content. The experimental results revealed that for the examined criteria, the order of composite preference is not the same. Therefore, the optimal composite was identified by adopting a preference selection index-based MCDM technique. The findings demonstrated that the 10 wt% marble dust-filled PLA composite appears to be the best solution with favorable physical, mechanical, and wear properties.
Keywords
Polylactic acid
Recycled polyethylene terephthalate
Marble dust
Composite
Multi-criteria decision-making
Preference selection index

1 Introduction
In manufacturing industries, the production of wastes or by-products is a prevalent issue. The accumulation of such wastes or by-products contribute to increased pollution, and subsequent incineration or landfilling of these wastes may impact air and water quality (Reghunadhan et al., 2020; Sharma et al., 2022; Tapangnoi et al., 2022). Although material wastage cannot be prevented, the wastes in the form of fibers and particles may be creatively employed in various inventive ways (Subagyo et al., 2022; Billah et al., 2022; Yusop et al., 2022). The utilization of waste and natural resources not only promotes sustainable development by manufacturing innovative products but also helps in environmental protection and resource recycling (Shao et al., 2021; Madni et al., 2021; Deng et al., 2022; Lu et al., 2022; Zhang et al., 2023). The advantages of using waste materials in polymer composites include, but are not limited to, their low cost, lack of reliance on minerals or natural resources, and decrease in incineration or landfilling, which results in lower carbon dioxide emissions (Saleh et al., 2020; Li et al., 2022; Gaur et al., 2022). It should be mentioned that the reuse of waste has a positive impact on the environment (Saleh et al., 2019; Ronkay et al., 2021). For instance, marble is the most used natural stone worldwide, and its global consumption constantly grows. A significant issue when using marble is the by-product formed during its extraction and cutting, the marble dust. A lot of the marble dust that is produced as waste in different marble processing industries is frequently employed in different structural applications (Abenojar et al., 2021; Chaturvedi et al., 2022). As a result, using marble dust in developing polymer composites is widely regarded as an environmentally beneficial method. The use of marble dust in polymeric composites presents several obstacles, including variations in the size and amount of the marble dust and the diverse nature of polymer matrices.
Awad et al. (2020a) and Awad and Abdellatif (2019) explored the impact of marble dust particle size and amount on the mechanical properties of high-density polyethylene (HDPE) and low-density polyethylene (LDPE)-based composites, respectively. For the analysis of particle size (75 μm, 440 μm, 701 μm, and 2300 μm), HDPE was mixed with 50 wt% marble dust while for the analysis of amount (10 to 70 wt%), 701 μm sized marble dust was mixed with HDPE. The study concluded that the flexural strength, bending modulus, and toughness of the composites remain highest for 75 μm sized marble dust-filled samples and were found to decrease with increasing particle size. The bending modulus of HDPE increased gradually with increased marble dust while flexural strength enhanced up until 50 wt% marble dust content, however, strength declined above this amount. To investigate the effect of marble dust on the physical, mechanical, thermal, and wear performance of LDPE-based composites, samples were prepared using a screw extruder by mixing varying amounts (10 to 50 wt%) of 16 μm sized marble dust with LDPE. The thermal stability, wear resistance, flexural strength, bending modulus, and hardness of the composites improved with increased marble dust content but at the cost of increased density, water absorption, and decreased toughness. Awad et al. (2019) and Awad et al. (2020b) studied the effect of marble dust size and amount on the mechanical properties of polypropylene-based composites, respectively. For particle size, 40 wt% marble dust (37, 387, 475, and 1350 μm), and for amounts, varying proportions (10 to 70 wt%) of 387 μm sized marble dust was embedded into polypropylene. The flexural strength, bending modulus, hardness, elastic modulus, and toughness of the composites were observed to reduce with increased marble dust particle size. The highest flexural strength and hardness were noted for the composites having 40 wt% and 60 wt% marble dust content, respectively, while the composite reinforced with 50 wt% marble dust displayed the highest values for compressive strength and modulus. The impact of marble dust particle size (greater than150 µm and < 150 µm) and amount (5 to 25 wt%) on the mechanical characteristics of polyethylene terephthalate (PET)-based composites was investigated by Çınar and Kar (2018). It was claimed that the bending strength and stiffness of PET increased with increasing marble dust content, and remained superior to composites that contained marble dust particles of < 150 µm in size. Soydal et al. (2018) investigated the impact of reinforcing marble dust (<63 µm) in epoxy resins. Tests were conducted to study the effect of different concentrations of marble dust (10, 20, and 30 wt%) on the mechanical properties of epoxy composites. The results showed that as marble dust concentration increased, elastic modulus and hardness of the composites increased while elongation at break decreased. The epoxy composite loaded with 20 wt% marble dust exhibited the highest tensile strength. Another study carried out by Choudhary et al. (2019) attempted to explore the effect of marble dust (10 to 30 wt%) with particle sizes between 75 and 100 µm on the physical, mechanical, dynamic mechanical, and erosive wear performance of glass fiber reinforced epoxy composites. The consistent addition of marble dust was found to enhance the composites' density, crystallinity, hardness, and corrosion resistance. The evaluated mechanical properties such as tensile strength and failure strain were found to decrease with increasing marble dust percentage, whereas the composite with a 20 wt% marble dust recorded the greatest values for tensile modulus, flexural strength, flexural modulus, and storage modulus. Nayak and Satapathy (2020) conducted a comprehensive analysis of the effect of marble dust particle size (58 µm, 110 µm, and 155 µm) and quantity (0 to 40 wt%) on the mechanical properties of polyester-based composites. It was observed that the hardness, compressive strength, and impact energy of the fabricated composites enhanced with both marble dust amount and size. The tensile strength and flexural strength were found to decrease, while the elastic modulus was found to increase with increasing marble dust concentration and all remained best for composite with marble dust of 58 µm in size. Sharma et al. (2021) examined the influence of marble dust (∼10 µm in size) on the resultant mechanical characteristics of jute fiber-reinforced epoxy-based composites. Varying amounts of marble dust were mixed with epoxy resin at varying weight percentages (0, 8, 16, and 24 wt%). The results showed that the hardness, elastic modulus, flexural modulus, flexural, compressive and impact strength of the composites improved, while a continuous decrease in tensile strength was noted with an increase in the marble dust content.
Although marble dust-filled polymer composites have many advantages, including low weight with excellent mechanical and wear performance, their best use in specialized applications still requires developing innovative design techniques, accurate prediction tools, and numerical modeling. Manufacturers often use a trial-and-error strategy by changing design parameters to prevent failures. Additionally, conflicting and interdependent performance criteria are usually considered when selecting polymer composite designs. Recent studies have shown that the implementations of the ‘multi-criteria decision-making’ (MCDM) methodologies are necessary to determine the optimal polymer composite that can meet a variety of performance criteria to exemplify the complexities in overall design selection (Alemi-Ardakani et al., 2016; Singh, 2021a; Singh, 2021b). Several MCDM methods, including SAW, MOORA, MEW, COPRAS, VIKOR, WASPAS, and many more, have been used successfully to design polymer composites (Poongavanam et al., 2021; Singh, 2021c; Oroujzadeh et al., 2022; Singh et al., 2022; Soni et al., 2022). Even though several MCDM methods were available in the literature to assist designers in selecting the best composite, it was discovered that the alternative ranking was affected by the criterion weight in some of these methods, while others were quite challenging to comprehend and difficult to use, necessitating extensive mathematical knowledge. Therefore, a rational, systematic, and straightforward approach is still needed to overcome the composite selection issues. The preference selection index (PSI) technique is more specific to understand than any other MCDM method since there is no consideration of the relative relevance of the criteria, and the total preference value is determined by utilizing the statistical notion (Maniya and Bhatt, 2010). The PSI approach is beneficial because it requires less numerical computations and no need for criterion weight. It also aids in evaluating the best choice when determining the relative value of the various criteria (Attri and Grover, 2015).
Therefore, in the present research work, marble dust-filled PLA and rPET composites fabricated and tested for their physical (density), mechanical (tensile, flexural, hardness, and impact), and sliding wear characteristics in our previous studies have been used. Choosing the optimal composite was challenging since each composite performed differently for the examined properties. As a result, in this work, the PSI-based MCDM technique is presented to select the optimal composite with the maximum degree of satisfaction for all examined properties, which was then also validated with several other MCDM methods.
2 Experimental
2.1 Materials
The PLA (type Ingeo 2003D; Nature Works, USA) and rPET (Fe-Group Invest Zrt. Budapest, Hungary) granules were used as matrix material. The density and intrinsic viscosity of rPET are 1.33 g/cc and 0.8 dl/g while the melt flow index, melting temperature, and density of PLA are 6 g/10 min, 170 °C, and 1.24 g/cc, respectively. The waste marble dust was supplied by Taj Granites Private ltd. (Jaipur, India) with specified particle size (10 ± 5 µm; Fig. 1a) and density (2.68 g/cc). The various properties of PLA, rPET, and marble dust were presented in our earlier research (Lendvai et al., 2021; Lendvai et al., 2022).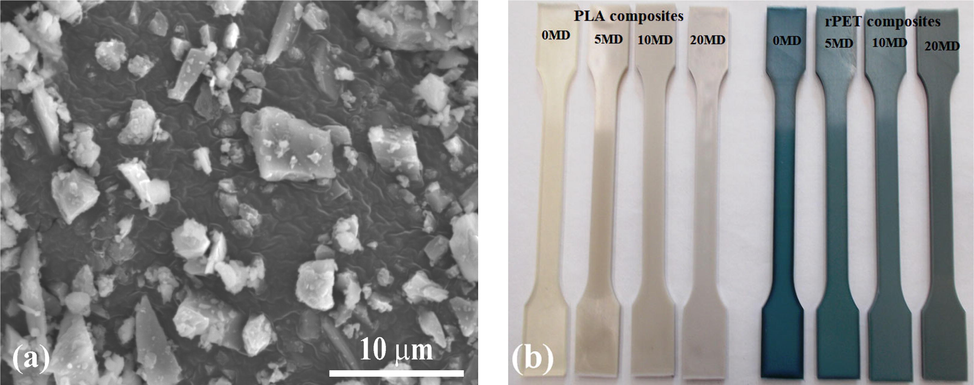
(a) Scanning electron microscopic image of marble dust and (b) the fabricated composite specimens.
2.2 Composite fabrication and alternative selection
In total, eight composite alternatives were fabricated by replacing PLA or rPET with 0, 5, 10, and 20 wt% marble dust in such a way that the total amount remains 100 % by weight as presented in Table 1. Composite fabrication was initiated by drying the marble dust, and the PLA, and the rPET granules using a DEGA-2500 dehumidifier. After that, the composites were manufactured by melt compounding and injection molding. The samples were melt compounded by utilizing a Labtech LTE 20–44 type co-rotating twin-screw extruder (Samut Prakarn, Thailand) at a rotational speed of 30 rpm. The diameter of the screws was 20 mm, while the L/D ratio was 44. From feeder to die, the temperature of the extruder barrel ranged from 155 to 185 °C, and 250–280 °C for PLA and rPET matrices, respectively.
Ingredients
Composition (wt.%) of alternatives
PLA_0MD
PLA_5MD
PLA_10MD
PLA_20MD
rPET_0MD
rPET_5MD
rPET_10MD
rPET_20MD
PLA
100
95
90
80
0
0
0
0
rPET
0
0
0
0
100
95
90
80
Marble dust
0
5
10
20
0
5
10
20
Before injection molding, the extruded strings were pelletized and dried. After that, the extruded pellets were molded into specimens using an injection molding machine (Arburg Allrounder Advance 420C; Lossburg, Germany) with 35 mm of screw diameter. For rPET composites, the following molding conditions were applied: melt temperature = 275 °C, injection rate = 65 cm3/s, holding pressure for 15 s = 85–60-25 MPa, mold temperature = 35 °C, and cooling time = 30 s. While for PLA composites, the molding conditions were, melt temperature = 195 °C, injection rate = 40 cm3/s, holding pressure for 15 s = 75–65-25 MPa, mold temperature = 35 °C and cooling time = 30 s. The fabricated marble dust-filled composites are presented in Fig. 1b.
Fig. 2 depicts the surface morphology (SEM images) and dispersion of marble dust particles in PLA composites with varying weight percentages. In Fig. 2 (a, c, and e), the white patches absorbed into the matrix material were recognized as the marble dust domains. The distribution map may be used to examine the dispersion of marble dust's characteristic elements (Ca, Mg, Si). The EDS (energy dispersive spectroscopy) results (Fig. 2b, d, f) likewise indicated that the marble dust's characteristic elements are largely concentrated in those white patches. A homogeneous dispersion of marble dust was apparently accomplished for composites, suggesting adequate shear stresses during melt compounding. However, in addition to the well-dispersed particles, a growing number of larger white domains emerged at higher concentrations, indicating intense agglomeration of the marble dust particles. This was notably obvious in composite sample rPET_20MD, which contained 20 wt% marble dust.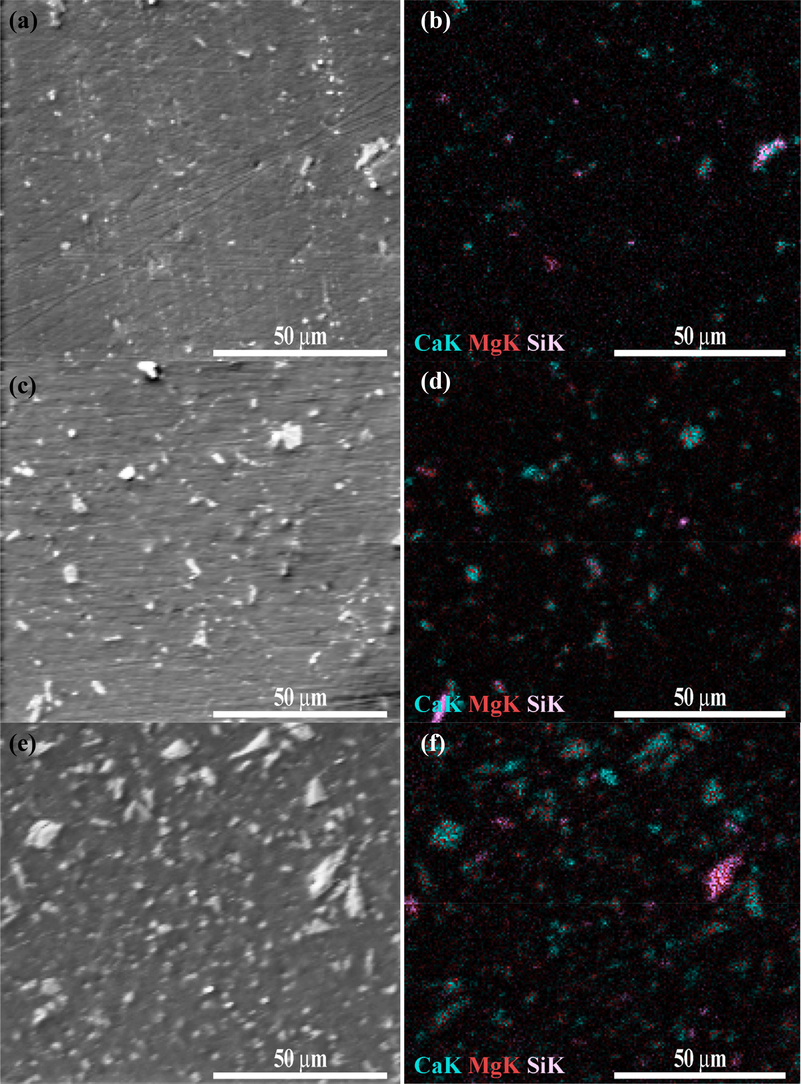
SEM-EDS images for samples (a, b) rPET_5MD, (c, d) rPET_10MD, (e, f) rPET_20MD.
2.3 Measurements and criteria selection
The waste marble dust-filled PLA and rPET composites were characterized for various properties including density, modulus (tensile and flexural), strength (tensile, flexural, and impact strength), and wear resistance. The measured properties were selected as the performance criteria in the optimization process. The detailed explanation of the considered criteria and their performance implication is given in Table 2.
Criteria
Implication
Explanation
C-1: Tensile strength (MPa)
Higher-is-better
For tensile strength and modulus, as-fabricated dogbone specimens (170 × 10 × 4 mm3) were tested on an Instron 5582 type universal testing machine following EN-iSO-527 protocol (with crosshead speed = 5 mm/min; clamping distance = 100 mm).
C-2: Tensile modulus (GPa)
Higher-is-better
C-3: Flexural strength (MPa)
Higher-is-better
For flexural strength and modulus, composite specimens (80 × 10 × 4 mm3) were tested on an Instron 5582 type universal testing machine following EN-iSO-178 protocol (with crosshead speed = 5 mm/min; span length = 64 mm).
C-4: Flexural modulus (GPa)
Higher-is-better
C-5: Impact strength (kJ/m2)
Higher-is-better
For impact strength, unnotched composite samples (80 × 10 × 4 mm3) were tested on Ceast 6545 impact testing machine (impact energy = 2 J; bearing distance = 62 mm) following EN-iSO-179 protocol.
C-6: Hardness (Shore D)
Higher-is-better
The hardness of composite specimens was calculated with Type D Durometer (PTC Instruments, USA).
C-7: Density (g/cc)
Lower-is-better
For density measurements, the Archimedes principle was used.
C-8: Wear (g)
Lower-is-better
For sliding wear measurements, composite specimens (20 × 5 × 5 mm3) were tested on a TR-20 LE pin-on-disc test rig (TR-411, DUCOM, India) following ASTM G-99 protocol. The tests were conducted for sliding velocity = 4 m/s, load = 30 N, track diameter = 120 mm, and sliding distance = 1500 m. The wear was recorded as weight loss (g) before and after the test.
3 Optimization methodology
3.1 PSI methodology
The following steps outline the description of the algorithm used in the proposed PSI methodology (Maniya and Bhatt, 2010; Attri and Grover, 2015):
Step I: Alternatives and criteria selection
This step identified the number of composite alternatives and different performance evaluation criteria.
Step II: Observation matrix construction
After identifying the alternatives and criteria, an observation matrix is structured. For a set of alternatives
compared with a set of criteria
, the observation matrix can be obtained as follows;
Step III: Construction of normalized observation matrix
The observation matrix is normalized according to the implication of the selected criteria (higher-is-better/lower-is-better) as:
Step IV: Determination of the mean value of the criteria
The following equation calculates the mean value of each criterion’s normalized data;
Step V: Determination of preference variation value
In this step of the process, the preference variation value (
) is calculated for an individual criterion by using the following formula;
Step VI: Determination of deviation in preference variation value
In this step, by applying the following formula the deviation from the preference variation value (
) for each criterion is evaluated;
Step VII: Calculation of overall preference value
In this step, the overall preference value (
) is evaluated for each criterion by utilizing the following formula;
Step VIII: Determination of preference selection index
The final step involves calculating the preference selection index (
) for each alternative using the following formula;
The final step is to order the alternatives based on their values, with the highest value ranked first and the ones with the lowest value ranking last.
3.2 Rank validation
For rank validation, the results of the PSI methodology were compared with other MCDM tools such as the Taxonomy approach (Alinezhad and Khalili, 2019), MEW (Singh, 2021c), WASPAS (Soni et al., 2022), MOORA (Poongavanam et al., 2021), SAW (Singh, et al., 2022), VIKOR (Chauhan and Kim, 2019), and COPRAS (Oroujzadeh et al., 2022). Apart from the Taxonomy approach, an equal weight (0.125) was assigned to each criterion for ranking analysis.
4 Results and discussion
4.1 Influence of marble dust on evaluated criteria
Table 3 and Figs. 3-6 illustrate the results of the fabricated composites in accordance with the selected criteria listed in Table 2. Although both PLA and PET are polyesters, they demonstrate distinguished behavior and possess vastly different structures. PET is aromatic polyester that has a benzene ring embedded in each of the repeating units. On the contrary, PLA is entitled as aliphatic polyester that contains a small pendent methyl group. These groups prevent rotation, reduce the degree of order, and so prevent crystallization. PET chains are often arranged linearly, whereas PLA molecules have the propensity to take on a helical shape. These result in a lower density of PLA along with higher strength and modulus properties compared to PET (Rawal, 2011; Papong et al., 2014).
Composite alternatives
C-1: Density (g/cc)
C-2: Tensile strength (MPa)
C-3: Tensile modulus (GPa)
C-4: Flexural strength (MPa)
C-5: Flexural modulus (GPa)
C-6: Impact strength (kJ/m2)
C-7: Hardness (Shore D)
C-8:
Wear (g)
PLA_0MD
1.240±0.002
57.94±0.25
2.56±0.04
99.50±0.21
3.43±0.02
15.30±1.66
82.49±1.99
0.042±0.003
PLA_5MD
1.268±0.002
53.80±0.58
2.73±0.04
99.70±2.32
3.50±0.09
17.60±1.23
82.67±1.98
0.032±0.002
PLA_10MD
1.302±0.003
53.09±0.71
2.89±0.04
102.1±0.93
3.83±0.07
20.90±0.92
83.57±0.89
0.017±0.002
PLA_20MD
1.374±0.004
50.97±0.95
3.23±0.06
98.50±0.40
4.39±0.08
16.70±2.16
83.95±0.81
0.044±0.002
rPET_0MD
1.330±0.003
53.17±2.75
1.97±0.06
92.01±0.12
2.65±0.01
30.94±1.65
77.28±1.19
0.030±0.003
rPET_5MD
1.360±0.003
54.29±0.85
2.34±0.08
97.73±0.79
2.93±0.03
15.49±2.70
78.16±0.87
0.010±0.001
rPET_10MD
1.398±0.003
52.05±0.73
2.51±0.03
96.66±0.15
3.20±0.01
16.13±1.27
79.27±0.53
0.021±0.001
rPET_20MD
1.472±0.004
49.26±1.06
2.82±0.03
94.12±1.10
3.50±0.02
13.15±1.92
79.31±0.48
0.032±0.002
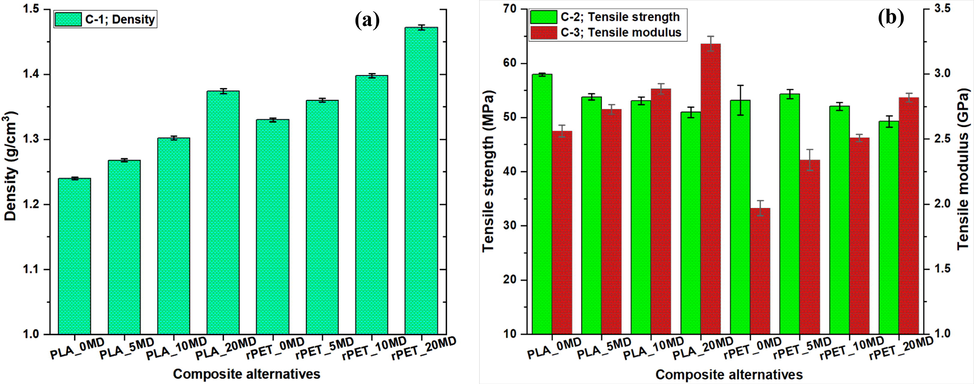
Variation of (a) C-1: Density, and (b) C-2: Tensile strength; C-3: Tensile modulus.
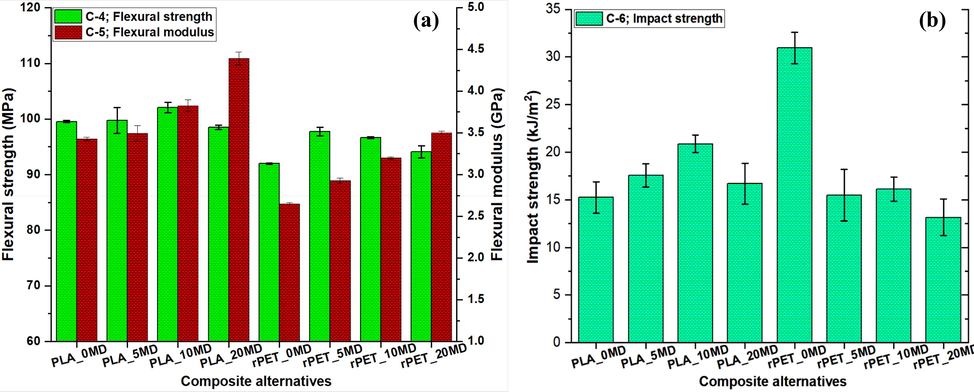
Variation of (a) C-4: Flexural strength; C-5: Flexural modulus, and (b) C-6: Impact strength.
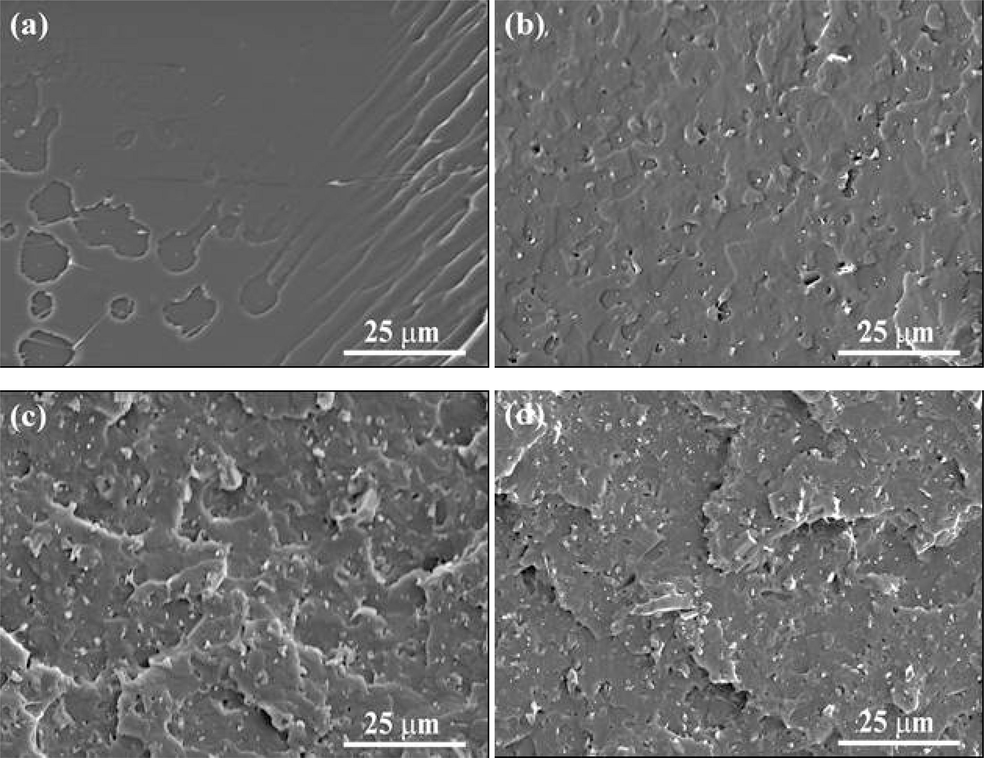
Fracture surfaces morphology of samples (a) PLA_0MD, (b) PLA_5MD, (c) PLA_10MD, and (d) PLA_20MD.
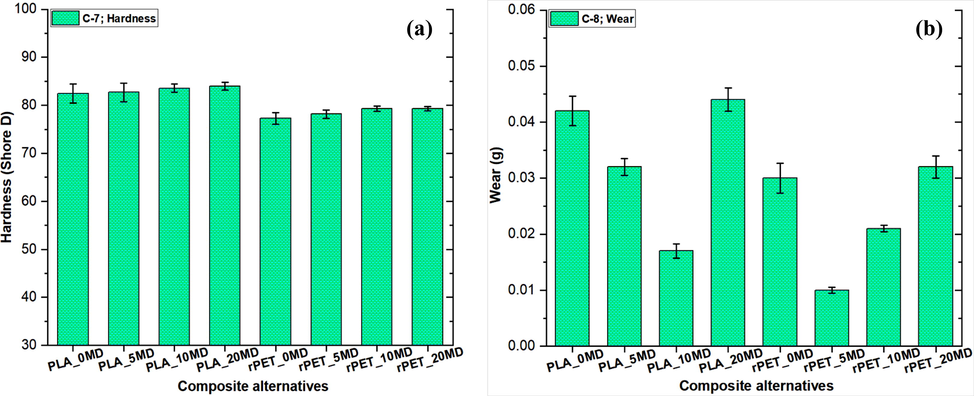
Variation of (a) C-7: Hardness, and (b) C-8: Wear.
The density (criteria C-1, Fig. 3a) of PLA/rPET-based composites increases with an increase in marble dust content. This increase in density can be related to the fact that the marble dust particles used as reinforcement were heavier in comparison to PLA/rPET polymer. The tensile strength (criteria C-2, Fig. 3b) values were found to decrease with increased marble dust content except for alternative rPET_5MD (i.e. rPET with 5 wt% marble dust). When compared to pure rPET, the inclusion of 5 wt% of marble dust resulted in a marginal relative increase of 2 % in tensile strength, and decreased by 2–7 % with further marble dust loading and remains lowest (49.26 MPa) for alternative rPET_20MD having rPET with 20 wt% marble dust content. For pure PLA (PLA_0MD) the tensile strength remains highest (57.94 MPa) and decreased gradually with increased marble dust loading. The uneven shape of the filler particles, which operate as stress concentration sites inside the polymer matrix may be to blame for an early failure and the decrease in strength observed at larger marble dust loading (Pawar et al., 2016). Additionally, the polymer matrix during melt compounding probably did not adequately penetrate all the potential particle agglomerations at high loading, leading to an inadequate matrix/filler interaction, which may eventually contribute to a drop in composite tensile strength (Nayak and Satapathy, 2020).
The tensile strength of PLA_20MD was 50.97 MPa, which was almost 12 % lower compared to PLA_0MD. Meanwhile, the tensile strength of rPET_20MD was 49.26 MPa, almost ∼ 7 % lower compared to that of rPET_0MD. Studying the effect of 58 µm-sized marble dust on the mechanical performance of polyester composites, Nayak and Satapathy (2020) also reported a decrease in tensile strength, in their case about 13 % for the addition of 24 wt% marble dust content. Moreover, it was reported in the literature that inorganic reinforcing fillers having a particulate size greater than 0.1 μm are liable to degrade and weaken the matrix material because of insufficient interfacial adhesion and particle agglomeration (Fu et al., 2008). A linear improvement in the tensile modulus (criteria C-3, Fig. 3b) of PLA and rPET composite is noticed with the enhanced filler incorporation, accomplishing a maximum improvement of 26 % and 43 % for alternatives PLA_20MD (PLA + 20 wt% marble dust) and rPET_20MD (rPET + 20 wt% marble dust), respectively. This phenomenon is appertaining to the development of hard interfaces inside the polymer matrix in the presence of minute inorganic additions with high stiffness, such as marble dust. The tensile modulus of all marble dust-containing composites showcased higher values compared to base polymers while the tensile strength remained nearly higher than 50 MPa suggesting that this waste can be effectively utilized in developing polymer composites in order to replace the matrix without causing any damage in this regard. Similar results for increased tensile modulus were reported with increased marble dust content-filled polymeric composites (Awad et al., 2019; Nayak and Satapathy, 2020) in the literature. The PLA and rPET composites showed almost similar values for tensile strength at fixed marble dust loading but there was a marked difference in tensile modulus. In comparison, the tensile modulus of PLA composites was found to be ∼ 15 % higher as compared to that of rPET composites at fixed loading of marble dust.
As can be observed in Fig. 4, the increasing amount of marble dust improved the flexural strength (criteria C-4, Fig. 4a) of the composites from 0 to 10 wt% for PLA and from 0 to 5 wt% for rPET, and subsequently, both polymers showed a declining trend with more filler loading. The flexural strength of pure PLA and rPET were found 99.5 MPa (for alternative PLA_0MD) and 92.01 MPa (for alternative rPET_0MD), respectively. Alternative rPET_10MD had the maximum flexural strength of 102.10 MPa for PLA-based composites, whereas alternative rPET_5MD had the highest flexural strength of 97.73 MPa for rPET-based composites. The flexural modulus (criteria C-5, Fig. 4a) and marble dust concentration were shown to be linearly related. For alternatives PLA_0MD and rPET_0MD, the flexural modulus of pure PLA and rPET were determined to be 3.43 GPa and 2.65 GPa, respectively. For both PLA and rPET-based composites, the largest values of flexural modulus were recorded at 20 wt% marble dust-loaded composites i.e., for alternative PLA_20MD and rPET_20MD, respectively. The reported flexural modulus trend may be appertaining to ductility loss caused by extremely brittle filler particles and is consistent with the tensile test findings and available literature (Awad and Abdellatif, 2019; Awad et al., 2020a). While studying the effect of 16 μm size marble dust loading on the mechanical performance of LDPE, Awad and Abdellatif (2019) reported a ∼ 4 % increase in bending modulus with the addition of 20 wt% marble dust. Furthermore, for a fixed loading of marble dust, the flexural strength and modulus of PLA-based composites were found to be higher than those of rPET-based composites. The flexural strength of PLA composites was found to be relatively 2 %, 6 %, and 5 % higher than that of rPET composites for 5 wt%, 10 wt%, and 20 wt% marble dust loading, respectively. Whereas, compared to rPET, the flexural modulus of PLA composites was found to be ∼ 20 % higher at ≤ 10 wt% marble dust and 26 % higher at 20 wt% marble dust loading.
For PLA and rPET-based composites, different trends in impact strength (criteria C-6, Fig. 4b) were seen. As shown in Fig. 4b, the impact strength of the PLA composites increases as marble dust loading increases from 0 to 10 wt% and subsequently falls as filler loading increases. The composite alternatives PLA_10MD and PLA_0MD for PLA composites had the highest (20.90 kJ/m2) and lowest (15.30 kJ/m2) values of impact strength, respectively. The crack deflection surrounding the filler particles and energy dissemination in the damage region are the primary factors that contribute to this type of increase in impact strength in composites with stiffer reinforcements (Fu et al., 2008).
SEM measurements were used to further evaluate the impact strength performance of the marble dust-filled PLA composites and presented in Fig. 5. The pure PLA micrograph (Fig. 5a) exhibits a smooth surface, but the other marble dust/PLA composites (Fig. 5b-d) reveal corrugated fracture surfaces with uneven cracks. The load transfer from PLA to the marble dust particles caused the composite to shatter. Due to the smaller particle size and strong compatibility characteristics of marble dust particles with PLA, the lower content (10 wt%) was evenly diffused and firmly lodged in the PLA. These factors account for the increased impact strength of marble dust/PLA composites. Aside from the well-dispersed particles, a growing number of bigger white domains occurred at greater marble concentrations (∼20 wt%), indicating extensive particle agglomeration. Particle agglomeration is often considered detrimental to the mechanical characteristics of composites because the lower interfacial surface area of fillers reduces their strengthening efficacy. Similar results, namely increased impact strength of PLA with fillers like silicon carbide and calcium carbonate were reported by Yao et al. (2016) and Aliotta et al. (2019). Pure rPET (alternative rPET_0MD) has an impact strength of 30.94 kJ/m2; however, it lowers significantly to 14.64 ± 1.49 kJ/m2 for composites containing ≥ 5 wt% marble dust. The impact strength/toughness drop of rPET caused by the amalgamation of hard marble dust particles is consistent with previous research, and is mostly due to poor adherence of inorganic particles in the polymer matrix. Similar results for lower impact strength of rPET with fly ash and talc fillers were reported in the literature (Sharma and Mahanwar, 2010; Yamada and Thumsorn, 2013). According to Yamada and Thumsorn (2013), the impact strength of E-GMA blended rPET reduces dramatically from ∼ 35 kJ/m2 to ∼ 4 kJ/m2 with the addition of 20 wt% talc content. The detrimental effect on impact strength with increased rigid fillers was ascribed to the incompatibility of filler with the rPET matrix. As stress concentration locations, poorly bonded filler particles cause gaps in the composites. These vacancies cause micro-cracks to form upon impact and make it easier for cracks to spread, which eventually weakens the impact strength of the composites. Increased concentration may cause marble dust particles to aggregate, which can lead to structural inhomogeneities and a decline in the examined composites' strength performance. The impact strength of PLA-based composites was found to be relatively 13 %, 29 %, and 27 % higher than that of rPET composites at 5 wt%, 10 wt%, and 20 wt% marble dust loading, respectively. The overall mechanical performance of rPET-based composites remained lower than that of PLA composites, and this can be attributed to the recycling process of PET, which undergoes thermal and hydrolytic degradation, resulting in a decrease in molecular weight and thus, its mechanical properties decrease (Nait-Ali et al., 2011; Makkama and Harnnarongchai, 2014).
Furthermore, a linear correlation between hardness (criteria C-7, Fig. 6a) and marble dust concentration was found. For alternative PLA_0MD, the hardness of pure PLA was determined to be 82.49 Shore D, while for alternative rPET_0MD (i.e. pure rPET), it was found to be 77.28 Shore D. The hardness of PLA_20MD was largest with a value of 83.95 Shore D, which is about 2 % higher compared to PLA_0MD. The hardness of rPET_20MD was found to be 79.31 Shore D, which is ∼ 3 % higher compared to that of rPET_0MD. The inclusion of hard marble dust particle that increase the polymer matrix's resistance to plastic deformation, is likely the cause of the PLA/rPET composites' increased hardness (Awad et al., 2019). Awad and Abdellatif (2019) reported an enhancement of ∼ 5 % in Shore D hardness of LDPE by adding 20 wt% of 16 μm sized marble dust content, while Nayak and Satapathy (2020) observed a relative enhancement of ∼ 7 % in Shore D hardness of polyester by adding 16 wt% of 58 μm sized marble dust content.
Fig. 6b depicts the wear (criteria C-8) behavior of the examined PLA and rPET composites. As shown in Fig. 6b, increasing the quantity of marble dust from 0 to 10 wt% for PLA, and 0 to 5 wt% for rPET composites results in a decrease in wear, and subsequently wear increases with further inclusion of marble dust content. Pure PLA and rPET wear were determined to be 0.042 g (for alternative PLA_0MD) and 0.030 g (for alternative rPET_0MD), respectively. By adding 10 wt% marble dust content, the wear of PLA was reduced by 60 % and stayed 0.017 g for the PLA_10MD alternative. For pure rPET, the wear was measured at 0.030 g, and it fell by 67 % to the lowest value of 0.01 g for option rPET_5MD, which contained 5 wt% marble dust. The softening process and mechanical failure produce poor wear performance of neat rPET and PLA, resulting in more weight loss when sliding. The polymer matrix and the marble dust particles rubbed and slid together when marble dust particles (≤10 wt%) were introduced. The added marble dust particles allowed the rPET and PLA matrices to endure greater deformation during sliding and prevent matrix removal. Similar results, namely increased wear resistance of LDPE and polyester composites were reported in the literature (Awad and Abdellatif, 2019; Nayak et al., 2020). Awad and Abdellatif (2019) concluded that the weight loss of LDPE composites decreases from 0.43 % to 0.03 % by changing the marble dust content from 0 to 50 wt%. Conversely, in the current study, the wear was observed to get worse when higher marble dust (20 wt%) was added. Marble dust particles may agglomerate and have an uneven distribution if the filler concentration is higher, resulting in increased wear during sliding. Similar results for decreased wear resistance with increased inorganic filler particles (greater than10 wt%) were reported in the literature (Liu et al., 2019; Gangil et al., 2022). Additionally, as seen in Fig. 5, there is a larger buildup of marble dust particles on the surface of the produced composites. These marble dust particles therefore readily detached from the matrix, affecting wear performance.
In Fig. 7, single-objective optimization is used to rank the composite alternatives based on a single characteristic at a time. Notably, for every-two examined criteria, the order of composite preference is not the same. An MCDM technique is absolutely necessary in order to choose the best composite alternative since the preference disorder causes conflict in the composite selection process. In order to select the best composite among the alternatives, the PSI approach is therefore suggested.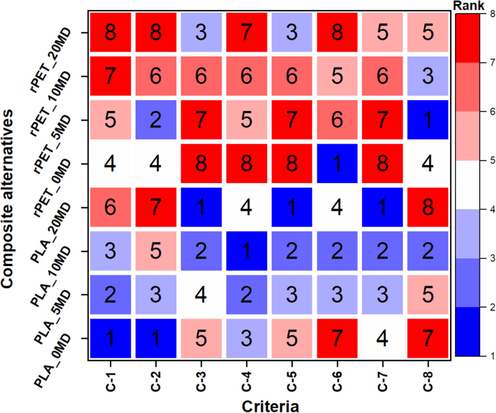
The ranking order of alternatives based on individual criteria (i.e., single criteria optimization).
4.2 Ranking analysis
The PSI method is employed to optimize the findings acquired from the various characterizations to designate the optimal composite. The PSI technique structured the alternatives and the selected criteria, organized them in an observation matrix form as described in Eq. (1) and presented in Table 4.
Alternatives
C-1
C-2
C-3
C-4
C-5
C-6
C-7
C-8
PLA_0MD
1.240
57.94
2.56
99.50
3.43
15.30
82.49
0.042
PLA_5MD
1.268
53.80
2.73
99.70
3.50
17.60
82.67
0.032
PLA_10MD
1.302
53.09
2.89
102.1
3.83
20.90
83.57
0.017
PLA_20MD
1.374
50.97
3.23
98.50
4.39
16.70
83.95
0.044
rPET_0MD
1.330
53.17
1.97
92.01
2.65
30.94
77.28
0.030
rPET_5MD
1.360
54.29
2.34
97.73
2.93
15.49
78.16
0.010
rPET_10MD
1.398
52.05
2.51
96.66
3.20
16.13
79.27
0.021
rPET_20MD
1.472
49.26
2.82
94.12
3.50
13.15
79.31
0.032
Thereafter, according to the implication of the criteria (higher-is-better/lower-is-better) the observation matrix was normalized by employing Eq. (2) and showcased in Table 5. After normalization, the mean values for the selected criteria were calculated using Eq. (3) and listed in Table 5. For example, the mean of the first and last criteria with respect to eight alternatives is determined as follows:
Alternatives
C-1
C-2
C-3
C-4
C-5
C-6
C-7
C-8
PLA_0MD
1.000
1.000
0.792
0.975
0.780
0.493
0.983
0.238
PLA_5MD
0.978
0.928
0.844
0.977
0.796
0.568
0.985
0.313
PLA_10MD
0.952
0.916
0.893
1.000
0.871
0.675
0.995
0.588
PLA_20MD
0.902
0.880
1.000
0.965
1.000
0.539
1.000
0.227
rPET_0MD
0.932
0.918
0.609
0.902
0.603
1.000
0.921
0.333
rPET_5MD
0.912
0.937
0.723
0.958
0.667
0.501
0.931
1.000
rPET_10MD
0.887
0.898
0.776
0.947
0.729
0.521
0.944
0.476
rPET_20MD
0.842
0.850
0.872
0.922
0.797
0.425
0.945
0.313
Mean values of criteria
7.405
7.327
6.509
7.646
6.243
4.722
7.704
3.488
0.926
0.916
0.814
0.956
0.780
0.590
0.963
0.436
After identifying the mean values, the preference variation values (
) for the selected criteria were determined using Eq. (4) and listed in Table 6. For example, the preference variation value for the first and last criteria with respect to eight alternatives is determined as follows:
C-1
C-2
C-3
C-4
C-5
C-6
C-7
C-8
0.0182
0.0136
0.0973
0.0070
0.1039
0.2277
0.0068
0.4666
0.9974
0.9981
0.9861
0.9990
0.9852
0.9675
0.9990
0.9333
0.1268
0.1269
0.1254
0.1270
0.1252
0.1230
0.1270
0.1187
After that, the deviation in preference variation value ( ) was computed using Eq. (5) and provided in Table 6. For example, the deviation in preference variation value for the first and last criteria is determined as follows:
After finding the deviation in preference variation, the overall preference value ( ) was determined using Eq. (6) and listed in Table 6. For example, the overall preference value for the first and last criteria is determined as follows:
Once the overall preference for the chosen criteria was determined, the ranking was established by calculating a preference score for the individual composite alternatives using Eq. (7) and listed in Table 7. For example, the preference score for the first and last alternatives is determined as follows:
PLA_0MD
PLA_5MD
PLA_10MD
PLA_20MD
rPET_0MD
rPET_5MD
rPET_10MD
rPET_20MD
Preference score
0.7882
0.8035
0.8642
0.8194
0.7806
0.8289
0.7758
0.7503
Rank
5
4
1
3
6
2
7
8
The composite alternative, which attained the highest preference score value have been placed in the first position (rank 1), and so on. It has been noticed from Table 7, that the preference score for alternative PLA_10MD is the highest (0.8642); this indicates that it is the best choice out of all the available alternatives. Though, it is succeeded by rPET_5MD (0.8289), PLA_20MD (0.8194), and PLA_5MD (0.8035). Alternatives rPET_10MD and rPET_20MD exhibited the least preferred performances with a preference score of 0.7758 and 0.7503, respectively.
4.3 Rank validation with other MCDM methods
Additionally, the ranking results obtained with the PSI methodology were compared with the results obtained using the Taxonomy approach, MEW, WASPAS, MOORA, SAW, VIKOR, and COPRAS exhibited in Fig. 8. Among all the adopted MCDM approaches, the alternative PLA_10MD was ranked at the top of the ranking order, while rPET_20MD was ranked last. As evident from Fig. 8, the ranking of composites with different MCDM approaches was found to be different. Therefore, the Spearman correlation coefficient was calculated using the following formula (Eq. (8).) to estimate the statistical significance of the difference in ranks achieved by different MCDM methods (Poongavanam et al., 2021);
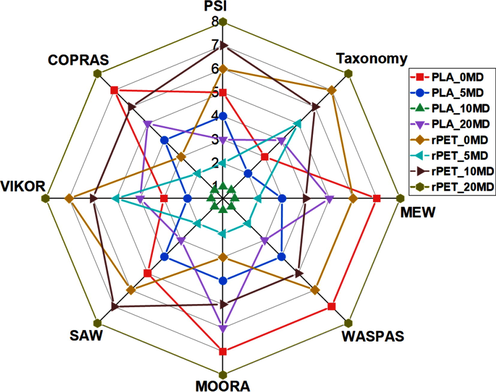
Composite alternatives ranking in various MCDM methods.
Here, represents the alternative and represents the rank difference between the PSI and other MCDM methods.
It was discovered that the PSI and other MCDM techniques had a correlation value larger than 0.70, indicating a strong correlation (Poongavanam et al., 2021). As a result, it is feasible to draw the conclusion that the proposed ranking is reliable and valid.
5 Conclusions
The physical, mechanical, and sliding wear properties of polylactic acid (PLA)-, and recycled polyethylene terephthalate (rPET)-based composites filled with marble dust (0, 5, 10, and 20 % by weight) were investigated. The addition of marble dust to PLA and rPET resulted in the increase of hardness, flexural strength, tensile and flexural modulus of the composites. Increment in the marble dust content in the PLA and rPET led to a decrease in the tensile and impact strength of the composites. The wear of the PLA and rPET composite decreased at lower marble dust (≤10 wt%) loading and increased with further addition of marble dust. It was found that the order of composite preference is not the same for the examined properties, which shows the highest level of conflict in picking the best alternative. Therefore, a preference selection index-based multi-criteria decision-making technique was used for selecting the best composite. According to the findings, the PLA-based composite with 10 wt% marble dust demonstrated the most desirable qualities. Comparison with other decision-making methods, such as the Taxonomy approach, MEW, WASPAS, MOORA, SAW, VIKOR, and COPRAS showed the reliability and robustness of the obtained composite rankings.
Declaration of Competing Interest
The authors declare that they have no known competing financial interests or personal relationships that could have appeared to influence the work reported in this paper.
References
- Abenojar, J., Martínez, M.A., Armentia, S.L.de., Paz, E., Real, J.C. del, Velasco, F., 2021. Mechanical properties and fire-resistance of composites with marble particles. Journal of Materials Research and Technology 12, 1403-1417.
- On the effect of subjective, objective and combinative weighting in multiple criteria decision making: A case study on impact optimization of composites. Expert Syst. Appl.. 2016;46:426-438.
- [Google Scholar]
- Alinezhad, A., Khalili, J., 2019. “New Methods and Applications in Multiple Attribute Decision Making (MADM),” International Series in Operations Research and Management Science, Springer, number 978-3-030-15009-9.
- Rigid filler toughening in PLA-Calcium Carbonate composites: Effect of particle surface treatment and matrix plasticization. Eur. Polym. J.. 2019;113:78-88.
- [Google Scholar]
- Application of preference selection index method for decision making over the design stage of production system life cycle. Journal of King Saud University - Engineering Sciences. 2015;27:207-216.
- [Google Scholar]
- Assessment of mechanical and physical properties of LDPE reinforced with marble dust. Compos. B Eng.. 2019;173:106948
- [Google Scholar]
- Mechanical behavior of PP reinforced with marble dust. Constr. Build. Mater.. 2019;228:116766
- [Google Scholar]
- Assessment of mechanical properties of HDPE composite with addition of marble and granite dust. Ain Shams Eng. J.. 2020;11:1211-1217.
- [Google Scholar]
- The influence of adding marble and granite dust on the mechanical and physical properties of PP composites. J. Therm. Anal. Calorim.. 2020;140:2615-2623.
- [Google Scholar]
- Shellfish waste-derived mesoporous chitosan for impressive removal of arsenic(V) from aqueous solutions: A combined experimental and computational approach. Arab. J. Chem.. 2022;15:104123
- [Google Scholar]
- Next-generation high-performance sustainable hybrid composite materials from silica-rich granite waste particulates and jute textile fibres in epoxy resin. Ind. Crop. Prod.. 2022;177:114527
- [Google Scholar]
- Thermo-hydraulic characterization and design optimization of dimpled/protruded absorbers in solar heat collectors. Appl. Therm. Eng.. 2019;154:217-227.
- [Google Scholar]
- Waste marble dust-filled glass fiber-reinforced polymer composite Part I: Physical, thermomechanical, and erosive wear properties. Polym. Compos.. 2019;40:4113-4124.
- [Google Scholar]
- Characterization of composite produced from waste PET and marble dust. Constr. Build. Mater.. 2018;163:734-741.
- [Google Scholar]
- Morphology engineering processed nanofibrous membranes with secondary structure for high-performance air filtration. Sep. Purif. Technol.. 2022;294:121093
- [Google Scholar]
- Effects of particle size, particle/matrix interface adhesion and particle loading on mechanical properties of particulate–polymer composites. Compos. B Eng.. 2008;39:933-961.
- [Google Scholar]
- Utilization of waste dolomite dust in carbon fiber reinforced vinylester composites. J. Mater. Res. Technol.. 2022;18:3291-3301.
- [Google Scholar]
- Production of biosurfactants from agro-industrial waste and waste cooking oil in a circular bioeconomy: An overview. Bioresour. Technol.. 2022;343:126059
- [Google Scholar]
- Utilization of waste marble dust in poly(lactic acid)-based biocomposites: Mechanical, thermal and wear properties. J. Polym. Environ.. 2021;29:2952-2963.
- [Google Scholar]
- Development and characterization of composites produced from recycled polyethylene terephthalate (rPET) and waste marble dust. Polym. Compos.. 2022;43:3951-3959.
- [Google Scholar]
- Multi-color tunable and white circularly polarized luminescent composite nanofibers electrospun from chiral helical polymer. Advanced Fiber Materials. 2022;4:1632-1644.
- [Google Scholar]
- Influence of cenosphere on tribological properties of short carbon fiber reinforced PEEK composites. J. Appl. Polym. Sci.. 2019;136:47245.
- [Google Scholar]
- Blow-spun nanofibrous composite Self-cleaning membrane for enhanced purification of oily wastewater. J. Colloid Interface Sci.. 2022;608:2860-2869.
- [Google Scholar]
- Recent advancements in applications of chitosan-based biomaterials for skin tissue engineering. Journal of Bioresources and Bioproducts. 2021;6:11-25.
- [Google Scholar]
- Rheological and Mechanical Properties of Recycled PET Modified by Reactive Extrusion. Energy Procedia. 2014;56:547-553.
- [Google Scholar]
- A selection of material using a novel type decision-making method: Preference Selection Index Method. Mater. Des.. 2010;31:1785-1789.
- [Google Scholar]
- Kinetic analysis and modelling of PET macromolecular changes during its mechanical recycling by extrusion. Polymer. 2011;96:236-246.
- [Google Scholar]
- Development and characterization of polymer-based composites filled with micro-sized waste marble dust. Polym. Polym. Compos.. 2020;29:497-508.
- [Google Scholar]
- Processing and wear response study of glass-polyester composites with waste marble dust as particulate filler. Polym. Compos.. 2020;41:2263-2273.
- [Google Scholar]
- Materials selection for choosing the best composite blend polymeric membrane for hydrogen/oxygen proton exchange membrane fuel cell. J. Power Sources. 2022;538:231566
- [Google Scholar]
- Comparative assessment of the environmental profile of PLA and PET drinking water bottles from a life cycle perspective. J. Clean. Prod.. 2014;65:539-550.
- [Google Scholar]
- Mechanical and Thermo-mechanical analysis based numerical simulation of granite powder filled polymer composites for wind turbine blade. Fibers Polym.. 2016;17:1078-1089.
- [Google Scholar]
- Selection of the best refrigerant for replacing R134a in automobile air conditioning system using different MCDM methods: A comparative study. Case Studies in Thermal Engineering. 2021;27:101344
- [Google Scholar]
- Comparative Performance of PLA and PET Bottles for Alcohol and Sugar Acid Solutions. East Lansing: Michigan State University; 2011.
- Polyurethane glycolysate from industrial waste recycling to develop low dielectric constant, thermally stable materials suitable for the electronics. Arab. J. Chem.. 2020;13:2110-2120.
- [Google Scholar]
- Plastic waste from marine environment: Demonstration of possible routes for recycling by different manufacturing technologies. Waste Manag.. 2021;119:101-110.
- [Google Scholar]
- Influence of severe climatic variability on the structural, mechanical and chemical stability of cement kiln dust-slag-nanosilica composite used for radwaste solidification. Constr. Build. Mater.. 2019;218:556-567.
- [Google Scholar]
- Sustainable composite of improved lightweight concrete from cement kiln dust with grated poly(styrene) J. Clean. Prod.. 2020;277:123491
- [Google Scholar]
- Oxidation of furfural to maleic acid and fumaric acid in deep eutectic solvent (DES) under vanadium pentoxide catalysis. Journal of Bioresources and Bioproducts. 2021;6:39-44.
- [Google Scholar]
- Effect of micro-sized marble dust on mechanical and thermo-mechanical properties of needle-punched nonwoven jute fiber reinforced polymer composites. Polym. Compos.. 2021;42:881-898.
- [Google Scholar]
- Trends in mitigation of industrial waste: Global health hazards, environmental implications and waste derived economy for environmental sustainability. Sci. Total Environ.. 2022;811:152357
- [Google Scholar]
- Effect of particle size of fly ash on recycled poly (ethylene terephthalate)/fly ash composites. Int. J. Plast. Technol.. 2010;14:53-64.
- [Google Scholar]
- A hybrid multiple-criteria decision-making approach for selecting optimal automotive brake friction composite. Material Design & Processing Communications. 2021;3:e266.
- [Google Scholar]
- Utilization of cement bypass dust in the development of sustainable automotive brake friction composite materials. Arab. J. Chem.. 2021;14(103324):26.
- [Google Scholar]
- Optimum design based on fabricated natural fiber reinforced automotive brake friction composites using hybrid CRITIC-MEW approach. J. Mater. Res. Technol.. 2021;14:81-92.
- [Google Scholar]
- Optimization on physicomechanical and wear properties of wood waste filled poly(lactic acid) biocomposites using integrated entropy-simple additive weighting approach. S. Afr. J. Chem. Eng.. 2022;41:193-202.
- [Google Scholar]
- Materials selection of reinforced sustainable composites by recycling waste plastics and agro-waste: An integrated multi-criteria decision making approach. Constr. Build. Mater.. 2022;348:128608
- [Google Scholar]
- Study on the reuse of marble and andesite wastes in epoxy-based composites. Polym. Compos.. 2018;39:3081-3091.
- [Google Scholar]
- Converting red mud wastes into mesoporous ZSM-5 decorated with TiO2 as an eco-friendly and efficient adsorbent-photocatalyst for dyes removal. Arab. J. Chem.. 2022;15:103754
- [Google Scholar]
- Preparation of purified spent coffee ground and its reinforcement in natural rubber composite. Arab. J. Chem.. 2022;15:103917
- [Google Scholar]
- Effectiveness of talc filler on thermal resistance of recycled PET Blends. Advances in Materials Physics and Chemistry. 2013;3:327-331.
- [Google Scholar]
- Yao, S,-S., Pang, Q.-Q., Song, R., Jin, F.-L., Park, S.-J., 2016. Fracture toughness improvement of Poly(lactic acid) with silicon carbide whiskers. Macromolecular Research 24, 961-964.
- Conversion of teak wood waste into microwave-irradiated activated carbon for cationic methylene blue dye removal: Optimization and batch studies. Arab. J. Chem.. 2022;15:104081
- [Google Scholar]
- Chitosan enhanced the stability and antibiofilm activity of self-propelled Prussian blue micromotor. Carbohydr. Polym.. 2023;299:120134
- [Google Scholar]


