

Translate this page into:
Wild olive fruits: Phenolics profiling, antioxidants, antimicrobial, thrombolytic and haemolytic activities
⁎Corresponding authors. mnavedahmad@yahoo.com (Naveed Ahmad), bosalvee@yahoo.com (Munawar Iqbal)
-
Received: ,
Accepted: ,
This article was originally published by Elsevier and was migrated to Scientific Scholar after the change of Publisher.
Peer review under responsibility of King Saud University.
Abstract
In this study, wild olive fruits were evaluated for the occurrence of phenolic antioxidant components and valuable nutrients which are distributed wildly in Soon valley of Pakistan. The shade-dried fruits of wild olive were extracted using different solvents to recover phenolic antioxidants. The highest concentration of extractable antioxidant components was recovered from tested fruits using aqueous ethanol compared to other solvents used. Crude concentrated extracts (CCEs) and phenolic rich fractions (PRFs) of tested fruits using hydroxyethanol were found to contain higher amount of total phenolic compounds and total flavonoid compounds along with superior biological attributes. According to ICP-OES analysis, potassium (17.96 g/kg) was the dominant macro element among other identified twenty-five minerals. The tested wild olive fruits juice was found to contain individual natural sugars including galactose (4.92 g/100 g dry weight), sucrose (2.75 g/100 g dry weight), glucose (0.73 g/100 g dry weight); and succinic acid (8.80 mg/100 g of dry matter) as major organic acid when analyzed on HPLC. Oleic acid (47.41 %) was the major monounsaturated fatty acid in the oil extracted from tested fruits. The concentration of phenolic antioxidants and biological activities vary significantly (p < 0.05) among extracting systems used. A strong correlation was also recorded among total phenolic (TP), total flavonoids (TF) and biological attributes of tested wild olive fruits. The results of this study explored wild olive fruits as a propitious source of natural phenolic components and valuable nutrients which reveal its potential use in the development of functional food and nutra-pharmaceuticals.
Keywords
Wild Olive
Phenolic profiling
Biological attributes
ICP-OES
GC-FID

1 Introduction
Lipid oxidation is a major problem in food industry due to its adverse effects including rancidity and off-flavor. Due to its detrimental impact, different food ingredients have been reported to lose its organoleptic and nutrition value. A wide range of ailments including aging, metabolic syndromes, inflammations, cardiovascular problems and different types of cancers in various biological systems have been directly linked to occurrence of reactive oxygen species (ROS) and free radicals in them. Different parts of plants have been served as propitious source of food, fuel and folk medicine (F. Anwar et al., 2013). Medicinal benefits of plants have been ascribed to the presence of phytochemicals such as polyphenols, phytosterols, alkaloids and terpenoids in it. Phenolic antioxidant compounds have been documented to express multiple medicinal attributes including reduced risk of metabolic disorders, certain types of cancers and inflammation (Afata et al., 2022; Chen et al., 2022; Prasathkumar et al., 2021).
As a majority of conventional food plants are available with the occurrence of a variety of potent bioactives and high-value minerals for maintenance and regulation of bodily processes, but huge reserves of under-utilized wild plants are required to be explored for various bioactives and essential phytonutrients in order to meet the challenges of food security with increasing population and prevalence of different public health concerns. The fruits of different wild plants have been utilized in folk medicine systems of different civilizations (Shahidi, 2009).
Pakistan has been blessed with vast resources of different flora with medicinal importance which are available for biological prospecting. A variety of wild plant species from Pakistan have been consumed in folk medication system due to the occurrence of high-value nutrients and potent bioactive components (F. Anwar et al., 2013). Like other potential plant matrices, the fruits of wild olive can be explored for the occurrence of valuable plant-based bioactive compounds to produce nutraceuticals and functional foods with therapeutic properties. The Olive is one of the most prevalent fruit trees that is naturally distributed and extensively cultivated in different regions of world with moderate weather conditions to produce high quality of edible oil. Due to the presence of valuable phytonutrients and potent phenolic antioxidant components, the fruits of olive and its derived foods are documented as important ingredients for the formulation of food products with wide range of health benefits (Benavente-garcõâa et al., 2000; Hamid et al., 2022; Hannachi et al., 2020; Lins et al., 2018).
Due to a variety of biological attributes, the fruits of under-utilized wild plants are required to be processed for bioprospecting. These biological properties have been ascribed to the presence of different bioactives including phenolic antioxidant in various parts of wild plants. So, this study was framed to appraise the fruits of wild olive, native to Soon valley of Pakistan, for valuable phytonutrients, potent phenolic antioxidants and biological potential for the development of nutraphamaceuticals and functional foods. This is a first report on evaluation of wild olive fruits from Soon valley of Pakistan for the presence of valuable nutrients and potent phenolic antioxidants.
2 Material and methods
2.1 Extraction and fractionation
The fully ripened fruits were obtained from olive (Olea ferruginea Royle) plants which were naturally grown in Soon valley of Punjab, Pakistan where weather conditions are characterized by annual precipitation (50 cm) with minimum and maximum average temperature of 1 °C and 36 °C, respectively. After authentication (voucher No 250-bot-21) by a Taxonomist, Department of Botany, Govt College University Faisalabad, samples were washed with distilled-water and dried under shade to store in -20 °C freezer for analyses. The preserved samples were minced in grinding mill (Tector–Cemotec 1090, Hognas, Sweden) and then soaked in various solvents including hydroxymethanol (80: 20, methanol: water), absolute methanol (100%), hydroxyethanol (80: 20, ethanol: water), absolute ethanol (100%), hydroxyacetone (80: 20, acetone: water) and absolute acetone (100%) for five days, followed by filtering using filter paper (Whatman, 8µ) to remove insoluble part. The excessive amount of solvent was recovered by rotary evaporator (EYELA, Tokyo, Japan) to get crude concentrated extracts (CCEs). According to Maheshwari et al., (2011), fractionation of CCEs was performed to produce phenolic rich fraction (PRFs). These CCEs and PRFs were stored at -20 °C.
2.2 Total phenolics (TP) in CCEs/PRFs
The content of TP in tested fruits were estimated following a method described by Ahmad et al., (2011). Briefly, accurately weighed (1mg/mL) of CCEs/PRFs was taken in a conical flask followed by addition of deionized water (7.5mL), Folin-Ciocalteu reagent (0.5 mL) and sodium carbonate (20% (w/v); 1.5 mL) to react in water bath at 40°C for 20 min. The final reaction mixture was cooled to ambient temperature whose optical density (OD) was recorded at 755 nm using spectrophotometer. The TP content was presented as Gallic Acid Equivalents (GAE) g/100g dry matter with the help of gallic acid standard curve.
2.3 Total flavonoids (TF) in CCEs/PRFs
The amount of TF in ripened wild olive fruits was quantified following a protocol described by Ahmad et al., (2011). Briefly, accurately weighed (100 mg/mL) of CCEs/PRFs was taken in conical flask followed by the addition of 5.0 mL distilled H2O (for dilution) and sodium nitrite (5%; 0.3 mL). consequently, resulting mixture was incubated to mix with aluminum chloride (10%; 0.6 mL) and sodium hydroxide (1.0 M; 2 mL). The absorbance of final mixture was recorded at 510 nm. TF was calculated as catechin equivalents (CE) g/100g dry matter with the help of catechin calibration curve.
2.4 2, 2-diphenyl-2-picrylhydrazyl (DPPH) radical scavenging analysis
This analysis was performed to assess the ability of CCEs/PRFs to scavenge DPPH radical (Tepe et al., 2005). It is expressed as IC50 value. DPPH solution (0.004%; 5 mL) was prepared in methanol and then reacted with each concentration of (0.10 to 5.0 mg/mL) and followed by incubation for 30 min in ambient conditions. Absorption of each sample was taken at 517 nm to estimate inhibition potential (Eq. (1)).
Where, Ab and As are absorbance values of blank and sample, respectively, while I is percentage inhibition.
2.5 Reducing power of CCEs/PRFs
A method developed by Yen et al. (2000) was used to assess reducing power of CCEs/PRFs. Briefly, sodium phosphate buffer (0.2 M, pH 6.6), solution (1.0%) of C6N6FeK3 and CCEs/PRFs (5-20 mg) were mixed in equal volume to incubate (50 °C) for 20 min. Then trichloroacetic acid (10%; 5 mL) was added to the resulting solution which was centrifuged (980 g ;10 min) using CHM-17, Tokyo, Japan) to recover supernatant (2.5 mL), followed by dilution using distilled H2O (2.5 mL) and mixed with 0.1% iron (III) chloride (0.5 mL). The Absorption of the resulting reaction mixture was observed at 700 nm.
2.6 Ability of CCEs/PRFs to inhibit the process of peroxidation
CCEs/PRFs were evaluated for their potential to inhibit the process of peroxidation in linoleic acid (Ahmad et al., (2011)). For sample preparation, ten milliliter of sodium phosphate buffer (pH=7, 0.2 M) was taken in conical flask followed by the addition of 5 mL distilled H 2O, linoleic acid (0.13 mL), ethanol (99.8%; 10 mL) and CCEs/PRFs (5 mg) to incubate at 40°C. Following Yen et al., (2000), sample solution (0.2 mL) was reacted with ten milliliter of aqueous ethanol (75%), 0.2 mL of NH4SCN solution (30 %), and 0.2 mL of FeCl2 (20 m M in 3.5% HCl) to record its absorption at 500 nm. Butylated hydroxytoluene and ascorbic acid were run as positive control. Inhibition of peroxidation was estimated by (Eq. (2)).
Where, As and Ac are the OD values of sample and control at 350 h.
2.7 Antimicrobial activity
According to (NCCLS, 1999, 1997), various CCEs/PRFs of tested fruits were evaluated for their antimicrobial potential against different fungal and bacterial strains by measuring the zone of inhibition and minimal inhibitory concentration (MIC). Fungal strains (Aspergilus niger, Staphylococcus aureus and Aspergilus flavus) were cultivated at 29 °C on potato dextrose agar while bacterial strains (Fusarium oxysporum, Bacillus cereus and Escerichia coli) were cultured on nutrient agar at 37 °C to get optimum growth. Fungal and bacterial broth cultures were developed in test tubes to achieve 104 cfu/mL and 108 cfu/mL. Filter paper discs of 6 mm diameter were sterilized. Each fungal and bacterial broth (100 µL) was applied on separate agar plates of their respective growth media followed by placing of soaked discs in CCEs/PRFs (100 mg/mL). Positive controls including fluconazole (for fungus) and rifamycin (for bacteria), and negative control (without CCE/PRF) were also executed with similar conditions of experiment.
In order to determine MIC, fungal and bacterial strains were cultured in sabouraud dextrose broth (SDB) and nutrient broth (NB) mixed with Tween 80. Under similar experimental conditions, growth control (NB+Tween 80), positive controls (tested microorganisms) and sterility control (CCE/PRF+NB+ Tween 80) were also processed, while standards fungicidal (fluconazole) and bactericidal (rifamycin) drugs were also applied along with samples. The concentration of CCE/PRF with minimum or no growth of microorganism was labelled as MIC.
2.8 Inhibition of biofilm formation
According to Stepanović et al. 2000, CCEs/PRFs of tested fruits were appraised for their potential to inhibit the formation of biofilm caused by E.coli and S. aureus which were cultured in nutrient broth to achieve 109 CFU/mL. Briefly, different concentration (2.5 and 5.0 μg) of samples were solubilized in DMSO in wells of microtiter plate (96 well plate) followed by the addition of nutrient broth (100 μL) for microbial growth. This microtiter plate was inoculated with 20 μL of different bacterial broth. Under similar conditions of experiment, positive control (rifampicin) and negative control (bacterial broth) were also processed. After incubating (37 °C), control and sample wells were rinsed using autoclaved phosphate buffer (pH: 7.2; 220 μL) and aqueous methanol (99%, 220 μL) followed by air-drying. Staining of each well of microtiter plates was done using 220 μL of crystal violet solution (50 %) followed by washing by distilled water and resolubilizing in 220 μL of glacial acetic acid (33%). OD of each well in microtiter was taken at 630 nm. Biofilm inhibition (%) was calculated (Eq. (3)).
2.9 Haemolytic potential of CCEs/PRFs
Haemolytic activity of CCEs/PRFs, derived from wild olive fruits, was determined by following a method (Yang et al., 2005). Briefly, cell suspension and different concentrations (125, 250, 500 and 1000 µg/ml) of plant extract was mixed in equal volume and placed at 37°C for half an hour, followed by centrifugation at 1500 rpm for 10 min. The recovered supernatant was processed for estimation of free hemoglobin at 540 nm. Distilled water and phosphate buffer saline were processed as hemolytic controls under similar conditions of experiment. Hemolysis (%) was estimated as Eq. (4).
Where Ac, An and At represents OD value of control (water), control (saline) and sample.
2.10 Thrombolytic potential of CCEs/PRFs
According to the reported method Prasad et al. (2006), CCEs/PRFs of tested fruits were appraised for thrombolytic potential. Concisely, various concentration CCEs/PRFs of tested fruits were separately mixed with blood sample (0.5 ml) at 37°C using water bath. Normal saline and streptokinase were also processed as blank and positive control, respectively. All samples and controls were run under similar experimental conditions.
2.11 Estimation of minerals in wild olive fruits
Inductively coupled plasma-optical emission spectroscopy (ICP-OES) was used to estimate mineral content in tested fruits following a method (Link et al., 1998). Hydrochloric acid and nitric acids (3:1) were employed to digest the samples at 182 °C for 9.5 min using microwave oven (USEPA method, 3051A), followed by cooling, filtration, centrifugation and dilution with water to analyze using ICP-OES. Pure water (18 MΩ cm) was utilized for washing, dilution, preparation of standards and samples.
2.12 Analysis of organic acids and HPLC conditions
Wild olive fruits were evaluated for the occurrence of organic acids following a method reported by Mahmood et al., 2012. Briefly, 10 g of fresh fruit aliquot was blended in 20 mL of distilled water to produce juice which was centrifuged at 3000g for 10 min followed by filtration through (0.25 µm) to get pure juice by removing suspended debris.
Organic acids were detected in fresh fruit’s juice using HPLC (Varian Pro star, USA) equipped with UV-VIS detector. For the separation of organic acid, lichrospher column (RP-C18) was used while 0.001 N H2SO4 was selected as mobile phase whose flow rate was adjusted at 1.0 mL/min to detect different organic acids were at 230 nm. Various standards of organic acids including citric, gluconic, acetic, malic, oxalic and succinic acids were used to construct calibration curve which was used for quantitative analysis of sample for organic acids.
2.13 Analysis of natural sugars and HPLC conditions
Wild olive fruits were evaluated for the occurrence of natural sugars following a method reported by Mahmood et al., (2012). Briefly, 10 g of fresh aliquot of tested fruit sample was blended in 20 mL of distilled water to produce juice which was centrifuged at 3000g for 10 min followed by filtration through (0.25 µm) to get pure juice by removing suspended debris. Natural sugars were detected in fresh fruit juice using HPLC (Shimadzu, Japan) equipped with refractive index detector (RID-10A). For the separation of natural sugars, lichrospher column (R-100) was used and the flow rate of mobile phase (acetonitrile) was optimized to 0.6 mL/min to detect different organic acids. Natural sugars in tested wild fruits were detected and quantified by a comparison with standards.
2.14 Fatty acid composition and GC-FID conditions
The recovered oil from wild olive fruits was trans-esterified into FAMEs using a method reported by Farooq Anwar et al. (2008). Recovered oil (30 mg) was thoroughly mixed with potassium (sodium) methoxide (0.5 M; 5 mL). This mixture was incubated at 50 °C for 2 h in which samples were subjected to vortex after 3–4 mins to get monophasic system. Resulting solution was kept at room temperature for a while then allowed to react with distilled water (3 mL), isooctane (3 mL) and glacial acetic acid (0.3 mL). The final mixture was subjected to spin at 2500 rpm for 2 min to separate organic layer (FAMEs).
The recovered FAMEs were then analyzed on GC (Agilent Technologies, USA) coupled with FID (flame ionization detector) and capillary column (Zebron™ ZB-5, UK). Initial temperature of column oven was adjusted to 70 °C for 3 min that was further enhanced to 200 °C @ 9 °C/min. Then, the oven temperature was achieved to 260 °C for 40 min and carrier gas (N2) flow rate was 2 mL/min. The injector and detector temperature were 240 °C and 260 °C, respectively. The fatty acids were identified by comparing with standards.
3 Results and discussion
3.1 Extraction yield
Pure solvents and their aqueous mixtures were used to extract antioxidant bioactive components of different polarities from the wild olive fruits. Therefore, various extracting solvents including absolute methanol and its aqueous mixture (80:20, methanol: water), absolute ethanol and its aqueous mixture (80:20, ethanol: water), absolute acetone and its aqueous mixture (80:20, acetone: water) were used to recover plant bioactives and their extraction yield (g/100g) of CCEs was presented in Table 1. The yield of extractable antioxidant components, recovered from tested the fruits of wild olive, varied considerably from 23.10 g/100g to 48.30 g/100g of dry matter. The lowest CCE yield (23.10%) was recorded using absolute acetone while aqueous ethanol recovered the highest CCE yield (48.30%) from the fruits of wild olive. Values (mean ± SD) are average of three replicates, analyzed individually. Superscript letters in a same column display significant differences (p < 0.05) of means among the extracting solvents.
Solvents
Yield (g/100 g of dry weight)
Total phenolics (GAE g/100 g of dry matter)
Total flavonoids (CE g/100 g of dry matter)
CCE
PRF
CCE
PRF
CCE
PRF
Absolute Methanol
34.93 ± 0.97d
10.60 ± 1.28b
1.52 ± 0.07c
2.22 ± 0.16d
0.09 ± 0.02d
0.37 ± 0.04c
Aqueous Methanol
45.73 ± 0.87b
3.40 ± 0.45c
2.79 ± 0.16a
7.63 ± 0.57b
0.18 ± 0.04b
0.89 ± 0.06a
Absolute Ethanol
37.45 ± 0.65c
18.00 ± 0.93a
1.81 ± 0.09b
4.65 ± 0.49c
0.14 ± 0.05c
0.53 ± 0.04b
Aqueous Ethanol
48.30 ± 1.06a
3.90 ± 0.35c
2.95 ± 0.18a
9.21 ± 0.32a
0.23 ± 0.04a
0.98 ± 0.07a
Absolute Acetone
23.10 ± 1.03f
---
0.79 ± 0.11d
---
0.08 ± 0.01d
---
Aqueous Acetone
27.25 ± 1.43e
---
1.74 ± 0.17bc
---
0.12 ± 0.03c
---
The antioxidant capacity of CCEs, recovered from wild olive fruits, was affected due the presence of impurities like lipidic components which were found to resist the isolation and detection of plant bioactives. For purification, of these recovered CCEs, sequential liquid-liquid fractionation was further performed for the removal of intrinsic interfering moieties. After fractionation of crossponding CCEs of wild olive fruits, recovered with various extracting solvents, PRFs were obtained, and their yield was presented in Table 1. The yield of PRFs of tested fruits varied from 3.4 g/100g to 18 g/100g of CCE. The lowest yield (3.4%) of PRF was derived from CCE of aqueous methanol while the maximum yield (18%) of PRF was obtained from CCE of absolute ethanol.
According to the results of our study, aqueous ethanol was found to be better extracting solvent to recover higher yield of antioxidant compounds. The amount of extractable antioxidant molecules, extracted from the fruits of wild olive with different solvents, varied significantly (p<0.05). These differences in the yield of extractable antioxidant components using various solvents was also described by Sultana et al., (2009). Hydroxymethanol and hydroxyethanol were very effective for the extraction of different phenolics from plant matrices (Chen et al., 2001; Jiao and Zuo, 2009; Manzoor et al., 2013; Shabir et al., 2011; Zuo et al., 2002). The results of present study advocates the effectiveness of hydroxymethanol for improved recovery of extractable phenolics and flavonoids. McDonald et al., (2001) and Sousa et al., (2011) reported the extraction yield (32 % by weight of original freeze-dried olive fruits), (19.38 %) from Australian freeze-dried olive fruit cultivars and Portuguese olive fruits cultivars using methanol which are found to be lower than of present study. Different factors including content of phenolic compounds, weather condition of site and nature of soil have been documented for the differences in the extraction yield (Mahmood et al., 2012).
3.2 Total phenolics (TP) and total flavonoids (TF) content
Over the last few decades, utilization of different parts of plants and plant-derived foods has extensively been increased due to the presence of phenolic bioactives in it. These phenolic and flavonoids are responsible for antioxidant activity of different fruits and vegetables (Katalinic et al., 2006). The TP and TF in CCEs/PRFs of tested fruits were determined as 0.79-2.95 GAE (g/100g) & 0.08-0.23 CE (g/100g), respectively (Table 1), where absolute acetone-derived CCE exhibited lowest content of TF (0.08 CE g/100g) and TP (0.79 g/100g of DW) while maximum amount of TF (0.23 CE g/100g) and TP (2.95 g/100g of DW) was found in CCE, extracted with hydroxyethanol.
The amount of TF and TP in PRFs of tested fruits varied over the range of 0.37-0.89 CE (g/100g) and 2.22-9.21 GAE (g/100g), respectively where PRF of absolute methanol-derived CCE contained the lowest content TF (0.37 CE g/100g) and TP (2.22 GAE) while maximum amount of TF (0.98 CE g/100g) and TP (9.21 GAE g/100g) was present in the PRF of hydroxyethanol-derived CCE.A significant difference (p < 0.05) was observed among the concentration of TF and TP in CCEs/PRFs extracted from the tested fruits with different solvents. Regardless of the lower extraction yield, the PRFs of tested fruits were found to contain higher concentration (3-4 times) of TF and TP than those of corresponding CCEs which showed phenolic components were successfully purified in PRFs.
There is no previous report available on assessment of TP and TF in the CCEs/PRFs, recovered from the wild olive fruits. The amount of TP in our present study was found to be higher than those of cultivated olive fruits (Arslan and Özcan, 2011; DeJong and Lanari, 2009; Ziogas et al., 2010), hydroxy methanol extract of raspberry fruit (Bobinaite et al., 2013), acidified-methanol extract of wild black berry (Radovanović et al., 2013) and absolute methanol extract of wild orange (Lala et al., 2020). The content of TF in wild olive fruits was found to be higher than those of (Nakilcioğlu and Hışıl, 2013), but in agreement with methanol extract of wild orange (Lala et al., 2020).
3.3 Reducing power of CCEs/PRFs
Reducing agents in CCEs/PRFs of wild olive fruits were used to reduce iron (III) into iron (II) to determine their reducing potential. The concentration of reducing agents in plant extract has a positive correlation with antioxidant activity of that plant (Joshi et al., 2010). Also, in this study, an increasing trend in the reducing power, which was enhanced linearly with the concentration of CCEs/PRFs (Table 2) was observed. he reducing potential of CCEs/PRFs, obtained from wild olive fruit was significantly (p < 0.05) varied from each other. Sousa et al., (2011) noticed similar trend of reducing power as a function of concentration of cultivated olive fruit extracts. Values (mean ± SD) are average of three replicates, analyzed individually. Superscript letters in a same column display significant differences (p < 0.05) of means among the extracting solvents.
Solvents
Reducing Power (λ = 700 nm)
IC50 value (mg/mL)
Inhibition of linoleic acid peroxidation (%)
5 mg
10 mg
15 mg
20 mg
Absolute Methanol
CCE
0.54 ± 0.01
0.75 ± 0.04
0.99 ± 0.03
1.09 ± 0.05
0.16 ± 0.04c
73.47 ± 3.69b
PRF
0.99 ± 0.08
1.05 ± 0.10
1.14 ± 0.06
1.20 ± 0.04
0.05 ± 0.02a
82.12 ± 2.04b
Aqueous Methanol
CCE
0.65 ± 0.02
0.88 ± 0.03
1.09 ± 0.05
1.14 ± 0.02
0.04 ± 0.02d
76.26 ± 2.25a
PRF
1.15 ± 0.07
1.27 ± 0.06
1.30 ± 0.05
1.32 ± 0.08
0.02 ± 0.01b
85.42 ± 2.78ab
Absolute Ethanol
CCE
0.04 ± 0.01
0.45 ± 0.02
0.71 ± 0.04
1.02 ± 0.04
0.09 ± 0.03 cd
72.67 ± 3.01b
PRF
0.56 ± 0.05
0.69 ± 0.04
0.82 ± 0.09
1.08 ± 0.06
0.02 ± 0.01b
84.88 ± 1.83ab
Aqueous Ethanol
CCE
0.51 ± 0.03
0.85 ± 0.02
1.11 ± 0.06
1.14 ± 0.05
0.03 ± 0.01d
78.65 ± 2.69a
PRF
1.01 ± 0.06
1.17 ± 0.04
1.21 ± 0.05
1.24 ± 0.11
0.01 ± 0.01b
89.31 ± 2.91a
Absolute Acetone
CCE
0.22 ± 0.01
0.35 ± 0.03
0.59 ± 0.05
0.76 ± 0.03
0.78 ± 0.07a
41.83 ± 3.28c
PRF
–
–
–
–
–
–
Aqueous Acetone
CCE
0.36 ± 0.02
0.61 ± 0.02
0.96 ± 0.02
1.05 ± 0.02
0.49 ± 0.04b
47.01 ± 2.86c
PRF
–
–
–
–
–
–
3.4 DPPH free radical scavenging activity of CCEs/PRFs
DPPH is a stable nitrogen-centered free radical whose color was found to change from violet to yellow by attaining a proton from plant phenolics. The enhanced antioxidant capacity of different plant-derived extracts has been attributed to the increasing concentration of phenolic bioactives in it (Larrauri et al., 1999). CCEs/PRFs of tested wild fruits displayed substantial DPPH radical scavenging potential in terms of IC50 values as 0.03-0.78 mg/mL and 0.01-0.05 mg/mL, respectively (Table 2). Hydroxyethanol-derived CCE/PRF exhibited the maximum DPPH radical scavenging with lower IC50 values of 0.03 mg/mL and 0.01 mg/mL, respectively. Positive control (BHT) was found to found to express superior DPPH radical scavenging potential compared to other CCEs/PRFs. This antioxidant activity of tested CCEs/PRFs might be ascribed to the occurrence of antioxidant phenolics in them (Siddhuraju et al., 2002).
Antioxidant potential (in term of radical scavenging ability) of PRFs with IC50 (0.01-0.05 mg/mL) was higher ( p < 0.05) in comparison to CCEs with IC50 (0.03-0.78 mg/mL) which might be due to increased phenolic antioxidants present in PRFs obtained by fractionation of CCEs. Though this is first report on evaluation of CCEs/PRFs of tested fruits for scavenging DPPH radical, however the DPPH radical scavenging potential of tested fruit’s CCEs/PRFs was found to be comparable with that of olive cultivar’s crude extract (Arslan, 2012), but higher than those of olive cultivars (Arslan and Özcan, 2011; Sousa et al., 2008), hydromethanolic extract of apple (Pires et al., 2018), hydroxyethanolic extract of wild apricot (Qin et al., 2019).
3.5 Antioxidant activity of CCEs/PRFs in linoleic acid system
Antioxidant activity of tested fruits’ CCEs/PRFs was also determined by evaluating their potential to impede peroxidation in lipidic environment where peroxides were produced by the process of oxidation (Table 2). Peroxides in lipids have been reported to react with SCN- to form a complex which can be quantified at 500 nm. The potential of various CCEs/PRFs of tested fruits to impede peroxidation in lipid molecules varied in the range of 41.83-78.65% and 82.12-89.31%, respectively where the maximum inhibiting potential was displayed by hydroxyethanol-derived CCE (78.65%) and PRF (89.31%) indicating its higher antioxidant capacity which is due to their higher content of antioxidant compounds compared to other extracts/fractions. However, absolute acetone-derived CCE (41.83%) and absolute methanol-derived PRF (82.12%) exhibited the lowest potential to retard the process of lipid peroxidation (Fig. 1).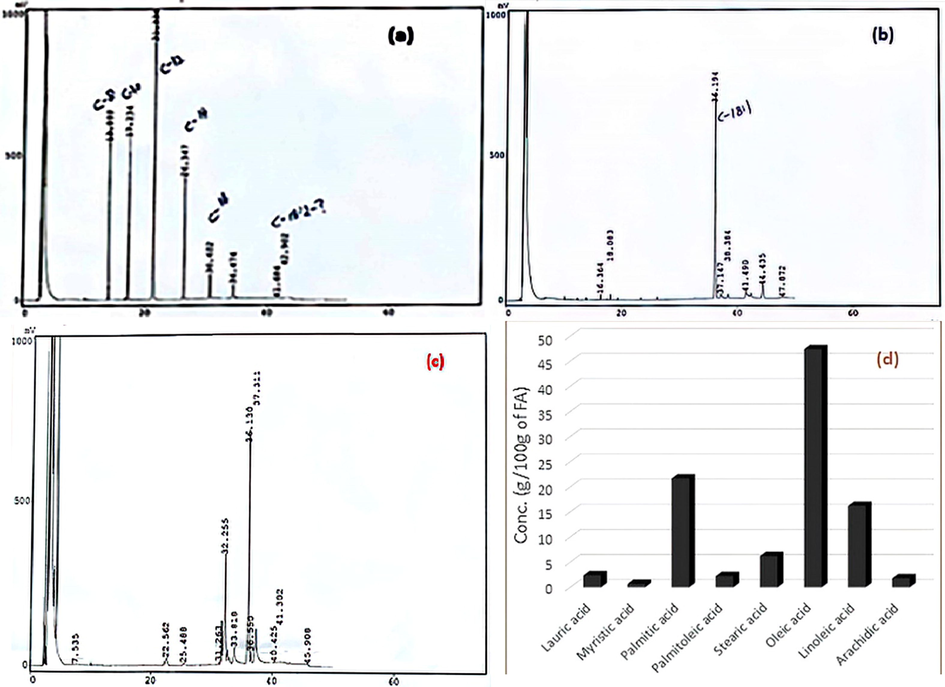
Typical GC chromatograms: (a) saturated fatty acid standards, (b) unsaturated fatty acid standards, (c) wild olive oil FAMEs, (d) quantitation of fatty acids.
According to the results of present study, PRFs of tested fruits were found to contain higher amount of phenolic antioxidant molecules which is a result of successful fractionation to remove impurities from recovered crude extracts, thereby their antioxidant activity in terms of inhibiting the process of peroxidation in lipids was higher in comparison to their corresponding CCEs. The synthetic antioxidant (BHT) expressed superior potential (92.01 %) for inhibiting lipid peroxidation compared to all CCEs/PRFs. This is first report on evaluation of CCEs/PRFs, recovered from wild olive fruits, to impede the peroxidation in lipids containing linoleic acid.
3.6 Antimicrobial attributes of CCEs/PRFs
Different plant material have been documented as a promising source of antimicrobial agents to treat various health disorders (Ahmad et al., 2011; Hussain et al., 2011). The evaluation of CCEs/PRFs, recovered from wild olive fruits, for antimicrobial potential against a panel of bacterial and fungal strains (Table 3) by measuring the inhibition zones and MIC (concentration of drug with lowest microbial growth) (Walsh et al., 2003). Values (mean ± SD) are average of three replicates, analyzed individually. Superscript letters in a same column display significant differences (p < 0.05) of means among the extracting solvents.
Solvents
Zone of inhibition (mm)
MIC (µg/mL)
CCE
PRF
CCE
PRF
S. aureus
E.coli
B. cereus
S. aureus
E.coli
B. cereus
S. aureus
E.coli
B. cereus
S. aureus
E.coli
B. cereus
Absolute Methanol
13.0 ± 0.5d
14.0 ± 0.3d
6.0 ± 0.2d
17.0 ± 1.1c
16.0 ± 0.9 cd
7.0 ± 0.6 cd
215 ± 6b
199 ± 7 cd
276 ± 8b
171 ± 5a
180 ± 8a
225 ± 7ab
Aqueous Methanol
17.0 ± 0.8bc
16.0 ± 0.4c
8.0 ± 0.3c
19.0 ± 1.2b
17.0 ± 0.7c
8.0 ± 0.4c
189 ± 8c
194 ± 8 cd
251 ± 9c
155 ± 8b
163 ± 8b
219 ± 8ab
Absolute Ethanol
16.0 ± 0.8c
15.0 ± 0.3 cd
4.0 ± 0.1e
18.0 ± 1.0bc
15.0 ± 1.5d
6.0 ± 0.7d
190 ± 6c
201 ± 6c
289 ± 8a
169 ± 9a
174 ± 7ab
269 ± 10a
Aqueous Ethanol
18.0 ± 0.6b
19.0 ± 0.6b
10.0 ± 0.4b
19.0 ± 0.9b
20.0 ± 1.2b
11.0 ± 0.8b
178 ± 6 d
167 ± 8d
241 ± 7 d
151 ± 5b
146 ± 6c
209 ± 11b
Absolute Acetone
9.0 ± 0.6e
7.0 ± 0.2f
3.0 ± 0.2e
–
–
–
229 ± 7a
240 ± 10a
290 ± 12a
–
–
–
Aqueous Acetone
12.0 ± 0.4 cd
11.0 ± 0.4e
4.0 ± 0.2e
–
–
–
213 ± 8b
224 ± 8b
281 ± 10ab
–
–
–
Rifamycin
24a
26a
18a
24a
26a
18a
124e
96e
146e
124c
96d
146c
The CCEs/PRFs, extracted from tested wild fruits, displayed highest bactericidal effected against S. aureus with greater inhibition zone (9-18 mm and 17-19mm) and MIC values (178-229 µg/mL and 151-171 µg/mL), respectively. Hydroxyethanol derived CCE/PRF exhibited maximum antimicrobial potential against S. aureus with lowest MIC values 178 µg/mL and 151 µg/mL, respectively, while hydroxymethanol derived CCE/PRF displayed minimum antimicrobial potential against B. cereus with zone of inhibition (3-10 mm) and corresponding higher MIC values (241-290 µg/mL). The rifamycin (positive control) showed significantly (p < 0.05) higher antimicrobial attributes than those of tested CCEs/PRFs. According to the results of antimicrobial assay, CCEs/PRFs of tested wild fruits showed highest antifungal potential against A. niger with zone of inhibition (7-17 mm and 14-18mm) and corresponding MIC values (173-272 µg/mL and 164-210 µg/mL), respectively, while the lowest antifungal activity was recorded against F. oxysporum with zone of inhibition (2-9 mm; 6-10mm) and corresponding higher MIC values (246-340 µg/mL; 214-297 µg/mL), respectively (Table 4). The superior antibacterial and antifungal properties of CCE/PRF might be positively correlated with their enhanced concentration of phenolic antioxidant compounds. Values (mean ± SD) are average of three replicates, analyzed individually. Superscript letters in a same column display significant differences (p < 0.05) of means among the extracting solvents.
Solvents
Zone of inhibition (mm)
MIC(µg/mL)
CCE
PRF
CCE
PRF
A. niger
A. flavus
F. oxysporum
A. niger
A. flavus
F. oxysporum
A. niger
A. flavus
F. oxysporum
A. niger
A. flavus
F. oxysporum
Absolute Methanol
12.0 ± 0.7d
10.0 ± 0.6d
5.0 ± 0.2c
14.0 ± 0.8c
13.0 ± 0.4c
6.0 ± 0.9c
201 ± 9c
235 ± 7c
284 ± 7bc
210 ± 9a
218 ± 9a
297 ± 7a
Aqueous Methanol
17.0 ± 0.9b
16.0 ± 0.7b
9.0 ± 0.7b
18.0 ± 0.5b
17.0 ± 0.8b
10.0 ± 0.7b
173 ± 8d
179 ± 8e
246 ± 9d
164 ± 7c
176 ± 7c
214 ± 7b
Absolute Ethanol
15.0 ± 0.7c
12.0 ± 0.7bc
5.0 ± 0.4c
15.0 ± 0.7c
16.0 ± 0.6b
7.0 ± 0.6c
196 ± 9 cd
217 ± 8 cd
278 ± 10bc
198 ± 8ab
191 ± 6ab
280 ± 10ab
Aqueous Ethanol
16.0 ± 0.7bc
15.0 ± 0.6b
6.0 ± 0.3c
17.0 ± 0.6b
13.0 ± 0.3c
7.0 ± 0.9c
189 ± 8 cd
209 ± 10d
269 ± 9c
180 ± 7b
203 ± 8b
289 ± 9ab
Absolute Acetone
7.0 ± 0.4f
6.0 ± 0.3f
2.0 ± 0.1d
–
–
–
272 ± 10a
295 ± 11a
340 ± 11a
–
–
–
Aqueous Acetone
10.0 ± 0.6 e
8.0 ± 0.3e
5.0 ± 0.3c
–
–
–
241 ± 8b
259 ± 10b
297 ± 10b
–
–
–
Fluconazole
23a
24a
20a
23a
24a
20a
134e
126f
160e
134d
126d
160c
The tested fruit’s CCEs/PRFs exhibited higher bactericidal effect against B. cereus, S. aureus and E. coli. in comparison to: crude extract of wild olive against E. coli and S. aureus (Paudel et al., 2011); methanol-derived extract of wild orange against staphylococcus sp. (Lala et al., 2020); hydroxyethanolic extract of wild apricot against B. cereus, E.coli and S. aureus (Qin et al., 2019); acidified methanolic extract of wild black berry against E.coli. (Radovanović et al., 2013).
3.7 Biofilm inhibition potential of CCEs/PRFs
Various bacterial strains have been found to form biofilms for their survival against different types of stress including antibiotics. This predominant mode of growth with less vulnerability against different antimicrobial agents is a matter of concern. In order to control these infectious microbial strains, a variety of plant-derived antimicrobial agents have been isolated for their potential use in folk medicine systems (Prabu et al., 2006). The evaluation of CCEs/PRFs, recovered from tested fruits, was performed for their potential role in inhibiting the formation of bacterial biofilm (S. aureus and E. coli). According to the results of present study, CCEs/PRFs of wild olive fruits exhibited considerable potential to inhibit biofilm formation over the range of 51.53-75.68% and 69.16-81.25 %, respectively (Table 5). Among others, the lowest potential to inhibit the formation of biofilm was showed by acetone derived CCE (51.53-54.74 %) and PRF extracted from methanolic CCE (69.16-73.18 %), while aqueous-ethanolic derived CCE/PRF displayed maximum potential (72.56-75.68% and 80.07-81.25 %) to inhibit the formation of bacterial biofilm. This superior biofilm inhibition potential of hydroxylethanolic CCE/PRF is attributed to the occurrence of higher amount of plant bioactives in it. Due to the successful purification of phenolic components, PRFs were found to express superior ability to inhibit the formation of bacterial biofilms than those of crossponding CCE S. Rifamycin (87.91-89.43 %) being positive control was found to express greater potential to inhibit the formation of bacterial biofilms in comparison to tested CCEs/PRFs of wild olive fruits. This is the first estimation of potential to inhibit biofilm formation by wild olive fruit’s CCEs/PRFs. Values (mean ± SD) are average of three replicates, analyzed individually. Superscript letters in a same column display significant differences (p < 0.05) of means among the extracting solvents.
Solvents
Biofilm inhibition (%)
Hemolytic activity (%)
Thrombolytic activity (%)
CCEs
PRFs
CCEs
PRFs
CCEs
PRFs
S. aureus
E. coli
S. aureus
E. coli
Absolute Methanol
65.43 ± 2.50c
60.83 ± 1.90d
73.18 ± 1.64c
69.16 ± 1.71d
2.57 ± 0.10b
2.39 ± 0.04ab
49.88 ± 1.75b
56.54 ± 1.46b
Aqueous Methanol
70.01 ± 3.35b
67.15 ± 1.76c
74.76 ± 1.57c
75.31 ± 2.17c
2.26 ± 0.12c
2.19 ± 0.05b
59.21 ± 1.09a
71.42 ± 1.09a
Absolute Ethanol
71.35 ± 2.25b
71.57 ± 1.61bc
77.09 ± 1.91 cd
69.40 ± 1.38d
2.53 ± 0.08b
2.44 ± 0.08a
50.21 ± 1.47b
57.42 ± 0.95b
Aqueous Ethanol
72.56 ± 2.85b
75.68 ± 1.73b
81.25 ± 1.58b
80.07 ± 1.87b
2.19 ± 0.07c
2.26 ± 0.04b
57.47 ± 1.52a
60.88 ± 2.38b
Absolute Acetone
54.74 ± 2.28d
51.53 ± 1.56e
–
–
3.24 ± 0.09a
–
38.15 ± 1.68c
–
Aqueous Acetone
60.81 ± 1.56bc
59.44 ± 1.89d
–
–
2.50 ± 0.11b
–
42.81 ± 0.95bc
–
Control (Rifamycin)
87.91 ± 4.12a
89.43 ± 3.94a
87.91 ± 4.12a
89.43 ± 3.94a
–
–
–
–
PBS
–
–
–
–
1.54
–
Triton X-100
–
–
–
–
100
–
Water
–
–
–
–
–
3.84
Streptokinase
–
–
–
–
–
92.34
3.8 Thrombolytic potential of CCEs/PRFs
The use of synthetic thrombolytic agents (urokinase and streptokinase) to treat thrombosis has severe health concerns (Collen, 1990) which prompts the need to explore different plant resources as an alternatives for their thrombolytic activity. A variety of plant-derived compounds including phenolic and flavonoid compounds have been reported to have thrombolytic potential (Maheshwari et al., 2011).
CCEs/PRFs of tested fruits exhibited thrombolytic activity in the range of 38.15-59.21 % and 56.24-71.42 %, respectively (Table 5), where minimum thrombolytic potential was displayed by absolute acetone’s CCE (38.15 %) and absolute methanol-derived PRF (56.54 %), while hydroxyethanol-derived CCE (59.21%) and hydroxy methanol-derived PRF (71.42%) exhibited highest thrombolytic capacity which is due to the presence of enhanced content of phenolic compounds. According to the results of current assay, after the successful preconcentration of CCEs, PRFs were produced which exhibited superior thrombolytic attributes. Positive control (streptokinase) displayed higher (87.91-89.43 %) thrombolytic capacity in comparison to other CCEs/PRFs tested. There is no report available regarding the appraisal of tested fruit’s CCEs/PRFs for thrombolytic potential in human, however, Dub & Dugani (2013) reported the thrombolytic effect of ethanolic leaves extract of olive (Olea europaea L.) in rabbits.
3.9 Haemolytic activity of CCEs/PRFs
Due to physiological and morphological attributes, erythrocytes have been a part of drug delivery systems in human body. Oxidative stress, induced by ROS and free radicals, damaged the membrane of erythrocyte to produce hemolysis (Ko et al., 1997). The evaluation of CCEs/PRFs, extracted from tested fruits, was performed for hemolytic potential which was found to vary over the range of 2.19-3.24%, 2.19-2.44%, respectively (Table 5). The maximum (3.24 % and 2.44%) and minimum (2.19 % and 2.19%) hemolytic activity was exhibited by CCEs and PRFs extracted with (absolute acetone, absolute ethanol), and (hydoxyethanol, hydroxyethanol), respectively.
The difference (1-2.50 times) of hemolytic potential between PRF (2.19-2.44 %) and CCEs (2.19-3.24 %) might be ascribed to presence of enhanced phenolic concentration in PRFs after successful fractionation of CCEs. PRFs of tested fruits rendered higher protection to erythrocytes to avoid hemolysis. Hemolytic potential of various CCEs/PRFs were found to vary due the efficacy of different solvents to recover phenolic antioxidant components from tested plant matrix. Positive control (PBS) exhibited lower hemolysis (1.54 %) than those of tested CCEs/PRFs of wild olive fruits.
3.10 Fatty acid composition of wild olive lipids
Lipidic content, total saturated and unsaturated fatty acids in tested wild olive fruit’s oil was estimated to be 17.65 %, 32.84 % and 65.92 %, respectively. The concentration of oleic acid (C18:1, 47.41 %) was found to be the highest as monounsaturated fatty acid, followed by the linoleic acid (C18:2, 16.24 %). Olive oil has been documented as one of the richest sources of oleic acid. High consumption of olive oil was found to control the problem of high blood pressure (Sousa et al., 2011; Tofalo et al., 2012; Uylaşer and Yildiz, 2013). Oleic acid (C18:1, 47.41 %) and palmitic acid (C16:0, 21.70 %) were determined to be as dominant mono-unsaturated and saturated fatty acid, respectively. Small concentration of lauric acid (2.40 %), strearic acid (6.22 %), myristic acid (0.70 %), palmitoleic acid (2.27 %) and arachidic acid (1.82 %) was also present in wild olive fruit’s oil. Oleic acid and linoleic acid in wild olive oil was estimated to be higher compared to those of apple seeds (Pires et al., 2018), lower than those of olive cultivars reported by (Nergiz and Engez, 2000; Uylaşer and Yildiz, 2013). This difference in fatty acid content is associated with stage of fruit ripening, varieties, agro-climatic conditions and harvesting season.
3.11 Estimation of organic acids and sugars
Sugars and organic acids are major contributors in the taste development and organoleptic properties of different vegetables and fruits. Organic acids are obtained by formation and degradation of some components in plants. These organic acids are responsible for metabolic activity in plant matrices (Zhang et al., 2021). The evaluation of the tested fruits was conducted to detect different individual sugars including glucose, galactose, sucrose and xylose (Tables 6). The most dominant individual sugar was galactose (4.92 %) while small concentration of sucrose (2.75%), and glucose (0.73 %) were also identified in the fruits of wild olives. The results of present analysis advocate the use of wild olive fruit as source of natural sugars. Only succinic acid was detected in tested wild olive fruits at a concentration of 8.8 mg/100 g DW (Tables 6). Variation in the concentration of organic acids might be attributed to the different varieties of plants including vegetables and fruits, and agroclimatic condition of the selected site of experiment (Poyrazoğlu et al., 2002). Nergiz & Engez, (2000) and Patumi, et al., (1990) reported the detection of different sugars (fructose and glucose) and (glucose, fructose and mannitol) by analyzing olive fruit on HPLC coupled with refractive index detector (RID). Likewise, Marsilio et al., (2001) analyzed olive fruit extract for presence of sugars as trimethylsilyl (TMS) on GC/GCMS. Mannitol and glucose was determined as dominant individual sugars. Values (mean ± SD) are average of three replicates, analyzed individually. ND: not determined.
Sugar content (g/100 g DW)
Organic acid (mg/100 g of dry matter)
Glucose
Sucrose
Galactose
Xylose
Total Sugar
Succinic acid
Gluconic acid
Malic acid
Oxalic acid
Citric acid
Acetic acid
0.73 ± 0.03
2.75 ± 0.24
4.92 ± 0.76
ND
8.40
8.80 ± 0.25
ND
ND
ND
ND
ND
Arslan, (2012) investigated Turkish olive fruits for its physico-chemical properties and organic acid profiling. Tested fruit was found to contain total organic acids (3280–7088 mg/kg), tartaric, succinic, oxalic, malic, lactic, galacturonic and citric acids in the range of 84–353.2, 731.7–1038, 46.5–128.7, 37.8–372.8, 53.8–514.5, 228.7–453.0 and 1149.20–5148.80 mg/100 g fresh weight, respectively. Turkish olive fruit was analyzed on HPLC coupled with UV detector to estimate succinic, malic, citric and oxalic acids in the range of 389.00–1650.00, 764.50–4310.00, 417.02–46.37.50 and 6.6–345.00 mg/100 g, respectively (Nergiz & Engez, 2000). Cunha et al. (2001) reported the estimation of succinic, lactic and citric acids in Portuguese green table olive at a concentration of 0–25.8, 0–188.3 and 214.1–477.3 mg/100 g, respectively. Likewise, Günç Ergönül & Nergiz (2010) detected succinic, malic, citric and oxalic acids in olive fruit over the concentration of 518–614, 764.50–2056.50, 702.50–2030 and 66.60–75.70 mg/100 g, respectively.
3.12 Minerals profiling
Wild olive fruits were analyzed using ICP-OES for quantification of minerals present in it. Potassium, calcium, magnesium and sodium were detected at a concentration of 17955.22, 1095, 390 and 40 mg/kg as dominant minerals (Tables 7). The amount of potassium and sodium needs to be optimized to keep the blood pressure of the body in normal levels (NRC, 1989). The normal physiological functions of human body are performed by optimum intake of essential minerals which are present in different fruits and vegetables. Moreno-Baquero et al., (2013) reported the estimation of sodium, potassium and calcium in seasoned cracked olives using atomic absorption spectrophotometer over the range of 10220–15466, 911–5567 and 980–3566 mg/kg, respectively as major minerals. Nergiz & Engez (2000) detected sodium, potassium, calcium, magnesium in the range of 11.1–32.8, 13951–16666, 23–56, 114–160 mg/kg as dominant minerals in Turkish olive fruits. Values (mean ± SD) are average of three replicates, analyzed individually. ND: Not Detected.
Elements
Concentration (mg/kg)
Elements
Concentration (mg/kg)
Al
150.95 ± 12.52
Se
5.52 ± 1.20
Ca
1095.73 ± 25.65
Cu
6.04 ± 0.09
Ba
2.04 ± 0.90
Cr
0.68 ± 0.02
Mg
390.69 ± 14.54
Na
240.19 ± 12.21
La
0.15 ± 0.02
Fe
111.70 ± 9.80
Mn
6.40 ± 0.05
B
25.43 ± 7.54
Ni
0.31 ± 0.02
Be
ND
Sr
5.23 ± 0.08
Co
0.21 ± 0.03
Zn
3.23 ± 0.06
P
154.66 ± 8.21
K
17955.22 ± 250.89
Sb
0.37 ± 0.03
Ti
25.19 ± 2.54
Si
47.61 ± 4.56
Cd
0.05 ± 0.02
V
ND
Pb
0.83 ± 0.02
3.13 Correlation study among biological potential, TF and TP
Pearson method was employed to conduct correlation analysis at P=0.001 of significance level (Table 8, 9) which showed TF and TP are positively correlated with inhibition potential, antimicrobial, biofilm and thrombolytic activities (P = 0.752, 0.862–0.937, 0.828–0.842 and 0.919), (P = 0.635, 0.651–0.847, 0.795–0.826 and 0.777) while IC50 value and haemolytic activity were found to have negative correlation (P=-0.780, -0.860), (P= -0.572, -0.595), respectively. We have already reported the presence of fourteen phenolic and flavonoid compounds in wild olive fruits (Ahmad et al., 2016), thus biological attributes of wild olive fruits are positive correlation with phenolic and flavonoid components in it.
TP
IC50 Value
Inhibition Potential
Antibacterial activity
Antifungal activity
Biofilm inhibition
Hemolytic activity
Thrombolytic activity
S.aureus
E.coli
B. cereus
A. niger
A. flavus
F. oxysporum
S. aureus
E. coli
TP
1
IC50 Value
-0.780**
1
Inhibition Potential
0.752**
-0.937**
1
Antibacterial (S.aureus)
0.926**
-0.901**
0.893**
1
Antibacterial (E.coli)
0.898**
-0.939**
0.929**
0.963**
1
Antibacterial (B. cereus)
0.892**
-0.720**
0.762**
0.797**
0.859**
1
Antifungal (A. niger)
0.897**
-0.922**
0.916**
0.982**
0.934**
0.759**
1
Antifungal (A. flavus)
0.937**
-0.878**
0.885**
0.964**
0.919**
0.849**
0.978**
1
Antifungal (F. oxysporum)
0.862**
-0.757**
0.708**
0.797**
0.737**
0.699**
0.859**
0.877**
1
Biofilm inhibition (S. aureus)
0.828**
-0.890**
0.926**
0.966**
0.939**
0.703**
0.955**
0.899**
0.724**
1
Biofilm inhibition (E.coli)
0.842**
-0.849**
0.842**
0.962**
0.940**
0.708**
0.909**
0.862**
0.620**
0.956**
1
Hemolytic activity
-0.860**
0.869**
-0.707**
-0.826**
-0.867**
-0.742**
-0.806**
-0.798**
-0.794**
-0.731**
-0.762**
1
Thrombolytic activity
0.919**
-0.899**
0.929**
0.945**
0.935**
0.879**
0.964**
0.985**
0.877**
0.900**
0.837**
-0.803**
1
TF
IC50 Value
Inhibition Potential
Antibacterial activity
Antifungal activity
Biofilm inhibition
Hemolytic activity
Thrombolytic activity
S.aureus
E.coli
B. cereus
A. niger
A. flavus
F. oxysporum
S. aureus
E.coli
TF
1
IC50 Value
-0.572*
1
Inhibition Potential
0.635**
-0.937**
1
Antibacterial (S.aureus)
0.847**
-0.901**
0.893**
1
Antibacterial (E.coli)
0.781**
-0.939**
0.929**
0.963**
1
Antibacterial (B. cereus)
0.783**
-0.720**
0.762**
0.797**
0.859**
1
Antifungal (A. niger)
0.781**
-0.922**
0.916**
0.982**
0.934**
0.759**
1
Antifungal (A. flavus)
0.817**
-0.878**
0.885**
0.964**
0.919**
0.849**
0.978**
1
Antifungal (F. oxysporum)
0.651**
-0.757**
0.708**
0.797**
0.737**
0.699**
0.859**
0.877**
1
Biofilm inhibition (S. aureus)
0.795**
-0.890**
0.926**
0.966**
0.939**
0.703**
0.955**
0.899**
0.724**
1
Biofilm inhibition (E.coli)
0.826**
-0.849**
0.842**
0.962**
0.940**
0.708**
0.909**
0.862**
0.620**
0.956**
1
Hemolytic activity
-0.595**
0.869**
-0.707**
-0.826**
-0.867**
-0.742**
-0.806**
-0.798**
-0.794**
-0.731**
-0.762**
1
Thrombolytic activity
0.777**
-0.899**
0.929**
0.945**
0.935**
0.879**
0.964**
0.985**
0.877**
0.900**
0.837**
-0.803**
1
The fruits of wild plants were explored for the occurrence of valuable nutrients and potential bioactive compounds due to the growing interest in their pharmacological benefits. Thus, the fruits of wild olives, native to Soon valley of Pakistan, were first time characterized for the presence of high-value nutrients and phenolic antioxidant compounds. The results of present research project have helped to bridge up the gap of scientific knowledge by authenticating the presence of phenolic antioxidants and high-value phytonutrients in the fruits of wild olive with notable biological activities which were rarely determined before. The results of present study advocate the potential utilization of the wild olive fruits in different formulation of nutra-pharmaceuticals and functional foods of multiple health benefits.
4 Conclusions
Wild fruits are promising source of phytonutrients and potent bioactives with multiple medicinal properties. Oleic and linoleic acids were detected as dominant unsaturated fatty acids in oil recovered from wild olive fruits. Appraisal of natural individual sugars (HPLC), organic acids (HPLC), valuable minerals (ICP-OES), total phenolics (TP) and total flavonoids (TF) and biological attributes of CCEs/PRFs, extracted from wild olive fruits, were performed. Potassium, calcium, magnesium, sodium and iron were identified as major minerals while succinic acid was detected as major organic acid in the fruits of wild olive. The aqueous-ethanolic extracts (CCEs/PRFs) furnished promising antioxidant and biological activities. There was a strong correlation among TF, TP and biological potential of CCEs/PRFs of wild olive fruits, indicating their biological activities were ascribed to the amount of total phenolic and flavonoids in the extracts. In view of bioactivities, the wild olive fruits could have potential application in nutra-pharmaceuticals industries.
Funding
Princess Nourah bint Abdulrahman University Researchers Supporting Project number (PNURSP2022R158) Princess Nourah bint Abdulrahman University, Riyadh, Saudi Arabia. The authors extend their appreciation to the Deanship of Scientific Research at King Khalid University, Saudi Arabia for funding this work through the Research Groups Program under Grant No R.G.P.2: 187/43.
Acknowledgements
Princess Nourah bint Abdulrahman University Researchers Supporting Project number (PNURSP2022R158) Princess Nourah bint Abdulrahman University, Riyadh, Saudi Arabia. The authors extend their appreciation to the Deanship of Scientific Research at King Khalid University, Saudi Arabia for funding this work through the Research Groups Program under grant number R.G.P.2: 187/43.
Declaration of Competing Interest
The authors declare that they have no known competing financial interests or personal relationships that could have appeared to influence the work reported in this paper.
References
- Phytochemical investigation, physicochemical characterization, and antimicrobial activities of Ethiopian propolis. Arab. J. Chem.. 2022;15:103931
- [CrossRef] [Google Scholar]
- Antioxidant and antimicrobial attributes of different solvent extracts from leaves and flowers of akk [Calotropis procera (Ait.) Ait. F.)] J. Med. Plant Res.. 2011;5:4879-4887.
- [Google Scholar]
- Characterization of free and conjugated phenolic compounds in fruits of selected wild plants. Food Chem.. 2016;190:80-89.
- [CrossRef] [Google Scholar]
- Characterization of olive oils obtained from wild olive trees (Olea ferruginea Royle) in Pakistan. Food Res. Int.. 2013;54:1965-1971.
- [CrossRef] [Google Scholar]
- Fatty acid, tocopherol and sterol compositions of Canadian prairie fruit seed lipids. JAOCS, J. Am. Oil Chem. Soc.. 2008;85:953-959.
- [CrossRef] [Google Scholar]
- Enzyme-aided cold pressing of flaxseed (Linum usitatissimum L.): enhancement in yield, quality and phenolics of the oil. Grasas y Aceites. 2013;64:463-471.
- [CrossRef] [Google Scholar]
- Physico-chemical characteristics of olive fruits of Turkish varieties from the province of Hatay. Grasas y Aceites. 2012;63:158-166.
- [CrossRef] [Google Scholar]
- Phenolic profile and antioxidant activity of olive fruits of the Turkish variety “Sariulak” from different locations. Grasas y Aceites. 2011;62:453-461.
- [CrossRef] [Google Scholar]
- Benavente-garcõâa, O., Castillo, J., Lorente, J., Ortun, A., 2000. Antioxidant activity of phenolics extracted from Olea europaea L . leaves 68.
- Phytochemical composition, antioxidant and antimicrobial properties of raspberry fruit, pulp, and marc extracts. CYTA - J. Food. 2013;11:334-342.
- [CrossRef] [Google Scholar]
- Phytochemical analysis, UPLC-ESI-Orbitrap-MS analysis, biological activity, and toxicity of extracts from Tripleurospermum limosum (Maxim.) Pobed. Arab. J. Chem.. 2022;15
- [CrossRef] [Google Scholar]
- Separation and determination of flavonoids and other phenolic compounds in cranberry juice by high-performance liquid chromatography. J. Chromatogr. A. 2001;913:387-395.
- [CrossRef] [Google Scholar]
- Coronary thrombolysis: Streptokinase or recombinant tissue-type plasminogen activator? Ann. Intern. Med.. 1990;112:529-538.
- [CrossRef] [Google Scholar]
- Cunha, S.C., Ferreira, I.M.P.L.V.O., Fernandes, J.O., Faria, M.A., Beatriz, M., Oliveira, P.P., Ferreira, M.A., 2001. Determination of lactic, acetic, succinic, and citric acids in table olives by HPLC/UV. J. Liq. Chromatogr. Relat. Technol. 24, 1029–1038. https://doi.org/10.1081/JLC-100103429
- Extracts of olive polyphenols improve lipid stability in cooked beef and pork: Contribution of individual phenolics to the antioxidant activity of the extract. Food Chem.. 2009;116:892-897.
- [CrossRef] [Google Scholar]
- Antithrombotic effect of repeated doses of the ethanolic extract of local olive (Olea europaea L.) leaves in rabbits. Libyan J. Med.. 2013;8:1-6.
- [CrossRef] [Google Scholar]
- Determination of organic acids in olive fruit by HPLC. Czech J. Food Sci.. 2010;28:202-205.
- [CrossRef] [Google Scholar]
- Characteristics of some wild olive phenotypes (Oleaster) selected from the Western Mountains of Syria. Sustain.. 2022;14:1-14.
- [CrossRef] [Google Scholar]
- Chemical profiles and antioxidant activities of leaf, pulp, and stone of cultivated and wild olive trees (Olea Europaea L.) Int. J. Fruit Sci.. 2020;20:350-370.
- [CrossRef] [Google Scholar]
- Antioxidant attributes of four Lamiaceae essential oils. Pakistan J. Bot.. 2011;43:1315-1321.
- [Google Scholar]
- Ultrasonic extraction and HPLC determination of anthraquinones, aloe-emodine, emodine, rheine, chrysophanol and physcione, in roots of Polygoni multiflori. Phytochem. Anal.. 2009;20:272-278.
- [CrossRef] [Google Scholar]
- Antioxidant and antibacterial activities of the leaf essential oils of Himalayan Lauraceae species. Food Chem. Toxicol.. 2010;48:37-40.
- [CrossRef] [Google Scholar]
- Screening of 70 medicinal plant extracts for antioxidant capacity and total phenols. Food Chem.. 2006;94:550-557.
- [CrossRef] [Google Scholar]
- Protection of oxidative hemolysis by demethyldiisoeugenol in normal and β-thalassemic red blood cells. Free Radic. Biol. Med.. 1997;22:215-222.
- [CrossRef] [Google Scholar]
- Potent bioactive methanolic extract of wild orange (Citrus macroptera Mont.) shows antioxidative, anti-inflammatory, and antimicrobial properties in in vitro, in vivo, and in silico studies. Bull. Natl. Res. Cent.. 2020;44
- [CrossRef] [Google Scholar]
- Free radical scavenging capacity in the aging of selected red spanish wines. J. Agric. Food Chem.. 1999;47:1603-1606.
- [CrossRef] [Google Scholar]
- Development and validation of the new EPA microwave-assisted leach method 3051A. Environ. Sci. Technol.. 1998;32:3628-3632.
- [CrossRef] [Google Scholar]
- In vitro antioxidant activity of olive leaf extract (Olea europaea L.) In: And Its ProtEctivE E Ff Ect on OxidativE DamagE in Human ErythrocytEs 1–26. 2018.
- [CrossRef] [Google Scholar]
- Antioxidant and hepatoprotective activities of phenolic rich fraction of Seabuckthorn (Hippophae rhamnoides L.) leaves. Food Chem. Toxicol.. 2011;49:2422-2428.
- [CrossRef] [Google Scholar]
- Effect of maturity on phenolics (Phenolic acids and flavonoids) profile of strawberry cultivars and mulberry species from Pakistan. Int. J. Mol. Sci.. 2012;13:4591-4607.
- [CrossRef] [Google Scholar]
- Variation of phenolics and antioxidant activity between peel and pulp parts of pear (Pyrus communis L.) fruit. Pakistan J. Bot.. 2013;45:1521-1525.
- [Google Scholar]
- Sugar and polyol compositions of some European olive fruit varieties (Olea europaea L.) suitable for table olive purposes. Food Chem.. 2001;72:485-490.
- [CrossRef] [Google Scholar]
- Phenolic content and antioxidant activity of olive extracts. Food Chem.. 2001;73:73-84.
- [CrossRef] [Google Scholar]
- Mineral and sensory profile of seasoned cracked olives packed in diverse salt mixtures. Food Chem.. 2013;138:1-8.
- [CrossRef] [Google Scholar]
- Research on the phenolic compounds in Sarilop (Ficus Carica L.) Fig variety (in English) Gida. 2013;38:267-274.
- [CrossRef] [Google Scholar]
- NCCLS, 1997. National Committee for Clinical Laboratory Standards (NCCLS). Approved Standard M2 A6, 1997, 5th edn . NCCLS: Wayne, PA.
- NCCLS, 1999. National Committee for Clinical Laboratory Standards (NCCLS). M100-S9., 1999, NCCLS: Wayne, PA.
- Compositional variation of olive fruit during ripening. Food Chem.. 2000;69:55-59.
- [CrossRef] [Google Scholar]
- NRC, 1989. National Research Council. Recommended dietary allowances., 1989, (10th ed .). Washington: National Academy Press. 1989.
- Determination of some precursors of lipid biosynthesis in olive fruits during ripening. Olive Grow: Int. Symp; 1990. p. :286.
- Antimicrobial activity of wild olive crude extracts in vitro. Int. J. Pharma Sci. Res.. 2011;2:110-113.
- [Google Scholar]
- Organic acids and phenolic compounds in pomegranates (Punica granatum L.) grown in Turkey. J. Food Compos. Anal.. 2002;15:567-575.
- [CrossRef] [Google Scholar]
- Guaijaverin - a plant flavonoid as potential antiplaque agent against Streptococcus mutans. J. Appl. Microbiol.. 2006;101:487-495.
- [CrossRef] [Google Scholar]
- Development of an in vitro model to study clot lysis activity of thrombolytic drugs. Thromb. J.. 2006;4:9-12.
- [CrossRef] [Google Scholar]
- Phytochemical screening and in vitro antibacterial, antioxidant, anti-inflammatory, anti-diabetic, and wound healing attributes of Senna auriculata (L.) Roxb. leaves. Arab. J. Chem.. 2021;14:103345
- [CrossRef] [Google Scholar]
- Phenolic composition, antioxidant and antibacterial properties, and in vitro anti-HepG2 cell activities of wild apricot (Armeniaca Sibirica L. Lam)kernel skins. Food Chem. Toxicol.. 2019;129:354-364.
- [CrossRef] [Google Scholar]
- Antioxidant and antimicrobial activity of polyphenol extracts from wild berry fruits grown in Southeast Serbia. Trop. J. Pharm. Res.. 2013;12:813-819.
- [CrossRef] [Google Scholar]
- Antioxidant and antimicrobial attributes and phenolics of different solvent extracts from leaves, flowers and bark of gold mohar [Delonix regia (Bojer ex Hook.) Raf.] Molecules. 2011;16:7302-7319.
- [CrossRef] [Google Scholar]
- Nutraceuticals and functional foods: Whole versus processed foods. Trends Food Sci. Technol.. 2009;20:376-387.
- [CrossRef] [Google Scholar]
- Studies on the antioxidant activity of Indian Laburnum (Cassia fistula L.): a preliminary assessment of crude extracts from stem bark, leaves, flowers and fruit pulp. Food Chem.. 2002;79:61-67.
- [CrossRef] [Google Scholar]
- Effect of solvent and extraction temperatures on the antioxidant potential of traditional stoned table olives “alcaparras”. LWT - Food Sci. Technol.. 2008;41:739-745.
- [CrossRef] [Google Scholar]
- Chemical characterization of “alcaparras” stoned table olives from northeast Portugal. Molecules. 2011;16:9025-9040.
- [CrossRef] [Google Scholar]
- A modified microtiter-plate test for quantification of staphylococcal biofilm formation. J. Microbiol. Methods. 2000;40:175-179.
- [CrossRef] [Google Scholar]
- Effect of extraction solvent/technique on the antioxidant activity of selected medicinal plant extracts. Molecules. 2009;14:2167-2180.
- [CrossRef] [Google Scholar]
- Antimicrobial and antioxidant activities of the essential oil and various extracts of Salvia tomentosa Miller (Lamiaceae) Food Chem.. 2005;90:333-340.
- [CrossRef] [Google Scholar]
- Microbiological and chemical profiles of naturally fermented table olives and brines from different Italian cultivars. Antonie van Leeuwenhoek. Int. J. Gen. Mol. Microbiol.. 2012;102:121-131.
- [CrossRef] [Google Scholar]
- Fatty acid profile and mineral content of commercial table olives from Turkey. Not. Bot. Horti Agrobot. Cluj-Napoca. 2013;41:518-523.
- [CrossRef] [Google Scholar]
- Activity and mechanisms of action of selected biocidal agents on Gram-positive and -negative bacteria. J. Appl. Microbiol.. 2003;94:240-247.
- [CrossRef] [Google Scholar]
- Haemolytic activities and adjuvant effect of Astragalus membranaceus saponins (AMS) on the immune responses to ovalbumin in mice. Vaccine. 2005;23:5196-5203.
- [CrossRef] [Google Scholar]
- Antioxidant activity of anthraquinones and anthrone. Food Chem.. 2000;70:437-441.
- [CrossRef] [Google Scholar]
- Zhang, X., Wei, X., Ali, M.M., Rizwan, H.M., Li, B., Li, H., Jia, K., Yang, X., Ma, S., Li, S., Chen, F., 2021. Changes in the content of organic acids and expression analysis of citric acid accumulation-related genes during fruit development of yellow (Passiflora edulis f. flavicarpa) and purple (passiflora edulis f. edulis) passion fruits. Int. J. Mol. Sci. 22. https://doi.org/10.3390/ijms22115765
- Antioxidant and free radical-scavenging activities of phenolic extracts of olive fruits. Food Chem.. 2010;120:1097-1103.
- [CrossRef] [Google Scholar]
- Simultaneous determination of catechins, caffeine and gallic acids in green, oolong, black and pu-erh teas using HPLC with a photodiode array detector. Talanta. 2002;57:307-316.
- [CrossRef] [Google Scholar]


