

Translate this page into:
Wild strawberry (Arbutus unedo): Phytochemical screening and antioxidant properties of fruits collected in northern Morocco
⁎Corresponding author at: Department of Biomedical, Dental, Morphological and Functional Imaging Sciences, University of Messina, 98125 Messina, Italy. cacciolaf@unime.it (Francesco Cacciola)
-
Received: ,
Accepted: ,
This article was originally published by Elsevier and was migrated to Scientific Scholar after the change of Publisher.
Peer review under responsibility of King Saud University.
Abstract
The aim of this study was to determine the polyphenolic compounds and the antioxidant ability of Arbutus unedo fruits, collected from three regions of northern Morocco, using high-performance liquid chromatography coupled to diode array and electrospray ionization mass spectrometry detection. The proper extraction method has been selected to achieve this objective. After delipidation, the three harvests were extracted by sonication using two solvents with increased polarity ethyl acetate and MeOH:water, 80:20 (v/v). Total polyphenols, flavonoids, tannins and anthocyanins were respectively: 108.41 ± 9.29 mg GAE/g (w/w) dry weight (DW), 101.07 ± 5.6 mg QE/g (w/w) (DW), 0.45 ± 0.48 mg EC/g (w/w) (DW) and 0.35 ± 0.48 mg Pg-3-glu/g (w/w) (DW). EC50 values for reducing power and DPPH radical scavenging activities were between 1.37 ± 0.2 and 17.82 ± 0.12 µg/mL (w/v). A total of 75 compounds were tentatively identified and some of these had never been found until nowadays in Arbutus unedo. The average amount of antioxidant compounds obtained by semi-quantitative analyses was 120.35 ± 32.05 mg/100 g (w/w) (DW). The attained results clearly highlight the potential of A. unedo as a source of healthy compounds, which could be advantageously added to the daily diet, making it a potential candidate for the cure for many emerging diseases.
Keywords
Polyphenols
Flavonoids
Tannins
Anthocyanins
DPPH
HPLC-MS

1 Introduction
The human body is exposed to several diseases, mostly due to malnutrition and this appears to be related to reactive oxygen species (ROS). The integration of natural substances with antioxidant activity in our diet is considered as the main solution to reduce the manifestation of many health problems. For this reason, an ever-increased interest is now poured on not-yet explored plants characterized by bioactive molecules with potential beneficial effects.
A. unedo L. (Ericaceae family) is a wild Mediterranean species, commonly known as a strawberry tree. It grows in the Mediterranean forest including the Moroccan ones, due to its tolerance to dryness and its ability to regenerate and recolonize forest fire. This species can also withstand hot summers and mild rainy winters (Celikel et al., 2008).
This fruit is not widely consumed by the Moroccan population and its consumption remains seasonal also because of the lack of knowledge concerning its potential benefits. However, in other Mediterranean regions, A.unedo L. is already known as a good source of sugars, organic acids, antioxidants including phenolic compounds, vitamins C and E, and carotenoids (Alarcao-E-Silva et al., 2001; Ayaz et al., 2000; Fortalezas et al., 2010; Tavares et al., 2010; Pallauf et al., 2008; Pawlowska et al., 2006). Many studies showed that the extract of this species does possess vasorelaxant, diuretic, natriuretic, antihyperglycemic, astringent, urinary antiseptic, antidiarrheal properties, and more recently, it was used in the therapy of hypertension and inflammation without displaying any acute toxic effect (Bnouham et al., 2010; Mariotto et al., 2008; El Amine Dib et al., 2013; Ziyyat et al., 2002; Legssyer et al., 2004; Mekhfi et al., 2006). Based on its high yield of antioxidants compounds A. unedo could be used as a source of health-promoting compounds for both the food industry or the pharmaceutical and chemical sectors.
Therefore, it is challenging to ameliorate the knowledge about the nutritional and production of the strawberry-tree fostering the consumption of this fruit for food products such as yogurts, pie and pastry fillings, cereal or meat products as recently described (Alarcao-E-Silva et al., 2001; Ganhão et al., 2010).
However, there are only a few studies on the chemical composition of A. unedo fruits from Morocco. These studies have a limited identification and quantification of the occurring compounds. Recently, a study was focused on increasing the extraction process from strawberry-tree fruits with the identification of 30 phenolics compounds including 8 anthocyanins (Alexandre et al. 2020). It is worth mentioning that the variation of ecophysiological factors may have an influence on the nutritional parameters of fruits (Fang et al., 2008; Reddy and Sathyanarayana, 2017). In particular, climatic differences may affect production rates and nutritional composition (harvest in late autumn and flowering in autumn of the preceding year). However, no data have been found about the geographical impact on the variation of antioxidants compound content in A. unedo.
Thus, the aim of this work was first to a) obtain the highest yield in terms of polyphenolic compounds and evaluate their antioxidant properties using fractionation by two solvents with increasing polarity b) determination of the phytochemical content A. unedo fruits, influenced by the geographical variations of the year 2017 in Morocco, by high-performance liquid chromatography coupled to diode array and electrospray ionization mass spectrometry detection (HPLC-DAD-ESI/MS) in order to evaluate their potential value.
2 Materials and methods
2.1 Samples
The fruits of Arbutus unedo L. were collected fully ripened in October 2017 from three different forests: Achakar (AA), Qsar Kbir (AQ), and Chaoun-Qalaa (AC) (northern region of Morocco). Mature berries with seeds were freeze-dried, ground, and stored at –20 °C prior to extraction.
2.2 Chemicals
2,20-Diphenyl-1-picrylhydrazyl (DPPH), 2,2′-azobis (2-amidinopropane), gallic acid dihydrochloride (AAPH), L-ascorbic acid, trichloroacetic acid (TCA), 1,1,3,3- tetraethoxypropane (TEP), thiobarbituric acid (TBA), and butylated hydroxytoluene (BHT) were purchased from Sigma (St. Lois, MO). Folin-Ciocalteu phenol reagent was obtained from Fluka. Standards (gallic acid, caffeic acid, rutin, catechin, coumaric acid, kaempferol, isorhamnetin, cinnamic acid, apigenin, and vanillic acid) were obtained from Merck Life Science (Merck KGaA, Darmstadt, Germany). LC-MS grade methanol, acetonitrile, acetic acid, acetone, and water were purchased from Merck Life Science (Merck KGaA, Darmstadt, Germany). All other chemicals were of analytical grade and obtained from Sigma (St. Louis, MO).
2.3 Extraction
5 g of lyophilized powder was defatted three times with 50 mL of n-hexane, dried, and were homogenized with 50 mL of two solvents with increased polarity (EtOAc and MeOH:water, 80:20 v/v). Each fraction was extracted by sonication in an ultrasound bath (130 kHz) for 45 min. After centrifugation at 5000 g for 5 min, the supernatant filtered through a paper filter, dried, reconstituted with MeOH:water, 80:20 (v/v) and then filter through 0.45 μm Acrodisc nylon membrane (Merck Life Science, Merck KGaA, Darmstadt, Germany) prior to HPLC-DAD-ESI/MS analysis. The resulting extracts were stored at 4 °C until use.
2.4 Phytochemical screening
Phytochemical screening was made according to the method of Trease and Evans (1989) in order to detect the presence of starch, saponins, flavonoids, tannins, catechic tannins, gallic tannins, anthocyanins, and alkaloids. The tests were based on visual observation of the color change or the formation of a precipitate after the addition of specific reagents.
2.5 Determination of total polyphenols
Total polyphenols content was determined with the Folin-Ciocalteu reagent by spectrophotometry according to the method of Singleton and Rossi. (1965) with some modifications. Gallic acid was used as standard (10, 25, 50, 100, 200 ppm). The total phenolic content was measured at 755 nm and was expressed in mg of gallic acid (GAE) / g dry weight (DW).
2.6 Determination of the total flavonoids
Quantification of flavonoids was made by the method of Zhishen et al., (1999), using AlCl3 to 10% (w/v), NaOH 4% and NaNO2 to 5%. The absorbance was determined at 510 nm. A curve of catechin (12.5, 25, 50, 100, 200 ppm) was also carried out. The total flavonoids content was expressed in mg of quercetin (QE)/g dry weight (DW).
2.7 Determination of anthocyanins
Determination of the total anthocyanin content was based on the differential pH (pH = 1 and pH = 4.5) by the method of Giusti and Wrolstad, (2001) with some modifications. Measurement was conducted at 510–700 nm in the UV–Vis spectrophotometer. The absorbance was calculated by the following formula:
The total anthocyanin content was calculated by the molecular weight of pelargonidin-3-glucoside by the following formula:
2.8 Determination of tannins
The content of condensed tannins has been determined by the vanillin method described by Julkunen-Tiitto (1985). A volume of 50 μL of each extract was added to 1500 μL of the 4% vanillin (w/v) in MeOH: water, 80:20 (v/v) then mix vigorously. Immediately after that 750 μL of hydrochloric acid concentrated (HCl) was added. The absorbance of the resulting mixture was measured at 550 nm after being allowed to react for 20 min at room temperature. The results were plotted after a (+)-catechin standard made in the same manner.
2.9 Determination of antioxidant activity
DPPH radical scavenging activity of entire fruit extracts was measured according to the method described by Braca et al., (2002) with a few modifications. Briefly, different concentration of extracts (25 µL) were added to 2 mL of 6.25–10 − 5 M DPPH MeOH:water, 80:20 (v/v) solution. After gentle mixing and 30 min of standing at room temperature, the absorbance of the resulting solutions was measured at 517 nm. The antiradical activity is estimated according to this equation: % of antiradical activity = [(Abs control –Abs sample) / Abs control] × 100. IC50 values of the extract i.e., the concentration of extract necessary to decrease the initial concentration of DPPH by 50% was calculated.
2.10 HPLC-DAD-ESI/MS
LC analyses were performed on a Nexera-e liquid chromatograph (Shimadzu, Kyoto, Japan), consisting of a CBM-20A controller, two LC-30AD dual-plunger parallel-flow pumps, a DGU-20A5R degasser, a CTO-20AC column oven, a SIL-30AC autosampler, an SPD-M30A photodiode array detector, and an LCMS-8050 triple quadrupole mass spectrometer, through an ESI source (Shimadzu, Kyoto, Japan), operating in both negative and positive ionization modes.
As chromatographic column, an Ascentis Express RP C18 column (150 × 4.6 mm; 2.7 µm) (Merck Life Science, Merck KGaA, Darmstadt, Germany) was employed. The mobile phase was composed of water/acetic acid (99.85/0.15 v/v, solvent A) and acetonitrile/acetic acid (99.85/0.15 v/v, solvent B), The flow rate was set at 1 mL/min under gradient elution: 0–5 min, 5% B, 5–15 min, 10% B, 15–30 min, 20% B, 30–60 min, 50% B, 60 min, 100% B. DAD detection was applied in the range of λ = 200–400 nm and two different wavelengths were monitored at λ = 280 nm and λ = 350 nm (sampling frequency: 40.0 Hz, time constant: 0.08 s). MS conditions were as follows: scan range and the scan speed were set at m/z 100–800 and 2500 u/sec, respectively, event time: 0.3 sec, nebulizing gas (N2) flow rate: 1.5 L/min, drying gas (N2) flow rate: 15 L/min, interface temperature: 350 °C, heat block temperature: 300 °C, DL (desolvation line) temperature: 300 °C, DL voltage: 1 V, interface voltage: −4.5 kV. Calibration curves (R2 ≥ 0.997) of eleven polyphenolic standards used for the semi-quantification in sample extracts were obtained using triplicate injections with different concentrations in the range of (1, 5, 10, 50, 100 ppm), and according to the area of peaks acquired at following wavelengths of 270 nm, 277 nm, 278 nm, 280 nm, 321 nm, 330 nm, 336 nm, 365 nm, 370 nm, 355 nm. All protocatechuic acid, gallic acid, ellagic acid, methylellagic acid, ellagitannins, and their derivatives were quantified as gallic acid. Caffeoylquinic acid, caffeic acid and its derivatives, feruloylquinic acid, and syringic acid were quantified as caffeic acid while cinnamic acid derivatives and p-coumaroylquinic acid were quantified as cinnamic acid. Dihydroxyflavone and apigenin derivatives were quantified as apigenin. Epigallocatechin, catechin, and procyanidin were quantified as catechin. Myricetin and kaempferol derivatives were quantified as kaempferol while all quercetin derivatives were quantified as rutin. For the rest of compounds, calibration curves of vanillic acid, coumaric acid and isorhamnetin, were employed. (Mosele et al., (2016).
2.11 Statistical analysis
For each one of the samples, three replicates were analyzed. The results of these assays are expressed as mean values and standard deviation (SD). Differences among treatments were detected by analysis of variance ANOVA (P < 0.05).
3 Results and discussions
3.1 Phytochemical screening
To obtain a general vision of the existing compounds occurring in the extracts, general phytochemical screening of all extracts was carried out. The employed colorimetric method showed the presence of flavonoids, tannins, anthocyanins, anthraquinones, sterols, steroids, deoxysugars, and glycosides, while alkaloids, and saponosides were not detected (Table 1). This finding, except for the presence of alkaloids, was in agreement with a previous work (Dib et al., 2013). A: Flavones; B: Isoflavones; C: Flavonols; D: Flavonones ++: Abundant; + Presence of metabolite; ± trace; – Absence of metabolite.
Regions
AA
AC
AQ
All
Compounds groups/ solvent of extraction
EtOAc
MeOH: water, 80:20 (v/v)
EtOAc
MeOH: water, 80:20 (v/v)
EtOAc
MeOH: water 80:20 (v/v)
H2O
Alcaloids
–
–
–
–
–
–
–
Polyphenols
Flavonoids
B
D++
A+
D++
A+
C++
D++
Tannins
+
+
+
+
+
+
+
Anthocyanins
+
+
+
+
+
+
±
Catechic tannins
+
–
+
–
+
–
+
Gallic tannins
+
–
+
–
+
–
+
Coumarins
+
–
+
–
+
–
–
Quinones
–
–
–
+
–
+
+
Anthraquinones
+
+
+
+
+
+
++
Steroids
Saponosides
–
–
–
–
–
–
–
Insaturated sterols/Terpenes
–
±
–
±
–
±
±
Sterols Steroides
++
++
++
++
++
++
+
Sugars
Deoxy sugars
+
+
+
+
+
+
+
Glycosides
+
+
+
+
+
+
+
Mucilage
–
–
–
–
–
+
+
3.2 Polyphenolic content
The determination of the content of phenolic acids, flavonoids, carotenoids, vitamins, and minerals occurring in fruits and vegetables is mandatory for the evaluation of their health-promoting properties and immunity-boosting effects. Table 2 shows the extraction yields, total phenolic, flavonoid, anthocyanins, tannin contents, and antioxidant activity EC50 values of the wild fruits. The higher extract yields for total phenolic, flavonoids, and tannins were attained for the MeOH:water, 80:20 (v/v) extract with respect to EtOAc. On the other hand, the highest concentration of anthocyanins contents was observed for the EtOAc extract. The average of the total contents of phenolic acid, flavonoids, anthocyanins and tannins were respectively 108.41 ± 9.29 mg GAE/g (w/w) (DW), 101.07 ± 5.6 mg QE/g (w/w) (DW), 0.35 ± 0.48 mg Pg-3-glu/g (w/w) (DW) and 0.45 ± 0.48 mg EC/g (w/w) (DW). The results concerning the polyphenolic contents are 5-fold higher than another study which found it between 9.51 and 19.73 mg GAE/g (w/w) (DW) (Ruiz-Rodríguez et al., 2011). Also, this concentration is higher than those obtained in the fruits collected from Portugal (16.7 ± 0.4 mg GAE/g (w/w) (DW); (Mendes et al., 2011). The fruit extract from Chaoun-Qalaa (AC) presented the highest yield (68.33%) and the highest quantity of polyphenols and flavonoids (127.5 ± 7.14 mg GAE/g (w/w) (DW) and 105.9 ± 3.2 mg QE /g (w/w) (DW)). It was higher than the ones found by Barros et al., 2010 (126.83 ± 6.66 mg GAE/g (w/w) (DW) and 34.99 ± 1.55 mg CE/g (w/w) (DW)).
N%
Total Phenolic content (mg GAE/g) (w/w) (DW)
Flavonoid content (mg QE/g) (w/w) (DW)
Anthocyanines content (mg Pg-3-glu)/g (w/w) (DW)
Tannin content (mg EC/g) (w/w) (DW)
DPPH scavenging activity EC50 (µg/mL) (w/v)
Sample
EtOAc
MeOH: water, 80:20 (v/v)
EtOAc
MeOH: water, 80:20 (v/v)
EtOAc
MeOH: water, 80:20 (v/v)
EtOAc
MeOH: water, 80:20 (v/v)
EtOAc
MeOH: water, 80:20 (v/v)
EtOAc
MeOH: water, 80:20 (v/v)
AA
1.28a ± 0.21
51.11c ± 6.61
34.8c ± 0.3
73.62b ± 3.28
34.08c ± 1.24
66.99a ± 1.55
0.25b ± 0.01
0.1b ± 0.012
0.4a ± 0.004
0.82a ± 0.05
17.82a ± 0.12
1.64a ± 0.14
AC
1.1a ± 0.23
67.23a ± 6.43
51.61a ± 0.98
75.88a ± 3.1
41.51a ± 0.04
64.4b ± 0.08
0.13c ± 0.006
0.14a ± 0.015
0.14c ± 0.005
0.5b ± 0.04
11.42b ± 0.13
1.37c ± 0.2
AQ
0.71b ± 0.18
59.17b ± 6.58
45.84b ± 0.61
61.37c ± 0.43
37.43b ± 0.22
54.9c ± 2.8
1.42a ± 0.09
0.06c ± 0.002
0.21d ± 0.007
0.9a ± 0.1
11.52b ± 0.09
1.51b ± 0.1
The highest quantity of total anthocyanins and tannins content was obtained from AQ fruit extract by EtOAc (1.42 ± 0.09 mg Pg-3-glu/g (w/w) (DW) and 0.9 ± 0.1 mg EC/g (w/w) (DW) respectively). In another study 0.76 ± 9.85 mg cy-3-glu/g (w/w) (DW) was found as the total amount of anthocyanin (Fortalezas et al., 2010). All extract obtained from EtOAc and MeOH:water, 80:20 (v/v) showed a significant amount of phenolic compounds. Another research realized on aqueous methanol extracts (methanol:water, 80:20 v/v) using sonication exposed an amont of 34.3 ± 1.9 mg GAE/g and 2.1 ± 0.1 mg RE/g respectively for total phenolic acids and total flavonoids (Asma et al., 2019).
In general, these differences could be due to environmental characteristics, the period of harvesting, cultivar variability, or fruit maturity (Ancos et al., 2000). For testing the antiradical activity of a large variety of the existing compounds in all extracts, the scavenging activity on DPPH was used as screening method. The results presented in Fig. 1 show that all A. unedo samples do have antiradical ability (lowest EC50 values). This efficiency was 10-fold higher in samples extracted by MeOH:water, 80:20 (v/v) than other extracted by EtOAc. AC fruits presented the highest phenolic content which is compatible to its lower EC50 (11.42 ± 0.13 and 1.37 ± 0.2 µg/mL (w/v) for MeOH:water, 80:20 (v/v) and EtOAc extracts). The value of EC50 indicates that the investigated sample extracts show significantly higher antioxidant capacity. The results are superior than the ones obtained in other studies (EC50 447.92 ± 0.81, Barros et al., 2010 and 790 ± 0.016 µg/mL (w/v), Mendes et al., 2011).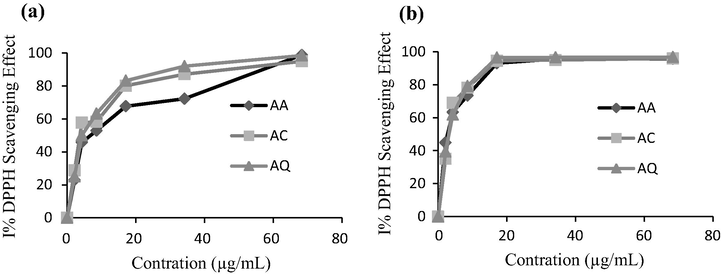
Scavenging activity on DPPH radicals of EtOAc (a) and MeOH:water, 80:20 (v/v) (b) extracts of A. unedo fruits from three different regions.
3.3 Phytochemical profile by HPLC-DAD-ESI/MS
Fruits of strawberry tree were partitioned with two different solvents in increasing order of polarity with the aim to identify the maximum number of compounds with different solubility. Concerning the qualitative composition of A. unedo fruits, all extracts were analyzed by - HPLC-DAD-ESI/MS (Tables 3 and 4) and a large variety of compounds were tentatively identified based on their retention times, MS data and comparison with available references and literature survey. The main compounds present in the strawberry tree were represented by organic acids (malic acid and citric acid), phenolic acids (quinic acid, protocatechuic acid, gallic acid, caffeic acid, ferulic acid, cinnamic acid, ellagic acid, syringic acid, and hydroxycoumarin), flavones (dihydroxyflavone), flavanols (catechins, epicatechins, procyanidin dimer with respective gallate and prodelphinidin), flavonols (hexoside of isorhamnetin, myricetin, quercetin, kaempferol and apigenin) and other compounds (ascorbic acid, benzyl alcohol pentose, and hydroxyphenylvaleric). Most of these compounds were already described in A.unedo by Pawlowska et al., (2006), Fortalezas et al., (2010), Mendes et al., (2011), Guimarães et al., (2013) and Mosele et al., (2016). The number of determined compounds is the highest one compared to previously published data reporting many new compounds for the first time.
Peak
Tentative Identification
tR (min)
Identification type
λMAX (nm)
[M−H]-
Major fragments
A.A
A.C
A.Q
Organic acid
2
Citric acid
1.83
(Ayaz et al., 2000) DAD/MS
254
191
–
–
+
+
5
Malic acid
2.27
(Ayaz et al., 2000) DAD/MS
206
133
–
+
+
+
44
Malic acid derivative
2.45
DAD/MS
–
133
–
+
–
–
Phenolic acid and derivatives
1
Protocatechuic acid
9.71
(Ayaz et al., 2000; Mosele et al., 2016) DAD/MS
295
153
–
–
–
3a
Quinic acid derivative
1.65
DAD/MS
–
383
191
+
–
–
3b
Quinic acid derivative
1.77
DAD/MS
–
287
191
–
–
+
6
Cinnamic acid derivative
3.67
DAD/MS
277
267
147
+
+
+
7
Galloylquinic acid
5.59
(Mendes et al., 2011; Tavares et al., 2010) DAD/MS
208–273
343
169,191
+
+
+
8a
Ellagitannin N.I
6.79
DAD/MS
273
687
343
–
–
+
9
Gallic acid glucoside
8.63
(Mendes et al., 2011; Tavares et al., 2010) DAD/MS
255–294
331
169,191
+
+
+
11
Galloyl shikimic acid
10.69
(Mendes et al., 2011; Tavares et al., 2010) DAD/MS
259–272
325
169
+
+
+
12
Ellagic acid glucoside
10.61
(Mendes et al., 2011) DAD/MS
273–275
463
303+
–
–
+
13a
Caffeic acid derivative
1.58
DAD/MS
276–321
357
179
–
–
+
13b
Caffeic acid derivative
11.10
DAD/MS
280–350
359
179
–
+
–
15
Protocatechuic acid glucoside
12.65
DAD/MS
270–357
315
153
+
–
+
19
Methylellagic acid rhamnoside
15.98
(Pallauf et al., 2008) DAD/MS
278
477
303+
–
–
+
20
Methylellagic acid rhamnopyranoside
16.60
DAD/MS
278
461
315
–
–
+
21
Digalloyl shikimic acid
19.75
(Mendes et al., 2011; Mosele et al., 2016) DAD/MS
272–275
477
325
+
+
+
24
Digalloyl glucose
20.07
DAD/MS
274
483
325,191
–
–
+
25
Strictinin ellagitannin
20.50
(Mendes et al., 2011; Tavares et al., 2010) DAD/MS
280
633
–
–
–
+
27
Gallic acid gallate
22.15
DAD/MS
281
321
169
–
–
+
29
Methylellagic acid derivative
25.67
DAD/MS
272
477
301
–
–
+
30
Galloyl derivatives
25.95
DAD/MS
267
357
169
–
–
+
32
Caffeoylquinic acid
26.56
(Guimarães et al., 2013) DAD/MS
282–364
353
191
–
–
+
40
Ellagic acid arabinoside/xyloside
31.08
(Mosele et al., 2016; Tavares et al., 2010) DAD/MS
265–347
599
–
–
–
+
45
Syringic acid
21.69
DAD/MS
270
197
–
+
–
–
49
Feruloylquinic acid
1.63
(Guimarães et al., 2013) DAD/MS
280–350
367
193,191
–
+
–
50
Quinic acid
2.09
DAD/MS
242
191
–
–
+
–
51
Cinnamic acid derivative
4.24
DAD/MS
277
343
267,147
–
+
–
52
Galloyl hexoside
6.83
DAD/MS
275
331
169, 191
–
+
–
53
4-hydroxycoumarin
9.77
DAD/MS
275–350
161
–
–
+
–
54
Galloyl derivative
25.95
(Mosele et al., 2016) DAD/MS
273
463
327, 169
–
+
–
Flavone
4
Dihydroxyflavone
2.36
287
253
–
–
–
+
Flavan-3-ols
10
Epigallocatechin
8.99
(Mosele et al., 2016) DAD/MS
270
325
305
–
–
+
14
Procyanidin dimer type B
11.58
(Mendes et al., 2011) DAD/MS
274
577
289
+
+
+
16
(-)-Catechin
13.69
(Mosele et al., 2016) DAD/MS
275–285
289
–
+
–
+
17
(+)-Catechin
14.80
(Mosele et al., 2016) DAD/MS
275–285
291+
289
+
+
18
(+)-Epicatechin
15.30
(Mosele et al., 2016) DAD/MS
270
289
–
+
+
+
22
(-)-Epicatechin gallate
18.62
(Mosele et al., 2016) DAD/MS
278
441
289
–
+
+
28
Catechin glucose
23.26
DAD/MS
276
451
289
–
–
+
34
Prodelphinidin dimer
27.43
(Mendes et al., 2011) DAD/MS
265–360
593
441, 289
–
–
+
43
Procyanidin gallate
36.97
(Mendes et al., 2011) DAD/MS
278–320
729
503
–
–
+
Flavonols
23
Isorhamnetin glucoside
19.41
DAD/MS
278–385
477
315
–
–
+
26
Myricetin
21.04
DAD/MS
267–356
317
–
–
–
+
31
Quercetin galloyl hexoside derivative
26.41
(Mendes et al., 2011; Guimarães et al., 2013) DAD/MS
264–354
615
433
+
+
+
33
Quercetin pentoside
31.55
(Guimarães et al., 2013) DAD/MS
253–361
433
301
+
+
+
35
Quercetin glucoside
28.37
(Mendes et al., 2011; Guimarães et al., 2013) DAD/MS
353–354
463
301
+
+
+
36
Quercetin arabinose/xyloside
27.88
(Mendes et al., 2011) DAD/MS
252–347
433
301
–
+
+
37
Quercetin rhamnoside-glucoside
28.26
(Mendes et al., 2011) DAD/MS
252–353
609
463, 301
–
–
+
38
Quercetin hexoside
31.50
(Guimarães et al., 2013) DAD/MS
254–351
433
303+
–
–
+
39
Kaempferol galloyl glucoside
30.84
(Mendes et al., 2011) DAD/MS
276
599
447, 285
–
–
+
41
Quercetin rhamnoside
32.05
(Guimarães et al., 2013) DAD/MS
255–347
447
303+
+
+
+
42
Kaempferol xyloside
34.68
(Mendes et al., 2011; Guimarães et al., 2013) DAD/MS
264–350
417
285
+
+
+
45
Apigenin pentoside
20.14
(Guimarães et al., 2013) DAD/MS
282–366
401
–
+
+
–
47
Quercetin hexose protocatechuic acid
29.91
DAD/MS
350
551
301
+
–
–
48
Dihydroquercetin rhamnoside
27.74
DAD/MS
349
565
301
+
+
–
Others
Q
Ascorbic acid derivative
21.32
DAD/MS
210–279
366
175
+
+
+
Z
Benzyl alcohol hexose pentose
19.18
DAD/MS
203–282
401
–
–
–
+
P
Hydroxyphenylvaleric acid
10.97
(Mosele et al., 2016)
207
193
+
–
–
Non-identified
N.1
Unknown
11.20
–
208–260
357
–
+
–
–
N.2
Unknown
24.89
–
207–275
581
–
+
–
+
N.3
Unknown
24.52
–
241–283
387
–
–
–
+
N.4
Unknown
24.73
–
271
581
319
–
–
+
N.5
Unknown
36.52
–
264–363
263
–
–
–
+
Peak
Tentative Identification
tR(min)
Identification type
λMAX(nm)
[M−H]-
Major fragments
A.A
A.C
A.Q
Phenolic acid and derivatives
50
Quinic acid
2.08
DAD/MS
243
191
–
+
+
+
3c
Quinic acid derivative
1.47
DAD/MS
272
371
191
+
–
–
3d
Quinic acid derivative
1.58
DAD/MS
325
533
191
+
+
+
32
Caffeoylquinic acid
26.56
(Guimarães et al., 2013) DAD/MS
278–349
353
179
–
+
+
70
Dicaffeoylquinic acid
8.97
DAD/MS
278–371
515
179
–
+
–
71
Caffeoyl dihexoside
2.50
DAD/MS
286–292
503
179
–
+
–
13b
Caffeic acid derivative
1.46
DAD/MS
277–380
359
179
–
–
+
13c
Caffeic acid derivative
4.38
DAD/MS
288–342
665
179
–
–
+
13d
Caffeic acid derivative
11.69
DAD/MS
274–356
601
179
–
–
+
15
Protocatechuic acid glucoside
8.21
DAD/MS
364
315
153
+
+
1
Protocatechuic acid
9.71
(Ayaz et al., 2000; Mosele et al., 2016) DAD/MS
295
153
–
+
–
–
9
Gallic acid glucoside
6.73
(Mendes et al., 2011) DAD/MS
254–278
331
169, 191
+
+
+
7
Galloylquinic acid
6.84
(Mendes et al., 2011) DAD/MS
273
343
169,191
+
+
–
63
Digalloylquinic acid
14.10
(Mendes et al., 2011) DAD/MS
272–371
495
191
+
+
–
11
Galloyl shikimic acid
10.14
(Mendes et al., 2011) DAD/MS
272–331
325
169
+
+
+
21
Digalloyl shikimic acid
10.37
(Mendes et al., 2011) DAD/MS
273–279
477
325
+
+
+
24
Digalloyl glucose
17.08
DAD/MS
274
483
325,191
+
+
+
58
Gallotannin
25.19
DAD/MS
274
629
407
–
–
+
64
Trimethyl gallic acid glucuronide
19.66
DAD/MS
223–277
387
169
+
+
–
30b
Galloyl derivatives
9.44
DAD/MS
254–365
663
331,169
+
–
–
30c
Galloyl derivatives
16.34
DAD/MS
276
423
169, 191
+
–
–
8a
Ellagitannin N.I
7.67
DAD/MS
273
687
343
+
–
+
8b
Ellagitannin N.I
21.12
DAD/MS
273
725
343
–
+
–
25
Strictinin ellagitannin
21.02
(Mendes et al., 2011) DAD/MS
296–361
633
–
+
+
+
6
Cinnamic acid derivative
4.54
DAD/MS
288–365
267
147
+
+
–
53
4-hydroxycoumarin
4.87
DAD/MS
275–350
161
–
–
–
+
60
p-coumaroylquinic acid
2.71
(Guimarães et al., 2013) DAD/MS
292
337
191
+
–
–
65
Vanillic acid hexoside
20.38
DAD/MS
277
329
167
+
–
–
Flavan-3-ols
10
Epigallocatechin
9.51
(Mosele et al., 2016) DAD/MS
270
325
305
–
+
–
61
Gallocatechin + catechin
11.02
(Mosele et al., 2016) DAD/MS
279
593
289
+
+
+
14
Procyanidin dimer type B
13.72
(Mendes et al., 2011) DAD/MS
274–371
577
495,289
+
+
+
16
(-)-Catechin
15.61
(Mosele et al., 2016) DAD/MS
275–285
289
–
+
+
+
17
(+)-Catechin
15.96
(Mosele et al., 2016) DAD/MS
275–285
291+
289
–
–
+
18
(+)-Epicatechin
16.14
(Mosele et al., 2016) DAD/MS
270
289
–
+
+
+
59
(-)-Epicatechin dimethyl gallate
31.30
DAD/MS
214–279
469
289
–
–
+
Flavonols
26
Myricetin
22.25
DAD/MS
267–356
317
–
+
–
+
31
Quercetin galloyl hexoside derivatives
24.91
(Mendes et al., 2011; Guimarães et al., 2013) DAD/MS
269–355
615
433
+
+
+
33
Quercetin pentoside
31.89
(Guimarães et al., 2013) DAD/MS
252–357
433
301
+
+
+
35
Quercetin glucoside
23.19
(Mendes et al., 2011) DAD/MS
370–356
463
301
+
+
+
37
Quercetin rhamnoside-glucoside
28.55
DAD/MS
252–353
609
463, 301
+
+
–
41
Quercetin rhamnoside
32.41
(Guimarães et al., 2013) DAD/MS
254–348
447
303+
+
+
+
45
Apigenin pentoside
20.24
(Guimarães et al., 2013) DAD/MS
282–366
401
–
–
+
–
47
Quercetin hexose protocatechuic acid
31.30
DAD/MS
350
551
301
–
+
–
48
Dihydroquercetin rhamnoside
27.86
DAD/MS
349
565
301
+
+
–
55
Quercetin glucoronide
29.31
(Guimarães et al., 2013) DAD/MS
235–355
477
301
+
+
+
56
Isorhamnetin rutinoside
20.35
(Guimarães et al., 2013) DAD/MS
277–350
461
315
–
–
+
57
Dihydromyricetin rhamnoside
27.86
DAD/MS
252–360
465
317
+
–
+
62
Apigenin glucuronide
12.36
DAD/MS
277–371
445
–
+
–
–
63
Apigenin glucoside
12.82
DAD/MS
284–371
419
269
+
–
–
66
Myricetin rhamnoside
23.42
(Mendes et al., 2011; Guimarães et al., 2013) DAD/MS
277–378
463
317
+
–
–
67
Quercetin galloyl glucoside
24.91
DAD/MS
271–361
585
301
+
+
+
68
Quercetin galloyl hexuronide
25.23
DAD/MS
277–365
629
477,325
+
69
Quercetin galloyl pentoside
28.36
DAD/MS
254–351
585
433,301
–
+
+
Others
A
Ascorbic acid
2.14
(Pallauf et al., 2008) DAD/MS
244
175
–
+
–
–
Q
Ascorbic acid derivative
21.44
DAD/MS
279–370
366
175
+
–
–
Non-identified
N.6
Unknown
11.46
–
209–274
645
381
+
+
–
N.7
Unknown
4.99
–
373–365
553
161
+
–
–
N.8
Unknown
21.61
–
280–379
465
–
+
–
–
N.9
Unknown
21.47
–
–
487
–
+
–
–
N.11
Unknown
29.93
–
234–277
597
–
+
–
N.12
Unknown
31.35
–
279–354
469
–
+
–
N.13
Unknown
19.70
–
275–341
387
–
–
–
+
N.14
Unknown
24.52
–
274
581
–
+
+
+
N.15
Unknown
19.89
–
214–279
496
387
–
–
N.16
Unknown
21.47
–
217–279
599
366
–
+
–
AQ fruits presented the highest phytochemical profile (34 compounds) followed by AC (28 compounds) and the last was AA (24 compounds) without considering the unknown compounds. EtOAc extract was the only one that presented two organic acids, namely citric acid (peak 2) and malic acid (peak 5) identified according to their UV spectra (λmax = 254 nm) and pseudo molecular ion (m/z at 191 and 133, respectively).
Peak 1 (m/z 153) showed a λmax at 295 nm in the extract of AQ-EtOAc and AA- MeOH: water, 80:20 (v/v), respectively and was identified as protocatechuic acid. Peak 15 (λmax at 357 and 364) presented m/z of 315 and gave a fragment at m/z 153; it was identified as protocatechuic glucoside. It was presented in all the extracts of AA, in AQ- MeOH: water 80:20 (v/v) extract and AA-EtOAc extract. Peaks 3a,3b,3c and 3d showed the same [M − H]− fragment ions at m/z 191(quinic acid) and different [M − H]− parent ion at m/z 383, 287,371 and 533 respectively, with maximum UV spectra at 325 nm typical of quinic acid derivative. Except for AQ- MeOH: water, 80:20 (v/v), all extracts presented peak 6 that showed the same parent ion at m/z 267, MS fragment ion at m/z 147 and similar λmax at 277 nm, characteristics of cinnamic acid derivatives. Similarly, peak 51 (AC-EtOAc) had the parent ion at m/z 343, MS fragment ions at m/z 267, 147, and UV spectra identical to peak 6 identified as cinnamic acid derivative. All peaks 7,9,11,21,24,27,30(a,b,c),52,54,63 yielded a fragment ion at m/z 169 typical of gallic acid. Gallic acid and its derivatives (such as glucosides, gallic acid gallate, galloylquinic acid, galloyl shikimic acid, trimethyl gallic acid glucuronide, galloyl quercetin and gallotannins) were the dominating peaks in all extracts. The isomers identification was carried out by their comparison to the following references: Mosele et al., 2016; Tavares et al., 2010; Mendes et al., 2011. According to MS fragment at m/z 179 and UV spectra, all peaks 13a, 13b, 13c;13d (λmax at 321,350,380 and 356 nm respectively) were related to caffeic acid and showed different parent ions at m/z 357, 359, 665 and 601 respectively. Caffeic acid isomers were identified thanks to their comparison to the analytical standards. Ellagic acid, is a dimeric derivative of gallic acid, and is generated by the hydrolysis of the ellagitannins. Its derivatives (ellagic acid glucoside, methylellagic acid rhamnoside, methylellagic acid rhamnopyranoside, strictinin ellagitannin, and ellagic acid arabinoside/xyloside) were distributed differently in the fruits on the regions studied. The content of gallic acid and its derivatives could have scientific value in various fields of medicine and biotechnology. They have also been implicated as anticarcinogenic, antimicrobial, antimutagenic, antiangiogenic and anti-inflammatory agents besides their use in treating critical diseases like depression, cancer, microbial infections, lipid-related diseases, etc (Choubey et al., 2015). Peak 53 showed UV spectra at 275–350 nm and molecular ion at m/z 161, characteristic of 4-hydroxycoumarin. AA- MeOH: water 80:20 (v/v) fruits showed peaks 60 and 65 (m/z 337 and 329; λmax at 292 nm and 277 nm and MS fragments m/z 191 and 167 respectively) were identified as p-coumaroylquinic acid vanillic acid hexoside, respectively by comparison of their mass fragment and UV spectra profiles with previously published data Stanoeva et al., (2017), Mena et al., (2012).
Only AQ-EtOAc extract showed a peak 4 (m/z 253; λmax at 287 nm) that was identified as dihydroxyflavone. Flavan-3-ols presented in this sample were catechin and its derivatives (epigallocatechin, procyanidin dimer type B, (-)-epicatechin gallate, catechin glucose, prodelphinidin dimer, procyanidin gallate). These compounds were abundant only in the fruits of AQ regions.
Also, 24 flavonols were found in this species and were distributed differently depending on the extraction solvent (14 and 15 compounds in EtOAc and MeOH: water, 80:20 (v/v) respectively) and the regions of harvest (22, 19 and 22 compounds in AA, AC and AQ respectively). Their UV spectra are in fact characteristic of the flavonols structure, with two absorption bands. The first band, determined by the benzene moiety, in 250–270 nm range, the second one in the 340–350 nm range, with intensities and relative positions reflecting hydroxylation pattern and degree of substitution (Dugo et al. 2009). The presence of MS fragments at m/z 301, 285, 315, 317, and 269 indicate the presence of aglycones as quercetin, kaempferol, isorhamnetin, myricetin, and apigenin. Accordingly, to these MS fragments ions, these compounds were identified as results from glycosylation of the flavonols at various positions. All studied samples were rich in quercetin derivatives. Peaks 33, 35, and 41 respectively for quercetin pentoside, quercetin glucoside, quercetin rhamnoside ([M−H]- at m/z 433, 463 and 447, respectively) were found in all the studied fruits. In ethyl acetate extract (AC and AQ), two compounds were tentatively identified as quercetin arabinose/xyloside (peak 36) and quercetin hexoside (peak 38) detected a similar [M − H]− ion at m/z 433 also similar UV spectra (252–347 nm and 254–351 nm, respectively). Also, all methanolic samples presented quercetin glucuronide (m/z 477; 235–355 nm). Other quercetin derivatives were assigned according to pseudo molecular ions, MS fragments, UV spectra, and by comparison with literature data. Peak 31 ([M − H]− at m/z 609) detected in all samples was identified as quercetin galloyl hexoside derivative. Peak 37 assigned to quercetin rhamnoside-glucoside ([M−H]- at m/z 609) was present in AQ-EtcOH and (AA/AC)- MeOH:water, 80:20 (v/v). Only the samples of AA-EtcOH presented peak 47 ([M − H]− at m/z 551) which was identified as quercetin hexose protocatechuic acid. Peak 48 in ethyl acetate samples of AA and AC was tentatively identified as dihydroquercetin rhamnoside. Other detected peaks 67, 68, and 69 were identified as quercetin galloyl glucoside, quercetin galloyl hexuronide ([M − H]− at m/z 629), quercetin galloyl pentoside ([M−H]- at m/z 585) respectively.
In AQ samples, two molecules resulted from glycosylation of isorhamnetin: peak 23 (isorhamnetin glucoside; m/z 477) and peak 56 (isorhamnetin rutinoside; m/z 461). These two compounds showed an identical pattern fragment at m/z 315, but two different range of UV spectra at 278–385 nm and 277–350 nm respectively. Myricetin and its derivatives present in fruits of AA and AQ. Peaks 26, 57, and 66 were tentatively identified as myricetin, dihydromyricetin rhamnoside, and myricetin rhamnoside. Other detected flavonols corresponded to apigenin and kaempferol derivatives. Apigenin pentoside (peak 45 in AA and AC), apigenin glucuronide (peak 62 in AA), and apigenin glucoside (peak 63 in AA) were identified according to their mass spectra and UV range. Peak 39 identified as kaempferol galloyl glucoside in accordance with [M − H]− at m/z 599, MS fragment at m/z 447 and by comparison with results reported by Mendes et al., (2011). Peak 42 detected in all ethyl acetate extract was tentatively identified as kaempferol xyloside ([M−H]- at m/z 417).
The investigated samples showed other compounds that were tentatively identified according to their mass spectra, MS fragments, and λmax. These compounds were detected as ascorbic acid and its derivatives, benzyl alcohol hexose pentose, and hydroxyphenylvaleric acid (Mosele et al., 2016).
The content of phenolic acids, flavones, flavan-3-ols and flavonols in the A. unedo fruit is presented in Table 5. Regarding the profile composition, the most abundant group was represented by hydroxybenzoic acids with 76.02 ± 1.3 mg/100 g (w/w) (DW) founded in AA fruit followed by AQ fruit 71.78 ± 1.5 mg/100 g (w/w) (DW) and in the last AC fruit 49.41 ± 1.01 mg/100 g (w/w) (DW) caffeic acid and its derivatives were abundant in AA (3.57 mg/100 g (w/w) (DW)) and AC (1.18 mg/100 g) (w/w) (DW). The highest content of flavan-3-ols was in AQ (67.19 mg/100 g (w/w) (DW)), instead. These results do not match other studies which showed that proanthocyanidins present the highest content (De Pascual al., 2000; Pallauf et al., 2008). However, in agreement with Pallauf et al., (2008) quercetin derivatives are abundant flavonols in all samples. On the other hand, flavonol derivates are 10-fold higher than one found in the fruits of Portugal (10.86 ± 0.24 mg/100 g (w/w) (DW); Guimarães et al., 2013). Semi-quantification by HPLC-DAD analysis gave the higher content of antioxidant compounds for the AQ fruits (162.74 ± 27.41 mg/100 g (w/w) (DW)) followed by AA fruits (120.43 ± 27.41 mg/100 g (w/w) (DW)).
Compounds
A. A
A. C
A. Q
Standard used for semi-quantification
EtOAc
MeOH: water, 80:20 (v/v)
EtOAc
MeOH: water, 80:20 (v/v)
EtOAc
MeOH: water, 80:20 (v/v)
Phenolic acid and derivatives
Protocatechuic acid
–
0.15 ± 0.008
–
–
0.02 ± 0.06
–
Gallic acid
Protocatechuic acid glucoside
0.05 ± 0.06
0.61 ± 0.004
–
0.1 ± 0.05
0.4 ± 0.09
–
Gallic acid
Gallic acid glucoside
0.44 ± 0.9
9.82 ± 3.34
0.59 ± 0.25
7.93 ± 1.43
4.18 ± 0.03
20.27 ± 8.3
Gallic acid
Gallic acid gallate
–
–
–
–
0.13 ± 0.03
–
Gallic acid
Galloyl hexoside
–
–
0.30 ± 0.05
–
–
–
Gallic acid
Galloylquinic acid
3.37 ± 1.9
–
4.26 ± 1.19
26.38 ± 3.2
6.24 ± 0.09
–
Gallic acid
Digalloylquinic acid
–
3.19 ± 0.005
–
1.70 ± 0.02
–
–
Gallic acid
Galloyl shikimic acid
0.59 ± 0.4
0.19 ± 0.006
1.26 ± 0.7
2.03 ± 0.03
3.48 ± 0.05
1.10 ± 0.03
Gallic acid
Digalloyl shikimic acid
0.35 ± 0.05
4.22 ± 0.005
1.47 ± 0.3
1.53 ± 0.36
3.4 ± 1.8
1.55 ± 0.03
Gallic acid
Digalloyl glucose
–
0.66 ± 0.003
–
0.52 ± 0.12
0.7 ± 0.03
0.41 ± 0.03
Gallic acid
Galloyl derivatives
–
–
–
–
–
–
Gallic acid
Galloyl derivatives
–
–
–
–
0.48 ± 0.03
–
Gallic acid
Galloyl derivatives
–
1.46 ± 0.008
–
–
–
–
Gallic acid
Galloyl derivatives
–
3.63 ± 0.008
–
–
–
–
Gallic acid
Gallotannin
–
–
–
–
–
0.25 ± 0.02
Gallic acid
Ellagic acid glucoside
–
–
–
–
0.75 ± 0.06
–
Gallic acid
Ellagic acid arabinoside/xyloside
–
–
–
–
0.49 ± 0.02
–
Gallic acid
Methylellagic acid methyl pentose
–
–
–
–
–
–
Gallic acid
Methylellagic acid rhamnoside
–
–
–
–
0.40 ± 0.03
–
Gallic acid
Methylellagic acid rhamnopyranoside
–
–
–
–
0.53 ± 0.06
–
Gallic acid
Methylellagic derivative
–
–
–
–
0.76 ± 0.02
–
Gallic acid
Trimethyl gallic acid glucoronide
–
0.64 ± 0.01
–
1.27 ± 0.3
–
–
Gallic acid
Strictinin ellagitannin
–
–
–
–
0.7 ± 0.05
–
Gallic acid
Ellagitannin N.I
–
46.69 ± 0.1
–
–
19.98 ± 0.56
5.56 ± 0.5
Gallic acid
Ellagitannin N.I
–
–
0.07 ± 0.007
–
–
–
Gallic acid
Total of Hydroxybenzoic acids
4.8 ± 0.1
71.22 ± 1.5
7.95 ± 0.01
41.46 ± 1.3
42.64 ± 0.6
29.14 ± 0.8
Caffeoylquinic acid
–
–
–
–
0.11 ± 0.03
–
Caffeic acid
Dicaffeoylquinic acid
–
–
–
0.5 ± 0.006
–
–
Caffeic acid
Caffeic acid dihexoside
–
–
–
0.32 ± 0.08
–
–
Caffeic acid
Caffeic acid derivative
–
–
–
–
0.01 ± 0.001
–
Caffeic acid
Caffeic acid derivative
–
–
0.01 ± 0.001
–
–
0.24 ± 0.001
Caffeic acid
Caffeic acid derivative
–
–
–
–
–
0.06 ± 0.002
Caffeic acid
Caffeic acid derivative
–
–
–
–
–
0.01 ± 0.002
Caffeic acid
Feruloylquinic acid
–
–
0.02 ± 0.006
–
–
–
Caffeic acid
Syringic acid
1.82 ± 0.0014
–
–
–
–
–
Caffeic acid
Cinnamic acid derivative
0.003 ± 0.001
–
0.2 ± 0.02
0.13 ± 0.004
–
–
Cinnamic acid
Cinnamic acid derivative
–
0.35 ± 0.007
–
–
–
–
Cinnamic acid
p-coumaroylquinic acid
–
0.75 ± 0.002
–
–
–
–
Cinnamic acid
Vanillic acid hexoside
–
0.65 ± 0.01
–
–
–
–
Vanillic acid
Total of Hydroxycinnamic acids
1.82 ± 0.6
0.75 ± 0.021
0.23 ± 0.02
0.95 ± 0.04
0.12 ± 0.05
0.31 ± 0.02
4-hydroxycoumarin
–
–
0.067 ± 0.03
–
–
0.03 ± 0.001
Coumaric acid
Flavone
Dihydroxyflavone
–
–
–
–
0.03 ± 0.008
–
Apigenin
Flavan-3-ols
Epigallocatechin
–
–
–
–
1.26 ± 0.12
–
Catechin
Gallocatechin + catechin
–
1.66 ± 0.1
–
0.81 ± 0.01
–
–
Catechin
Procyanidin dimer type B
4.62 ± 0.07
12.69 ± 0.6
5.17 ± 2.37
9.01 ± 0.83
13.26 ± 0.85
8.62 ± 0.86
Catechin
Procyanidin gallate
–
–
–
–
0.69 ± 0.06
–
Catechin
Prodelphinidin dimer
–
–
–
–
2.07 ± 0.48
–
Catechin
(-)-Catechin
1.06 ± 0.7
9.25 ± 0.006
0.53 ± 0.03
7.77 ± 0.1
25.33 ± 5.6
6.35 ± 1.85
Catechin
(-)-Epicatechin
–
–
–
–
2.83 ± 0.05
–
Catechin
(-)-Epicatechin gallate
–
–
0.70 ± 0.05
–
1.68 ± 0.1
–
Catechin
(-)-Epicatechin dimethyl gallate
–
–
–
–
3.35 ± 0.85
Catechin
Catechin glucose
–
–
–
–
1.69 ± 0.22
–
Catechin
Total of flavan-3-ols
5.68 ± 1.2
23.6 ± 0.8
6.47 ± 1.4
17.6 ± 0.4
48.84 ± 0.65
18.35 ± 1.12
Flavonols
Isorhamnetin glucoside
–
–
–
–
0.03 ± 0.05
–
Isorhamnetin
Isorhamnetin rutinoside
–
–
–
–
–
–
Isorhamnetin
Myricetin
–
0.01 ± 0.005
–
–
0.80 ± 0.03
–
Kaempferol
Myricetin rhamnoside
–
0.01 ± 0.0041
–
–
–
–
Kaempferol
Quercetin glucoside
0.3 ± 0.01
1.55 ± 0.1
0.22 ± 0.07
0.84 ± 0.06
0.3 ± 0.0.01
0.73 ± 0.03
Rutin
Quercetin arabinose/xyloside
–
–
–
–
0.46 ± 0.02
–
Rutin
Quercetin pentoside
1.11 ± 0.07
1.70 ± 0.17
1.92 ± 0.07
2.02 ± 0.36
0.69 ± 0.06
1.2 ± 0.02
Rutin
Quercetin rhamnosyl-glucoside
–
0.39 ± 0.01
–
0.42 ± 0.02
1.34 ± 0.03
–
Rutin
Quercetin hexoside
–
–
–
–
5.7 ± 2.54
–
Rutin
Quercetin rhamnoside
1.36 ± 0.07
0.65 ± 0.01
1.26 ± 0.8
0.57 ± 0.01
6.9 ± 0.3
0.74 ± 0.02
Rutin
Quercetin glucoronide
0.62 ± 0.4
–
–
–
–
Rutin
Quercetin galloyl glucoside
–
0.14 ± 0.01
–
0.32 ± 0.02
–
–
Rutin
Quercetin galloyl pentoside
–
–
–
0.2 ± 0.01
–
–
Rutin
Quercetin galloyl hexose derivative
0.15 ± 0.04
–
0.17 ± 0.06
–
3.52 ± 0.52
–
Rutin
Quercetin galloyl hexuronide
–
0.36 ± 0.04
–
–
–
–
Rutin
Quercetin hexose protocatechuic acid -
–
–
–
–
–
Rutin
Quercetin derivative
0.92 ± 0.04
–
–
–
–
–
Rutin
Kaempferol galloylglucoside
–
–
–
–
0.5 ± 0.05
–
Kaempferol
Kaempferol xyloside
0.52 ± 0.03
–
1.18 ± 0.001
–
0.43 ± 0.03
–
Kaempferol
Apigenin pentoside
0.17 ± 0.003
–
0.28 ± 0.01
–
–
–
Apigenin
Apigenin glucoside
–
0.02 ± 0.008
–
–
–
–
Apigenin
Apigenin glucuronide
–
0.15 ± 0.009
–
–
–
–
Apigenin
Total of flavonols
5.53 ± 0.4
5.6 ± 0.002
5.03 ± 0.005
4.37 ± 0.01
20.67 ± 1.43
2.67 ± 0.02
Dihydromyricetin rhamnoside
LOQ>
–
–
–
–
Kaempferol
Dihydroquercetin rhamnoside
0.27 ± 0.03
0.08 ± 0.006
0.37 ± 0.07
–
–
–
Rutin
Total of dihydroflavonols
0.27 ± 0.03
0.08 ± 0.006
0.37 ± 0.07
–
–
–
4 Conclusions
This study demonstrates that A. unedo contains a large variety of polyphenols including a high level of antioxidant capacity. All samples showed a good phytochemical profile. AC fruits presented the highest total polyphenols and flavonoids content (127.5 ± 7.14 mg GAE/g (w/w) (DW) and 105.9 ± 3.2 mg QE/g (w/w) (DW)). AQ fruit showed the highest content of anthocyanins and tannins (1.48 ± 0.09 mg Pg-3-glu/g (w/w) (DW) and 1.22 ± 0.1 mg EC/g (w/w) (DW) respectively). HPLC-DAD-ESI/MS analysis revealed 75 compounds tentatively identified as hydroxybenzoic acids, hydroxycinnamic acids, flavone, flavan-3-ols, flavonols, and dihydroflavonols. The most abundant group was represented by hydroxybenzoic acids. According to the obtained results, this fruit can be considered a potential application for pharmacological research aiming to find the right treatment for many diseases emerged recently.
Acknowledgement
We are grateful to the laboratory of Biochemistry and Molecular Genetics for their help in part of the analyses carried out. We also thank Pr. Mohammed Nhiri, Pr. Btissam Ramdan, and Ms. Ginane Selama for their collaboration.
The authors gratefully acknowledge Shimadzu Corporation and Merck Life Science (Merck KGaA, Darmstadt, Germany) for the continuous support.
Declaration of Competing Interest
The authors declare that they have no known competing financial interests or personal relationships that could have appeared to influence the work reported in this paper.
References
- The Arbutus berry: studies on its color and chemical characteristics at two mature stages. J. Food Comp. Anal.. 2001;14:27-35.
- [Google Scholar]
- Phenolic compounds extraction of Arbutus Unedo L.: process intensification by microwave. Pretreatment. Processes. 2020;8:298.
- [Google Scholar]
- Ellagic acid, vitamin c, and total phenolic contents and radical scavenging capacity affected by freezing and frozen storage in raspberry fruit. J. Agric. Food Chem.. 2000;48:4565-4570.
- [Google Scholar]
- Antifungal, Antibacterial, and Antioxidant Activities of Acacia Saligna (Labill.) H. L. Wendl. Flower Extract: HPLC Analysis of Phenolic and Flavonoid Compounds. Molecules. 2019;24:700.
- [Google Scholar]
- Sugar, non-volatile and phenolic acids composition of strawberry tree (Arbutus Unedo L. Var. Ellipsoidea) fruits. J. Food Compos. Anal.. 2000;13:171-177.
- [Google Scholar]
- Strawberry-tree, blackthorn and rose fruits: detailed characterization in nutrients and phytochemicals with antioxidant properties. Food Chem.. 2010;120:247-254.
- [Google Scholar]
- Antidiabetic effect of some medicinal plants of oriental morocco in neonatal non-insulin-dependent diabetes mellitus rats. Hum. Exp. Toxicol.. 2010;29:865-871.
- [Google Scholar]
- Antioxidant activity of flavonoids from licania licaniaeflora. J. Ethnopharmacol.. 2002;79:379-381.
- [Google Scholar]
- The strawberry tree (Arbutus Unedo L.) selection in Turkey. Sci. Hortic.. 2008;118:115-119.
- [Google Scholar]
- Medicinal importance of gallic acid and its ester derivatives: a patent review. Pharm. Pat. Anal.. 2015;4:305-315.
- [Google Scholar]
- Quantitative Analysis of Flavan-3-ols in Spanish Foodstuffs and Beverages. J. Agric. Food Chem.. 2000;48:5331-5337.
- [Google Scholar]
- Characterization of the polyphenolic fraction of Morus Alba Leaves extracts by HPLC coupled to a hybrid IT-TOF MS system. J. Sep. Sci.. 2009;32:3627-3634.
- [Google Scholar]
- Antimicrobial activity and phytochemical screening of Arbutus Unedo L. J Saudi Chem Soc.. 2013;17:381-385.
- [Google Scholar]
- Effects of grape variety, harvest date, fermentation vessel and wine ageing on flavonoid concentration in red wines. Food Res. Int.. 2008;41:53-60.
- [Google Scholar]
- Antioxidant properties and neuroprotective capacity of strawberry tree fruit (Arbutus unedo) Nutrients. 2010;2:214-229.
- [Google Scholar]
- Protein oxidation in emulsified cooked burger patties with added fruit extracts: influence on colour and texture deterioration during chill storage. Meat Sci.. 2010;85:402-409.
- [Google Scholar]
- Giusti, M., Wrolstad, R.E., 2001. Characterization and Measurement of Anthocyanins by UV-Visible Spectroscopy. Curr. Prot. Food Anal. Chem. 00 (1): F1.2.1-F1.2.13.
- Characterisation of phenolic compounds in wild fruits from northeastern portugal. Food Chem.. 2013;141:3721-3730.
- [Google Scholar]
- Phenolic constituents in the leaves of northern willows: methods for the analysis of certain phenolics. J. Agric. Food Chem.. 1985;33:213-217.
- [Google Scholar]
- Tannins and catechin gallate mediate the vasorelaxant effect of Arbutus Unedo on the rat isolated aorta. Phytother. Res.. 2004;18:889-894.
- [Google Scholar]
- Protective effect of Arbutus Unedo aqueous extract in carrageenan-induced lung inflammation in mice. Pharmacol. Res.. 2008;57:110-124.
- [Google Scholar]
- Effects of extracts and tannins from Arbutus Unedo leaves on rat platelet aggregation. Phytother. Res.. 2006;20:135-139.
- [Google Scholar]
- Mena, P., Calani, L., Dall’Asta, C., Galaverna, G., García-Viguera, C., Bruni, R., Crozier, A., Del Rio, D., 2012. Rapid and Comprehensive Evaluation of (Poly) Phenolic Compounds in Pomegranate (Punica Granatum L.) Juice by UHPLC-MSn. Molecules 17, 14821-14840.
- Comparative antihemolytic and radical scavenging activities of strawberry tree (Arbutus Unedo L.) leaf and fruit. Food Chem. Toxicol.. 2011;49:2285-2291.
- [Google Scholar]
- Stability and metabolism of Arbutus Unedo bioactive compounds (phenolics and antioxidants) under in vitro digestion and colonic fermentation. Food Chem.. 2016;201:120-130.
- [Google Scholar]
- Characterization of the antioxidant composition of strawberry tree (Arbutus Unedo L.) fruit. J. Food Compos. Anal.. 2008;21:273-281.
- [Google Scholar]
- Phenolics of Arbutus Unedo L. (Ericaceae) fruits: identification of anthocyanins and gallic acid derivatives. J. Agric. Food Chem.. 2006;54:10234-10238.
- [Google Scholar]
- Effect of seasonal and geographical changes on nutritional yield of fruits of tribulus terrestris linn. Int. Res. J. Pharm.. 2017;8:114-118.
- [Google Scholar]
- Valorization of wild strawberry-tree fruits (Arbutus Unedo L.) through nutritional assessment and natural production data. Food Res. Int.. 2011;44:1244-1253.
- [Google Scholar]
- Colorimetry of total phenolic compounds with phosphomolybdic-phosphotungstic acid reagents. Am. J. Enol. Vitic.. 1965;16:144-158.
- [Google Scholar]
- Stanoeva, J.P., Stefova, M., K.B., Andonovska, A.V., Trajce S., 2017. Phenolics and Mineral Content in Bilberry and Bog Bilberry from Macedonia. Int. J. Food Prop. 20, 863-883.
- Antioxidant and antiproliferative properties of strawberry tree tissues. J. Berry Res.. 2010;1:3-12.
- [Google Scholar]
- Trease, E., Evans, W.C., 1989. Pharmacognosy, Billiaire Tindall. 3 th. 645 London.
- The determination of flavonoid contents in mulberry and their scavenging effects on superoxide radicals. Food Chem.. 1999;64:555-559.
- [Google Scholar]
- Arbutus Unedo induces endothelium-dependent relaxation of the isolated rat aorta. Phytother. Res.. 2002;16:572-575.
- [Google Scholar]


