

Translate this page into:
Computer-aided molecular design of (E)-N-Aryl-2-ethene-sulfonamide analogues as microtubule targeted agents in prostate cancer
⁎Corresponding author. Tel.: +98 5424822186; fax: +98 5424822180. fereshteh.shiri@gmail.com (F. Shiri)
-
Received: ,
Accepted: ,
This article was originally published by Elsevier and was migrated to Scientific Scholar after the change of Publisher.
Peer review under responsibility of King Saud University.
Abstract
Abstract
Microtubules are tube-shaped, filamentous and cytoskeletal proteins that are essential in all eukaryotic cells. Microtubule is an attractive and promising target for anticancer agents. In this study, three-dimensional quantitative structure activity relationships (3D-QSAR) including comparative molecular field analysis, CoMFA, and comparative molecular similarity indices analysis, CoMSIA, were performed on a set of 45 (E)-N-Aryl-2-ethene-sulfonamide analogues as microtubule-targeted anti-prostate cancer agents. Automated grid potential analysis, AutoGPA module in Molecular Operating Environment 2009.10 (MOE) as a new 3D-QSAR approach with the pharmacophore-based alignment was carried out on the same dataset. AutoGPA-based 3D-QSAR model yielded better prediction parameters than CoMFA and CoMSIA. Based on the contour maps generated from the models, some key features were identified in (E)-N-Aryl-2-arylethene-sulfonamide analogues that were responsible for the anti-cancer activity. Virtual screening was performed based on pharmacophore modeling and molecular docking to identify the new inhibitors from ZINC database. Seven top ranked compounds were found based on Gold score fitness function. In silico ADMET studies were performed on compounds retrieved from virtual screening in compliance with the standard ranges.
Keywords
3D-QSAR
Pharmacophore
Microtubule
AutoGPA
Virtual screening
ADMET

1 Introduction
Microtubules made up of α- and β-tubulin heterodimers, are dynamic, long and filamentous protein polymers (Fig. 1a). They are vital in the growth and preservation of cell shape (Jordan and Wilson, 2004) and have key roles in migration, signaling and cell propagation in eukaryotic cells. Microtubules are very crucial in the process of mitosis in stage followed by equal division of duplicated chromosomes before conversion of the cell into two daughter cells. Dynamic structures and role of microtubules in mitosis make them become an important target for anticancer drugs. Microtubule binders have been considered as a member of pharmacopoeia of cancer for decades. However, before the advent of targeted therapy microtubules, DNA was only cancer therapeutic target (Dumontet and Jordan, 2010). Microtubule binding agents are divided into two major classes according to the mechanism of amendment of microtubule dynamics: agents that inhibit microtubule polymerization and agents that enhance its polymerization. Both classes cause cell cycle stop at G2/M and finally cell death (Amos, 2011; Chou et al., 1994; Jordan and Wilson, 1998, 2004; Panda et al., 1996; Wilson et al., 1999). Colchicine is one of the most important inhibitors of tubulin polymerization but its toxicity in clinical trials has led to not finding wide application in therapy of cancer (Fig. 1b). So, there is an essential requirement to propose new inhibitors for microtubules (Hearn et al., 2007; Pellegrini and Budman, 2005). Many molecules for inhibition of polymerization which compete with site of colchicine binding of tubulin have been introduced so far. But until now, no colchicine-site binder has been authorized for therapy of cancer (Chaplin et al., 2006; Hsieh et al., 2005; Kemnitzer et al., 2009; Lee et al., 2010; Mahindroo et al., 2006; Nam, 2003; Pirali et al., 2006; Sirisoma et al., 2009; Tron et al., 2005; Xie et al., 2011; Zhang et al., 2007).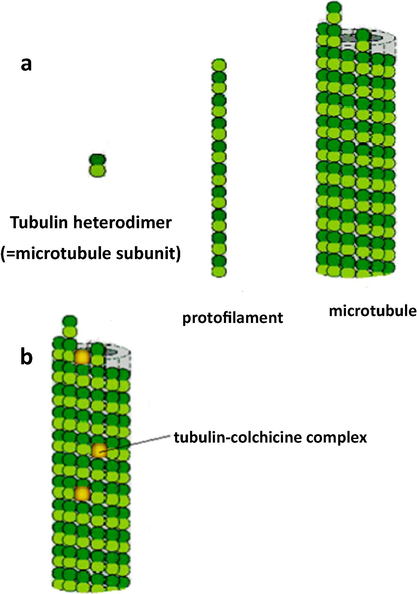
(a) The subunit of each protofilament is tubulin heterodimer which is created from a pair of α- and β-tubulin monomers. Protofilaments arrange in parallel to form microtubule. (b) Colchicine represses microtubule dynamics by complex formation with tubulin heterodimers and copolymerization into microtubule.
Quantitative structure–activity relationship (QSAR) has a fundamental role in computer-assisted-drug discovery. This method tries to determine a reliable relationship between molecular attributes and biological activity (Du et al., 2008a,b, 2005a, 2008b, 2009b; Prado-Prado et al., 2008; Wei et al., 2009). So far, many different QSAR studies have been accomplished for discovery of anti-cancer agents, including anti-prostate agents (Marzaro et al., 2011; Munteanu et al., 2009; Planche et al., 2013; Prakash and Khan, 2013; Speck-Planche et al., 2011a,b, 2012a,b; Vilar et al., 2009). 3D-QSAR, namely CoMFA (Cramer et al., 1988b) and CoMSIA (Klebe and Mietzner, 1994) uses three-dimensional shape of molecules and serves as useful guide for the design and generation of new drugs with more bioactivity or selectivity. The grid potential analysis employing in these models creates spatial distribution of effective fields as independent variables about superimposed molecules (Cramer et al., 1988b). The spatial distribution extremely depends on bioactivity of conformation of active ligands. In cases that 3D structure of bioactive conformations is not available, generation of a valid 3D-QSAR model for the exhibition of actual active site of receptor is difficult (Asakawa et al., 2012). In AutoGPA modeling (Meena et al., 2011), pharmacophore features that are common among most active ligands are used to find bioactive conformers of ligands and align them. According to the definition by IUPAC, ’’a pharmacophore is an ensemble of steric and electronic features that is necessary to ensure the optimal supramolecular interactions with a specific biological target and to trigger (or block) its biological response” (Wermuth et al., 1998). In the present study, we developed pharmacophore-based AutoGPA model to identify the critical pharmacophore features necessary for potent inhibitors. The popular CoMFA and CoMSIA models were built in comparison with AutoGPA model on a set of (E)-N-Aryl-2-ethene-sulfonamide analogues as anti-prostate cancer agents (Ramana Reddy et al., 2013). At present, Prostate cancer is second reason of mortality due to cancer in men in the United States (Jemal et al., 2010). Recently, many investigations were done to treat this cancer (Cai et al., 2012). In order to investigate interaction of tubulin and these analogues, molecular docking was applied. Molecular docking studies (Du et al., 2009a; Huang et al., 2008) can provide useful information for in-depth understanding of some subtle action mechanisms at the molecular biology level, such as the marvelous allosteric mechanism revealed recently by the NMR observations on the M2 proton channel of influenza A virus (Pielak et al., 2009; Schnell and Chou, 2008). They can also provide useful insights to stimulate drug developments as demonstrated by previous investigators (Cai et al., 2011; Chou, 2004b; Chou et al., 2003; Du et al., 2009a, 2010, 2005b; Huang et al., 2008; Li et al., 2011; Ma et al., 2012; Wang and Chou, 2011, 2012; Wang et al., 2009). The information of a binding pocket of a receptor for its ligand is very important for drug design, particularly for conducting mutagenesis studies (Chou, 2004b). In the literature, the binding pocket of a protein receptor to a ligand is usually defined by those residues that have at least one heavy atom (i.e., an atom other than hydrogen) within a distance of 5 Å from a heavy atom of the ligand. Such a criterion was originally used to define the binding pocket of ATP in the Cdk5-Nck5a∗ complex (Chou et al., 1999) that has later proved quite useful in identifying functional domains and stimulating the relevant truncation experiments (Zhang et al., 2002). The similar approach has also been used to define the binding pockets of many other receptor–ligand interactions important for drug design (Chou, 2004a; Chou et al., 2003; Huang et al., 2008; Li et al., 2011; Pielak et al., 2009; Wang and Chou, 2011, 2012; Wang et al., 2007). Many marvelous biological functions in proteins and DNA and their profound dynamic mechanisms, such as switch between active and inactive states (Wang and Chou, 2009), cooperative effects (Chou, 1989), allosteric transition (Chou, 1987), intercalation of drugs into DNA [30], and assembly of microtubules (Chou et al., 1994), can be revealed by studying their internal motions as summarized in a comprehensive review (Chou, 1988). Likewise, to really understand the interaction of a protein receptor with its ligand and to reveal their binding mechanism, we should consider not only the static structures concerned but also the dynamical information obtained by simulating their internal motions or dynamic process, and we are to make efforts in this regard in our future work. Virtual screening is a computational drug discovery method where large libraries of compounds are assessed for their potential to bind specific sites on drug target and identify small numbers of virtual hits (Klebe, 2006). Herein, virtual screening was performed by the pharmacophore model as ligand-based and molecular docking as structure-based screening. It is reported that about fifty percent of all drugs fail in coming to marketing stage because of poor human pharmacokinetics (Shen et al., 2003; Zheng and Tropsha, 2000). Thus, in silico ADMET studies were performed on new compounds recognized by virtual screening to compare the computed ADMET descriptor values with the accepted ranges.
2 Materials and methods
2.1 Dataset
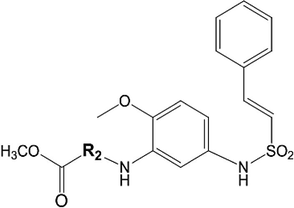
A set of 45 (E)-N-Aryl-2-ethene-sulfonamide analogues as anti-prostate cancer agents with associated activity data were collected from the literature (Ramana Reddy et al., 2013). The IC50 (μM) values of original paper were converted into molar units. These values were transformed into negative logarithm scale value (pIC50) as dependent variable for all models subsequently developed. The pIC50 values of the data set extend from 4 to 7.5. For developing models, the total compounds as usual were divided into two training and test sets consisting of 37 and 8 compounds, respectively. The chemical structures and experimental pIC50 values of all compounds are listed in Tables 1a–1c.

Cmpd no.
R
R1
pIC50
1a
H
H
5.00
2a
4-Cl
H
4.70
3
4-F
4-Br
5.00
4
4-F
4-OCH3
5.00
5a
4-OCH3
4-OCH3
5.30
6
4-OCH3
2,4-(OCH3)2
4.82
7
4-OCH3
2,6-(OCH3)2
6.43
8
4-OCH3
2,4,6-(OCH3)3
6.70
9
4-OCH3
3,4,5-(OCH3)3
4.46
10
2,4,6-(OCH3)3
4-OCH3
5.12
11
4-OCH3
2,6-(OCH3)2, 4-OH
5.00
12
4-OCH3
2,4,6-F3
4.12
13a
3-F, 4-OCH3
2,4,6-(OCH3)3
7.52
14
3-OCOCH2C(CH3)2-C6H(CH3)2O2, 4-OCH3
2,4,6-(OCH3)3
7.40
15
3-OPO(ONa)2,4-OCH3
2,4,6-(OCH3)3
5.60
16
3-NH2, 4-OCH3
2,4,6-(OCH3)3
4.12
17
3-NO2, 4-OCH3
3,4,5-(OCH3)3
4.46
18
3-NH2,4-OCH3
3,4,5-(OCH3)3
4.00
19
3-NO2, 4-OCH3
2,6-(OCH3)2, 4- O(CH2)3COOH
5.00
20
3-NH2, 4-OCH3
2,6-(OCH3)2, 4-O(CH2)3COOH
5.00
21
3-OH, 4-OCH3
2,6-(OCH3)2, 4-O(CH2)3COOH
4.00
22
3-NO2, 4-F
2,4,6-(OCH3)3
5.00
23
3-NH2, 4-F
2,4,6-(OCH3)3
5.00
24
3,5-(NO2)2,4-OCH3
2,4,6-(OCH3)3
5.00
25
3,5-(NH2)2,4-OCH3
2,4,6-(OCH3)3
5.60
26a
3-F, 4-OCH3
4-OCH3
5.30
27
3-F, 4-OCH3
2,3,4,5,6-F5
5.00
28
3-NO2, 4-OCH3
2,3,4,5,6-F5
4.00
29
3-NH2, 4-OCH3
2,3,4,5,6-F5
4.12
30
2,3,4,5,6-F5
3-NO2, 4-OCH3
4.00
31
2,3,4,5,6-F5
3-NH2, 4-OCH3
4.46
32
2,3,4,5,6-F5
2,3,4,5,6-F5
4.46
Cmpd no.
R2
pIC50
33
CH2
6.46
34
CH(CH3)
7.00
35
C(CH3)2
6.70
36a
CH(C6H5)
5.60
37
CH(C6H4-F)
5.60
38
CH(C6H4-Br)
5.12

Cmpd no.
R2
pIC50
39
CH2
6.40
40
CH(CH3)
7.40
41
C(CH3)2
7.15
42
CH(C6H5)
7.12
43a
CH(C6H44-F)
7.12
44
CH(C6H44-Cl)
7.12
45a
CH(C6H44-Br)
6.60
2.2 CoMFA and CoMSIA studies
The CoMFA and CoMSIA models were developed by SYBYL7.3 software package (Tripos Inc., St. Louis, USA, version 7.2) the details of model building steps can be found in the literature (Ghasemi and Shiri, 2012; Pirhadi and Ghasemi, 2010).
2.3 AutoGPA studies
To use the new alignment for the construction of a better model, AutoGPA software based on pharmacophoric alignment which is a grid potential analysis that evaluates steric and electrostatic fields around pharmacophore-based aligned ligands, has been used, Fig. 2 (Asakawa et al., 2012). MMFF94s force field with generalized Born solvation model was employed for energy minimization of structures. Two separate databases that consist of structures of molecules and their related pIC50, were created for training and test sets. Conformation search option in MOE2009.10 was used to generate probable conformers for each molecule in data sets. Strain energy for conformations was considered less than 7 kcal/mol and RMSD gradient was defined 2.5 Å by default. Conformer generation was continued until a maximum number of 10,000 conformers per ligand (Chen and Foloppe, 2008). Finally, 38,837 conformations for training set and 3784 conformations for test set were generated.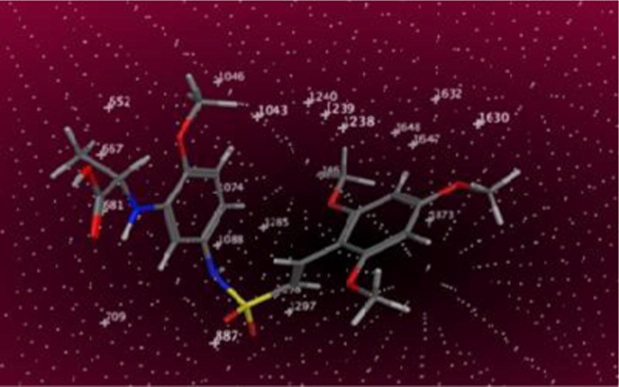
Important steric and electrostatic fields around the aligned compounds generated by AutoGPA model. For better presentation, only one molecule was shown instead of the superposition of all molecules.
2.3.1 Pharmacophore elucidation and alignment
The generated conformers for ligands should be aligned over the common pharmacophore queries. Hydrogen bond acceptor, hydrogen bond donor, hydrophobic area and positively and negatively ionized areas as pharmacophore features were searched in each conformation. When biologically active molecules join to binding site of receptor, they form similar interactions, so, it is expected that their bioactive conformation carries common three-dimensional arrangement of pharmacophores. The option named AutoGPA looked for pharmacophore queries (three-dimensional arrangement of the pharmacophore features) that derive good overlay of the most active molecules. At last, using this option, pharmacophore queries which were satisfied by all or a large number of the most active molecules were extracted and used to align all compounds of training set. Common geometry features of active compounds in case no 3D structure of target is available, can give information about key interactions between the active molecules and receptor (Asakawa et al., 2012; Kumar and Tiwari, 2013).
2.3.2 3D-QSAR model construction
AutoGPA-based 3D-QSAR model was generated by superimposed ligands using pharmacophore alignment. It calculates fields based on theory of CoMFA. A cubic lattice with 2.0 Å grid spacing surrounding all of the compounds was created and a probe atom that was sp3 carbon atom with charge +1.0 was used at each intersection grid point. Steric and electrostatic energies interaction based on van der Waals and columbic between atoms and probe was calculated (Pirhadi and Ghasemi, 2010). In calculation of grid potential, 30 kcal/moles limit of van der Waals potential and a threshold 0.15 for maximum variance were considered. PLS regression was used to develop a model that correlates grid potential fields to biological activity. The optimum number of components was fixed to 10. In this manner, 3D-QSAR models were constructed, sorted based on q2 criterion of leave-one-out crossvalidation (LOOCV) (Section 2.4) and final AutoGPA model was achieved.
2.4 Validation of models
Crossvalidation as an internal validation technique was used to assess the prediction quality of the models. In a standard internal validation method, named LOOCV (leave one out crossvalidation), one compound is excluded from the original training set, and a new model is built based on new training set and this model is used to predict the activity of the excluded one. For each model, this procedure is repeated for whole compounds of data set, and each compound has been excluded once, then cross validated q2 which is considered as a criterion of robustness and predictive ability of the models, was calculated by Eq. (2) (Cramer et al., 1988a; Wold, 1978) as follows:
In addition, for better predictive potential of models, Roy and Roy (2008) introduced following modified r2 (
):
To demonstrate the reliability of predictions of AutoGPA model, applicability domain was determined by leverage approach (Dragos et al., 2009). Standardized residuals versus leverage values visualize the applicability domain of the model. The warning leverage is calculated as 3(k + 1)/n, where k is the number of latent variables of the model and n is the number of training set molecules. Compounds with higher leverage value than h∗ are called X outliers that indicate structurally significant chemicals, and compounds which have higher standardized residual than 3 are considered as Y outliers (Stanforth et al., 2007; Tetko et al., 2008).
2.5 Molecular docking
X-ray structure of tubulin with the stoichiometry “hetero-5-mer-A2B2C” was extracted from protein data bank (PDB code: 3HKE). Docking studies were conducted on colchicine as one of binding pockets of tubulin by Gold algorithm using Discovery Studio 2.5 (Discovery Studio). Ligand structures were typed with CHARMm force field and partial charges were calculated by Momany-Rone option. Then, resulting structures were minimized with Smart Minimizer which performs 1000 steps of steepest descent with a RMS gradient tolerance of 3, followed by conjugate gradient minimization. In next step, for preparation of tubulin, complex typed with CHARMm force field, hydrogen atoms were added, all water molecules were removed and pH adjusted to neutral 7.4. A 8 Å radius sphere was defined as the binding region for docking study. Other parameters were set by default protocol settings. Gold method employs a strong genetic algorithm approach for conformational search and molecular docking (Politi et al., 2010) to guess, how fine the compounds join to the tubulin active site (Sakkiah et al., 2011). This program considers complete flexibility of side chains of residues of receptor at binding site. Finally, all of the datasets were docked into binding site of receptor, and fitness scores were obtained. Compounds with larger fitness score have been docked better (Ardakani and Ghasemi, 2013; Li et al., 2012).
2.6 Virtual screening and ADMET analysis
The ZINC database was screened with the best generated pharmacophore AutoGPA model through ZINCPharmer (http://ZINCpharmer.csb.pitt.edu) (Jasuja et al., 2014). ZINCPharmer is an online website that uses pharmer pharmacophore search method to explore ZINC database (Koes and Camacho, 2012). Molecular weight (<500), total number of rotatable bonds to 10 and number of conformations per molecule to 1 were considered as primary filters in this step of screening. Then, the obtained hits were filtered using Lipinski’s rules (Ca, 2000; Lipinski CAF and Feeney, 1997; Yadav and Khan, 2013). The remaining molecules were screened by docked into binding site of receptor by Gold algorithm. Absorption, distribution, metabolism and excretion, ADME parameters, were calculated to investigate pharmacokinetic properties of hit compounds. If a drug absorbed fast and completely by gastrointestinal tract (GIT), distributed selectivity to its receptor, its effect did not eliminate quickly in metabolization and in excretion process, removed in a proper procedure without creating any harm, is considered ideal. Some chemical descriptors were used to calculate pharmacokinetics properties that have relationship with chemical structure (Hodgson, 2001; Winiwarter et al., 1998). ADME studies on virtual hits were performed by Qikprop version 3.2 of Schrodinger suite, (2010) (Schrodinger Suite, 2010: QikProp and New York). To assess toxicity risk for obtained hits, mutagenicity, tumorigenicity, irritant and reproductive effects were investigated by OSIRIS property explorer (Explorer. et al.). Also, drug likeness and drug score values were determined for each compound.
3 Results and discussion
3.1 Comparison of 3D-QSAR models
The 3D-QSAR models were derived for a dataset of 45 tubulin inhibitors. Fig. 3 shows the trend followed for the development of CoMFA, CoMSIA and AutoGPA models. The statistical parameters associated with the models were listed in Table 2. Although results indicate the CoMFA model gives higher q2 than those obtained by AutoGPA and CoMSIA, other specifications of AutoGPA model are better. The prediction ability of models was determined using a set of 8 test compounds not included in the model generation. As we can see in this table, non-cross-validated correlation coefficients and the predicted
value of AutoGPA model were 0.92 and 0.91 with a number of optimized components of 3. Therefore, this model can be used reliably in new inhibitors design. The values of experimental and predicted activities of all models are depicted in Table 3. The graphs of actual activity versus predicted activity of the training set and test set for all models are illustrated in Fig. 4a–c. The analysis of the applicability domain of the AutoGPA model, Fig. 5, denotes no outliers in the test set and demonstrates the ability of model in predicting the action of new compounds. q2 = Cross-validated correlation coefficient after the leave-one-out procedure.
= Non-cross-validated correlation coefficient. RMSEC = Root-mean-square-error for training set. n = optimum number of components. RMSEP = Root-mean-square-error for test set.
= predictive correlation coefficient.
= correlation between predicted versus observed activity setting the intercept zero.
= modified squared correlation coefficient.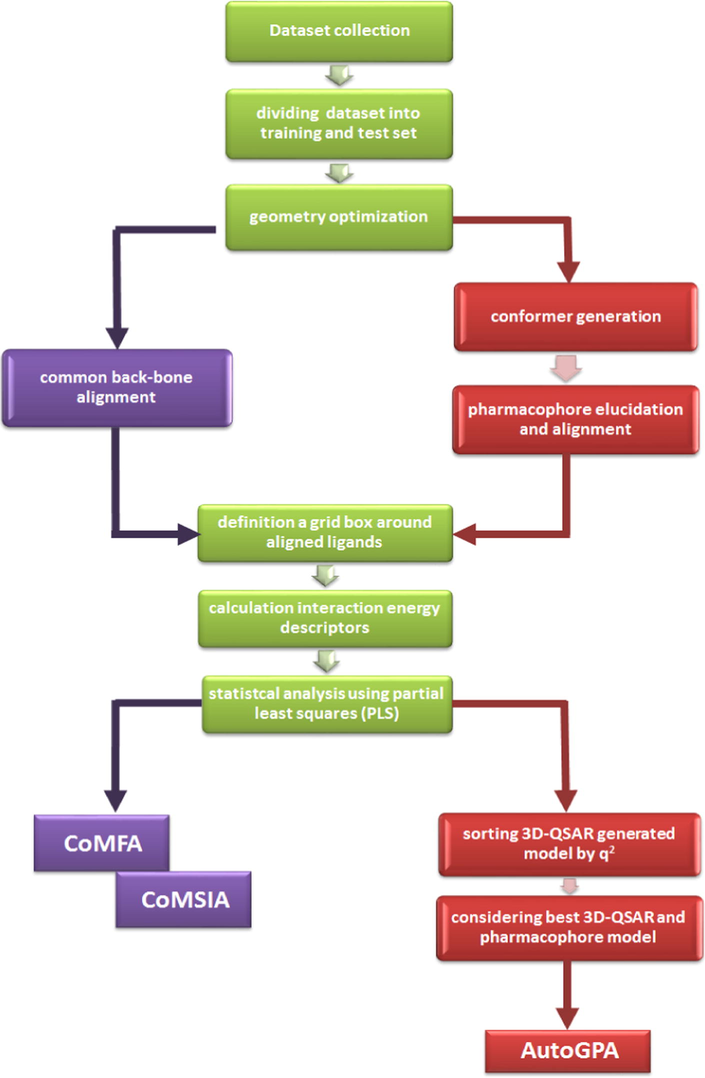
Workflow for the process of generation of AutoGPA, CoMFA and CoMSIA, in this study.
Component
CoMFA
CoMSIA
AutoGPA
q2
0.69
0.56
0.55
R2ncv
0.86
0.75
0.92
RMSEC
0.4
0.41
0.35
n
5
3
3
RMSEP
1.07
0.85
0.42
F value
53.25
32.40
206.04
R2pred
0.68
0.76
0.91
0.08
0.08
0.06
k
0.84
0.88
0.98
k′
1.17
1.12
1.02
(overall)
0.68
0.79
0.89
(test)
0.52
0.53
0.65
Fraction
Steric
0.88
0.17
0.11
Electrostatic
0.12
0.05
0.89
Hydrophobic
0.32
H-bond donor
0.26
H-bond acceptor
0.2
Compound no.
Experimental
CoMFA
CoMSIA
AutoGPA
Pred.
Res.
Pred.
Res.
Pred.
Res.
1a
5
4.88
0.12
4.90
0.1
5.31
−0.31
2a
4.7
4.67
0.03
4.94
−0.24
5.12
−0.42
3
5
4.84
0.16
4.67
0.33
4.65
0.35
4
5
4.91
0.09
4.75
0.25
4.66
0.34
5a
5.3
4.56
0.74
4.58
0.72
5.51
−0.21
6
4.82
4.93
−0.11
5.14
−0.32
4.88
−0.06
7
6.43
4.96
1.47
5.50
0.93
6.29
0.14
8
6.7
5.81
0.89
5.58
1.12
6.73
−0.03
9
4.56
4.71
−0.25
5.00
−0.54
4.45
0.01
10
5.12
5.26
−0.14
4.79
0.33
5.1
0.02
11
5
5.78
−0.78
5.38
−0.38
5.53
−0.53
12
4.12
4.49
−0.37
4.56
−0.44
5
−0.88
13a
7.52
5.7
1.82
5.82
1.7
6.68
0.84
14
7.4
7.41
−0.01
7.48 47
−0.08
6.77
0.63
15
5.6
5.6
0.00
5.61
−0.01
5.48
0.12
16
4.12
5.1
−0.98
4.97
−0.85
5.27
−1.15
17
4.46
4.35
0.11
4.52
−0.06
4.45
0.01
18
4
4.07
−0.07
4.33
−0.33
4.34
−0.34
19
5
4.78
0.22
4.58
0.42
5.22
−0.22
20
5
4.87
0.13
4.54
0.46
5.17
−0.17
21
4
4.35
−0.35
5.07
−1.07
4.3
−0.3
22
5
4.85
0.15
5.05
−0.05
5.09
−0.09
23
5
4.92
0.08
5.03
−0.03
5.01
−0.01
24
5
5.13
−0.13
5.02
−0.02
5.17
−0.17
25
5.6
5.08
0.52
5.33
−0.27
5.93
−0.33
26a
5.3
4.22
1.08
4.59
0.71
5.24
0.06
27
5
4.73
0.27
4.79
0.21
5.12
−0.12
28
4
3.9
0.10
4.12
−0.12
4.43
−0.43
29
4.12
3.82
0.30
4.05
0.07
4.4
−0.28
30
4
4.32
−0.32
3.86
0.14
3.56
0.44
31
4.46
4.37
0.09
4.30
0.16
4.38
0.08
32
4.46
4.55
−0.09
4.67
−0.21
4.04
0.42
33
6.46
6.62
−0.16
6.63
−0.17
6.47
−0.01
34
7
7
0.00
6.56
0.44
6.8
0.2
35
6.7
6.86
−0.16
6.86
−0.16
6.87
−0.17
36a
5.6
5.33
0.27
5.42
0.18
5.4
0.2
37
5.6
5.33
0.27
5.52
0.08
5.4
0.2
38
5.12
5.18
−0.06
5.27
−0.15
5.43
−0.31
39
6.4
6.35
0.05
6.83
−0.43
6.42
−0.02
40
7.4
7.37
0.03
7.25
0.15
7.34
0.06
41
7.15
6.83
0.32
7.35
−0.2
7.35
−0.2
42
7.12
7.32
−0.2
6.97
0.15
7.1
0.02
43a
7.12
5.53
1.59
6.03
1.09
6.55
0.57
44
7.12
7.22
−0.1
7.04
0.08
6.7
0.42
45a
6.6
5.4
1.20
5.81
0.79
6.66
−0.06
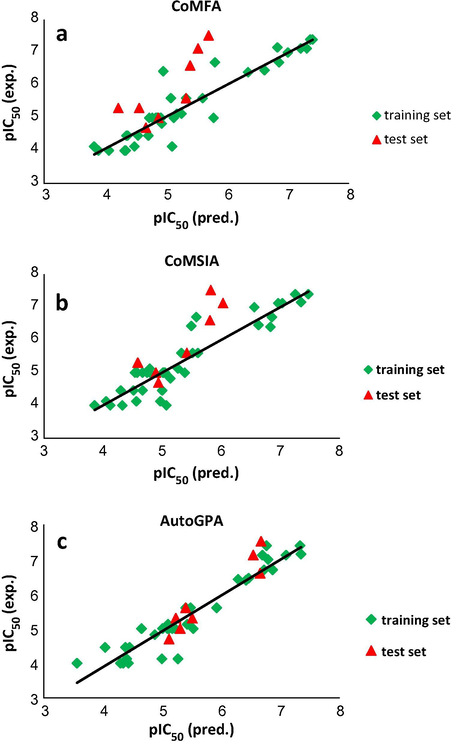
Observed vs. predicted activities for the training and test sets of compounds based on CoMFA (a), CoMSIA (b) and AutoGPA (c) models.
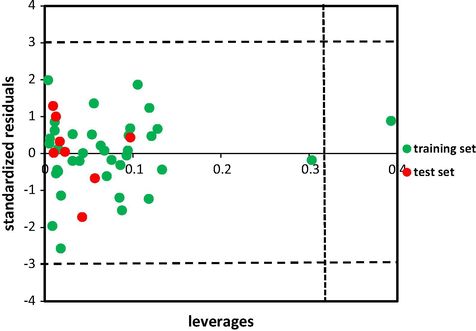
Standardized residuals vs. leverages. Dashed lines represent ±3 standardized residual and dotted line represents warning leverage (h∗ ≈ 0.32).
3.2 Contour maps analysis
To visualize the information of derived models contour maps are generated. They are calculated as the product of the standard deviation of field (StDev) at each grid point and PLS coefficient. The contour maps show regions where differences in molecular fields are related to differences in activity (Mao et al., 2012). Interpretation of the steric and electrostatic contours, using compound 40 as the template structure of AutoGPA model is trivial and displayed in Fig. 6a and b. The steric maps are represented by green and yellow contours while the green color indicates regions in space around aligned molecules where bulky groups would favorably interact with the receptor and yellow color shows regions where bulky groups would decrease the activity. Fig. 6a shows the yellow region near 6-methoxy (R1) substituent that suggests a bulky group is not favorable and decreases the activity. It can explain the activity of compound 16 lower than compound 17 due to the existence of OCH3 bulky group. A small green contour around position 3rd of terminal phenyl ring (R) reveals the bulky substituent increases the activity. For example, the comparison of this position in compounds 14 (OCOCH2C(CH3)2C6H) with 8 (without any substituent), 15 (OPO(ONa)2) and 16 (NH2) confirms the observation. The electrostatic field represented by blue contours shows regions where an electron donating group would increase the activity and red contours indicate regions where electron withdrawing group would increase the activity. A small red region near position 5th (R1) shows the electronegative substituent causes increasing of the activity (Fig. 6b). The compound 9 with electron donating group –OCH3 is less activate in comparison with compound 8. In the same way, the activity of compound 16 (without any substituent) is more than compound 18 (OCH3). Two blue regions near 4-methoxy group in positions R1 and R indicate electron donating groups would increase the activity demonstrated by the order of activities in some compounds such as: 8 > 7, compound 8 has an extra OCH3 at R1; 5 > 4, compound 5 possesses an OCH3 instead F in compound 4; and 1 > 2, compound 2 with Cl at R indicates lower activity than compound 1 with H atom. The big blue contour near side chain R2 exhibits the electron withdrawing group decreases biological activity. Taking the compounds 36–38 (R2 = CH(C6H5), CH(C6H44-F), CH(C6H44-Br)), the electron withdrawing groups at the R2 situation resulted in decreasing activity with regard to compounds 34 and 35 (R2 = CH(CH3),C(CH3)2). Fig. 7a provides the hydrophobic contour for compound 40 of the CoMSIA model. The yellow and white plots indicate hydrophobicity and hydrophilicity in that region is expected to increase the activity of the molecule. In Fig. 7a, two yellow contours around 4-methoxy group at R1 and R positions which favored the existence of hydrophobic substituents are toward these regions. Compound 8 with hydrophobic group (OCH3) in 4th situation of R1 displayed higher activity than compound 12 (F). One white contour near amine group in 3rd situation of R suggests that a hydrophilic group may be favored. This can explain why derivative 25 exhibited higher activity than compound 24 (compound 25 possesses an NH2 instead NO2 in compound 24) and also compound 29 exhibited higher activity than 28 (compound 29 possess an NH2 instead NO2 in compound 28). The hydrogen bond donor field interaction for CoMSIA model was shown in Fig. 7b. The cyan contours display the hydrogen bond donor groups are favorable while purple contours state these groups would decrease activity. One medium size cyan contour around 4-methoxy (R1) suggests that hydrogen donor group in this region would increase activity. This is a possible reason why compound 11 has higher activity than compound 2 and also compounds 19 and 20 have higher activity than compounds 16, 17 and 18. Two purple contours near 2- and 5-methoxy positions of R1 indicated that hydrogen bond acceptor substituent would benefit the activity. This may explain why derivative 32 with two hydrogen bond acceptor substituents (-F) at these positions exhibits higher activity than compound 30 (without any substituent). In hydrogen bond acceptor field, the magenta and red plots indicate favorable and unfavorable situations. In Fig. 7c, one H-bond acceptor favorable to magenta contour located near 6-methoxy (R1) considering cyan contour of hydrogen donor field in this situation, revealed that both hydrogen bond donor and acceptor groups can increase activity. Great number of the derivatives involved in this study possessed hydrogen bond acceptor group (OCH3) at this site which demonstrates the importance of the hydrogen bond acceptor substituent. Fig. 8 indicates the best pharmacophore hypothesis including 4 features. An orange sphere as aromatic (Aro|PIR) π-ring center on the phenyl ring states all compounds can create π-interaction from this position. Three blue spheres oriented toward sulfur monoxide of all compound, amine group and methoxy group in 3rd and 4th situations of R (Acc2), respectively. This feature shows the ability of diverse positions of compounds of data set for establishing hydrogen bond. The common pharmacophoric features can help in screening out the potential ligand. Modification of substituents of the phenyl rings considering the derived AutoGPA models (3D-QSAR and pharmacophore) motivated us to propose more desirable compounds.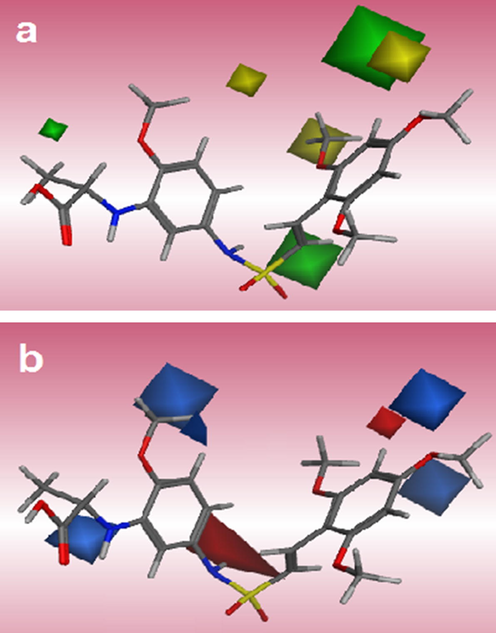
AutoGPA contour maps based on compound 40: steric (a), electrostatic (b).

COMSIA contour maps based on compound 40: hydrophobic (a), hydrogen donor (b) and hydrogen bond acceptor (c).
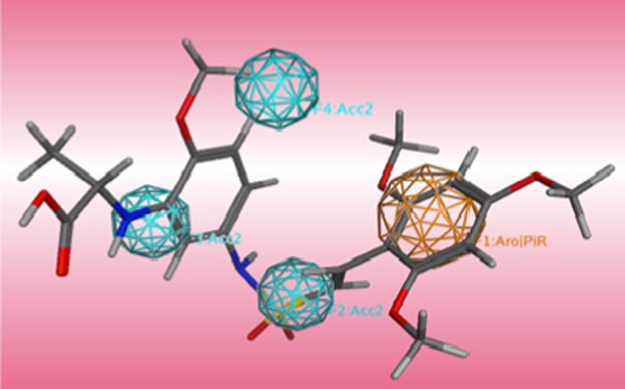
The best pharmacophore model of AutoGPA, mapping with the most active compound 40.
3.3 Molecular docking analysis
Molecular docking was employed to find binding mode of compounds, and additionally to evaluate the reliability of obtained contour maps and pharmacophore model. All compounds were docked in colchicine site of target. The most active compounds in dataset 14 and 40 were selected for more detailed analysis. Fig. 9 displays the hydrogen bonds between the compound 40 and the binding site of receptor, the key residues were labeled. Investigation of the binding mode of compound 40 shows a hydrogen bond between O of 6-methoxy (R1) and Thr179 from the α chain as is mapped to the magenta contour in CoMSIA. In addition, there is one hydrogen bond between O of carbonyl group 3rd situation of R with Val181 from the same chain. The 4-methoxy (R1) formed H-bond with Ala250 from the β chain of tubulin. The hydrogen atoms of amine group of the molecular frame and hydroxyl group on substituent 3 (R) act as hydrogen bond donor against Ser178 from the α chain and Asn349 from the β chain, respectively. In compound 14, carbonyl group 3rd situation of R as hydrogen bond acceptor gives a hydrogen bond with nitrogen atom of amino acid Thr353. Meanwhile, there are not any hydrogen bonds in inactive compound 28, and it could confirm what is the reason of weaker binding between inactive compounds and the binding site. There is an π-cation interaction between the conjugated ring on 3rd situation of R in compound 14 and ammonium group of Lys352 which confirms the ring aromatic feature of pharmacophore model. Docking results illustrated many electrostatic interactions between 2, 4 and 6-methoxy groups (R1) with residues of binding pocket. 4-Methoxy group (R) of compound 14 has electrostatic interaction with polar residues Gln176, Ser178 and Thr179 from the α chain and Lys352 from the β chain in compliance with the blue contour map of AutoGPA model. Several polar residues such as Lys352, Thr314, Asn258 and 350 from the β chain around side chain R2 of template confirm the increasing electropositivity of this substituent, and the more power interaction can be formed, that is in agreement with electrostatic blue contour map AutoGPA.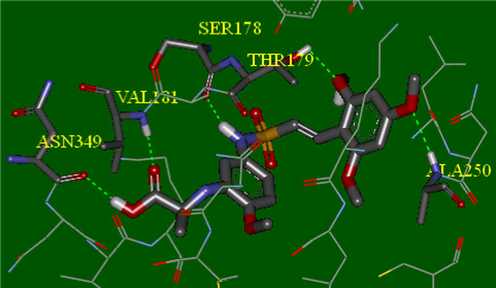
Hydrogen bonding interactions between compound 40 and key residues.
3.4 Virtual screening analysis
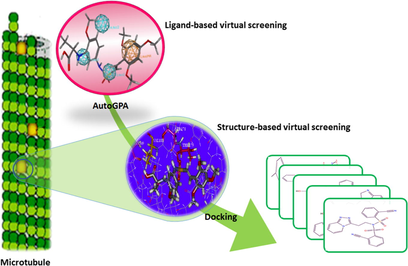
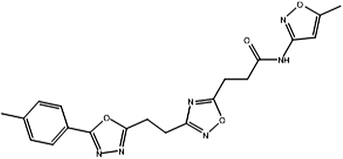
Fig. 10 shows summarized protocol for virtual screening of the molecular libraries in this study. The pharmacophore model usually gives an accurate hypothesis of required attributes for a new lead (Gopalakrishnan et al., 2005). The optimized derived AutoGPA model was used as 3D virtual query to screen the ZINC database for finding new and potent hits. 693 conformers were obtained from the initial screening. As the second step, Lipinski’s rules assessed the drug-likeness of remained compounds, a subset of 488 molecules were retrieved. In the subsequent structure-based screening step, they were docked into active site of protein to refine the hits using defined sphere of compounds in the data set by the Gold program. Finally, 7 hits which were docked well and gave high Gold fitness scores, are listed in Table 4. Fitness scores were more than the most active compound of data set with score 52.77. The 7 hits fitted in 4 diverse structural scaffolds and were different from the compounds in the training data set. More investigation was performed on Vs3 with Gold fitness score of 77.65. Cyanide group attached to phenyl ring of this hit that mapped with acceptor feature in pharmacophore model acts as hydrogen bond acceptor and forms two hydrogen bonds with Ala20 and Asp251 residues. The methyl group in meta position of aromatic ring in compound Vs1 forms several hydrophobic interactions with Val238, Leu242 and 255 hydrophobic residues. The methyl group in para position Vs2 is exposed to polar amino acids Asn258 and Thr239 and 40. So, this hit is unable to establish appropriate interaction in this position and shows the Gold fitness score less than Vs1. The results indicated the AutoGPA pharmacophore model is a powerful tool in finding new inhibitors for virtual screening.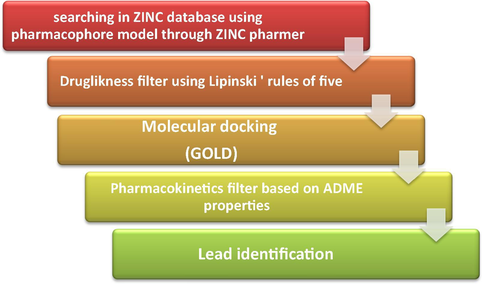
Workflow for combined ligand-based and structure-based virtual screening.
Compound name
Structure
ZINC number
Gold score
Vs1

ZINC21721788
72.78
Vs2
ZINC21721781
71.84
Vs3

ZINC12569439
77.65
Vs4

ZINC21537504
74.88
Vs5

ZINC21721756
72.20
Vs6

ZINC20987079
74.76
Vs7
ZINC63212443
73.96
3.5 ADMET studies
All the seven reported hits have drug-likeness properties according to Lipinski’s rules. We investigated several physicochemical properties related to pharmacokinetic parameters for these molecules and results are summarized in Table 5. Log P was calculated to measure the hydrophobicity of compounds. Compound with high lipophilicity and also high log P will have a poor surface contact with the gut and likely poor absorption. It is known that compounds with a log P < 5 can be absorbed well. Aqueous solubility (log S) was calculated to recognize poorly soluble compounds because a low solubility governed by log S causes a bad absorption, distribution and absorption of a compound. Calculations related to blood–brain barrier (log BB) and apparent MDCK cell permeability, gut-blood barrier (Caco-2 cell permeability), transdermal transport rate (Jm), aqueous solubility,% human oral absorption in Gl (±20%) serum protein binding, log P for octanol/water and skin permeability (kp) showed that these values for hits fell within the standard range of 95% of known drugs for drug likeness (Yadav and Khan, 2013). The results of toxicity risk assessment indicates that hits do not have any mutagenicity, tumorigenicity and irritant effects, and reproductive effects for 3 hits had medium limit. The calculated toxicity risk assessment parameters for virtually screened hits are listed in Table 6. MUT: Mutagenicity; TUM: Tumorigenicity; IRR: Irritating Effects; RE: Reproductive effects; CLP: cLogP; S: Solubility; DL: Drug likeness; DS: Drug Score (Calculated through OSIRIS property explorer).
Descriptors
Vs1
Vs2
Vs3
Vs4
Vs5
Vs6
Vs7
Stand. rangea
Apparent Caco-2 permeability (nm/s)
158
114
37
44
195
148
470
<25 poor, >500 great
Apparent MDCK permeability (nm/s)
158
81
14
139
153
146
218
<25 poor, >500 great
Jm (max. transdermal transport rate)
0.002
0.001
0.028
0.001
0.006
0.005
0.226
μg/cm2 h
Log S (aqueous solubility)
−4.615
−4.483
−3.532
−5.645
−4.601
−5.522
−4.278
−6.5/0.5
% human oral absorption in Gl (±20%)
80
76
62
77
81
85
96
<25% is poor
log BB for brain/blood
−1.709
−1.840
−2.592
−2.065
−4.601
−1.701
−1.102
−3.0/1.2
log Khsa (serum protein binding)
−0.125
−0.159
−0.975
0.249
−0.261
0.180
0.158
−1.5/1.5
log P for octanol/water
2.348
2.144
1.220
3.436
2.218
3.322
3.697
−2.0/6.5
Skin-permeability coefficient (log KP)
−3.655
−3.999
−3.713
−3.289
−3.206
−2.388
−1.994
−8.0 to −1.0, KP in cm/h
S. no.
MUT
TUM
IRR
RE
CLP
S
DL
DS
Vs1
No risk
No risk
No risk
Medium risk
2.86
−5.67
1.07
0.38
Vs2
No risk
No risk
No risk
Medium risk
2.86
−5.67
−1.34
0.26
Vs3
No risk
No risk
No risk
No risk
1.12
−4.13
−3.34
0.33
Vs4
No risk
No risk
No risk
No risk
2.49
−6.06
4.87
0.40
Vs5
No risk
No risk
No risk
Medium risk
2.51
−5.32
1.67
0.44
Vs6
No risk
No risk
No risk
No risk
2.17
−5.39
6.66
0.57
Vs7
No risk
No risk
No risk
No risk
1.98
−3.07
5.99
0.78
4 Conclusion
In this study, 3D QSAR modeling, molecular docking, virtual screening and ADMET approaches were employed to predict the biological activity of compounds and find the probable lead compounds from virtual screening. The CoMFA and CoMSIA models were generated using common substructure-based alignment of compounds in training set. The AutoGPA model as a pharmacophore alignment-based method was applied to find the bioactive conformers and yielded better predictive and reliable model. The calculation of parameters for prediction ability of the derived models confirms that the AutoGPA model is more predictive. Also, the AutoGPA contour maps were more interpretable to explain the effective features on activity. The pharmacophoric model, Lipinski’s rules and molecular docking screened ZINC database to suggest 7 hits with high score fitness and diverse structures. In silico ADMET studies indicated the hits are in standard ranges. Therefore, AutoGPA model can be used as a beneficial method for screening large library and finding new inhibitors.
References
- What tubulin drugs tell us about microtubule structure and dynamics. Semin. Cell Devel. Biol. 2011:916-926. Elsevier
- [Google Scholar]
- Identification of novel inhibitors of HIV-1 integrase using pharmacophore-based virtual screening combined with molecular docking strategies. Med. Chem. Res.. 2013;22:5545-5556.
- [Google Scholar]
- AutoGPA: an automated 3D-QSAR method based on pharmacophore alignment and grid potential analysis. Int. J. Med. Chem. 2012
- [Google Scholar]
- Drug-like properties and the causes of poor solubility and poor permeability. J. Pharmacol. Toxicol. Methods. 2000;44:235-249.
- [Google Scholar]
- Identification of proteins interacting with human SP110 during the process of viral infections. Med. Chem.. 2011;7:121-126.
- [Google Scholar]
- Prostate cancer with variants in CYP17 and UGT2B17 genes: a meta-analysis. Protein Pept. Lett.. 2012;19:62-69.
- [Google Scholar]
- Current development status of small-molecule vascular disrupting agents. Curr. Opin. Invest. Drugs (London, England: 2000). 2006;7:522-528.
- [Google Scholar]
- Conformational sampling of druglike molecules with MOE and catalyst: implications for pharmacophore modeling and virtual screening. J. Chem. Inf. Model.. 2008;48:1773-1791.
- [Google Scholar]
- The biological functions of low-frequency vibrations (phonons). VI. A possible dynamic mechanism of allosteric transition in antibody molecules. Biopolymers. 1987;26:285-295.
- [Google Scholar]
- Low-frequency collective motion in biomacromolecules and its biological functions. Biophys. Chem.. 1988;30:3-48.
- [Google Scholar]
- Low-frequency resonance and cooperativity of hemoglobin. Trends Biochem. Sci.. 1989;14:212.
- [Google Scholar]
- Molecular therapeutic target for type-2 diabetes. J. Proteome Res.. 2004;3:1284-1288.
- [Google Scholar]
- Structural bioinformatics and its impact to biomedical science. Curr. Med. Chem.. 2004;11:2105-2134.
- [Google Scholar]
- Solitary wave dynamics as a mechanism for explaining the internal motion during microtubule growth. Biopolymers. 1994;34:143-153.
- [Google Scholar]
- A model of the complex between cyclin-dependent kinase 5 and the activation domain of neuronal Cdk5 activator. Biochem. Biophys. Res. Commun.. 1999;259:420-428.
- [Google Scholar]
- Binding mechanism of coronavirus main proteinase with ligands and its implication to drug design against SARS. Biochem. Biophys. Res. Commun.. 2003;308:148-151.
- [Google Scholar]
- Crossvalidation, bootstrapping, and partial least squares compared with multiple regression in conventional QSAR studies. Quant. Struct.-Act. Relat.. 1988;7:18-25.
- [Google Scholar]
- Comparative molecular field analysis (CoMFA). 1. Effect of shape on binding of steroids to carrier proteins. J. Am. Chem. Soc.. 1988;110:5959-5967.
- [Google Scholar]
- Discovery Studio, A.S.I., San Diego, CA, 2009.
- Predicting the predictability: a unified approach to the applicability domain problem of QSAR models. J. Chem. Inf. Model.. 2009;49:1762-1776.
- [Google Scholar]
- Heuristic molecular lipophilicity potential (HMLP): a 2D-QSAR study to LADH of molecular family pyrazole and derivatives. J. Comput. Chem.. 2005;26:461-470.
- [Google Scholar]
- Molecular modeling and chemical modification for finding peptide inhibitor against severe acute respiratory syndrome coronavirus main proteinase. Anal. Biochem.. 2005;337:262-270.
- [Google Scholar]
- Recent advances in QSAR and their applications in predicting the activities of chemical molecules, peptides and proteins for drug design. Curr. Protein Pept. Sci.. 2008;9:248-259.
- [Google Scholar]
- Multiple field three dimensional quantitative structure–activity relationship (MF-3D-QSAR) J. Comput. Chem.. 2008;29:211-219.
- [Google Scholar]
- Energetic analysis of the two controversial drug binding sites of the M2 proton channel in influenza A virus. J. Theor. Biol.. 2009;259:159-164.
- [Google Scholar]
- Fragment-based quantitative structure–activity relationship (FB-QSAR) for fragment-based drug design. J. Comput. Chem.. 2009;30:295-304.
- [Google Scholar]
- Designing inhibitors of M2 proton channel against H1N1 swine influenza virus. PLoS ONE. 2010;5:e9388.
- [Google Scholar]
- Microtubule-binding agents: a dynamic field of cancer therapeutics. Nat. Rev. Drug Discovery. 2010;9:790-803.
- [Google Scholar]
- Genetic algorithm for CoMFA setting optimization: 3D-QSAR study on α-aminosuberic acid derivatives as anti-cancer compounds. J. Chemometr.. 2013;27:323-329.
- [Google Scholar]
- Molecular docking and 3D-QSAR studies of falcipain inhibitors using CoMFA, CoMSIA, and Open3DQSAR. Med. Chem. Res.. 2012;21:2788-2806.
- [Google Scholar]
- A virtual screening approach for thymidine monophosphate kinase inhibitors as antitubercular agents based on docking and pharmacophore models. J. Chem. Inf. Model.. 2005;45:1101-1108.
- [Google Scholar]
- Assessing model fit by cross-validation. J. Chem. Inf. Comput. Sci.. 2003;43:579-586.
- [Google Scholar]
- Pharmaceutical design of antimitotic agents based on combretastatins. Curr. Pharm. Des.. 2005;11:1655-1677.
- [Google Scholar]
- An in-depth analysis of the biological functional studies based on the NMR M2 channel structure of influenza A virus. Biochem. Biophys. Res. Commun.. 2008;377:1243-1247.
- [Google Scholar]
- Dual inhibitors of Janus kinase 2 and 3 (JAK2/3): designing by pharmacophore-and docking-based virtual screening approach. Mol. Diversity. 2014;18:253-267.
- [Google Scholar]
- Microtubules and actin filaments: dynamic targets for cancer chemotherapy. Curr. Opin. Cell Biol.. 1998;10:123-130.
- [Google Scholar]
- Discovery of 4-anilino-N-methylthieno [3, 2-d] pyrimidines and 4-anilino-N-methylthieno [2, 3-d] pyrimidines as potent apoptosis inducers. Bioorg. Med. Chem. Lett.. 2009;19:3536-3540.
- [Google Scholar]
- Virtual ligand screening: strategies, perspectives and limitations. Drug Discovery Today. 2006;11:580-594.
- [Google Scholar]
- Molecular similarity indices in a comparative analysis of drug molecules to correlate and predict their biological activity. J. Medici. Chem.. 1994;37:4130-4146.
- [Google Scholar]
- ZINCPharmer: pharmacophore search of the ZINC database. Nucleic Acids Res.. 2012;40:W409-W414.
- [Google Scholar]
- Grid potential analysis, virtual screening studies and ADME/T profiling on N-arylsulfonylindoles as anti-HIV-1 agents. J. Chemom.. 2013;27:143-154.
- [Google Scholar]
- Identification of CKD-516: a potent tubulin polymerization inhibitor with marked antitumor activity against murine and human solid tumors. J. Med. Chem.. 2010;53:6337-6354.
- [Google Scholar]
- Novel inhibitor design for hemagglutinin against H1N1 influenza virus by core hopping method. PLoS ONE. 2011;6:e28111.
- [Google Scholar]
- Molecular docking and 3D QSAR studies of substituted 4-amino-1H-pyrazolo [3, 4-d] pyrimidines as insulin-like growth factor-1 receptor (IGF1R) inhibitors. Med. Chem. Res.. 2012;21:3301-3311.
- [Google Scholar]
- Experimental and computational approaches to estimate solubility and permeability in drug discovery and development settings. Adv. Drug Deliv. Rev.. 1997;23:5-25.
- [Google Scholar]
- CoMFA and CoMSIA 3D-QSAR studies on quionolone caroxylic acid derivatives inhibitors of HIV-1 integrase. Eur. J. Med. Chem.. 2010;45:3413-3419.
- [Google Scholar]
- Design novel dual agonists for treating type-2 diabetes by targeting peroxisome proliferator-activated receptors with core hopping approach. PLoS ONE. 2012;7:e38546.
- [Google Scholar]
- Mahindroo, N., Liou, J.-P., Chang, J.-Y., Hsieh, H.-P., 2006. Antitubulin agents for the treatment of cancer-a medicinal chemistry update.
- Docking, molecular dynamics and quantitative structure–activity relationship studies for HEPTs and DABOs as HIV-1 reverse transcriptase inhibitors. J. Mol. Model.. 2012;18:2185-2198.
- [Google Scholar]
- Using the TOPS-MODE approach to fit multi-target QSAR models for tyrosine kinases inhibitors. Eur. J. Med. Chem.. 2011;46:2185-2192.
- [Google Scholar]
- In Silico exploration of anti-inflammatory activity of natural coumarinolignoids. Chem. Biol. Drug Des.. 2011;78:567-579.
- [Google Scholar]
- Multi-target QPDR classification model for human breast and colon cancer-related proteins using star graph topological indices. J. Theor. Biol.. 2009;257:303-311.
- [Google Scholar]
- Combretastatin A-4 analogues as antimitotic antitumor agents. Curr. Med. Chem.. 2003;10:1697-1722.
- [Google Scholar]
- Differential effects of vinblastine on polymerization and dynamics at opposite microtubule ends. J. Biol. Chem.. 1996;271:29807-29812.
- [Google Scholar]
- Review: tubulin function, action of antitubulin drugs, and new drug development. Cancer Invest.. 2005;23:264-273.
- [Google Scholar]
- Mechanism of drug inhibition and drug resistance of influenza A M2 channel. Proc. Natl. Acad. Sci.. 2009;106:7379-7384.
- [Google Scholar]
- Synthesis and cytotoxic evaluation of combretafurans, potential scaffolds for dual-action antitumoral agents. J. Med. Chem.. 2006;49:5372-5376.
- [Google Scholar]
- 3D-QSAR analysis of human immunodeficiency virus entry-1 inhibitors by CoMFA and CoMSIA. Eur. J. Med. Chem.. 2010;45:4897-4903.
- [Google Scholar]
- Unified multi-target approach for the rational in silico design of anti-bladder cancer agents. Anti-Cancer Agents Medici. Chem. (Formerly Curr. Medic. Chem.-Anti-Cancer Agents). 2013;13:791-800.
- [Google Scholar]
- Development of accurate binding affinity predictions of novel renin inhibitors through molecular docking studies. J. Mol. Graph. Model.. 2010;29:425-435.
- [Google Scholar]
- Unified QSAR approach to antimicrobials. Part 3: first multi-tasking QSAR model for input-coded prediction, structural back-projection, and complex networks clustering of antiprotozoal compounds. Bioorg. Med. Chem.. 2008;16:5871-5880.
- [Google Scholar]
- Cluster based SVR-QSAR modelling for HTS records: an implementation for anticancer leads against human breast cancer. Comb. Chem. High Throughput Screening. 2013;16:511-521.
- [Google Scholar]
- On two novel parameters for validation of predictive QSAR models. Molecules. 2009;14:1660-1701.
- [Google Scholar]
- Design, synthesis and biological evaluation of (E)-NAryl-2-arylethene-sulfonamide analogues as potent and orally bioavailable microtubule-targeted anticancer agents. J. Medici. Chem.. 2013;56:5562-5586.
- [Google Scholar]
- On some aspects of variable selection for partial least squares regression models. QSAR Comb. Sci.. 2008;27:302-313.
- [Google Scholar]
- Pharmacophore based virtual screening, molecular docking studies to design potent heat shock protein 90 inhibitors. Eur. J. Med. Chem.. 2011;46:2937-2947.
- [Google Scholar]
- Structure and mechanism of the M2 proton channel of influenza A virus. Nature. 2008;451:591-595.
- [Google Scholar]
- Schrodinger Suite, 2010: QikProp, v., Schrödinger, LLC, New York, NY.
- Development and validation of k-nearest-neighbor QSPR models of metabolic stability of drug candidates. J. Med. Chem.. 2003;46:3013-3020.
- [Google Scholar]
- Discovery of substituted 4-anilino-2-arylpyrimidines as a new series of apoptosis inducers using a cell-and caspase-based high throughput screening assay. 2. Structure–activity relationships of the 2-aryl group. Bioorg. Med. Chem. Lett.. 2009;19:2305-2309.
- [Google Scholar]
- Fragment-based QSAR model toward the selection of versatile anti-sarcoma leads. Eur. J. Med. Chem.. 2011;46:5910-5916.
- [Google Scholar]
- Multi-target drug discovery in anti-cancer therapy: fragment-based approach toward the design of potent and versatile anti-prostate cancer agents. Bioorg. Med. Chem.. 2011;19:6239-6244.
- [Google Scholar]
- Chemoinformatics in anti-cancer chemotherapy: multi-target QSAR model for the in silico discovery of anti-breast cancer agents. Eur. J. Pharm. Sci.. 2012;47:273-279.
- [Google Scholar]
- Chemoinformatics in multi-target drug discovery for anti-cancer therapy: in silico design of potent and versatile anti-brain tumor agents. Anti-Cancer Agents Medici. Chem. (Formerly Curr. Medici. Chem.-Anti-Cancer Agents).. 2012;12:678.
- [Google Scholar]
- A measure of domain of applicability for QSAR modelling based on intelligent K-means clustering. QSAR Comb. Sci.. 2007;26:837-844.
- [Google Scholar]
- Critical assessment of QSAR models of environmental toxicity against Tetrahymena pyriformis: focusing on applicability domain and overfitting by variable selection. J. Chem. Inf. Model.. 2008;48:1733-1746.
- [Google Scholar]
- Synthesis and cytotoxic evaluation of combretafurazans. J. Med. Chem.. 2005;48:3260-3268.
- [Google Scholar]
- The importance of being earnest: validation is the absolute essential for successful application and interpretation of QSPR models. QSAR Comb. Sci.. 2003;22:69-77.
- [Google Scholar]
- A network-QSAR model for prediction of genetic-component biomarkers in human colorectal cancer. J. Theor. Biol.. 2009;261:449-458.
- [Google Scholar]
- Insight into the molecular switch mechanism of human Rab5a from molecular dynamics simulations. Biochem. Biophys. Res. Commun.. 2009;390:608-612.
- [Google Scholar]
- Insights from modeling the 3D structure of New Delhi metallo-β-lactamse and its binding interactions with antibiotic drugs. PLoS ONE. 2011;6:e18414.
- [Google Scholar]
- Insights into the mutation-induced HHH syndrome from modeling human mitochondrial ornithine transporter-1. PLoS ONE. 2012;7:e31048.
- [Google Scholar]
- Study of drug resistance of chicken influenza A virus (H5N1) from homology-modeled 3D structures of neuraminidases. Biochem. Biophys. Res. Commun.. 2007;354:634-640.
- [Google Scholar]
- Insights from investigating the interaction of oseltamivir (Tamiflu) with neuraminidase of the 2009 H1N1 swine flu virus. Biochem. Biophys. Res. Commun.. 2009;386:432-436.
- [Google Scholar]
- Investigation into adamantane-based M2 inhibitors with FB-QSAR. Med. Chem.. 2009;5:305-317.
- [Google Scholar]
- Glossary of terms used in medicinal chemistry (IUPAC Recommendations 1998) Pure Appl. Chem.. 1998;70:1129-1143.
- [Google Scholar]
- Modulation of microtubule dynamics by drugs. A paradigm for the actions of cellular regulators. Cell Struct. Funct.. 1999;24:329-335.
- [Google Scholar]
- Correlation of human jejunal permeability (in vivo) of drugs with experimentally and theoretically derived parameters. A multivariate data analysis approach. J. Med. Chem.. 1998;41:4939-4949.
- [Google Scholar]
- Cross-validatory estimation of the number of components in factor and principal components models. Technometrics. 1978;20:397-405.
- [Google Scholar]
- Synthesis and biological evaluation of 2, 4, 5-substituted pyrimidines as a new class of tubulin polymerization inhibitors. J. Med. Chem.. 2011;54:3200-3205.
- [Google Scholar]
- QSAR, docking and ADMET studies of camptothecin derivatives as inhibitors of DNA topoisomerase-I. J. Chemom.. 2013;27:21-33.
- [Google Scholar]
- Identification of the N-terminal functional domains of Cdk5 by molecular truncation and computer modeling. Prot.: Struct., Funct., Bioinform.. 2002;48:447-453.
- [Google Scholar]
- Highly potent triazole-based tubulin polymerization inhibitors. J. Med. Chem.. 2007;50:749-754.
- [Google Scholar]
- Novel variable selection quantitative structure-property relationship approach based on the k-nearest-neighbor principle. J. Chem. Inf. Comput. Sci.. 2000;40:185-194.
- [Google Scholar]


