

Translate this page into:
Highly efficient adsorption and removal of Chrysoidine Y from aqueous solution by magnetic graphene oxide nanocomposite
⁎Corresponding author. Tel.: +86 10 88256414; fax: +86 10 88256093. ymhao@ucas.ac.cn (Yongmei Hao)
-
Received: ,
Accepted: ,
This article was originally published by Elsevier and was migrated to Scientific Scholar after the change of Publisher.
Peer review under responsibility of King Saud University.
Abstract
A new kind of adsorbent graphene oxide nanocomposite (GO–Fe3O4) for removal of Chrysoidine Y was synthesized using the modified Hummers method and co-precipitation. The synthesized GO–Fe3O4 was used as an adsorbent for the removal of Chrysoidine Y from aqueous solution. The effect of initial pH on the adsorption of Chrysoidine Y onto GO–Fe3O4 has been investigated. The adsorption kinetics, isotherm and thermodynamics also have been evaluated. The adsorption was strongly dependent on the pH of medium. The studies on the adsorption revealed that the adsorption process obeyed the Pseudo-second order kinetics model, and the rate-limiting step might be chemical sorption. And the Langmuir isotherm was applicable to describe the adsorption process. This hybrid showed a good performance for the removal of Chrysoidine Y from aqueous solution with an adsorption capacity of 344.83 mg g−1 at room temperature, and could be easily removed from solution using a hand-held magnet in 10 min. Moreover, the adsorption mechanism was discussed and thermodynamic parameters were determined. Thermodynamic parameters indicated that the adsorption process was exothermic and spontaneous. Above all, the removal efficiency of GO–Fe3O4 was still kept at 96.0% when the concentration of dye was 100 mg L−1 in polluted river. This work shows that GO–Fe3O4 is a suitable and efficient adsorbent in the removal of Chrysoidine Y from aqueous solution.
Keywords
Adsorption
Chrysoidine Y
Magnetic graphene oxide nanocomposite
Magnetic separation
Removal

1 Introduction
Owing to growing population and rapid industrialization, the environmental problems get more and more attention. Areas near various industries, such as textile, paper making, metallurgy, carpet making, leather, distillery, and printing are polluted continuously because of the disposal of industrial wastes. In particular, organic dye contamination is an issue of critical importance in environmental pollution. Organic dyes in environment are difficult to remove because most of them are nondegradable (Yan et al., 2011), and stable toward light due to their complex structures (Yan et al., 2011). Organic dye in environment can cause esthetic problems. But what is even worse is that organic dyes may cause chromosomal damage, high biotoxicity, potential mutagenic and carcinogenic effects on human beings (Ambashta and Sillanpaa, 2010).
Azo dyes, a class of dyes characterized by the presence of azo-group [—N⚌N—], are widely used in the textile, plastic, leather, rubber and food industries, and also synthesized in many industries (Mittal et al., 2010). Thus, the removal of dyes from wastewater is a challenging topic in environmental science and technology, and has attracted much attention in recent decades (Abdelkader et al., 2011). Many kinds of methods have been explored to remove the dyes from wastewater, such as photocatalytic degradation (Konstantinou and Albanis, 2004), flocculence (Rhymes and Smart, 2001), ion-exchange (Liu et al., 2007), extraction (Crini, 2005), membrane filtration (Lee et al., 2006), biological treatment (Kornaros and Lyberatos, 2006) and adsorption (Crini, 2006). On account of simplicity, ease of operation and high efficiency, adsorption is deemed as a high-efficient and economical technology (Crini, 2006). Adsorption combined with magnetic separation technology has gained much attention in recent years due to its easy phase separation from aqueous solutions and its capability of treating a mass of wastewater in few minutes (Luo and Zhang, 2009).
Graphene is one or several atomic layers of graphite, which possesses a special two-dimensional (2D) structure and low density, superior mechanical strength and high heat conductance (Service, 2009). It will be a good choice as an adsorbent for adsorbing various organic molecules due to its reactive and large specific surface. What is more, owing to its large delocalized π-electron system, graphene can form strong π-stacking interaction with benzene ring. So it is more suitable for adsorption of aromatic compounds (Allen et al., 2010) than other materials. Graphene oxide (GO) can be considered as oxidized graphene, which is exfoliated by strong oxidants, and it consists of a hexagonal network of covalently linked carbon atoms attached with oxygen-containing functional groups, such as epoxy, carboxyl and hydroxyl groups at various sites (Wu et al., 2011). Loading Fe3O4 nanoparticles onto graphene oxide could combine the relatively high adsorption capacity of graphene oxide and the separation convenience of magnetic materials. It has demonstrated that graphene-based materials can combine with cationic dyes through the π–π stacking interaction and van der Waals forces (Liu et al., 2012; Meral and Metin, 2014). However, as the adsorbents, graphene-based materials suffer from many defects, such as expensive processes and insufficient adsorption capacity (He et al., 2010; Wang et al., 2011; Zhou et al., 2014). Therefore, it is necessary to enhance the adsorption capacity of graphene-based materials using a simple and low cost method.
From the previous syntheses of magnetic graphene oxide nanocomposite (He et al., 2010; Xie et al., 2012; Yang et al., 2009), it could be known that these preparations were complicated. Even, one of these methods needed N2 and one of them took a long time. Moreover, GO–Fe3O4 prepared in these methods had a low adsorption capacity for the removal of organic dyes (He et al., 2010; Xie et al., 2012).
Herein, we synthesized graphene oxide (GO) and magnetic graphene oxide nanocomposite (GO–Fe3O4) in a simple method and simultaneously increased adsorption capacity of GO–Fe3O4 as efficient as possible. Then the prepared GO–Fe3O4 was used to remove Chrysoidine Y from aqueous solutions. The effect of initial pH on adsorption, and the kinetics and adsorption isotherm of Chrysoidine Y adsorption onto the GO–Fe3O4 also have been investigated. This work may promote the preparation of magnetic graphene derivatives and facilitate the development of magnetic graphene-based materials.
2 Materials and methods
2.1 Materials
Graphite powder, Chrysoidine Y (CY, Fig. 1) and Iron (III) chloride hexahydrate were purchased from Sinopharm Chemical Reagent Co., Ltd. NaNO3, KMnO4, H2SO4 (wt: 95.0–98.0), HCl (wt: 36.0–8.0), NH3·H2O (wt: 25) and H2O2 (wt: 30) solutions were purchased from Beijing Chemical Works. FeCl2·4H2O was purchased from Shantou Xilong Chemical Factory of Guangdong. The deionized water was produced using a ULUPURE water purifier system with a resistivity of 18.25 MΩ. Besides graphite powder was of spectroscopically pure reagent, and all other chemicals were of analytical grade. All chemicals were used without further purification.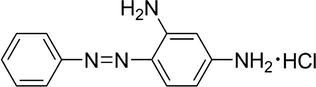
The structure of CY.
2.2 Synthesis of graphene oxide (GO)
Graphene oxide (GO) was synthesized using the modified Hummers method through oxidation of graphite powder (Chen et al., 2009; Madadrang et al., 2012). Typically, 1 g graphite powder and 0.5 g NaNO3 were added into a 500 mL flask. Then, 46 mL of H2SO4 was added in the flask with stirring and simultaneously cooled by immersion in an ice bath at 0 °C. After vigorous stirring for 0.5 h, 6 g (37.97 mmol) KMnO4 was slowly added into the flask and the temperature was kept below 20 °C. After that, the ice bath was removed and the mixture was constantly stirred at 35 °C for 2 h, and diluted with 92 mL deionized water under vigorously stirring with the temperature kept at 98 °C. Then 280 mL deionized water and 5 mL H2O2 solution were slowly added into the mixture, and the color of the mixture changed into bright yellow. The mixture was filtered and washed with 10% HCl solution for several times, and rinsed with deionized water for several times until the solution was neutral. The powder was dried at room temperature under vacuum. In this study, the amount of H2SO4 and KMnO4 was increased and that of H2O2 decreased. From our previous report (Chen et al., 2013), it has been proved that the GO prepared in this simple method has a much higher adsorption capability.
2.3 Synthesis of magnetic graphene oxide nanocomposite (GO–Fe3O4)
The magnetic graphene oxide nanocomposite (GO–Fe3O4) was in situ synthesized by chemical co-precipitation of Fe2+ and Fe3+ in alkaline solution in the presence of GO. The molar ratio of Fe2+:Fe3+ was 1:2. To prepare GO–Fe3O4, 0.25 g GO was dispersed in 30 mL deionized water. The mixture was ultrasonicated (150 W, 40 kHz) for 50 min to form a homogeneous suspension, and this suspension was transferred into a 100 mL three-neck flask. The 10 mL aqueous solution dissolved with 0.40 g FeCl3·6H2O (1.48 mmol) and 0.15 g FeCl2·4H2O (0.75 mmol) was injected into the GO suspension. Afterward, 15 mL ammonia solution was added dropwise to precipitate the iron oxides under constant mechanical stirring for 1 h. The mixture was filtered and washed with 1:10 HCl solution several times, then rinsed with deionized water several times until the solution was neutral. Finally, the magnetic nanocomposite was dried at room temperature under vacuum (Wu et al., 2010).
2.4 Apparatus
X-ray diffraction (XRD) measurements were carried out on a MSAL-XD2 X-ray diffractometer, using a Cu Kα radiation (λ = 0.1541 nm) in the range of 5–80° (2θ) at 36 kV and 20 mA. The size and morphology of graphene oxide (GO) and magnetic graphene oxide nanocomposites (GO–Fe3O4) were observed by transmission electron microscopy (TEM) using H-7500 microscope (Hitachi, Japan). The Fourier transform infrared (FTIR) spectra of graphite powder (C), GO and GO–Fe3O4 were analyzed on a FTIR spectrometer (Thermo Nicolet 360-FTIR). The thermogravimetric analysis (TGA) was conducted on a thermal analyzer (SDT-Q600) under nitrogen atmosphere at a heating rate of 10 °C min−1. The magnetic property was analyzed using a vibrating sample magnetometer (Lake Shore 7410 VSM) at room temperature. The UV-2550 UV–visible spectrophotometer (SHIMADZU, Japan) was used to record the absorption spectrum of samples and detect the concentration of Chrysoidine Y aqueous solution. The specific surface areas of samples were measured by N2 adsorption-desorption isotherms at liquid nitrogen temperature using a Micromeritics Gemini V instrument.
2.5 Adsorption and desorption experiment
The removal of organic dye from aqueous solutions by GO–Fe3O4 was carried out using the following experimental procedures: 5 mg GO–Fe3O4 was added into 5 mL solutions with CY concentrations in the range of 100–1000 mg L−1. After reaching the equilibrium, GO–Fe3O4 was removed from the solution by magnetic separation using permanent magnet and the final concentration of dye in the solution was measured with a UV–vis spectrophotometer at 455 nm. The removal percentage (%) and the removed quantity qe (mg L−1) of dye by GO–Fe3O4 were calculated from the concentration difference between the initial concentration (C0) and the final one (Ce): where C0 (mg L−1) represented the initial dye concentration, Ce (mg L−1) was the final concentration of dye in the solution, V (L) was the volume of solution, and m (g) was the weight of GO–Fe3O4.
Desorption of CY was performed by mixing 5 mg of CY-loaded GO–Fe3O4 into 10 mL of HCl solution (0.1 mol L−1), and sonicating 1 min. Then, the GO–Fe3O4 was separated from the solution by a permanent magnet, washed with distilled water several times, and dried in vacuum at 45 °C for next adsorption-desorption.
3 Results and discussion
3.1 Characterization studies
3.1.1 Morphology of GO and GO–Fe3O4
To investigate the morphology, TEM images of GO and GO–Fe3O4 were taken. The typical morphology of graphene oxide is shown in Fig. 2. As can be seen, the sheet-like, corrugated morphology exists, indicating the characteristics of single-layer GO sheets. There are small magnetite nanoparticles with an average size of 10 nm, uniformly decorate the surface of GO sheets. These results prove effectively that Fe3O4 nanoparticles are successfully modified on the surface of GO sheets.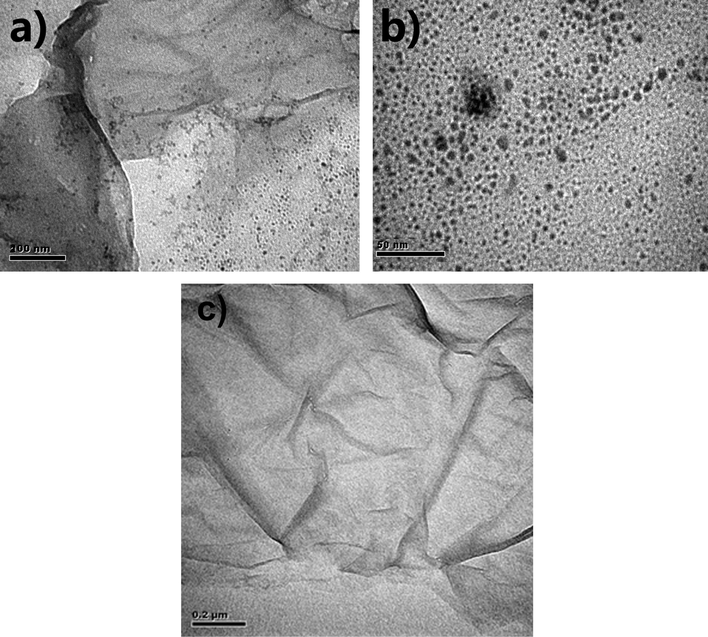
TEM images of GO–Fe3O4 (the resolution (a, c) ×200 nm, (b) ×50 nm) and GO (c).
3.1.2 Crystal structure of GO and GO–Fe3O4
XRD measurement was employed to investigate the phase and crystalline structure of the synthesized samples. The XRD patterns of graphite powder (C), GO and GO–Fe3O4 are shown in Fig. 3. It is observed that the XRD pattern of graphite powder shows the peaks at 2θ values of 26° (0 0 2) and 54° (0 0 4), while that of GO has peaks at 2θ values of 11° (0 0 1) and 42° (1 0 0). The XRD pattern of GO–Fe3O4 displays six characteristic peaks of Fe3O4 at about 2θ = 30.1°, 35.5°, 43.1°, 53.4°, 57.0° and 62.6°, corresponding to magnetite’s indices (2 2 0), (3 1 1), (4 0 0), (4 2 2), (5 1 1) and (4 4 0) respectively. These results suggest that graphite powder is successfully oxidized to GO, and Fe3O4 nanoparticles are successfully attached to the surface of GO sheets. Compared with GO, the peak intensity of GO–Fe3O4 at 2θ = 11° is obviously reduced, and the peak at 2θ = 42° totally disappears. It indicates that GO–Fe3O4 has been exfoliated largely, and more disordered stacking and less agglomerated graphene sheets consist in the nanocomposite (Wu et al., 2010).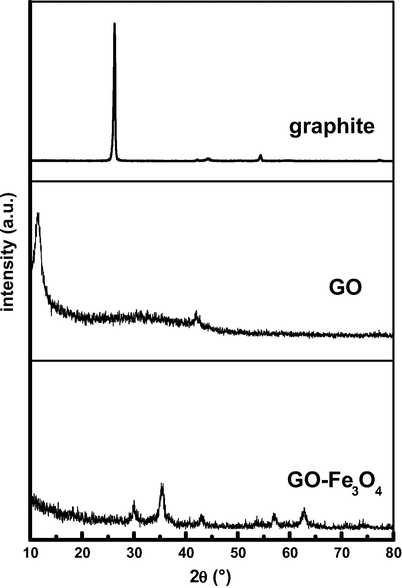
X-ray diffraction patterns of graphite powder (C), graphene oxide (GO) and magnetic graphene oxide nanocomposite (GO–Fe3O4).
3.1.3 Surface functional group of GO and GO–Fe3O4
To confirm the attachment of Fe3O4 nanoparticles on the GO nanosheet surface, FTIR spectra of GO and GO–Fe3O4 were examined and the results are shown in Fig. 4. The absorption peaks at around 1714 cm−1, 1616 cm−1, 1365 cm−1, 1045 cm−1, which are attributed to the stretching vibration of C⚌O, stretching C⚌C, bending vibration of C—OH, and stretching vibration of C—O, respectively, indicate that the surface of GO possessed some oxygen-containing functional groups (Saleh, 2011; Saleh et al., 2011), and the characteristic peak presented at 586 cm−1 confirms the Fe—O vibration. Several characteristic peaks of GO and Fe3O4 can be observed, confirming the successful oxidation of graphite and Fe3O4 nanoparticles being successfully decorated on GO sheets, which is in accord with the results of XRD and TEM. It has been reported that the intensities of all the FTIR peaks of GO correlated to the oxygen containing groups decreased dramatically when GO was reduced (Dutta et al., 2013). Being similar with this previous results, the peak of GO at 1714 cm−1 decreases when GO is decorated with Fe3O4 nanoparticles in this study, which demonstrates that the GO is reduced partially by the adsorption of Fe3O4 nanoparticles on it. Furthermore, owing to the sorbent’s abundant oxygen-containing groups such as epoxy, carboxyl and hydroxyl groups, the protonated Chrysoidine Y molecules could be adsorbed onto GO–Fe3O4 through the anionic-cationic interaction.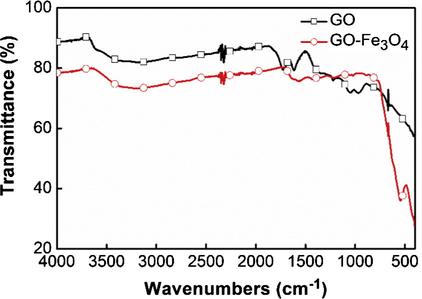
FTIR spectra of GO and GO–Fe3O4.
3.1.4 Thermo-gravimetric analysis results
The content of oxygen-containing groups on the surface of GO and GO–Fe3O4, which determined the adsorption capacity of GO–Fe3O4, could be determined with the TGA technique via oxidative decomposition which was carried out in nitrogen atmosphere from room temperature to 800 °C at a rate of 10 °C min−1. Fig. 5 shows the representative TGA curves of GO and GO–Fe3O4. As shown in Fig. 5, there are three weight loss processes. Firstly, a slight weight loss that occurred below 100 °C can be ascribed to the evaporation of adsorbed water molecules. Secondly, the marked weight loss occurs from 100 to 250 °C, which can be assigned to the removal of labile oxygen-containing functional groups such as epoxy, carboxyl and hydroxyl vapors from the sorbent. Finally, a slight weight loss appeared from 250 to 800 °C is caused by the decomposition of the carbon skeleton (Wang et al., 2010). Moreover, comparing the two curves, the weight losses of GO and GO–Fe3O4 at 100–250 °C are about 36.72% and 27.04%, respectively. These results indicate that both GO and GO–Fe3O4 have abundant oxygen-containing groups on their surfaces, and Fe3O4 nanoparticles have replaced some oxygen-containing groups.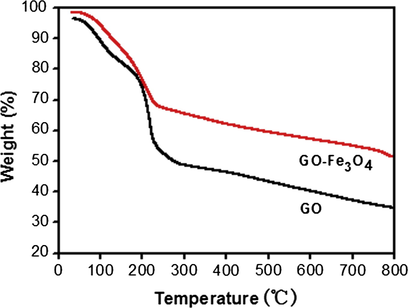
TGA diagram of GO and GO–Fe3O4.
3.1.5 Magnetic results
Fig. 6a shows a hysteresis loop measured at room temperature. As expected, the GO–Fe3O4 exhibits no remanence or coercivity at room temperature, revealing its superparamagnetic characteristics (Ge et al., 2008). Because of the microscale of Fe3O4 being modified on GO, the saturation magnetization of GO–Fe3O4 is 8 emu g−1, but it is sufficient for magnetic separation by an ordinary magnet. Fig. 6b shows photograph of GO–Fe3O4 adsorption and the separation under an external magnetic field. The GO–Fe3O4 dispersed in aqueous solution can be easily collected by a handle magnet within 1–2 min and the aqueous solution becomes colorless, and GO–Fe3O4 can be readily re-dispersed with slight shake after removing the magnetic field. The results reveal the good magnetic separation characteristics of GO–Fe3O4, suggesting GO–Fe3O4 can be used as a magnetic adsorbent to remove some organic contaminants from aqueous solutions.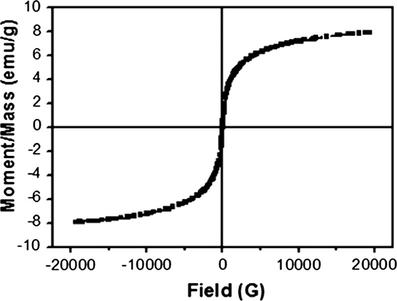
Hysteresis loop of GO–Fe3O4 nanocomposite at room temperature.
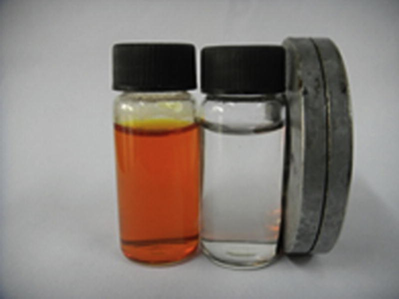
Photograph of CY solution (left), the solution after adsorption by GO–Fe3O4 and separation with a magnet (right).
3.1.6 Surface areas and absorption spectrum of GO and GO–Fe3O4
The specific surface areas of samples were measured by N2 adsorption-desorption isotherms. Both GO and GO–Fe3O4 show typical “type IV” N2 adsorption-desorption isotherms (Fig. 7), and the specific surface areas of GO and GO–Fe3O4 are 22.11 and 3.312 m2 g−1, respectively.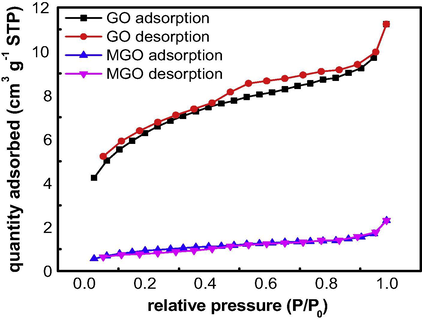
Nitrogen adsorption–desorption isotherms of GO and GO–Fe3O4.
Fig. 8 shows the absorption spectra of GO and GO–Fe3O4. GO displays a characteristic peak at 228 nm corresponding to π → π∗ transitions of aromatic C—C bonds, while for GO–Fe3O4, the absorption peak blueshifts to 224 nm, indicating that Fe3O4 particles are covalently attached onto GO surface (Chen et al., 2013).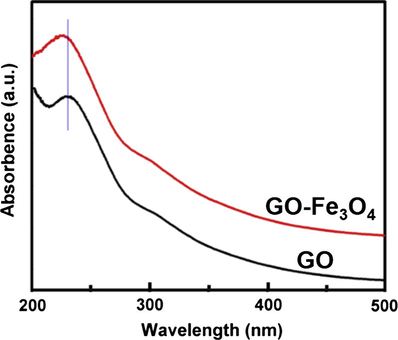
Absorption spectra of GO and GO–Fe3O4.
3.2 Adsorption of CY
3.2.1 Effect of initial pH on adsorption
Since acidity not only affects the solution chemistry of contaminants (i.e. hydrolysis, redox reaction, polymerization and coordination) but also has a strong influence on the ionic state of functional groups on the surface of adsorbent, and the initial pH of the solution is one of the most important parameters in the adsorption of environmental contaminants in aqueous solution. In this work, the adsorption quantity and removal percentage of CY by GO–Fe3O4 were detected with pH values ranging from 3 to 11. As presented in Fig. 9, the adsorption quantity of GO–Fe3O4 increases from 154.61 to 193.94 mg g−1 and removal percentage increases from 77.30% to 96.97% when the initial pH is varied from 3 to 6, and keeps constant over the pH range of 6–8. With the pH value increased from 8 to 11, the adsorption capacity and removal percentage decrease. Considering the pH values of water in nature, the experiments in this study were performed at pH 7.0.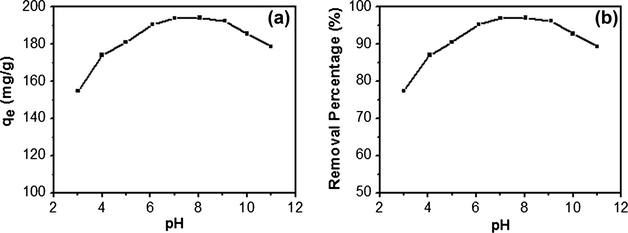
Effect of solution pH on the adsorption of CY by GO–Fe3O4 (initial CY concentration: 200 mg L−1; contact time: 60 min).
3.2.2 Adsorption kinetics
The adsorption kinetics information has a significant practical value. Rapid reaction time could facilitate smaller reactor volumes and ensure efficiency and economy. The adsorption kinetics was determined to understand the adsorption property of GO–Fe3O4. Kinetics experiments were carried out by adding 5.0 mg of new prepared GO–Fe3O4 to 5.0 mL aqueous solution containing 200, 300 and 400 mg L−1 CY at room temperature. The effect of adsorption time on the removal of CY is shown in Fig. 10. The result displays that a fast adsorption process occurs during the first few minutes and then reaches equilibrium. It is observed that the adsorption equilibrium time is about 30 min for all the concentrations, which attributes to the adequate free adsorptive sites and a high concentration gradient. This rapid adsorption indicates that the adsorption occurs mainly on the surface of adsorbent.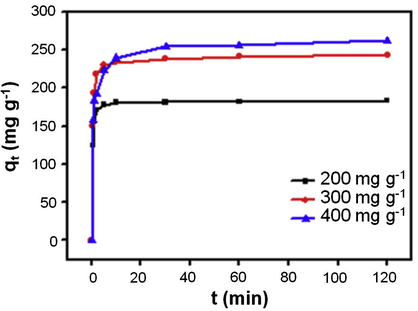
Effect of adsorption time on the adsorption capacity for CY onto GO–Fe3O4 nanocomposite at different initial CY concentration (200 mg L−1, 300 mg L−1 and 400 mg L−1) at room temperature; dosage of GO–Fe3O4: 5.0 mg.
In order to understand the adsorption kinetics, four different kinetic models were used to fit the experimental data. They are the Pseudo-first-order (Ho and McKay, 1998), Pseudo-second-order (Ho and McKay, 1999), Intraparticle diffusion and Elovich models (Chien and Clayton, 1980; Hao et al., 2010). The Pseudo-first-order model rate equation is expressed as follows:
where qe is the amount of dye adsorbed by adsorbent at equilibrium (mg g−1), qt is the amount of dye adsorbed at time t (mg g−1), and k1 is the rate constant (min−1). By plotting ln(qe − qt) versus t, the k1 and the calculated equilibrium sorption capacities qe,cal could be obtained from the slope and intercept of plots in Fig. 11(a), respectively.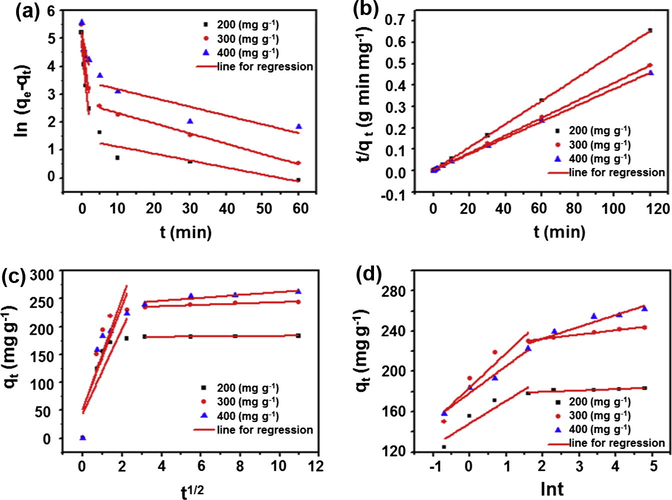
The fitting of different kinetic models for CY adsorption onto GO–Fe3O4 at different initial concentration (200 mg L−1, 300 mg L−1 and 400 mg L−1) at room temperature ((a) Pseudo-first-order, (b) Pseudo-second-order, (c) Intraparticle diffusion and (d) Elovich).
The Pseudo-second-order model is given by the following equation (Chen et al., 2010): where k2 is the Pseudo-second-order model rate constant (g mg−1 min−1) and qe is the sorption capacity at equilibrium. k2 and qe can be determined respectively from the intercept and slope of the plot which is obtained by plotting t/qt versus t (Fig. 11(b)).
The Intraparticle diffusion rate equation is provided as follows: where C is the constant related to the thickness of the boundary layer (mg g−1), and ki is the intraparticle diffusion rate constant (mg g−1 min−1/2). The adsorption process is controlled only by intraparticle diffusion when the plot of qt versus t1/2 gives a straight line. However, if the data exhibit multi-linear plots, two or more parameters influence the adsorption process. Based on the equation, the values of qt correlated linearly with values of t1/2 and the rate constant ki could be directly evaluated from the slope of the regression line (Fig. 11(c)) before reaching equilibrium. The beginning straight line represents macropore diffusion and the second one depicts micropore diffusion. Significantly, the C values obtained from the intercept in this work are not zero, indicating that intraparticle diffusion may not be the only controlling factor in determining the kinetics of the adsorption process (Hameed, 2008).
Elovich model rate equation is indicated as
It is used to describe chemical adsorption on highly heterogeneous adsorbents, where α (g g−1 min−2) and β (g mg−1 min−1) are the equilibrium rate constants. These constants can be obtained from the slope and intercept of initial part of plot which is shown in Fig. 11(d) before reaching equilibrium.
From the parameters listed in Table 1, it suggests that the adsorption kinetics follows the Pseudo-second-order kinetic model much better than the other models because of its higher correlation coefficients (R2), which also indicates that the adsorption is a fast process. Based on the Pseudo-second-order model (Vadivelan and Kumar, 2005), it can be concluded that the adsorption of CY onto GO–Fe3O4 is a chemical adsorption, and more than one step may be involved in the adsorption process.
Kinetic models and parameters
Concentration (mg L−1)
200
300
400
Pseudo-first-order
k1 (min−1)
1.3167
1.1
0.5946
qe,cal (mg g−1)
136.62
190.55
185.38
R2
0.9084
0.9093
0.5672
Pseudo-second-order
k2 (g mg−1 min−1)
0.0326
0.0134
0.0058
qe (mg g−1)
183.15
243.31
262.47
R2
0.9999
0.9999
0.9998
Intraparticle diffusion
ki (mg g−1 min−1/2)
75.88
99.39
92.33
C (mg g−1)
44.75
51.97
52.71
R2
0.6507
0.7011
0.6831
Elovich
α (g g−1 min−2)
16.923
7.668
21.689
β (g mg−1 min−1)
0.045
0.029
0.037
R2
0.8108
0.8462
0.9661
3.2.3 Adsorption isotherms
To further understand the adsorption mechanism and quantitatively describe adsorption capacities, the adsorption data were analyzed by the Langmuir and Freundlich isotherm models (Allen et al., 2004).
The Langmuir isotherm assumes the monolayer coverage of adsorbate over a homogeneous adsorbent surface. It has found successful application in many monolayer adsorption processes. This isotherm is depicted by the following equation:
where qe and Ce are the adsorption quantity (mg g−1) and concentration of the adsorbate at equilibrium (mg L−1), while qm and KL represent adsorption capacity of adsorbent (mg g−1) and the Langmuir adsorption equilibrium constant (L mg−1). The results are shown in Table 2, and the adsorption capacities (qm) of GO–Fe3O4 at 20 °C and 50 °C are 344.83 and 285.71 mg g−1, respectively. Compared with some previous adsorbents (Table 3), the adsorption capacity of GO–Fe3O4 is much higher, indicating that GO–Fe3O4 is an ideal adsorbent for the removal of CY from aqueous solution. Moreover, it is noticed that the adsorption capacity decreases when the temperature increases from 20 °C to 50 °C, suggesting that this adsorption is exothermic.
Isotherms
Parameters
Temperature
20 °C
50 °C
Langmuir
qm (mg g−1)
344.83
285.71
KL (L mg−1)
0.040
0.022
RL range
0.024–0.20
0.043–0.31
R2
0.9971
0.9959
Freundlich
KF (mg g−1)
93.9347
71.3003
n
4.8685
4.7939
R2
0.9662
0.9939
Adsorbents
Adsorption capacity (mg g−1)
Contact time (min)
Ref.
Bottom ash
18.08
180
Mittal et al. (2010)
De-oiled soy
8.33
180
Mittal et al. (2010)
FC
57.3
180
Nurchi et al. (2014)
GC
44.6
180
Nurchi et al. (2014)
Beads
61.5
180
Nurchi et al. (2014)
GO
680.3
30
This work
Fe3O4
63.94
30
This work
GO–Fe3O4
359.71
30
This work
The type of Langmuir isotherm can be used to predict whether the adsorption is favorable or unfavorable in terms of either the equilibrium parameter or a dimensionless constant separation factor RL, which is defined by the following equation: Here Co (mg L−1) is the initial concentration of adsorbate. The RL indicates the type of isotherm to be irreversible (RL = 0), favorable (0 < RL < 1), linear (RL = 1) or unfavorable (RL > 1). The RL values in this work are in the range of 0.024–0.31, which indicates a favorable adsorption between CY and GO–Fe3O4.
The Freundlich model is applied to monolayer adsorption but not a saturation-type isotherm. It is an empirical equation assuming that the adsorption process takes place on heterogeneous surfaces. The Freundlich adsorption equation is given as follows (Luo and Zhang, 2009): where KF (mg g−1) is the Freundlich constant indicating adsorption capacity, and n is an empirical parameter related to the intensity of adsorption. The value of n varies with the heterogeneity of the adsorbent and for favorable adsorption process the value of n should lie in the range of 1–10. It is illustrated that the value of n in the range 2–10 represents good, 1–2 moderately difficult, and less than 1 poor adsorption (Hao et al., 2010). From Table 2, the values of n at 20 and 50 °C are 4.8685 and 4.7939, showing a good adsorption. Moreover, the R2 values at 20 °C for the Langmuir and Freundlich models in Table 2 are 0.9971 and 0.9662, which demonstrates that the Langmuir model fits the adsorption data better than the Freundlich one, and states that the adsorption of CY onto GO–Fe3O4 may be a monolayer coverage process.
3.2.4 Thermodynamic parameters
Considering the practical application, thermodynamic parameters should be detected in order to determine which process will take place spontaneously. Thermodynamic parameters including Gibbs free energy (△G0), enthalpy change (△H0) and change in entropy (△S0) are obtained according to the following formulas:
Here R is the gas constant, T is the absolute temperature, and KL (qe/Ce) is Langmuir constant at various temperatures when the concentration terms are expressed in L/mol. The values of △H0 and △S0 were calculated from the intercept and slop of the plot of △G0 vs. T. All these thermodynamic parameters are listed in Table 4.
T (K)
ΔG0 (kJ/mol)
ΔH0 (kJ/mol)
ΔS0 (J/mol K)
293
−2.399
−8.192
−19.77
313
−2.004
323
−1.806
The negative values of △G0 at different temperatures indicate spontaneity and feasibility of the adsorption process. Moreover, the values of △G0 in Table 4 are less than 10 kJ/mol, which suggest that the adsorption process is physisorption (Li et al., 2014). From the minus value of △H0, it further reveals that the adsorption reaction is exothermic and the adsorption process is energetically stable, which is also supported by the decrease in the mass of adsorbed CY with the increase in temperature. The negative value of △S0 confirms the decreasing randomness at the solid-solution interface during the adsorption of CY onto GO–Fe3O4. These results are in accordance with these previous results (Dong et al., 2014; Li et al., 2014; Shi et al., 2014).
3.3 Adsorption mechanism
Based on the experimental results of initial pH on adsorption, adsorption mechanism can be analyzed. At pH lower than 5.4, the positively charged (protonated) species (CYH+) is the prevalent form of CY (Nurchi et al., 2014), while the carboxyl groups on the GO sheets are prone to be protonated. Therefore, the adsorption efficiency for cationic dye CYH+ is quite low in acidic media. With pH changes from 6 to 3, the removal percentage decreases due to more and more protonated carboxyl groups on the GO–Fe3O4. At higher pH values (8–11), there are plenty of OH−1 ions in the aqueous solutions, and the amino groups of CY are prone to combine with OH−1, leading to a decreased amount of CY adsorbed onto GO–Fe3O4. These results indicate the anion-cation interaction between GO–Fe3O4 and the dye molecules.
At pH varies from 6 to 8, the neutral species of CY (Nurchi et al., 2014) is predominant. Thus, the highest removal capacity of GO–Fe3O4 in the pH range of 6–8 may come from π–π stacking interaction between benzene rings of CY and large delocalized π-electron system of GO in GO–Fe3O4 structure (Chen et al., 2013). Furthermore, the comparison of adsorption capacity among Fe3O4, GO and GO–Fe3O4 in Table 3 also implies that GO should be contributed to the high capacity of GO–Fe3O4.
From the above analysis, the adsorption between CY and GO–Fe3O4 include anion-cation interaction and π–π stacking interaction. This is in accordance with thermodynamics study which suggests that the adsorption process is physisorption.
3.4 Influence of real water matrix
With a view to evaluate the effects of matrix on removal efficiency, the samples of polluted river water spiked with three different concentrations of CY were used. As listed in Table 5, the results reveal that the removal efficiency of CY is still kept at 95.98% in a real water sample when the concentration of dye is 100 mg L−1. There is no significant influence of water matrix on the removal of CY. These results indicate that GO–Fe3O4 has a great potential in practical application in the removal of CY from wastewater.
Matrix
pH
COD (mg L−1)
Fe (ug L−1)
Ca (mg L−1)
Mg (mg L−1)
50a
100a
200a
De-ionized water
6.8
0
0
0
0
100b
97.9b
91.6b
River
6.1
30
50.2
88.1
10.9
100b
96.0b
90.9b
3.5 Reusability of GO–Fe3O4 for CY removal
Taking into account the practical application, the adsorption–desorption cycle was repeated 5 times. In the analysis of the influence of pH on the removal, it was expected that acid would be an effective agent for desorption. The experiment results indicate that CY could be desorbed completely by 1 min sonication in the presence of 0.1 mol L−1 HCl.
As shown in Fig. 12, although the adsorption capacity of GO–Fe3O4 decreases a little for each successive run, the removal efficiency of GO–Fe3O4 still remains at 86.6% after 5 adsorption–desorption cycles. Since 0.1 mol L−1 HCl solution is used as the desorbing agent and the adsorbent is dried in an oven during regeneration, each adsorption-desorption process must undergo an acid-treated and heat-treated process. Thus, the reusability of GO–Fe3O4 as shown in Fig. 12 also indicates its good stability.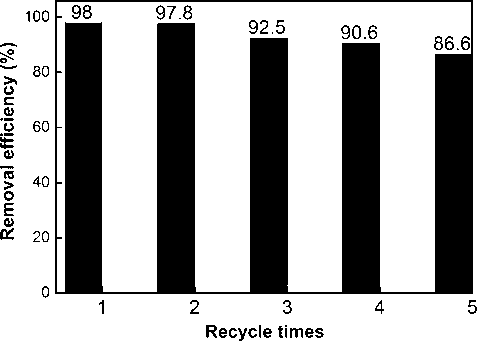
Reusability study of GO–Fe3O4.
4 Conclusion
GO–Fe3O4 was synthesized by a simple and low-cost method. XRD, TEM, FTIR, TGA and VSM were employed to characterize its morphology, structure and magnetic property and so on. The synthesized GO–Fe3O4 was used as an adsorbent to remove Chrysoidine Y from an aqueous solution. The adsorption was strongly dependent on pH, was very rapid and could reach adsorption equilibrium within 30 min. The results showed that the adsorption kinetics and isotherm obeyed the Pseudo-second-order and Langmuir isotherm models, respectively. The adsorption capacity was 344.83 mg g−1 at room temperature, and π–π stacking interaction was attributed to this high adsorption capacity. GO–Fe3O4 could easily be separated from an aqueous solution with magnetic separation in a short time. There was no significant influence of water matrix on the removal of cationic dye Chrysoidine Y. These results indicate that the GO–Fe3O4 can be used as a suitable and efficient adsorbent in the removal of Chrysoidine Y from wastewater.
Acknowledgment
This work was supported by the National Natural Science Foundation of China (21072221).
References
- Synthesis and characterization of Mg–Fe layer double hydroxides and its application on adsorption of Orange G from aqueous solution. Chem. Eng. J.. 2011;169(1–3):231-238.
- [Google Scholar]
- Adsorption isotherm models for basic dye adsorption by peat in single and binary component systems. J. Colloid Interface Sci.. 2004;280(2):322-333.
- [Google Scholar]
- Water purification using magnetic assistance. A review. J. Hazard. Mater.. 2010;180(1–3):38-49.
- [Google Scholar]
- Self-assembled free-standing graphite oxide membrane. Adv. Mater.. 2009;21(29):3007-3011.
- [Google Scholar]
- Magnetic graphene oxides as highly effective adsorbents for rapid removal of a cationic dye rhodamine B from aqueous solutions. RSC Adv.. 2013;3:7254-7258.
- [Google Scholar]
- Equilibrium and kinetic studies of methyl orange and methyl violet adsorption on activated carbon derived from Phragmites australis. Desalination. 2010;252(1–3):149-156.
- [Google Scholar]
- Application of Elovich equation to the kinetics of phosphate release and sorption in soils. Soil Sci. Soc. Am. J.. 1980;44(2):265-268.
- [Google Scholar]
- Recent developments in polysaccharide-based materials used as adsorbents in wastewater treatment. Prog. Polym. Sci.. 2005;30(1):38-70.
- [Google Scholar]
- Non-conventional low-cost adsorbents for dye removal: a review. Bioresource Technol.. 2006;97(9):1061-1085.
- [Google Scholar]
- Bio-inspired surface-functionalization of graphene oxide for the adsorption of organic dyes and heavy metal ions with a superhigh capacity. J. Mater. Chem. A. 2014;2:5034-5040.
- [Google Scholar]
- Benzoin derived reduced graphene oxide (rGO) and its nanocomposite: application in dye removal and peroxidase-like activity. RSC Adv.. 2013;3:21475-21483.
- [Google Scholar]
- Core-satellite nanocomposite catalysts protected by a porous silica shell: controllable reactivity, high stability, and magnetic recyclability. Angew. Chem. Int. Ed.. 2008;47(46):8924-8928.
- [Google Scholar]
- Equilibrium and kinetic studies of methyl violet sorption by agricultural waste. J. Hazard. Mater.. 2008;154(1–3):204-212.
- [Google Scholar]
- Effective removal of Cu (II) ions from aqueous solution by amino-functionalized magnetic nanoparticles. J. Hazard. Mater.. 2010;184(1–3):392-399.
- [Google Scholar]
- The attachment of Fe3O4 nanoparticles to graphene oxide by covalent bonding. Carbon. 2010;48:3139-3144.
- [Google Scholar]
- Pseudo-second order model for sorption processes. Process Biochem.. 1999;34(5):451-465.
- [Google Scholar]
- TiO2-assisted photocatalytic degradation of azo dyes in aqueous solution: kinetic and mechanistic investigations – a review. Appl. Catal. B – Environ.. 2004;49(1):1-14.
- [Google Scholar]
- Biological treatment of wastewaters from a dye manufacturing company using a trickling filter. J. Hazard. Mater.. 2006;136(1):95-102.
- [Google Scholar]
- Submerged microfiltration membrane coupled with alum coagulation/powdered activated carbon adsorption for complete decolorization of reactive dyes. Water Res.. 2006;3:435-444.
- [Google Scholar]
- Mechanical and dye adsorption properties of graphene oxide/chitosan composite fibers prepared by wet spinning. Carbohydr. Polym.. 2014;102:755-761.
- [Google Scholar]
- Removal of anionic reactive dyes from water using anion exchange membranes as adsorbers. Water Res.. 2007;41(7):1491-1500.
- [Google Scholar]
- Three-dimensional graphene oxide nanostructure for fast and efficient water-soluble dye removal. ACS Appl. Mater. Inter.. 2012;4(2):922-927.
- [Google Scholar]
- High effective adsorption of organic dyes on magnetic cellulose beads entrapping activated carbon. J. Hazard. Mater.. 2009;171(1–3):340-347.
- [Google Scholar]
- Adsorption behavior of EDTA-graphene oxide for Pb (II) removal. ACS Appl. Mater. Inter.. 2012;4(3):1186-1193.
- [Google Scholar]
- Graphene oxide-magnetite nanocomposite as an efficient and magnetically separable adsorbent for methylene blue removal from aqueous solution. Turk. J. Chem.. 2014;38:775-782.
- [Google Scholar]
- Removal and recovery of Chrysoidine Y from aqueous solutions by waste materials. J. Colloid Interface Sci.. 2010;344(2):497-507.
- [Google Scholar]
- Sorption of chrysoidine by row cork and cork entrapped in calcium alginate beads. Arab. J. Chem.. 2014;7(1):133-138.
- [Google Scholar]
- Effect of storage conditions on the flocculation and cell wall characteristics of an ale brewing yeast strain. J. Am. Soc. Brew. Chem.. 2001;59(1):32-38.
- [Google Scholar]
- The influence of treatment temperature on the acidity of MWCNT oxidized by HNO3 or a mixture of HNO3/H2SO4. Appl. Surf. Sci.. 2011;257(17):7746-7751.
- [Google Scholar]
- Synthesis of MWCNT/MnO2 and their application for simultaneous oxidation of arsenite and sorption of arsenate. Appl. Catal. B – Environ.. 2011;106(1–2):46-53.
- [Google Scholar]
- Materials science carbon sheets an atom thick give rise to graphene dreams. Science. 2009;324(5929):875-877.
- [Google Scholar]
- Methylene blue adsorption from aqueous solution by magnetic cellulose/graphene oxide composite: equilibrium, kinetics, and thermodynamics. Ind. Eng. Chem. Res.. 2014;53:1108-1118.
- [Google Scholar]
- Equilibrium, kinetics, mechanism, and process design for the sorption of methylene blue onto rice husk. J. Colloid Interface Sci.. 2005;286(1):90-100.
- [Google Scholar]
- Preparation of a graphene-based magnetic nanocomposite for the removal of an organic dye from aqueous solution. Chem. Eng. J.. 2011;173:92-97.
- [Google Scholar]
- Amino-functionalized Fe3O4@SiO2 core-shell magnetic nanomaterial as a novel adsorbent for aqueous heavy metals removal. J. Colloid Interface Sci.. 2010;349(1):293-299.
- [Google Scholar]
- Water-dispersible magnetite-graphene-LDH composites for efficient arsenate removal. J. Mater. Chem.. 2011;21(43):17353-17359.
- [Google Scholar]
- Graphene anchored with Co3O4 nanoparticles as anode of lithium ion batteries with enhanced reversible capacity and cyclic performance. ACS Nano. 2010;4(6):3187-3194.
- [Google Scholar]
- A facile chemical method to produce superparamagnetic graphene oxide–Fe3O4 hybrid composite and its application in the removal of dyes from aqueous solution. J. Mater. Chem.. 2012;22:1033-1039.
- [Google Scholar]
- Superparamagnetic graphene oxide–Fe3O4 nanoparticles hybrid for controlled targeted drug carriers. J. Mater. Chem. 2009;19:2710-2714.
- [Google Scholar]
- A double layered photoanode made of highly crystalline TiO2 nanooctahedra and agglutinated mesoporous TiO2 microspheres for high efficiency dye sensitized solar cells. Energy Environ. Sci.. 2011;4(6):2168-2176.
- [Google Scholar]
- Preparation of Fe3O4-embedded graphene oxide for removal of methylene blue. Arab. J. Sci. Eng.. 2014;39:6679-6685.
- [Google Scholar]


