Translate this page into:
Comparative chemical diversity and antioxidant activities of three species of Akebia herbal medicines
⁎Corresponding authors. Guoyl02@ccucm.edu.cn (Yunlong Guo), gjy0431@126.com (Jiyu Gong)
-
Received: ,
Accepted: ,
This article was originally published by Elsevier and was migrated to Scientific Scholar after the change of Publisher.
Abstract
Akebia stem has long been used extensively as a rare Chinese herbal medicine. The three most significant Akebia medicinal species are Akebia quinata (Thunb.) Decne. (A. quinata), Akebia trifoliata (Thunb.) Koidz. (A. trifoliata), and Akebia trifoliata (Thunb.) Koidz. var. Australis (Diels) Rehd. (A. trifoliata. var). They have significant therapeutic effects and are widely used in the pharmaceutical and cosmetics industries. Only a few studies compared their chemical differences and antioxidant activities. To better demonstrate each species' characteristics and antioxidant properties, the ultra-performance liquid chromatography coupled with quadrupole Orbitrap mass spectrometry (UPLC-Q-Orbitrap/MS)-based metabolomics was applied to investigate the chemome diversity of three Akebia species. Their antioxidant activities were evaluated by DPPH and ABTS assays. In total, 65 different metabolites were identified, including 5 phenolic acids, 2 phenylpropanoids, 4 lignan glycosides, and 54 triterpenoid saponins. The different aglycone types of triterpenoid saponins were found to be the component differences between the three Akebia species. The chemical composition of A. trifoliata and A. trifoliata. var is similar. The 2-(3,4-dihydroxyphenyl)-ethyl-O-β-d-glucopyranoside has been found only in A. quinata. In contrast, the triterpenoid saponins akemisaponin B, akemisaponin D, oleanolic-acid-3-O-arabinopyranosyl-28-O-glucopyranosyl-glucopyranosyl-rhamnopyranosyl-arabinopyranosyl, akemisaponin C and saponin Pj1 have been found A. trifoliata and A. trifoliata. var. As a result, these six compounds can be considered marker compounds that distinguish three Akebia species. The antioxidant activities results indicated that the antioxidants of three Akebia species were the same in different antioxidative test systems. A. trifoliata (IC50: 2.28–6.97 mg·mL−1) and A. trifoliata. var (IC50: 2.09–6.87 mg·mL−1) showed 2–3 times higher antioxidant activity than A. quinata (IC50: 5.56–11.21 mg·mL−1). This study reveals the antioxidant activity differences of three Akebia species, laying a foundation for further development and utilization. This type of study can lead to the identification of a compound that, with further work and more extensive studies, has the potential to be used as a biomarker, in this case to distinguish different medicinal species.
Keywords
Metabolomics
UPLC-Q-Orbitrap/MS
Akebia species
Chemical composition
Antioxidant activity
1 Introduction
The Lardizabalaceae family includes 9 genera, Akebia, Archakebia, Boquila, Decaisnea, Holboellia, Lardizabala, Sargentodoxa, Sinofranchetia, and Stauntonia, representing 35 plant species (The Plant List, 2020). Akebia is the most populous genus of the Lardizabalaceae family. They are found in Asia, specifically in China, Japan, and Korea (Maciąg et al., 2021). Akebia quinata (Thunb.) Decne. (A. quinata), Akebia trifoliata (Thunb.) Koidz. (A. trifoliata) and Akebia trifoliata (Thunb.) Koidz. var. Australis (Diels) Rehd. (A. trifoliata. var), have been described as mutong in the pharmacopoeia of China and also named moku-tsu in the pharmacopoeia of Japan (Ma et al., 2019). Because of their medicinal and high nutritional values, they are the most economically important three Akebia species. They have long been used as a rare herbal medicine. Biological activity studies of the three Akebia species have confirmed diuretic, hepatoregenerative, neuroprotective, analgesic, anti-inflammatory, anti-obesity, antibacterial and anticancer (liver and stomach) activities (Jiang et al., 2020; Bian et al., 2021; Lee et al., 2017; Maciąg et al., 2021; Peng et al., 2020; Song et al., 2018; Sung et al., 2015). Furthermore, as natural plants, A. quinata and A. trifoliata extracts have been shown to have antioxidant activity and free radical scavenging capability (Jiang et al., 2021; Jung et al., 2004; Luo et al., 2021). The A. trifoliata and A. trifoliata. var is widely cultivated and considered a new medicinal and edible homologous resource type (Niu et al., 2021). The strong antioxidant activity makes Akebia stems widely used in cosmetics, health care products, and food. Studies have proven A. quinata as a crude drug material for treating obesity in traditional Korean medicine and also as an ingredient of a traditional Korean weight-loss tea used as a folk remedy (Du et al., 2012; Jeon et al., 2014; Lee et al., 2014; Maciąg et al., 2021; Shin et al., 2015). As a result, three Akebia species have recently received much attention. However, there have been few studies on the comparative antioxidant activities of the three Akebia species.
The content of bioactive principles is strongly related to the complex chemical composition in Traditional Chinese Medicine (TCM) varies with the species, geographic origin, environmental conditions, harvesting, and processing of the plant (Liu et al., 2018; Liu et al., 2020; Sun et al., 2020; Wang et al., 2020). At present, the chemical composition of Akebia has been studied through classical targeted analyses, especially with traditional Chinese medicine theory (Ling et al., 2015). Several studies showed that the activities of Akebia are mainly related to four classes of compounds: triterpenoid saponins, triterpenoids, phenolic acids, and phenylpropanoids, especially triterpenoid saponins (Chen et al., 2019; Gao and Wang, 2006; Iwanaga et al., 2012; Jin et al., 2014; Jin et al., 2014b; Lu et al., 2014; Wang et al., 2014; Xu et al., 2016; Yoshihiro et al., 2007). Previous research has shown that 38 triterpenoid saponins were separated from a 70 % ethanol extract of A. trifoliata. var stems and identified using spectroscopic analysis (Gao and Wang, 2006). 30 triterpenoid saponins, 10 triterpenoids, 7 phenylpropanoids, 4 phenolic acids, and 10 other compounds have been identified in the stem of A. quinata and A. trifoliata (Liu et al., 2020). Gao and colleagues showed that the biological activity of Akebia is related to the structure of triterpenoid saponins (Gao and Wang, 2006). Akebia contains a variety of triterpenoid saponins belonging to different aglycone types, including oleanolic acid, noroleanolic acid, hederagenin, norhederagenin, arjunolic acid, norajunolic acid, and gypsogenin. The oleanolic acid aglycone is a characteristic Akebia chemical constituent (Maciąg et al., 2021). In addition, the sugar chain constituents have been reported, mainly including glucopyranose, arabinopyranose, rhamnopyranosyl, and xylopyranosyl (Ma et al., 2019). As the differences in the chemical composition of Akebia are directly related to its quality and its correct clinical use, so it is necessary to establish a rapid and effective analytical method to ensure the effectiveness of Akebia. Several studies have performed qualitative and quantitative analyses of three Akebia species based on HPLC or LC-MS (Liu et al., 2020; Wei et al., 2015; Zhan et al., 2016; Zhang et al., 2021; Zhang et al., 2014). However, these studies generally only focus on a limited number of compounds. Few reports have focused on the systematic characterization of the differences in the chemical constituents between the three Akebia species.
One emerging analytical method of systematic characterization is untargeted metabolomics with unbiased detection and extensive coverage. This relatively recent discipline is becoming increasingly popular, particularly within areas of research such as disease diagnostics, toxicology, and environmental research, because of its holistic property conforming to the “Multi-component & Multi-target” feature of TCM (Danuta et al., 2018; He and Zhou, 2021; Zhou et al., 2021). It has also been used for TCM authentication studies, the easily confusing species, different geographic origins, developmental stages, and the discrimination of sulfur-fumigation and non-sulfur-fumigation TCM materials. For example, by untargeted metabolomics, Wang et al. facilitated a better understanding of flavonoid metabolites between Citrus reticulata and four other Citrus peels (Wang et al., 2019). Fu et al. analyzed the diversity among Echinacea species by non-target metabolomics (Fu et al., 2021). Li et al. investigated the metabolite differences of Lonicerae japonicae flos through a non-targeted metabolomics approach (Li et al., 2022). Following these examples, untargeted metabolomic studies provide information on thousands of compounds found in the samples, discovering compounds that show a significant trend across different sample groups. Following further research and larger studies, identifying just one of these compounds could serve as a marker to aid in distinguishing the three Akebia species.
This study aims to show how an untargeted metabolomics technique using UPLC-Q-Orbitrap/MS can be applied to a distinguishing study to reveal differences in the chemical composition of three Akebia species. This type of study can lead to the identification of a compound that has the potential to be used as a biomarker, in this case, to distinguish different medicinal species. Furthermore, the antioxidant activities assay provides evidence for Akebia's functional antioxidant, laying the groundwork for its further development and utilization.
2 Materials and methods
2.1 Reagents and materials
Formic acid in MS grade was acquired from Sigma-Aldrich (St. Louis, MO, USA). Chromatographic grade acetonitrile and methanol were obtained from Fisher Scientific (Pittsburgh, PA, USA). Distilled water was produced via a Millipore water purification system (Millipore, Billerica, MA, USA). All other chemicals were analytical grade. As standards, calceolarioside B (111910–201604) and chlorogenic acid (110753–202018) were purchased from NIFDC (National Institute of Food and Drug Control, Changchun, Jilin, China). DPPH (R27137) and ABTS (R24146) were obtained from Shanghai Yuanye Biotechnology Co. ltd. (Shanghai, China).
In total, 27 batches of Akebia herbal materials, including 9 batches Akebia quinata (Thunb.) Decne, 9 batches Akebia trifoliata (Thunb.) Koidz and 9 batches Akebia trifoliata (Thunb.) Koidz. var. Australis (Diels) Rehd were collected from the primary origin of Akebia in China and identified by Prof. Jiyu Gong of Changchun University of Chinese Medicine, School of Pharmaceutical Sciences. The information on samples is shown in Table S1.
2.2 Sample solution preparation
In total, 27 batches of Akebia samples solution were prepared. An aliquot of 0.5 g fine powder of each sample was properly weighed and ultrasonically extracted with 25 mL of 70 % (v/v) ethanol/water for 25 min at room temperature. The mixture was filtered using a 0.22 μm membrane filter. The filtrate was transferred into a sample vial for UPLC-Q-Orbitrap/MS analysis.
Besides, 27 batches of Akebia samples dry ointment extracts were prepared. First, Akebia stem (50 g) was ground into a fine powder, soaked in 1000 mL of 70 % ethanol, and extracted in a reflux condenser at 70 °C for 3 h. Next, the extract was filtered through a testing 150 μm sieve, evaporated on a rotary evaporator, concentrated by lyophilization, and then stored at −20 °C. Then, 1 g extract of each sample was weighed correctly and ultrasonically extracted with 20 mL of 70 % (v/v) ethanol/water for 20 min at room temperature. Then, the mixture was filtered and diluted according to DPPH and ABTS test systems.
2.3 UPLC-Q-Orbitrap/MS analysis
Chromatographic separation was performed on an Ultimate 3000 ultra-performance liquid chromatography system (Thermo, San Jose, CA, USA) coupled with the Supelco C18 column (3.0 × 50 mm, 2.7 μm; Sigma-Aldrich). The column was maintained at 30 °C. The mobile phases A and B were acetonitrile and water with 0.1 % formic acid, respectively. The separation of experimental samples was programmed with the following gradient elution: 95 % B (0–5 min), 95–60 % B (5–10 min), 60–35 % B (10–20 min), 35–5 % B (20–25 min), 5–95 % B (25–30 min), and maintained at 95 % for 5 min. The injection volume was 5 μL, and the flow rate was 0.4 mL/min.
Mass spectrometric detection was carried out on a Q-Orbitrap-MS/MS (Thermo, San Jose, CA, USA) equipped with an electrospray ionization source under the negative ion mode. The ion source parameters were set to 40 Arb for sheath gas flow, 10 Arb for aux gas flow, and 1 Arb for sweep gas flow. The S-Lens RF was 55 %. The capillary voltage was set to − 3.5 kV with a capillary temperature of 350 °C. Full MS data were acquired at the centroid mode from m/z 150 to 1500 Da with a resolution of 70,000 with the automatic gain control (AGC) target of 1 × 10⁶, and a maximum injection time (IT) of 100 ms. In addition, the tandem mass spectrum was obtained in Full-MS/ddMS2 mode using the following settings: 17,000 for resolution, 1 × 10⁵ for automatic gain control (AGC) for the target, 50 ms for maximum IT, 5 for Loop count, 5 for TopN, 4.0 m/z for Isolation window and 30, 40, 55 for stepped NCE.
2.4 Antioxidant activities
2.4.1 DPPH assay
All Akebia samples were tested for DPPH radical scavenging activity according to the manufacturer's protocol with minor modifications. In brief, an aliquot (20 μL) extract from each sample was added to 80 μL of 0.105 μM·mL−1 DPPH solution to initiate the reaction, and 70 % ethanol was used as the blank solution. After 30 min of incubation in the dark at room temperature, the absorbance was measured at 517 nm. Each measurement was performed in triplicate.
2.4.2 ABTS assay
The ABTS radical scavenging activity of each sample was determined using the manufacturer's protocol with slight modifications. First, the same volume of 7.4 mM ABTS solution and 2.60 mM K2S2O8 were mixed and kept at room temperature for 12 h under dark conditions to prepare the stock solution. Before use, the ABTS working solution was obtained by adding 70 % ethanol to the stock solution until the absorbance reached 0.70 at 734 nm. Then, 10 μL of extract of each sample solution was mixed with the 90 μL of ABTS working solution and was kept at ambient temperature for 10 min. Finally, the absorbance at 734 nm against the blank sample (70 % ethanol) was measured and recorded. All measurements were done in triplicate.
2.5 Data processing and multivariate statistical analysis
After data acquisition, the raw data of Akebia samples were processed by Sieve software (version 2.1, Thermo, San Jose, CA, USA) to perform the peak extraction, alignment, and normalization. The main parameters for the raw data preprocessing were as follows: retention time range (0–25 min), mass range (100–1500 Da), mass tolerance (5 mDa), intensity threshold (2000 counts), mass window (0.15 Da), and retention time window (0.10 min). Then a data set containing the sample code, peak retention time (RT)_m/z value, and peak intensity was constructed for the statistical analysis. Multivariate statistical analysis was performed using Simca 14.1 software (Umetrics, Malmö, Sweden) to find the marker compounds contributing to the difference among three Akebia species. The principal component analysis (PCA) model was established first to perform pattern recognition and obtain an overview of sample classification, followed by the partial least-squares discriminant analysis (PLS-DA) model to obtain the most significant separation among groups. A permutation test was performed to provide reference distributions of the R2 and Q2 values that could show the fitness of the established PLS-DA model. The variable importance for the projection (VIP) value was used to screen the marker compounds. Then the ANOVA was used to further assess the significant differences of these compounds among groups using SPSS 21.0 (Chicago, IL, USA). The compounds with VIP > 1 and P < 0.05 were considered significant and were selected as marker compounds. GraphPad Prism 8.0 software (GraphPad Prism Software, San Diego, CA) was used for IC50 analysis and mapping.
3 Results
3.1 Metabolomic profiles of three medicinal Akebia species based on UPLC-Q-Orbitrap/MS
The metabolites of three Akebia species were profiled with the UPLC-Q-Orbitrap/MS system. The typical total ion current chromatograms of the three Akebia species were analyzed in negative ion mode, as shown in Fig. 1. Several peak differences can be observed in the samples, indicating that the chemical composition significantly differs among the three Akebia species. An unsupervised PCA was conducted to obtain a clear overview of the different metabolic profiles among Akebia samples. The PCA score plot in Fig. 2A shows that the QC sample was tightly clustered in the center of all samples, reflecting the stability and reliability of the metabolomics analysis. The samples were separated into three groups in the PCA score plot, suggesting the chemical composition diversity in three Akebia species. To investigate the chemome diversity of three Akebia species, the supervised PLS-DA model produced analogous results to examine the metabolites with the most significant. As a result, complete separation among the A. quinata, A. trifoliata and A. trifoliata. var groups was accomplished in the score plot (Fig. 2B). Furthermore, R2X, R2Y, and Q2 were calculated as 0.956, 0.975, and 0.984 respectively. The permutation test (n = 200) was performed to further validate the constructed model, and the permutated R2 and Q2 observed in Fig. 2C were lower than the original values, which indicates that no overfitting was observed established model.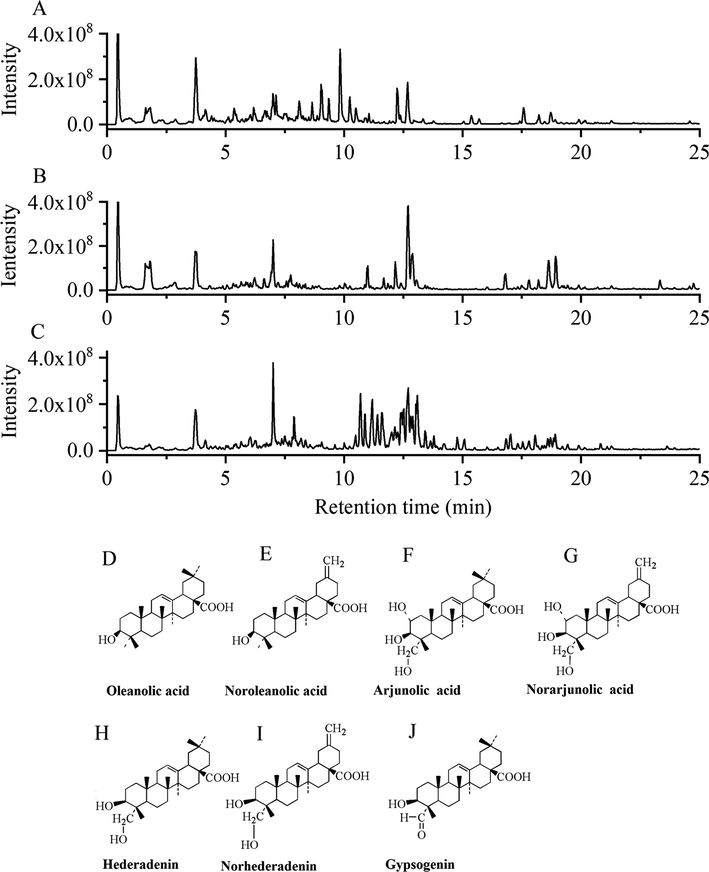
The representative base peak intensity (BPI) chromatograms and aglycones of triterpene saponins characteristic of three medicinal Akebia species. A: A. trifoliata. var, B: A. trifoliata, and C: A. quinata.
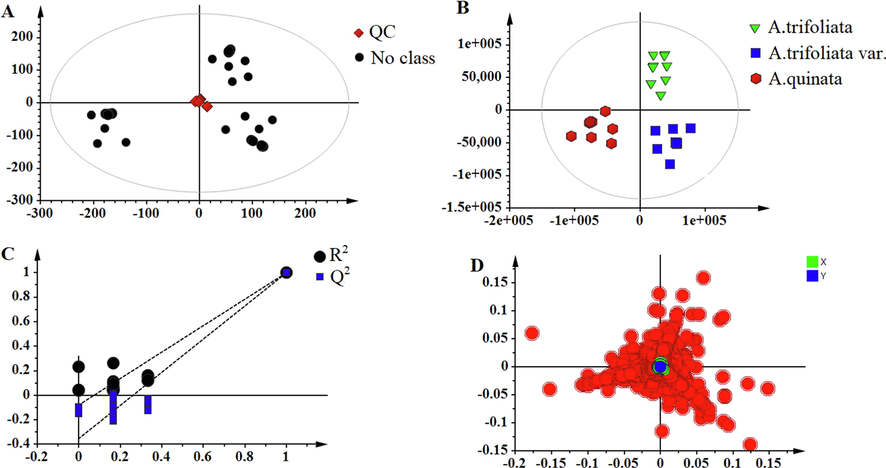
PCA sore plot (A) of all samples, and PLS-DA score plot (B) of three Akebia species and the corresponding permutation test (C) and loading plot (D).
3.2 Metabolomic profiles selection and identification
Next, to further evaluate metabolomic profiles in three Akebia species, the loading plot and VIP value were used to select the marker compounds. The features with a VIP value>1 were highlighted as marker candidates and marked in Fig. 2D. A total of 235 ions were found displaying VIP > 1. To screen the different major components, in the current work, the ANOVA was performed to evaluate the change significance of these features, and the compounds with the statistically significant difference (P < 0.05) were finally selected as marker compounds. A total of 65 different abundant metabolites, including 5 phenolic acids, 2 phenylpropanoids, 4 lignan glycosides, and 54 triterpenoid saponins, were identified in negative ion mode and were listed in Table 1. The compound annotation was conducted by searching PubMed and Chinese National Knowledge Infrastructure (CNKI) databases. We compared the MS and MS/MS information of detected compounds using the database, literature records, and standard references.
Compound
RT(min)
Identity
Formula
Detected m/z
Adducts
Mass Error(ppm)
MS/MS Fragment ions
Type
Ref
1
2.08
5-caffeoylquinic acid
C16H18O9
353.0875
[M−H]−
2.27
270.1496, 191.0557, 179.0344, 161.0238
Phenolic acid
(Liu et al., 2020)
2
3.76
3-caffeoylquinic acid
C16H18O9
353.0873
[M−H]−
1.70
278.0404, 191.0557, 173.0449, 161.0236
Phenolic acid
(Liu et al., 2020)
3
4.15
4-caffeoylquinic acid
C16H18O9
353.0874
[M−H]−
1.98
278.9987, 191.0557, 179.0346, 173.0452, 161.0233
Phenolic acid
(Liu et al., 2020)
4
4.28
syringin
C17H24O9
371.1336
[M−H]−
0.00
353.0781, 315.1113, 211.0453, 173.0449
Phenylpropanoid
(Liu et al., 2020)
5
5.10
akeqintoside B
C26H32O11
519.1859
[M−H]−
−0.39
475.1239, 438.8632, 415.1505, 373.1384, 341.0656
Lignan glycoside
(Iwanaga et al., 2012)
6
5.53
2-(3,4-dihydroxyphenyl)-ethyl-O-β-d-glucopyranoside
C14H20O8
315.1086
[M−H]−
3.81
258.0984, 247.3074, 195.0291, 179.0556
Lignan glycoside
(Maciąg et al., 2021; Yen et al., 2014)
7
6.26
quinatoside A
C34H52O7
571.3620
[M−H]−
−1.58
537.1602, 455.3164, 395.0985, 359.1502, 323.0773
Norhederadenin
(Gao and Wang, 2006)
8
7.01
calceolarioside B
C23H26O11
477.1391
[M−H]−
0.00
414.9501, 315.1091, 281.0674, 251.0554, 221.0458
Phenylpropanoid
(Maciąg et al., 2021; Yen et al., 2014)
9
7.37
1,3-Dicaffeoylquinic acid
C25H24O12
515.1180
[M−H]−
−0.78
477.1339, 353.0856, 335.0762, 315.1083, 281.0667, 225.0764
Phenolic acid
(Liu et al., 2020)
10
7.86
3,5-Dicaffeoylquinic acid
C25H24O12
515.1179
[M−H]−
−0.97
477.1379, 353.0883, 315.1089, 265.0729, 223.0603
Phenolic acid
(Liu et al., 2020)
11
7.87
aradecoside D
C59H96O27
1281.6073
[M + HCOO]−
−2.89
1249.5806, 941.4784, 897.4841, 765.4432, 669.2201, 589.3745, 455.3524
Oleanolic acid
(Gao and Wang, 2006)
12
8.63
akemisaponin B
C52H82O23
1119.5188
[M + HCOO]−
−2.59
1046.7434, 973.4631, 865.4536, 781.4393, 649.3872, 535.1987, 471.3122
Norarjunolic acid
(Iwanaga et al., 2012)
13
8.81
akeqintoside C
C25H30O13
537.1641
[M−H]−
7.07
485.2163, 351.1101, 273.5634, 207.0655, 175.0392
Lignan glycoside
(Gao and Wang, 2006)
14
9.27
dipsacoside B
C53H86O22
1119.5583
[M + HCOO]−
0.18
1073.5428, 945.5416, 749.4471, 683.2810, 637.4318, 471.3472
Hederadenin
(Jiang et al., 2008; Liu et al., 2018)
15
9.60
akeboside Stj
C65H106O30
1365.6607
[M−H]−
−5.71
1251.6073, 1087.5337, 957.5073, 781.4371, 649.3947, 569.3472, 455.3524
Oleanolic acid
(Gao and Wang, 2006)
16
9.96
akemisaponin C
C53H86O23
1135.5505
[M + HCOO]−
−2.20
997.4979, 913.4703, 701.3907, 601.1979, 487.3424, 471.3116, 469.1591
Arjunolic acid
(Iwanaga et al., 2012)
17
9.99
saponin PJ1
C53H86O23
1089.5479
[M−H]−
0.28
957.5103, 811.2541, 649.3956, 487.3425
Arjunolic acid
(Maciąg et al., 2021; Yen et al., 2014)
18
10.42
saponin F
C53H86O23
1089.5543
[M−H]−
7.62
1064.4519, 651.3111, 541.9780, 528.9768, 471.3471
Hederadenin
(Maciąg et al., 2021; Yen et al., 2014)
19
10.88
asiaticoside
C48H78O19
1003.5083
[M + HCOO]−
−2.49
927.4586, 765.4420, 651.3297, 585.3799, 487.3435
Arjunolic acid
(Gao and Wang, 2006)
20
11.42
akemisaponin D
C58H92O27
1265.5722
[M + HCOO]−
−5.93
1219.6104, 1103.5272, 941.4739, 893.4537, 749.4479, 603.3901, 455.3165
Norhederadenin
(Iwanaga et al., 2012)
21
11.75
Gypsogenin-3-O-β-d-xylopyranosyl-(1 → 2)-α-l-arabinopyranosyl-28-O-β-d-glucopyranosyl-(1 → 6)-β–d-glucopyranoside
C52H82O22
1057.5234
[M−H]−
1.89
1103.5329, 955.4643, 733.4183, 601.1994, 469.3289
Gypsogenin
(Ma et al., 2019)
22
11.88
saponin PJ3
C59H96O25
1203.6098
[M−H]−
−4.82
1057.5098, 939.4621, 881.4887, 733.4522, 587.3971, 469.1553, 455.3511
Oleanolic acid
(Maciąg et al., 2021; Yen et al., 2014)
23
12.59
Oleanolic
acid-3-O-arabinopyranosyl-28-O-glucopyranosyl-glucopyranosyl-rhamnopyranosyl-arabinopyranosylC58H94O25
1189.5972
[M−H]−
−2.44
1023.6034, 895.5052, 719.4357, 601.1978, 587.3971, 469.1593, 455.3534
Oleanolic acid
(Ma et al., 2019)
24
12.65
saponin H3
C65H106O31
1381.6559
[M−H]−
−5.43
1281.6471, 1103.5633, 911.4983, 749.4584, 651.3703, 603.4025, 471.3472
Hederadenin
(Maciąg et al., 2021; Yen et al., 2014)
25
12.75
arjunolic acid-3-O-arabinopyranosyl-28-O-glucopyranosyl-glucopyranosyl-rhamnopyranosyl-arabinopyranosyl
C58H93O27
1220.5737
[M−H]−
−6.80
1103.5208, 997.5363, 895.4691, 833.4669, 619.3912, 601.1978, 469.1594
Arjunolic acid
(Ma et al., 2019)
26
12.98
akeboside Sth
C59H96O26
1265.6248
[M + HCOO]−
6.95
1219.6103, 1103.5271, 749.4501, 603.3958, 471.3466
Hederadenin
(Gao and Wang, 2006)
27
13.39
akebiaoside K
C53H84O23
1087.5288
[M−H]−
−2.85
1041.4906, 925.4789, 865.4933, 763.4215, 601.1992, 485.3255, 469.1550
Noroleanolic acid
(Gao and Wang, 2006)
28
13.43
saponin G
C65H106O31
1381.6588
[M−H]−
−3.33
1219.5756, 1107.5917, 925.4725, 785.4073, 733.4513, 701.4271, 587.3948, 471.3475
Hederadenin
(Maciąg et al., 2021; Yen et al., 2014)
29
13.65
saponin PH
C47H74O19
987.5175
[M + HCOO]−
38.48
987.4832, 795.4154, 471.3122, 469.1589,323.0854
Norarjunolic acid
(Maciąg et al., 2021; Yen et al., 2014)
30
13.9
Arjunolic acid-3-O-arabinopyranosyl-rhamnopyranosyl-28-O-glucopyranosyl-glucopyranosyl
C53H86O23
1089.5487
[M−H]−
1.01
1135.5538, 765.4464, 619.3847, 471.3116, 469.1594
Arjunolic acid
(Ma et al., 2019)
31
14.76
hederagenin-3-O-arabinopyranosyl-rhamnopyranosyl-28-O-glucopyranosyl-rhamnopyranosyl
C53H86O21
1051.5184
[M−H]−
−5,710.61
1103.5289, 749.4449, 603.2031, 471.3472
Hederadenin
(Ma et al., 2019)
32
15.05
akemisaponin F
C52H80O23
1071.5221
[M−H]−
20.07
1117.5111, 601.1976, 469.2952
Noroleanolic acid
(Iwanaga et al., 2012; Jin et al., 2014)
33
15.36
30-norarjunolic acid
C29H44O5
471.3099
[M−H]−
−1.27
943.6324, 471.3122, 323.1008, 195.1037
Norarjunolic acid
(Gao and Wang, 2006)
34
15.51
akeqintoside A
C25H32O11
507.1860
[M−H]−
−0.20
471.3121, 313.0723, 293.2125, 275.1922
Lignan glycoside
(Iwanaga et al., 2012)
35
15.79
saponin PJ2
C53H86O22
1073.553
[M−H]−
0.28
1119.5632, 927.4979, 603.3961, 471.3475
Hederadenin
(Maciąg et al., 2021; Yen et al., 2014)
36
16.34
hederagenin-28-O-glucopyranosyl-glucopyranosyl-rhamnopyranosyl
C48H78O18
941.5077
[M−H]−
−2.87
471.3475, 323.1014
Hederadenin
(Ma et al., 2019)
37
16.44
hederagenin-3-O-β-d-xylopyranosyl-(1 → 2)-α-l-arabinopyranosyl-28-O-β-D-glucopyranoide
C46H74O17
897.4799
[M−H]−
−4.79
735.4333, 603.3907, 471.3467
Hederadenin
(Ma et al., 2019)
38
16.73
saponin E
C52H84O22
1053.5331
[M−H]−
−5,666.53
897.9884, 735.43405, 603.39156, 471.3472
Hederadenin
(Maciąg et al., 2021; Yen et al., 2014)
39
17.01
trifoside A
C46H72O18
911.4607
[M−H]−
−2.96
865.4600, 777.4048, 733.4250, 585.3850, 529.1929, 471.3470, 455.3164
Norhederadenin
(Gao and Wang, 2006)
40
17.50
saponin D
C47H76O18
927.4922
[M−H]−
−2.70
603.3914, 471.3475
Hederadenin
(Maciąg et al., 2021; Yen et al., 2014)
41
17.58
arjunolic acid
C30H48O5
487.3417
[M−H]−
−0.21
471.3116, 469.1594, 455.3165, 323.0864
Arjunolic acid
(Maciąg et al., 2021; Yen et al., 2014)
42
17.73
saponin PG
C46H74O16
881.4910
[M−H]−
1.93
749.4484, 603.3908, 471.3472
Hederadenin
(Maciąg et al., 2021; Yen et al., 2014)
43
17.89
hederagenin-28-O-glucopyranosyl-glucopyranosyl-rhamnopyranosyl-arabinopyranosyl
C53H86O22
1073.5488
[M−H]−
−3.63
1027.5428, 939.4994, 779.4211, 717.4209, 667.3887, 601.1998, 471.3479
Hederadenin
(Ma et al., 2019)
44
18.01
saponin PD
C41H66O12
795.4506
[M + HCOO]−
−2.39
779.4297, 749.4468, 677.4963, 603.3895, 471.3492
Hederadenin
(Maciąg et al., 2021; Yen et al., 2014)
45
18.05
saponin PE
C41H66O12
749.4466
[M−H]−
−0.53
749.4466, 587.3956, 455.3523
Oleanolic acid
(Maciąg et al., 2021; Yen et al., 2014)
46
18.36
akeboside Stc
C41H66O12
749.4397
[M−H]−
−9.74
651.4957, 595.7773, 471.3456
Hederadenin
(Gao and Wang, 2006)
47
18.41
quinatoside B
C40H62O13
749.4057
[M−H]−
−6.54
651.4952, 613,8746, 455.3165, 423.3266, 314.4899
Norhederadenin
(Gao and Wang, 2006)
48
18.42
gypsogenin-3-O-α-l-rhamnopyranosyl-(1 → 2)-α-l-arabinopyranoside
C41H64O12
747.4297
[M−H]−
−2.27
677.4975, 651.5189, 603.3768, 515.0312, 487.3383, 469.3289
Gypsogenin
(Ma et al., 2019)
49
18.50
akeboside Stb
C35H56O8
603.3845
[M−H]−
−7.62
527.2416, 471.3472, 441.2963
Hederadenin
(Gao and Wang, 2006)
50
18.52
saponin A
C35H56O8
603.3895
[M−H]−
0.66
1207.7914, 649.3957, 471.3473
Hederadenin
(Maciąg et al., 2021; Yen et al., 2014)
51
18.54
2α,23-dihydroxy-3β-sulfoxylean-12-en-28-oic acid-O-β-D-glucopyranosyl-(1 → 6)-β-d-glucopyranosyl
C36H58O10
649.3932
[M−H]−
−2.16
603.3878, 487.3427, 471.3116, 469.1594
Arjunolic acid
(Ma et al., 2019)
52
18.76
norhederagenin-3-O-arabinopyranosyl-rhamnopyranosyl-glucopyranosyl-28-oic acid
C47H76O16
895.4995
[M−H]−
−6.03
733.4113, 587.4077, 455.3154
Norhederadenin
(Ma et al., 2019)
53
18.85
trifoside C
C46H72O17
895.4661
[M−H]−
−2.68
733.4543, 651.5479, 587.3938, 501.3192, 455.3153
Norhederadenin
(Gao and Wang, 2006)
54
19.17
CP3
C46H74O15
865.4920
[M−H]−
−2.66
733.4533, 587.3971, 501.3192, 455.3522
Oleanolic acid
(Ma et al., 2019)
55
19.20
trifoside B
C45H70O16
865.4521
[M−H]−
−6.82
733.4504, 651.5241, 587.3935, 551.3763, 455.3135
Norhederadenin
(Gao and Wang, 2006)
56
19.34
oleanolic acid-3-O-arabinopyranosyl-glucopyranosyl-glucopyranosyl-28-oic acid
C47H76O17
911.4976
[M−H]−
−2.41
651.4787, 588.8561, 603.3897, 455.3537
Oleanolic acid
(Ma et al., 2019)
57
19.58
2α,3β-dihydroxy-23-oxo-olean-12-en-28-oic acid
C30H46O5
485.3252
[M−H]−
−1.85
455.3165, 414.9921, 339.2006
Noroleanolic acid
(Ma et al., 2019)
58
19.71
saponin C
C41H66O13
765.4414
[M−H]−
−0.65
651.4847, 603.3915, 471.3472
Hederadenin
(Maciąg et al., 2021)
59
19.85
gypsogenin- 3-O-β-D-xylopyranosyl-(1 → 2)-α-l-arabinopyranoside
C40H62O12
733.4461
[M−H]−
41.38
779.4216, 601.3729, 469.3246
Gypsogenin
(Ma et al., 2019)
60
19.91
saponin B
C40H64O12
733.4167
[M−H]−
1.36
651.5366, 545.2958, 504.3094, 471.3476
Hederadenin
(Maciąg et al., 2021; Yen et al., 2014)
61
21.07
hederagenin
C30H48O4
471.3452
[M−H]−
−3.39
471.3472, 425.3421, 217.1206, 162.8501
Hederadenin
(Maciąg et al., 2021)
62
22.42
quinatoside C
C40H64O11
719.4259
[M−H]−
−14.59
587.3971, 455.3167
Norhederadenin
(Gao and Wang, 2006)
63
24.62
quinatoside D
C39H60O11
703.4047
[M−H]−
−0.57
677.4915, 651.2538, 542.0229, 453.3168
Norhederadenin
(Gao and Wang, 2006)
64
22.67
gypsogenin
C30H46O4
469.3324
[M−H]−
2.56
439.1219, 409.2361, 339.1991, 313.0732, 279.2335
Gypsogenin
(Lee et al., 2017; Maciąg et al., 2021)
65
24.01
saponin PB
C41H66O11
733.4553
[M−H]−
4.36
587.3971, 455.3524
Oleanolic acid
(Maciąg et al., 2021; Yen et al., 2014)
The detailed annotation procedures were demonstrated by taking the ion of saponin PJ1 at RT 9.99 min_m/z 1089.5479 as an example. The tandem MS spectrum is shown in Fig. 3A. The ions at m/z 957.5103, 811.2541, 649.3956 and 487.3425 were generated by [M-Xyl-H]−, [M-Xyl-Rha-H]−, [M-Xyl-Rha-Glc-H]−, [M-Xyl-Rha-2(Glc)-H]−, respectively. According to the ion of m/z 487.3425 [M−H]− corresponding to arjunolic and comparing with the literature, this ion at RT 9.99 min_m/z 1089.5479 was collectively assigned to saponin PJ1.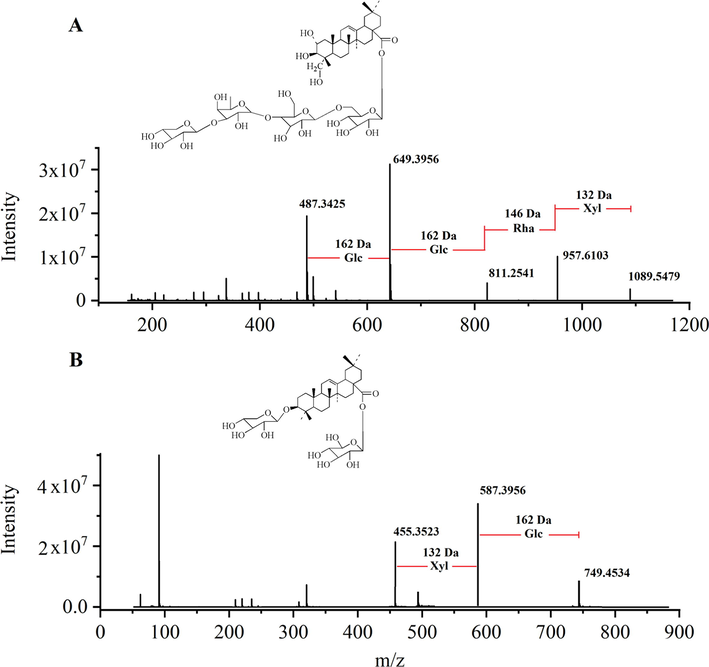
The fragmentation pathways of saponin PJ1 (A) and saponin PE (B) in negative ion mode.
To analyze, saponin PE was used as an example of bidesmosidic saponin. The precursor ion at RT 18.05 min_m/z 749.4534 [M−H]− was discovered, and the formula was calculated to be C41H66O12. The tandem MS spectrum was shown in Fig. 3B by the diagnostic ion at m/z 455.3523 [aglycone-H]−, saponin PE was attributed to the oleanolic type. The fragment ion at m/z 587.3956 [M−Glc−H]− was produced by the complete loss of 162 Da from the precursor ion. First, the signal was powered, which result indicated that the sugar chain of Glc was attached at C-28. Then, by a Xyl (132 Da) in turn, the fragment ions at m/z 455.3523 were produced, which indicated the branched sugar chain unit was attached at C-3. Compared with the literature, this ion at RT 18.05 min_m/z 749.4534 was assigned to saponin PE.
3.3 Characteristics of three Akebia species
A heat map based on the mean values of the 65 different abundant metabolites provided a comprehensive overview of the differences in the metabolite contents among three Akebia species, as shown in Fig. 4. Accordingly, significant differences in the contents of phenolic acids, phenylpropanoids, lignan glycosides, and triterpenoid saponins were observed among three Akebia species. We compared characteristic metabolite ion intensity between samples to detect significantly changed metabolites according to the three Akebia species. The compounds with VIP > 1 and P < 0.05 were retained as different accumulated metabolites.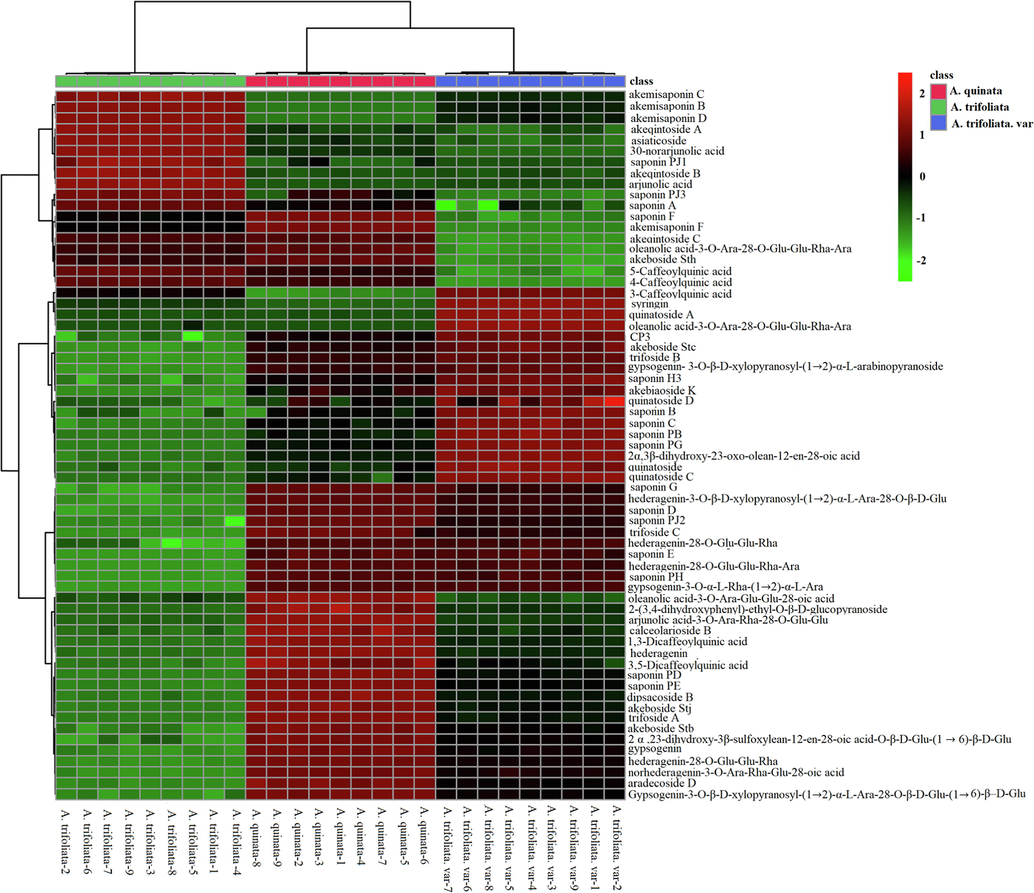
Heat map visualizing the changes in the intensities of marker compounds.
3.3.1 Phenolic acids
In this study, 5 different phenolic acids were identified by UPLC-Orbitrap-MS in all samples, including 5-caffeoylquinic acid, 4-caffeoylquinic acid, 3-caffeoylquinic acid, 1,3-Dicaffeoylquinic acid, and 3,5-Dicaffeoylquinic acid. Among the detected the three Akebia species, phenolic acids were most abundant in A. trifoliata (Fig. 5A). 5-caffeoylquinic acid, 3-caffeoylquinic acid, and 4-caffeoylquinic acid are the most abundant characteristic metabolites in A. trifoliata (Fig. 5B-D). Furthermore, 4-caffeoylquinic acid was the most abundant, with significantly higher levels in A. trifoliata than in the other two species. In addition, we observed a significant decrease of 1,3-Dicaffeoylquinic acid and 3,5-Dicaffeoylquinic acid ion intensity in A. trifoliata. var and A. trifoliata (Fig. 5E-F).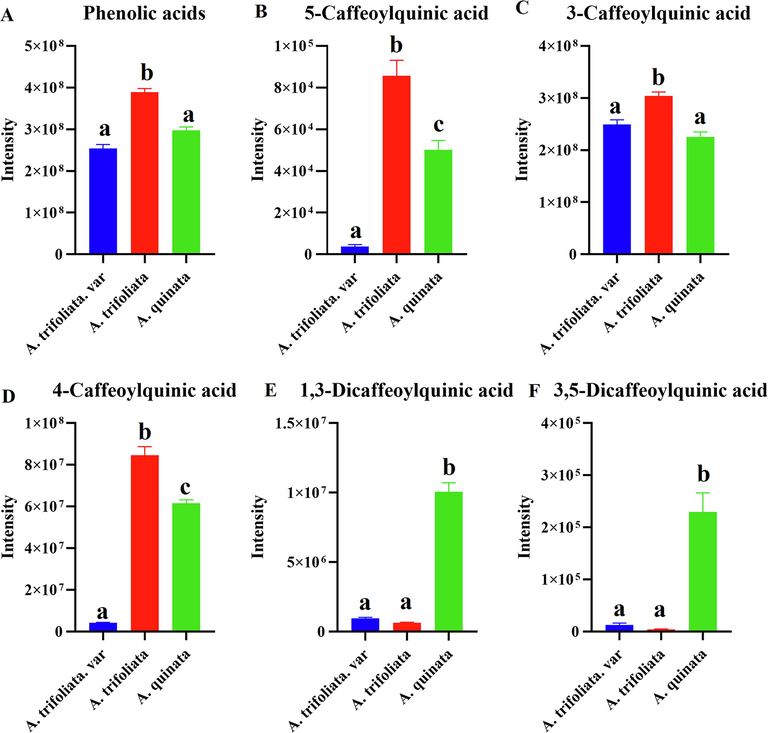
Comparison of the total ion intensity of phenolic acids of three Akebia species (a, b, and c, p < 0.05).
3.3.2 Phenylpropanoids
The results showed phenylpropanoids as common components of three Akebia species. High concentrations of phenylpropanoids were confirmed in A. trifoliata.var (Fig. 6A). The results indicated that syringin was more abundant in A. trifoliata.var (Fig. 6B). Furthermore, the compound character of the three Akebia species, whose concentration is used to standardize that medicinal material according to pharmacopoeial requirements, is calceolarioside B, which was highly concentrated in A. quinata (Fig. 6C).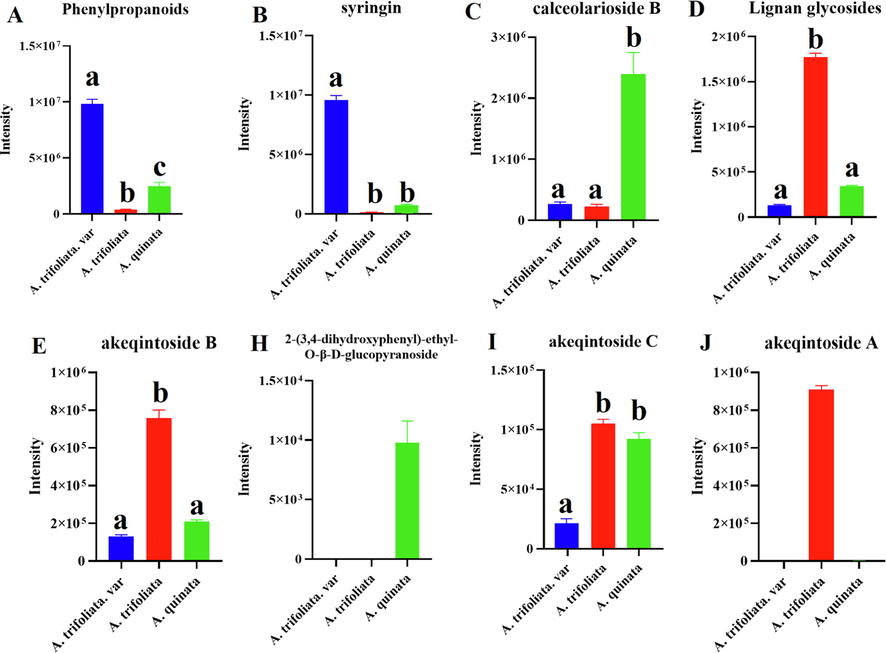
Comparison of the total ion intensity of phenylpropanoid and lignan glycosides of three Akebia species (a, b, and c, p < 0.05).
3.3.3 Lignan glycosides
Lignan glycosides are essential compounds in Akebia. Comparative studies of the lignan glycosides of three Akebia species have shown differences in the distributions of individual metabolites, which were slightly increased in A. trifoliata (Fig. 6D-J). The result revealed that the metabolite 2-(3,4-dihydroxyphenyl)-ethyl-O-β-D-glucop-Yranoside could be used as a marker to distinguish A. quinata from the other two species (Fig. 6H). Furthermore, the metabolite akeqintoside A was also demonstrated as a marker in A. trifoliata (Fig. 6J).
3.3.4 Triterpenoid saponins
Most triterpene saponins were identified from three Akebia species by UPLC-Q-Orbitrap/MS. The investigation revealed that Akebia contains a variety of triterpenoid saponins from various aglycone types, and the composition of triterpenoid saponins differed between the three Akebia species. These aglycones were classified into seven groups including oleanolic acid, noroleanolic acid, arjunolic acid, norarjunolic acid, hederagenin, norhederagenin and gypsogenin (Fig. 1D-J). A. quinata was the richest in oleanolic acid, hederadenin, norhederadenin, and gypsogenin (Fig. 7A-D). A. trifoliata was rich in arjunolic acid and norarjunolic acid (Fig. 7E-F). The noroleanolic acid was significantly more abundant in A. trifoliata. var than other two species (Fig. 7H).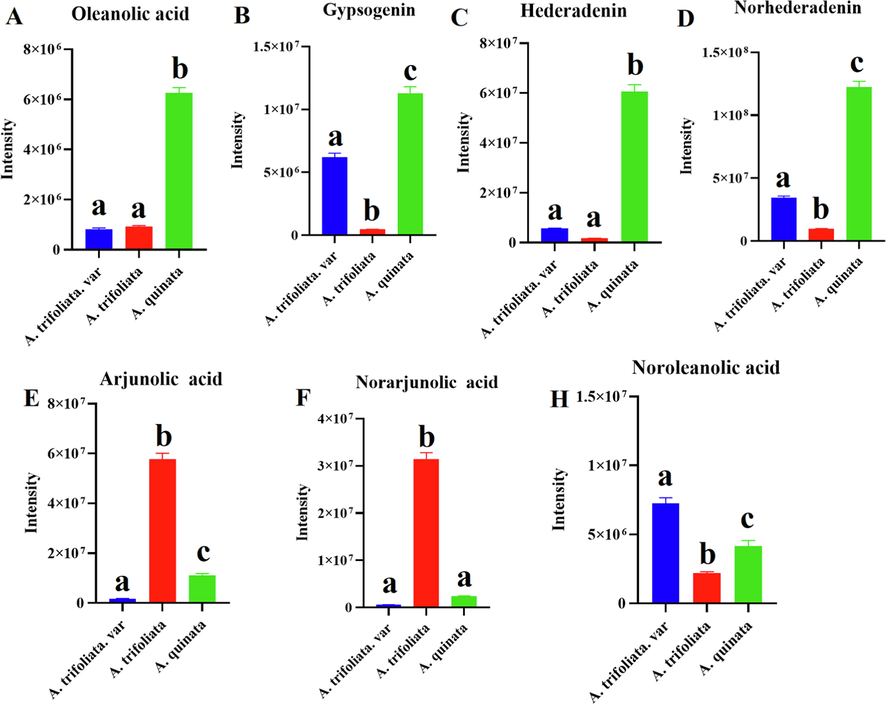
Comparison of the total ion intensity of triterpenoid saponins of three Akebia species (a, b, and c, p < 0.05).
Comparative studies of the triterpenoid saponins composition of three Akebia species, the species A. trifoliata and A. trifoliata var, were characterized by the presence of five triterpene saponins: akemisaponin B, akemisaponin D, oleanolic acid-3-O-arabinopyranosyl-28-O-glucopyranosyl-glucopyranosyl-rhamnopyranosyl-arabinopyranosyl, akemisaponin C, and saponin Pj1 can be treated as markers distinguishing the A. quinata (Fig. 8). Finally, the aglycones composition of A. trifoliata and A. trifoliata. var is more similar to A. quinata.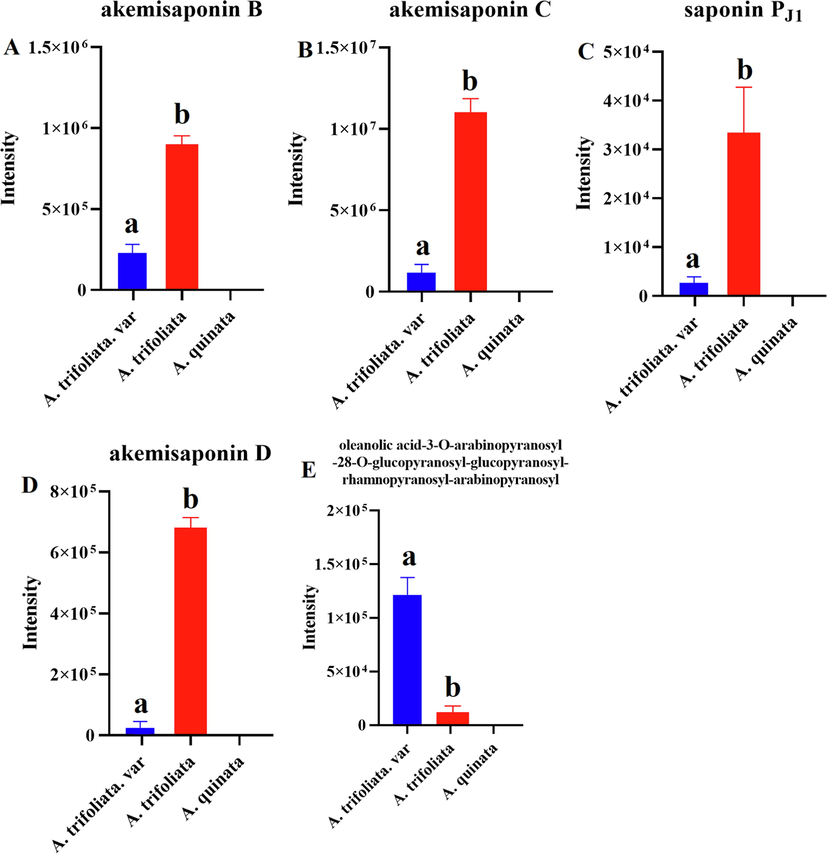
The characteristic triterpenoid saponins composition of three Akebia species (a and b, p < 0.05).
3.4 Antioxidant activities of three Akebia species
Before the assay, the dry ointment yield of extracts was obtained. The antioxidant inhibitory concentration (IC)50 values of 27 extracts were evaluated by DPPH and ABTS assays. These results are listed in Table 2. A. trifoliata and A. trifoliata. var showed 2–3 times higher antioxidant activity than A. quinata. DPPH free radical scavenging IC50 values of A. quinata varied from 8.99 to 11.21 mg·mL−1. A. trifoliata and A. trifoliata. var showed a considerable and stable ability to scavenge the DPPH free radical (5.45–6.97 mg·mL−1 and 5.36–6.87 mg·mL−1, respectively), are shown in Fig. 9A. ABTS free radical scavenging IC50 values of A. quinata varied from 5.56 to 7.54 mg·mL−1. The IC50 values of A. trifoliata and A. trifoliata. var were 2.28–3.22 mg·mL−1 and 2.09–3.22 mg·mL−1, respectively (Fig. 9B). The antioxidant activities results indicated that the antioxidants of three Akebia species were the same in different antioxidative test systems and the antioxidant activities of A. trifoliata and A. trifoliata. var was stronger than A. quinata.
Sample No.
species
DPPH/(IC50, mg·mL − 1)
ABTS/(IC50, mg·mL − 1)
Sample No.
species
DPPH/(IC50, mg·mL − 1)
ABTS/(IC50, mg·mL − 1)
Sample No.
species
DPPH/(IC50, mg·mL − 1)
ABTS/(IC50, mg·mL − 1)
S1
A. trifoliata. var
6.24 ± 0.04
2.11 ± 0.05
S10
A. trifoliata
6.23 ± 0.02
3.11 ± 0.09
S19
A. quinata
9.56 ± 0.21
6.12 ± 0.02
S2
6.05 ± 0.08
2.09 ± 0.04
S11
6.19 ± 0.01
2.93 ± 0.16
S20
11.21 ± 0.04
6.22 ± 0.01
S3
6.97 ± 0.24
2.22 ± 0.01
S12
6.87 ± 0.01
2.56 ± 0.08
S21
11.03 ± 0.13
5.56 ± 0.14
S4
5.87 ± 0.16
3.02 ± 0.23
S13
5.43 ± 0.22
2.67 ± 0.08
S22
9.12 ± 0.24
6.25 ± 0.21
S5
5.99 ± 0.04
2.95 ± 0.08
S14
6.65 ± 0.07
2.87 ± 0.01
S23
8.99 ± 0.11
6.44 ± 0.08
S6
6.67 ± 0.01
3.11 ± 0.06
S15
5.36 ± 0.04
2.28 ± 0.01
S24
9.47 ± 0.08
7.58 ± 0.04
S7
6.74 ± 0.21
3.06 ± 0.06
S16
5.76 ± 0.35
3.22 ± 0.22
S25
9.23 ± 0.01
6.26 ± 0.19
S8
6.45 ± 0.35
2.33 ± 0.04
S17
6.76 ± 0.24
3.13 ± 0.20
S26
9.26 ± 0.06
6.01 ± 0.05
S9
5.45 ± 0.27
3.22 ± 0.13
S18
5.87 ± 0.02
2.29 ± 0.02
S27
10.21 ± 0.06
6.22 ± 0.01
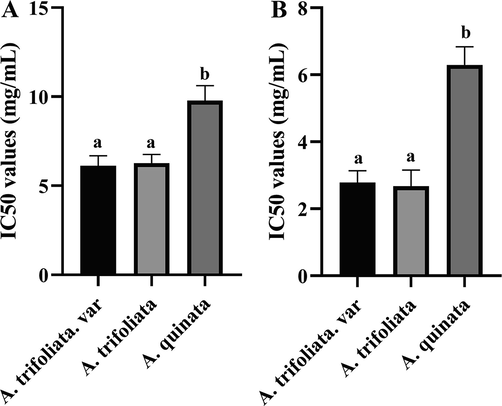
The IC50 results of DPPH (A) and ABTS (B) antioxidant assay (a and b, p < 0.05).
4 Discussion
In this study, an untargeted UPLC-Q-Orbitrap/MS approach combined with multivariate analysis was used to investigate the metabolite profile of three Akebia species. In total, 65 different metabolites were identified in A. quinata, A. trifoliata and A. trifoliata. var, including 5 phenolic acids, 2 phenylpropanoids, 4 lignan glycosides, and 54 triterpenoid saponins. Among these, the contents of phenolic acids and lignan glycosides were significantly higher in A. trifoliata than in A. quinata and A. trifoliata. var. The results showed that the phenylethanoids are common components of three Akebia species, and high concentrations of phenylpropanoids were confirmed in A. trifoliata.var. The composition of triterpenoid saponins is different. Seven aglycones groups, including oleanolic acid, noroleanolic acid, arjunolic acid, norarjunolic acid, hederagenin, norhederagenin and gypsogenin were investigated in three Akebia species. The aglycones composition of A. trifoliata and A. trifoliata. var is more similar to A. quinata. Scientific research has proven significant differences in the composition of these compounds in the stems of different species, not only between A. quinata and A. trifoliata but also in the A. trifoliata. var (Maciąg et al., 2021; Yen et al., 2014). Acidic aglycones are characteristic of the species A. trifoliata. In contrast, nor-oleanane derivatives have been isolated only from A. quinata. 2α-hydroxy groups are derivatives of arjunolic acid and norarjunolic (Jiang et al., 2008; Liu et al., 2018).
In addition, the phenolic glycoside 2-(3,4-dihydroxyphenyl)-ethyl-O-β-d-gluco-pyranoside has been found only in A. quinata, whereas the triterpenoid saponins akemisaponin B, akemisaponin D, oleanolic acid-3-O-arabinopyranosyl-28-O-gluco-pyranosyl-glucopyranosyl-rhamnopyranosyl-arabinopyranosyl, akemisaponin C and saponin Pj1 have been found in A. trifoliata and A. trifoliata. var. Accordingly, these six compounds can be regarded as marker compounds distinguishing three Akebia species.
Traditionally, the three Akebia species have been used only based on TCM. TCM states that the therapeutic effects of Akebia raw material include diuretic, anti-inflammatory, analgesic, cardiostimulatory, antibacterial, and antioxidant activities (Bian et al., 2021; Lee et al., 2017; Maciąg et al., 2021; Peng et al., 2020; Song et al., 2018; Sung et al., 2015; Wang et al., 2015). However, Akebia has important cosmetological properties, including antiaging, antioxidant, and moisturizing properties. Modern scientific research confirms the utility of Akebia extracts in cosmetics (Du et al., 2012; Jeon et al., 2014; Lee et al., 2014; Maciąg et al., 2021; Shin et al., 2015). Recently, cosmetics companies have become particularly interested in the valuable antioxidant biological properties of Akebia, introducing stem extracts into the production of various preparations. Akebia species are described in the CosIng database. According to the CosIng database, the forms in which they are approved for cosmetic use and their potential effects have been summarized. The companies that produce cosmetics from A. quinata are mainly Korean, Japanese, Italian and American, including Kleladarm, Pola, Neogen, Beauty of Joseon, Hello Products, Missha, Sum37°, the Face Shop, Kose, Rosette, Sioris, Bonajour, etc. These companies use A. quinata fruit extract and A. quinata stem extract in their products. In addition, the companies Decorte and Muji produce cosmetics containing A. trifoliata stem extract. (Du et al., 2012; Jeon et al., 2014; Lee et al., 2014; Maciąg et al., 2021; Shin et al., 2015). These applications are closely related to antioxidant effects.
DPPH and ABTS tests were used to evaluate antioxidant activity in order to better demonstrate the antioxidant properties of each species. The free radical scavenging activity in the DPPH and ABTS tests for the A. quinata extract at IC50 values range 8.99–11.21 mg·mL−1 and 5.56–7.54 mg·mL−1, respectively. In addition, A. trifoliata and A. trifoliata. var exhibited outstanding DPPH scavenging activity with IC50 ranging from 5.45 to 6.97 mg·mL−1 and 5.36–6.87 mg·mL−1, respectively. Meanwhile, as observed with the ABTS assay, lower IC50 (2.28–3.22 mg·mL−1 and 2.09–3.22 mg·mL−1, respectively) values were obtained from A. trifoliata and A. trifoliata. var. The antioxidant activities of A. trifoliata and A. trifoliata. var was stronger than A. quinata.
5 Conclusion
This study reveals the antioxidant activity differences between three Akebia species. Furthermore, it provides a reliable identification of a high number of metabolites, contributing to the characterization of the chemical composition of three Akebia species. Moreover, it lays a foundation for its further development or utilization. Furthermore, the current findings suggested that metabolomics is a powerful tool for distinguishing between easily confused species.
CRediT authorship contribution statement
Xiaokang Liu: Conceptualization, Methodology, Investigation, Resources, Data curation, Writing – original draft, Writing – review & editing. Kangyu Wang: Methodology, Investigation, Data curation. Guangzhi Cai: Resources, Project administration. Huitao Li: Methodology, Investigation, Resources. Yunlong Guo: Conceptualization, Writing – review & editing, Project administration. Jiyu Gong: Conceptualization, Writing – review & editing, Project administration, Funding acquisition.
Acknowledgements
This study was supported by the Natural Science Fund Project of Jilin Province, China (No. 20210204078YY).
Declaration of Competing Interest
The authors declare that they have no known competing financial interests or personal relationships that could have appeared to influence the work reported in this paper.
References
- Natural triterpenoids isolated from Akebia trifoliata stem explants exert a hypoglycemic effect via α-glucosidase inhibition and glucose uptake stimulation in insulin-resistant HepG2 cells. Chem. Biodivers.. 2021;18:1612-1872.
- [Google Scholar]
- Validated UHPLC–MS/MS method for simultaneous determination of four triterpene saponins from Akebia trifoliata extract in rat plasma and its application to a pharmacokinetic study. Biomed. Chromatogr.. 2019;33:4585.
- [Google Scholar]
- Quality assurance procedures for mass spectrometry untargeted metabolomics. a review. J. Pharm. Biomed. Anal.. 2018;147:149-173.
- [Google Scholar]
- Physicochemical and functional properties of the protein isolate and major fractions prepared from Akebia trifoliata var. australis seed. Food Chem.. 2012;133:923-929.
- [Google Scholar]
- Diversity of antioxidant ingredients among Echinacea species. Ind. Crop. Prod.. 2021;170:113699
- [Google Scholar]
- Triterpenoid saponins and phenylethanoid glycosides from stem of Akebia trifoliata var. australis. Phytochemistry. 2006;67:2697-2705.
- [Google Scholar]
- How to identify “Material basis–Quality markers” more accurately in Chinese herbal medicines from modern chromatography-mass spectrometry data-sets: Opportunities and challenges of chemometric tools. Chinese Herbal Med.. 2021;13:2-16.
- [Google Scholar]
- Triterpene saponins from the pericarps of Akebia trifoliata. Chem. Pharm. Bull.. 2012;60:1264-1274.
- [Google Scholar]
- Anti-obesity effects of extracts from young Akebia quinata D. leaves. J. Korean Soc. Food Sci. Nutrit.. 2014;143:200-206.
- [Google Scholar]
- Jiang, Y.L., Ding, Y.F., Wang, D.F., Deng, Y., Zhao, Y.Y., 2020, Radio frequency-assisted enzymatic extraction of anthocyanins from Akebia trifoliata (Thunb.) Koidz. flowers: Process optimization, structure, and bioactivity determination. Ind. Crop. Prod. 2020, 112327.
- Triterpene saponins from the fruits of Akebia quinata. Biochem. Syst. Ecol.. 2008;36:138-141.
- [Google Scholar]
- Antimicrobial, antioxidant and physical properties of chitosan film containing Akebia trifoliata (Thunb.) Koidz. peel extract/montmorillonite and its application. Food Chem.. 2021;361:130111
- [Google Scholar]
- Three new lignan glycosides with IL-6 inhibitory activity from Akebia quinata. Chem. Pharm. Bull.. 2014;45:288-293.
- [Google Scholar]
- A new megastigmane glycoside from Akebia quinata. Arch. Pharm. Res.. 2014;38:591-597.
- [Google Scholar]
- Structure-activity relationship of oleanane disaccharides isolated from Akebia quinata versus cytotoxicity against cancer cells and NO inhibition. Biol. Pharm. Bll.. 2004;27:744-747.
- [Google Scholar]
- Quality characteristics and antioxidant activity of vinegar supplemented added with Akebia quinata fruit during fermentation. J. Korean Soc. Food Sci. Nutrit.. 2014;43:1217-1227.
- [Google Scholar]
- Antioxidative and anti-inflammatory activities of akebia quinata extracts in an In vitro model of acute alcohol-induced hepatotoxicity. J. Med. Food.. 2017;20:912-922.
- [Google Scholar]
- Untargeted metabolomics study of Lonicerae japonicae fios processed with different drying methods via GC-MS and UHPLC-HRMS in combination with chemometrics. Ind. Crop. Prod.. 2022;186:115179
- [Google Scholar]
- Identification and characterization of the major chemical constituents in fructus Akebiae by high-performance liquid chromatography coupled with electrospray ionization-quadrupole-time-of-flight mass spectrometry. J. Chromatogr. Sci.. 2015;54:148-157.
- [Google Scholar]
- Chemical composition analysis of Schisandra chinensis fructus and its three processed products using UHPLC-Q-Orbitrap/MS-based metabolomics approach. Nat. Pro. Res.. 2020;36:3464-3468.
- [Google Scholar]
- Research progress on chemical components and pharmacological effects of Akebia trifoliata (Thunb.) koidz. stem. Academic J. Shanghai Univ. Tradit. Chinese Med.. 2020;34:99-106.
- [Google Scholar]
- Metabolomics analysis and rapid identification of changes in chemical ingredients in crude and processed Astragali Radix by UPLC-QTOF-MS combined with novel informatics UNIFI platform. Chin. J. Nat. Medicines.. 2018;16:714-720.
- [Google Scholar]
- Research progress of active compounds and pharmacological effects in Akebia trifoliata (Thunb) koidz stems. IOP Conf. Series Earth Environ. Sci.. 2018;185:12034.
- [Google Scholar]
- Lu, W.L., Ren, H.Y., Liang, C., Zhang, Y.Y., Xu, J., Pan, Z.Q., Liu, X.M., Zhong, H.W., Fang, Z.Q., 2014. Akebia trifoliate (Thunb.) Koidz seed extract inhibits the proliferation of human hepatocellular carcinoma cell lines via inducing endoplasmic reticulum stress. Evid-based. Compl. Alt. 2014, 192749.
- Influences of microwave-assisted extraction parameters on antioxidant activity of the extract from Akebia trifoliata peels. Foods.. 2021;10:1432.
- [Google Scholar]
- A four-step filtering strategy based on ultra-high-performance liquid chromatography coupled to quadrupole-time-of-flight tandem mass spectrometry for comprehensive profiling the major chemical constituents of Akebiae fructus. Rapid. Commun. Mass. Sp.. 2019;33:1464-1474.
- [Google Scholar]
- Akebia quinata and Akebia trifoliata - a review of phytochemical composition, ethnopharmacological approaches and biological studies. J. Ethnopharmacol.. 2021;280:114486
- [Google Scholar]
- Comparative analysis of Akebia trifoliata fruit softening at different flesh ripening stages using tandem mass tag technology. Front. Nutr.. 2021;8:684271
- [Google Scholar]
- Akebia saponin E, as a novel PIKfyve inhibitor, induces lysosome-associated cytoplasmic vacuolation to inhibit proliferation of hepatocellular carcinoma cells. J. Ethnopharmacol.. 2020;266:113446
- [Google Scholar]
- Ameliorating effect of Akebia quinata fruit extracts on skin aging induced by advanced glycation end products. Nutrients. 2015;7:9337-9352.
- [Google Scholar]
- Ormosanine from Akebia quinata suppresses ethanol-induced inflammation and apoptosis and activates antioxidants via the mitogen activated protein kinase signaling pathway. J. Funct. Foods.. 2018;48:357-366.
- [Google Scholar]
- Metabolome and transcriptome profiling reveals quality variation and underlying regulation of three ecotypes for cistanche deserticola. Plant. Molecular. Biol.. 2020;102:253-269.
- [Google Scholar]
- Sung, Yoon, Y., Kim, H, K., Dong, S., 2015. Akebia quinata extract exerts anti-obesity and hypolipidemic effects in high-fat diet-fed mice and 3T3-L1 adipocytes. J. Ethnopharmacol. 168, 17–24.
- The Plant List, 2020, The Plant List (Accessed 11 April 2021).
- Analysis of flavonoid metabolites in citrus peels (Citrus reticulata “Dahongpao”) using UPLC-ESI-MS/MS. Molecules. 2019;24:2680.
- [Google Scholar]
- Changes in metabolome and nutritional quality of lycium barbarum fruits from three typical growing areas of China as revealed by widely targeted metabolomics. Metabolites. 2020;10:46.
- [Google Scholar]
- Bioactive 30-noroleanane triterpenes from the pericarps of Akebia trifoliata. Molecules. 2014;19:4301-4312.
- [Google Scholar]
- Antibacterial oleanane-type triterpenoids from pericarps of Akebia trifoliata. Food Chem.. 2015;168:623-629.
- [Google Scholar]
- Phenylethanoid glycosides B content of Akebia plants determined by HPLC. South China Forestry Sci.. 2015;43:48-51.
- [Google Scholar]
- Two new pentacyclic triterpene saponins from the leaves of Akebia trifoliata. Molecules. 2016;21:962.
- [Google Scholar]
- Quantitative determination of compounds from Akebia quinata by High-Performance Liquid Chromatography. B. Korean. Chem. Soc.. 2014;35:1956-1964.
- [Google Scholar]
- Triterpene glycosides from the stems of Akebia quinata. Chem. Pharm. Bull.. 2007;55:1319-1324.
- [Google Scholar]
- Geographic variation laws of medicinal compositions in Akebia trifoliate rattans. Nonwood Forest Res.. 2016;128:107-110.
- [Google Scholar]
- Accumulation dynamic of triterpenoid saponins in Akebia trifoliata stem. J. Chinese Med. Mater.. 2014;37:1130-1133.
- [Google Scholar]
- Study on fingerprint of different species of Akebia quinata based on chemical pattern recognition method. Chin. J. Pharm. Anal.. 2021;9:1590-1597.
- [Google Scholar]
- A strategy for rapid discovery of traceable chemical markers in herbal products using MZmine 2 data processing toolbox: A case of Jing Liqueur. Chinese Herbal Med.. 2021;13:430-438.
- [Google Scholar]
Appendix A
Supplementary material
Supplementary data to this article can be found online at https://doi.org/10.1016/j.arabjc.2023.104549.
Appendix A
Supplementary material
The following are the Supplementary data to this article:Supplementary data 1
Supplementary data 1


