

Translate this page into:
Efficient and simple method for the quantification of alkyl polyglycosides by hydrolysis and photometric determination of reducing sugars
⁎Corresponding author. Tung.Pham@uibk.ac.at (Tung Pham)
-
Received: ,
Accepted: ,
This article was originally published by Elsevier and was migrated to Scientific Scholar after the change of Publisher.
Abstract
Abstract
Alkyl polyglycosides (APG) are important biodegradable surfactants for many applications. The lack of a chromophoric group and the mixture of stereoisomers and oligomers make the quantification by merely chromatic separation difficult. A simple and efficient quantification assay was developed based on the acid hydrolysis of alkyl polyglycoside and subsequent quantification of the hydrolytically cleaved glucose using the neocuproine assay. Complete hydrolysis of alkyl polyglycoside is achieved with 16 wt% sulfuric acid at 100 °C after 30 min and the separation of fatty alcohol and clouding of the reaction mixture is prevented by adding 1,2-propylene-glycol. Hydrolytically cleaved sugars reduce the Cu(II)-neocuproine complex, leading to a color shift which permits the spectrophotometric quantification at 452 nm. A linear correlation between the absorbance of reduced Cu(II)-neocuproine complex and glucose or alkyl polyglycoside concentration is observed up to an analyte concentration of 25 mg/L. Statistical analysis according to one-tailled T-test (S’ 95%), has shown that the lower detection limit for alkyl polyglycosides is 2.97 mg/L and the limit of quantification 8.24 mg/L, respectively. Apart from the simple execution, the assay is reliable and can be utilized both as scientific technique to quantify APG as well as for process and quality control in the industry.
Keywords
Alkyl polyglycoside assay
Reducing sugar
Spectrophotometric quantification

1 Introduction
Alkyl polyglycosides (APGs), technically synthesized from nature based starch and fatty alcohol, are considered as the most important sugar based biodegradable nonionic surfactants with growing application in the formulation of detergents,(Gunjikar et al., 2006) cleaning agents, cosmetic products,(Baer et al., 1998; Czichocki et al., 2002) and process lubricants.(Chen et al., 2013; Li et al., 2019; Sułek et al., 2013) Furthermore, APGs are also often used as surfactants for membrane protein crystallization,(Hunte et al., 2003; Santonicola et al., 2008) and to solubilize biological membranes because of their low toxicity.(le Maire et al., 2000; Tani et al., 1997) The latest alkyl polyglucoside market analysis indicated a global annual growth of 7.7 % in 2021 to total demand of 584 kt. Through 2031, the market for APG is anticipated to expand at a CAGR of close to 8 %.(Fact.MR, 2021).
With regards to the characterization of APGs, several analytic methods have been developed. However, the chemical structure combining a fatty alcohol and glucose units limits the methods for quantification. Analysis by merely chromatic separation is problematic, as the lack of a chromophor group prohibits the sensitive detection by UV or VIS detectors.(Kühn and Neubert, 2004) Use of high-performance liquid chromatography (HPLC) in combination with an evaporative light scattering detector (ELSD) permits APG detection at 5 mg/L injected, however no sensitivity were reported.(Czichocki et al., 2002) Similar technique was applied for the determination of octylglucoside with the limit of quantification and detection of 5 mg/L and 1.25 mg/L, respectively and an accuracy between 98 % and 103 %.(Amari et al., 2003) For HPLC in combination with a mass spectrometer, the detection limit without enrichment is 10 µg/L.(Eichhorn and Knepper, 1999) Moreover, APGs are not uniform chemical compounds but are present as mixture of stereoisomers and oligomers,(Kühn and Neubert, 2004) which makes their characterization even more complex. Identification of the alkyl chain length and number of glucose units only can be performed by mass spectrometry,(Billian and Stan, 1998; Eichhorn and Knepper, 1999; Kühn and Neubert, 2004) NMR,(Billian et al., 2000; El-Sukkary et al., 2008)and near IR.(Kim et al., 2001) In many applications, the type of APG used in a formulation is known and a rapid, straightforward method to quantify the concentration in a certain product would be very desirable. Such a method also is useful for a fast quantification for application purposes of known APGs using simple instrumentation, for example in continuous quality control during production.
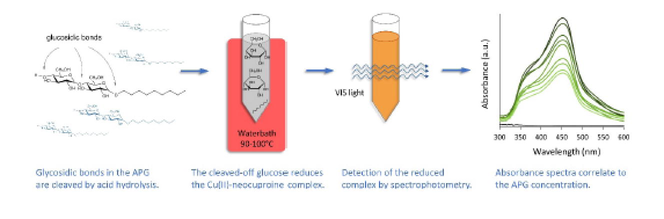
Previous research has shown that quantitative analysis of APGs can be achieved by the hydrolysis of an APG into glucose, oligosaccharides and fatty alcohol (Scheme 1), and subsequent quantification of the separated components i.e. free glucose by use of an enzyme electrode and fatty alcohols with HPLC.(Bastl-Borrmann and Kroh, 2001) The degradation of APGs with acid hydrolysis with 98–100 % recovery(Baer et al., 1998) was found more effective compared to the enzymatic hydrolysis with 85–99 % recovery,(Bastl-Borrmann and Kroh, 2001) because the acid hydrolysis cleaves the oligosaccharide into separate glucose molecules, whereas the enzymatic hydrolysis did not open all present glycosidic bonds.(Bastl-Borrmann and Kroh, 2001) Possible formation of anhydro-sugars will not change the results of the neocuproine assay. As long as the aldehyde group is not oxidized during the acidic hydrolysis there will be no negative impact on the outcome of the analysis. As an example anhydrofructose has been determined with use of the neocuproine assay with very good sensitivity (Fujisue et al., 2001).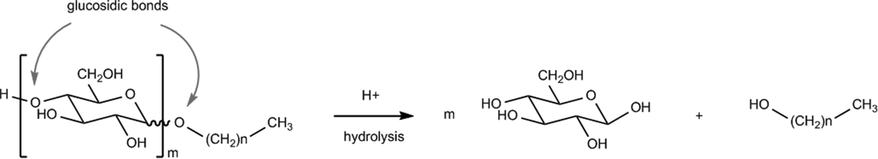
Reaction mechanism of an acid catalyzed hydrolysis of APGs.
Following to the hydrolytic formation of glucose the different methods for glucose quantification could be applied which have been described in the literature. Relevant examples are enzymatic glucose detection with photometry NADPH,(Baer et al., 1998),(Bastl-Borrmann and Kroh, 2001) fermentation by yeast (Baer et al., 1998) or neocuproine assay.(Başkan et al., 2016) In the enzymatic assay with NADPH at first glucose becomes phosphorylated to glucose-6-phosphate by a hexokinase and in presence of ATP. Then a glucose-6-phosphate-dehydrogenase forms gluconate-6-phosphate and reduced NADPH which then is quantified by photometry.(Baer et al., 1998).
Already in the 90ties, the Cu(II)-neocuproine spectrophotometric method was developed for the determination of α-tocopherol.(Tütem et al., 1997) Later, the complex was further utilized by different research groups by as chromogenic oxidizing agent for the determination of total antioxidant capacity of phenolic compounds in food extract and human serum, but also for the determination of sorbic acid and captopril.(Apak et al., 2005; Gouda and Amin, 2010; Güçlü et al., 2005) Most recently, the application of Cu(II)-neocuproine complex was further extended, e.g. as redox mediator for electrocatalytic oxidation of hydrogenperoxide(Emir et al., 2020) or in colorimetric sensor based on heparin-stabilized gold nanoparticles for total antioxidant capacity measurement.(Bener et al., 2018).
In this study, we have developed a simple and rapid procedure for the determination of alkyl polyglycosides, e.g. in detergent formulations. The method is based on the hydrolysis of APG by sulfuric acid followed by quantitative determination of the formed glucose using the neocuproine assay. Free reducing sugars as products of the hydrolysis reduce the Cu(II)-neocuproine complex leading to a color shift from yellow to orange and enables the spectrophotometric determination of the reducing sugars. After the optimization of the experimental conditions, relevant statistical characteristics of the method were determined to demonstrate the analytical performance of the method. This assay allows an efficient quantification of APG with the use of standard chemicals and comparable convenient equipment expenditure.
2 Experimental
2.1 Materials
Alkyl polyglycoside (Glucopon 225, 68.8 wt% dry weight) was kindly provided from Buls Chem & More Handels GmbH (Kematen, Austria). β-D(+)glucose monohydrate (Fluka Biochemika, Buchs, Switzerland) was used as reference substance for the assay. Sulfuric acid (96 wt%, Sigma-Aldrich, Steinheim, Germany) was diluted to a 0.6 M solution in assay A and 7.1 M solution in assay B, respectively for hydrolysis of the APG. NaOH (50 wt%, Deuring GmbH, Hoerbranz, Austria) was used as 2 M solution in assay A or 12.5 M solution in assay B for neutralization after the hydrolysis. 13 wt% (0.12 M) Na2CO3 water free (Merck, Darmstadt, Germany) was used to reach the pH value of 13. The copper-neocuproine reagent was made of 0.5 g/L (2 mM) CuSO4·5H2O (>98 %, Carl Roth, Karlsruhe Germany) and 1.0 g/L (3.81 mM) neocuproine hydrochloride (2,9-Dimethyl-1,10-phenanthroline, Sigma-Aldrich, Steinheim, Germany) in deionized water. 1,2-propylene-glycol (≥99.5 vol%) (Fluka Biochemika, Buchs, Switzerland) was used for dissolving the fatty alcohols after hydrolysis.
2.2 Neocuproine assay
The glucose concentration is quantified by detecting the change in absorbance after reduction of Cu(II) in Cu(II)-neocuproine complex to Cu(I) in the reaction mixture. For this purpose, glucose and APG solutions in the ranges of 0 – 50.8 and 0 – 34.9 mg/L (based on dry weight) respectively were prepared in demineralized water. The glucose solutions were treated with the same procedure as APG to assess the stability of glucose under the experimental conditions applied. Optimization of the APG hydrolysis was undertaken by variation of hydrolysis conditions (temperature, time and acid concentration), representative examples are given in Table 1. Two different assays for the hydrolysis of the glycoside were compared. The volumes of the reagents were optimized to allow the execution of the full analysis, i.e. the hydrolysis and reaction in a 16 mm round cuvette with approximately 10 mL volume.
Experiment
Acidic hydrolysis
Alkalisation
Reaction mixture
Detection
Acid
Temp
Time
pH
transparency
absorbance
M
wt%
°C
min
a.u.
1
0.09
0.86
90
5
12
clear
0.157
2
0.09
0.86
90
30
12
clear
0.285
3
0.29
2.86
90
30
12
clear
0.335
4
0.97
9.46
90
20
13–14
slightly turbid
0.615/0.538*
5
0.97
9.46
100
5
13–14
clear
0.482
6
0.97
9.46
100
20
13–14
slightly turbid
1.947*
7
0.97
9.46
100
30
13–14
slightly turbid
1.218*
8
1.07
10.53
90
30
13
clear
0.886/0.897
9
1.07
10.53
100
10
13–14
clear
0.62
10
1.07
10.53
100
20
13–14
slightly turbid
1.389*
11
2.04
20
100
5
13–14
slightly turbid
2.655/2.45*
12
2.04
20
100
10
13–14
turbid
1.87/2.16*
13
2.04
20
100
20
13–14
turbid
2.08/2.09*
For assay A, the hydrolysis of the APG sample solution (3 mL) was performed by the addition of 0.50 mL 6 wt% (0.61 M) sulfuric acid to reach a final concentration of 0.86 wt% (0.088 M) acid at 90 °C for 30 min. The solution then was neutralized with 0.55 mL 2 M (8 wt%) aqueous sodium hydroxide solution. Then 1.0 mL Na2CO3 13 wt% (0.12 M) was added. The final pH of the solution was approximately pH 13. The measurement of pH values at the high alkali concentrations in the assay are estimates which have been calculated using the concentrations of alkali (NaOH, Na2CO3) in the respective assay. The Cu(II)-neocuproine complex was formed by the addition of 2.0 mL of reagent containing 0.5 g/L (2 mM) CuSO4·5H2O and 1 g/L (3,81 mM) neocuproine hydrochloride, thus leading to a final concentration of 0.14 g/L (0.56 mM) CuSO4·5H2O and 0.28 g/L (1.07 mM) neocuproine hydrochloride in the assay. The reduction of Cu(II) to Cu(I) was achieved by heating the reaction mixture to 90 °C for 5 min. Then the solution was cooled to 40 °C in a water bath, before the absorbance measurement was undertaken.
For assay B, the hydrolysis of an APG sample solution (3 mL) was performed by the addition of 0.90 mL 70 wt% (7.14 M) sulfuric acid to reach a final concentration of 16 wt% (1.63 M) sulfuric acid at a temperature of 100 °C for 30 min. The solution was neutralized with addition of 1.50 mL 50 wt% (12.5 M) NaOH (caution: dropwise addition of the NaOH solution to the hydrolysis mixture is required to avoid overheating and splattering of the reaction mixture - close fitting eye glasses are mandatory). During APG hydrolysis hydrophobic fatty alcohols are formed, which are insoluble in the reaction mixture and thus a turbid solution is obtained. By adding 0.50 mL 1,2-propylene-glycol (99.5 %vol) as a co-solvent, the fatty alcohols could be held in dissolved state and subsequent spectrophotometric measurement after the reduction reaction could be performed with a clear solution. Then 1.0 mL Na2CO3 13 wt% (0.12 M) was added. The solution pH was approximately pH 13. In this pH range the reaction between reducing sugars and the Cu(II)-neocuproine complex exhibits very low dependency on the alkalinity of the assay.(Başkan et al., 2016) The Cu(II)-neocuproine complex was formed by the addition of 3.00 mL of reagent containing 0.5 g/L (2 mM) CuSO4·5H2O and 1 g/L (3.81 mM) neocuproine hydrochloride, leading to a final concentrations of 0.15 g/L (0.6 mM) CuSO4·5H2O and 0.30 g/L (1.14 mM) neocuproine hydrochloride. Further steps were identical as defined for assay A. In order to avoid disturbing turbidity due to possible precipitation of fatty alcohols from the reaction mixture, the spectrophotometric analysis was performed immediately after the hydrolysis. However, only clear solutions must be used for the photometry. Solutions which exhibit turbidity cannot be used for quantitative analysis. The absorbance was detected in the range of 300–700 nm using a spectrophotometer (Carl Zeiss Jena GmbH, Jena, Germany) with a VIS lamp (Type halogen CLH500) in a 10x10 mm quartz glass cuvette.
For APG determination, the calibration was evaluated with application of statistical calculation for linear regression. The calibration was characterized by the following parameters: linear regression coefficient, confidence interval for one-tailed confidence level (S’) 95%, lower limit of detection (LOD) and lower limit of quantification (LOQ).(Küster and Thiel, 2019).
3 Results and discussion
3.1 Method development
The absence of functional groups with high absorbance in the UV or VIS range of electromagnetic radiation limits the sensitivity for a direct photometric quantification of APGs in the solution. However a number of sensitive methods for the quantification of glucose concentrations exist. Thus, with the release of the glucose units from the fattyalcohol by acidic hydrolysis, APGs could be quantified indirectly by photometric determination based on the amount of monosaccharides formed.
The commercial product Glucopon 225 as a representative APG in this study is commonly used as surfactant in formulations of cleaning agents.(Mann et al., 2004; Morris et al., 1996) To achieve reliable analytical results, a complete and stoichiometric hydrolysis of the glycosidic components in the APG must be achieved so that all glucose will be available for the Cu(II)-neocuproine assay. This assay is frequently used for the quantification of soluble reducing sugars in the concentration range of up to 1.5 g/L with good linearity.(Peris-Tortajada et al., 1992) In order to determine the optimal conditions for APG hydrolysis, the influence of experimental conditions with regard to concentration of acid, reaction time and temperature on the APG hydrolysis was investigated. The hydrolysis reaction was finished by neutralization. Thereafter the standard neocuproine assay was performed. The reaction steps are summarized in Fig. 1.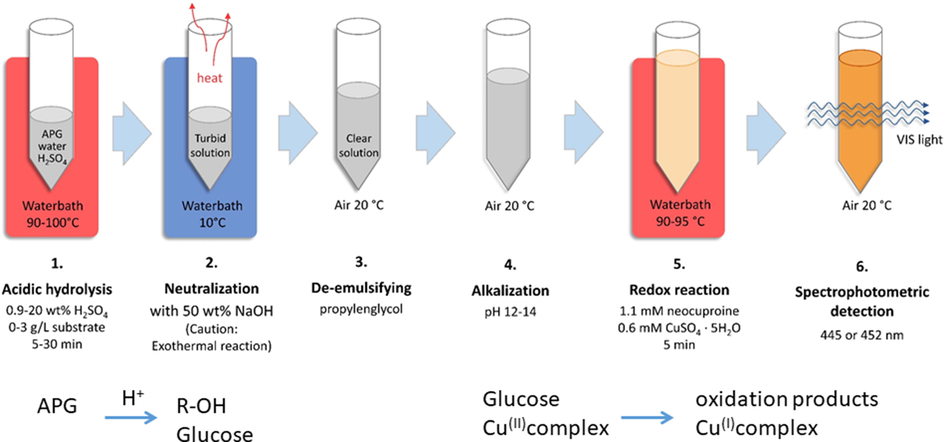
APG quantification in 6 steps. The indicated values of H2SO4, CuSO4·5H2O and neocuproine are final concentrations.
A low acid concentration is favourable for the hydrolysis as the neutralization in advance to the neocuproine assay will require stoichiometric amounts of alkali. During the optimisation of the AGP hydrolysis, the concentration of sulfuric acid was increased from initially 0.86 wt% to 20 wt%. The hydrolysis was carried out for 5 min, 20 min or 30 min at 90 °C or 100 °C. Table 1 gives an overview of the different hydrolysis conditions and the absorbance detected for the reduced Cu(II)-neocuproine complex. The absorbance values are spectrophotometrically determined in 16 mm round cuvette at 445 nm. Sample concentration was 17.5 mg/L APG for all expermiments. The acid concentration is indicated as final concentration.
With the experiment 1, a low concentration of 0.86 wt% sulphuric acid was used for APG hydrolysis for 5 min at 90 °C. The low absorbance measured in the neocuproine method indicated that only an incomplete amount of reducing sugars had been released and thus only a minor part of the APG had been hydrolysed successfully. As expected, an increase in reaction time to 30 min (experiment 2) led to a higher absorbance, which is an indicator for a higher degree of hydrolysis. Increasing acid concentration, hydrolysis time and temperature (experiments 3 – 13) resulted in further increase of absorbance, however the presence of fatty alcohol in the reaction mixture then led to formation of a turbid solution (experiment 4, 6, 7, 10, 11, 12, 13), which prevents accurate measurement of the absorbance.
Similarely, the methods with long incubation time and/or high acid concentration (experiments 4, 6, 7, 10, 11, 12, 13) led to turbid reaction mixtures, even agglomerate to flakes as a results of hgher concentrations of free glucose, along with an increase of free fattyalcohol in the reaction mixture. The absorbance values in Table 1 which exhibit this interference are marked with an asterix. The reduced absorbance for experiments with long hydrolysis time may also be due to the coagulation of finely dispersed fatty alcohol drops leading to a lower absorbance compared to the emulsion immediately formed after hydrolysis.
In comparision, Fig. 2a indicates that the hydrolysis level of 17.5 mg/L APG in a 10.53 wt% acidic reaction mixture is 3–4 times higher compared to an 0.86 wt% sulphuric acid solution. Also an increase of the temperature (Fig. 2b) or incubation by 10 °C and 10 min respectively (Fig. 2c) results in a higher concentration of free reducing sugars, indicated by the increased absorption values.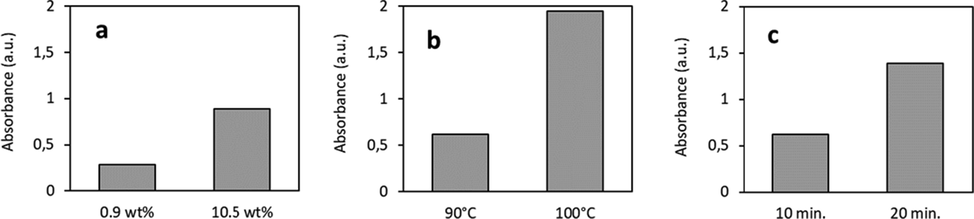
APG hydrolysis as function of acidity, temperature and incubation time. The acid dependency (a) was determined at 90 °C for 30 min (experiment 2 and 8), the temperature dependency (b) at 9.46 wt% acid for 20 min (experiment 4 and 6) and the dependency of the duration of the hydrolysis reaction (c) at 100 °C and 10.53 wt% acid (experiment 9 and 10).
3.2 Background absorbance
By the addition of 1,2-propylene-glycol as de-emulsifier agent homogeneous solutions were obtained, which prevents the separation of the fatty alcohol formed as by-product of the APG hydrolysis. However, 1,2-propylene-glycol also interferes with the neocuproine-copper complex, thus leading to a change in absorption of the blank reaction mixture. Fig. 3 illustrates contribution of the different components used in the assay to the absorbance of a blank sample. All samples were incubated for 5 min at 90 °C to simulate the conditions applied for color development of the Cu(I)-neocuproine complex.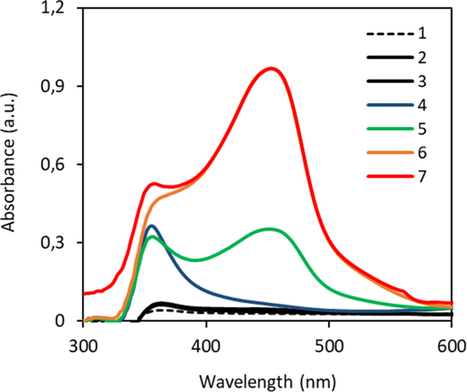
Absorbance of blank solutions, reagent and used additives. The reduction reaction took place under the same condition and concentrations of the chemicals as in assay B at 90 °C for 5 min without hydrolysis reaction in advance. The volume of each sample was filled with pure water to reach a total volume of 10 mL. Pure water (1), Na2CO3 (2), 1,2-propylene-glycol (3), reagent (4), Na2CO3 + reagent (5), Na2CO3 + reagent + 1,2-propylene-glycol (6) and APG (3 mL of stock concentration 34.9 mg/L) + 1,2-propylene-glycol + Na2CO3 + reagent (7).
Pure water, sodium carbonate and 1,2-propylene-glycol (Fig. 3, sample 1–3) do not lead to a significant absorption between 400 nm and 600 nm. The Cu(II)-neocuproine reagent exhibits an absorbance peak at 358 nm (sample 4). After the addition of sodium carbonate (sample 5) an additional peak of the Cu(II)-neocuproine complex appears at 452 nm with an absorbance of 0.36, which increases further to 0.97 when 1,2-propylene-glycol is added (sample 6). The addition of APG (3 mL, 34.9 mg/L) without preceding hydrolysis did not lead to a significant change in the absorbance, which demonstrates that the APG did not contain any free reducing sugars (Fig. 3, sample 7). Thus, an increase in absorbance after the hydrolysis of APG can only be contributed to the amount of released reducing sugars. At room temperature, a lower influence of 1,2-propylene-glycol on the absorbance of the blank reagent solution was observed, indicating the presence of a slight impurity in 1,2-propylene-glycol which leads to the formation of Cu(I)-neocuproine complex.
Future investigations to replace the 1,2-propylene-glycol with other solvents could lead to further improvement of the presented procedure.
In technical detergent formulations surfactants, solvents, complexing agents, inorganic salts and bases form the major ingredients. Presence of other reducing components will be determined with a reference experiment without hydrolysis (analogous to sample 7 in Fig. 3). Thus the method will be selective for reducing compounds released during hydrolysis, which is glucose in case of APG’s.
3.3 Assays with high and low acidic grades for APG hydrolysis
The method development has shown that the degree of Cu(II)-neocuproine-complex reduction, depends on the acid concentration, temperature and duration of the hydrolysis reaction step. Therefore, two experimental settings (named assay A and assay B) were chosen for further investigations of the quantitative release of reducing sugars from APG, the stability of glucose under the acidic conditions and the correlation between the glucose or APG concentration and the absorbance.
In assay A, mild hydrolysis conditions at a low acid concentration (0.86 wt%), at 90 °C for 30 min were applied. At these conditions no turbitity was observed, thus the absorbance can be detected directly after the reaction and the addition of 1,2-propylene-glycol is not needed. The absorbance spectra are shown in Fig. 4. Both substrates, glucose (Fig. 4a) and APG (Fig. 4b), underwent hydrolysis and neutralization steps. The maximum of the absorbance peak for glucose and for APG samples was observed at 452 nm. The peak height correlates to the concentration of amount of analyte leading to reduction of the Cu(II)-neocuproine complex. In Fig. 4 the spectra without correction of the baseline for the blank solution are shown, to demonstrate the absorbance of the blank solution. Thus a higher baseline absorbance is obtained, however when a baseline correction is introduced the values for the black will be compensated and the measurements will appear in the optimal range.The correlation between the sample concentration and the absorbance is shown in Fig. 6. A linear correlation between the absorbance and glucose or APG concentration is observed up to an analyte concentration of 25 mg/L. The absorbance of the glucose containing samples increases from 0.2 to 2, with a slope of 0.064 and a R2 value of 0.997, indicating a high precision (Fig. 6a, assay A). The lower absorbance was obtained with the APG samples, where an increase in absorption from 0.2 to 0.5 was observed (Fig. 6b, assay A). Although the data follow a linear correlation, the relatively low value of the slope (0.009) indicates a lower precision under these experimental conditions compared to the standard curve derived form glucose. Moreover, the low slope could indicate that the APG molecules are incompletely hydrolysed or that side reactions between glucose and the acid occurs during the hydrolysis reaction. To achieve complete hydrolytic cleavage of the reducing sugars from APG, more harsh hydrolysis conditions are needed.
VIS absorbance of glucose (a) and APG (b) after performing assay A. The APG is only partly hydrolyzed in 0.86 wt% sulfuric acid for 30 min. at 90 °C. Concentration ranges of glucose from 0 to 50.8 mg/L and of APG from 0 to 34.9 mg/L were determined.
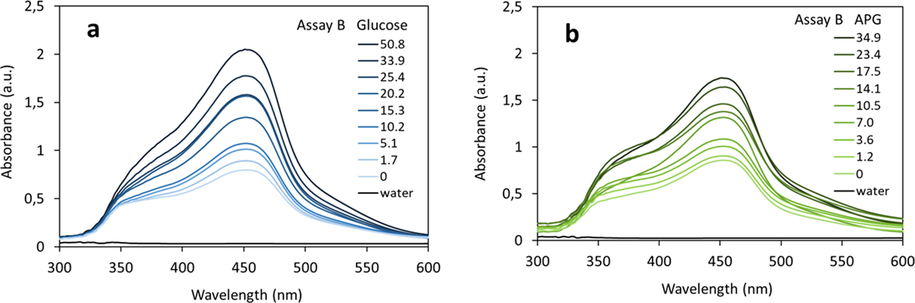
VIS absorbance of glucose (a) and APG (b) after performing assay B. The APG is hydrolyzed in 16 % sulfuric acid for 30 min. at 100 °C. Concentration ranges of glucose 0 – 50.8 mg/L and of APG 0 – 34.9 mg/L were determined.
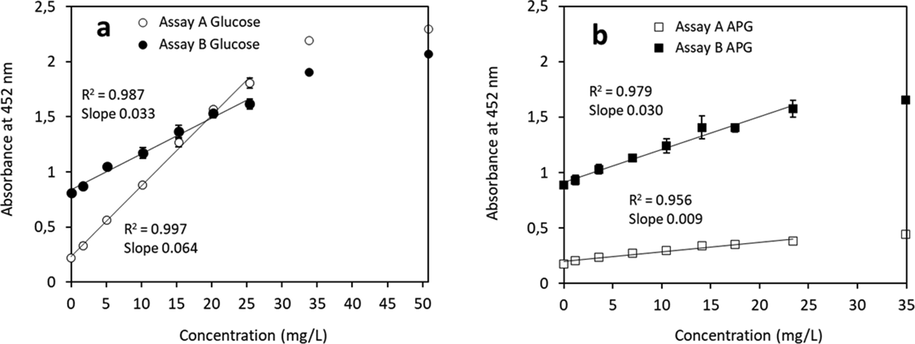
Standard curves based on VIS absorbance of glucose (a) and APG (b) determined with assay A and B. R2 values derived from linear regression calculations from 0 − 25 mg/L are indicated in the graph. Data points obtained from higher concentrations do exceed the linear fitting range. R2 values for 0–35 mg/L glucose are 0.992 (assay A & B) and for APG 0.949 (assay A) and 0.929 (assay B).
In assay B, much harsher hydrolysis condition is applied compared to assay A. In order to ensure the complete APG hydrolysis, the concentration of acid in the hydrolysis reaction was increased to 16 wt% sulfuric acid, the temperature to 100 °C as well as reaction time to 30 min. Furthermore, 1,2-propylene-glycol was added to prevent separation of the fatty alcohol and clouding of the reaction mixture. The concentration of 1,2-propylene-glycol was kept constant for all experiments both with glucose or APG. Thus, the change in absorbance is only due to the presence of hydrolytically formed glucose. The determined absorbance spectra of the reduced Cu(II)-neocuproine complex as function of an increasing concentration of reducing sugars are shown in Fig. 5. As discussed earlier, the presence of 1,2-propylene-glycol leads to an elevated absorbance of the blank sample (0 g/L sample) compared to assay A (Fig. 6a).
The correlation between the absorbance at 452 nm and the glucose concentration is linear up to 25–35 mg/L analyte (Fig. 6a, assay B). Higher glucose concentrations lead to absorbance values above 2 which already begin to deviate from the Lambert-Beer’s law. In case of APG hydrolysis, the presence of higher amounts of fatty alcohol exceeding the solubility limit in the presence of 1,2-propylene-glycol could also lead to non-linearity at APG concentration above 25 mg/L. As there was an excess of Cu(II)-neocuproine complex compared to the glucose concentration (almost 1000-fold), the observed non-linearity above 25 mg/L APG is not due to a limitation in amount of the neocuproine complex used, but most likely due to the solubility limit of fatty alcohol as discussed above.
3.4 Theoretical consideration of hydrolytically released glucose
The correlation between the absorbance and the calculated glucose present in APG is shown in Fig. 7 compared to the absorbance of pure glucose as analyte. Hydrolised sugars were assumed to be 100% glucose. Stereoisomers of glucose e.g. galactose and mannose, will lead to the same result as all components are hexoses. The data from assay A performed with low acid concentration are shown in Fig. 7a. The slope of 0.010 derived from the calculated glucose present in APG with a DP of 1.7 is lower compared to the slope of 0.060 derived from the experimental data with pure glucose, indicating that the hydrolytic cleavage is incomplete and not all calculated glucose units were released from the fatty alcohol.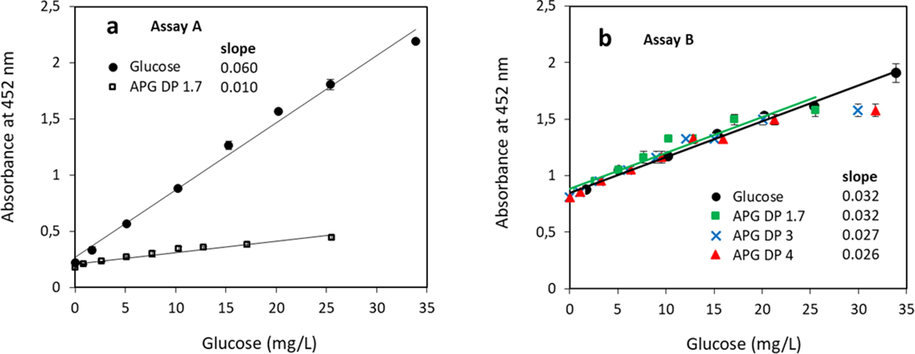
Correlation between the measured absorbance and the calculated glucose present in APG depending on its DP. Assay A (a) and assay B (b). For the calculations, an average of C9 alkyl chain and 1.7, 3 and 4 glucose units are used as indicated. The solid circles are derived from experimental data with pure glucose. Regression lines displayed for glucose (black) and APG with DP 1.7 (green).
In case the hydrolysis is performed at high acid concentration (assay B, Fig. 7b) the slopes derived from the calculated glucose present in APG with a DP of 1.7 and from the experimental data with pure glucose are both 0.032. This proves that the hydrolytic cleavage is complete and all glucose units are released into solution. A possible reason for the higher experimental absorbance values when compared to the calculated amount of glucose in APG with DP 1.7, is that some oligosaccharides are present in the technical APG. These saccharides then are split into free reducing sugars during the hydrolysis reaction. Glucose is not present in the APG mixture, which had been already proven by the analysis of the APG mixture without perceding hydrolysis reaction (Fig. 3, sample 6 and 7). In case the DP of glucose in APG would be 3 or 4, the hydrolytic cleavage at high APG concentrations is incomplete at APG concentrations above 35 mg/L.
3.5 Statistical analysis of APG quantification assays
Statistical analysis of the data derived from assay A and B is shown in Fig. 8. The calibration curves show linear relationship between the APG concentration and the absorbance. For assay A, a low detection limit (LOD) of 3.14 mg/L was calculated according to a one-tailed T-test (S’ 95%) for APG concentrations up to 25 mg/L. For assay B, the LOD was calculated with 2.97 mg/L for the same concentration range. The corresponding limit of quantification (LOQ) was calculated with 8.73 mg/L for assay A and 8.24 mg/L for assay B, respectively (Table 2).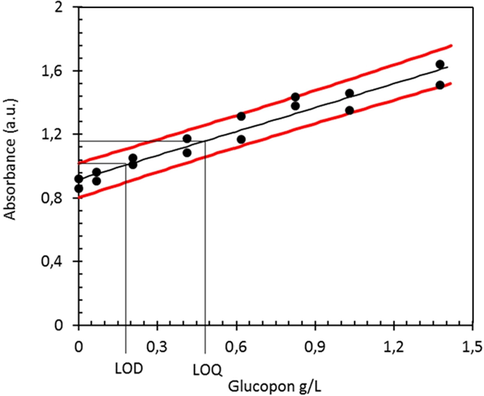
Confidence interval of assay B with APG indicating the LOD and LOQ values. Dotted lines: confidence interval for regression line, one-tailed T-test (S‘ of 95%).
Assay
Compound
Range
LOD
LOQ
mg/L
mg/L
mg/L
A
glucose
0–25.4
0.94
2.72
A
APG
0–23.4
3.14
8.73
B
glucose
0–25.4
2.20
6.13
B
APG
0–23.4
2.97
8.24
The simplicity of the analytical procedure with these low detection limits would allow the implementation in the production and process analytics as well as APG determination products. Usually, for the determination of low APG concentration in similar range, e.g. in environmental analysis and degradation studies, either enrichment or expensive instrumental equipment is needed such as HPLC coupled an evaporative light scattering detector (ELSD),(Amari et al., 2003; Czichocki et al., 2002) or with electron spray mass spectrometry.(Eichhorn and Knepper, 1999).
4 Conclusion
This study shows that the neocuproine assay following the acidic hydrolysis of APG is a simple but efficient methodology for APG quantification. The application of neocuproine for photometric quantification of reducing sugars is simple and less costly, compared to other sophisticated instrumental or enzymatic methodologies. In an optimized procedure, a lower limit of detection of 2.97 mg/L of APG was achieved. The limit of detection thus is comparable to more complex instrumental methods e.g. HPLC based techniques, which can detect APG’s in concentrations of 1.25 mg/L to 5 mg/L (Amari et al., 2003). Only with combination of HPLC with mass spectrometry lower concentrations of APG’s could be detected with a limit of 10 µg/L (Eichhorn and Knepper, 1999). As the amount of glucose units released depends on the type of APG, this methodology needs information of the chemical structure of the analyzed APG and a sample of APG is needed to develop the calibration curve. In case of applying the assay for other types of APGs, the conditions of the hydrolysis reaction must be adapted and the fatty alcohol formed must be kept in solution to avoid disturbing effects due to turbidity. The concentration of acid used for the hydrolysis reaction is of significant influence on the rate of the hydrolysis reaction and the slope of the calibration curve. This assay gives the opportunity for product control issues, e.g. analysis of the presence of glucose in an APG mixture, or for verifying the APG stability during application.
The high number of technically available formulations and products will require specific adaptation to a selected product or application. The results given in this work will allow a rapid and straightforward method development e.g. by direct calibration with a defined APG and by use of standard addition methods. For product formulations with known composition the selectivity of the method for APG’s can be justified by the possible chemical reactions of all components in the hydrolysis step. In case of unknown products the results must be assessed critically to avoid any interference from reducing components formed during the acid hydrolysis.
Funding acknowledgement
Financial support is gratefully acknowledged to the COMET Project “Textile Competence Center Vorarlberg 2 – FFG 882502”, funded within COMET – Competence Centers for Excellent Technologies – by BMK, BMDW as well as co-financing federal province Vorarlberg. The COMET-Funding Program is managed by the Austrian Research Promotion Agency FFG.
CRediT authorship contribution statement
Judith R. Büttler: Investigation, Writing – original draft. Thomas Bechtold: Conceptualization, Writing – review & editing. Tung Pham: Conceptualization, Writing – review & editing.
Declaration of Competing Interest
The authors declare that they have no known competing financial interests or personal relationships that could have appeared to influence the work reported in this paper.
References
- Online extraction and determination of octylglucoside by reversed-phase high-performance liquid chromatography with evaporative light-scattering detection. J. Chromatogr. Sci.. 2003;41:234-240.
- [Google Scholar]
- Apak, R., Güçlü, K., Özyürek, M., Esin Karademir, S., Altun, M., 2005. Total antioxidant capacity assay of human serum using copper(II)-neocuproine as chromogenic oxidant: The CUPRAC method. Free Radic. Res. 39, 949–961.
- Alkylpolyglycoside Möglichkeiten experimenteller Schulchemie in einem praxisorientierten Chemieunterricht. Chemkon. 1998;5:135-141.
- [Google Scholar]
- Spectrophotometric total reducing sugars assay based on cupric reduction. Talanta. 2016;147:162-168.
- [Google Scholar]
- Novel enzymatic assay for determination of alkyl polyglycosides with short chain fatty alcohols. Anal. Bioanal. Chem.. 2001;371:939-943.
- [Google Scholar]
- Heparin-stabilized gold nanoparticles-based CUPRAC colorimetric sensor for antioxidant capacity measurement. Talanta. 2018;187:148-155.
- [Google Scholar]
- Isolation of n-decyl-α(1→6) isomaltoside from a technical APG mixture and its identification by the parallel use of LC-MS and NMR spectroscopy. Anal. Chem.. 2000;72:4973-4978.
- [Google Scholar]
- Gas chromatography/mass spectrometry of alkyl polyglucosides as their trimethylsilylethers. Tenside Surf. Deterg.. 1998;35:181-184.
- [Google Scholar]
- Research on the emulsifying ability of surfactants in crude oil. Tenside Surf. Deterg.. 2013;50:434-440.
- [Google Scholar]
- Characterization of alkyl polyglycosides by both reversed-phase and normal-phase modes of high-performance liquid chromatography. J. Chromatogr. A. 2002;943:241-250.
- [Google Scholar]
- Investigations on the metabolism of alkyl polyglucosides and their determination in waste water by means of liquid chromatography-electrospray mass spectrometry. J. Chromatogr. A. 1999;854:221-232.
- [Google Scholar]
- Synthesis and characterization of some alkyl polyglycosides surfactants. J. Surf. Deterg.. 2008;11:129-137.
- [Google Scholar]
- A new redox mediator (Cupric-Neocuproine Complex)- modified pencil graphite electrode for the electrocatalytic oxidation of H 2 O 2: a flow injection amperometric sensor. ChemElectroChem.. 2020;7:649-658.
- [Google Scholar]
- Fact.MR, 2021. Alkyl Polyglucoside Market [WWW Document]. URL https://www.factmr.com/report/747/alkyl-polyglucoside-market.
- Specific and sensitive determination methods for 1,5-Anhydro-D-fructose. J. Appl. Glycosci.. 2001;48:139-142.
- [Google Scholar]
- Copper(II)-neocuproine reagent for spectrophotometric determination of captopril in pure form and pharmaceutical formulations. Arab. J. Chem.. 2010;3:159-165.
- [Google Scholar]
- Spectrophotometric determination of ascorbic acid using copper(II)-neocuproine reagent in beverages and pharmaceuticals. Talanta. 2005;65:1226-1232.
- [Google Scholar]
- Evaluation of different alkyl polyglycoside surfactants and their combination with alpha olefin sulphonate for detergency. J. Dispers. Sci. Technol.. 2006;27:265-269.
- [Google Scholar]
- Membrane protein purification and crystallization: a practical guide. Elsevier; 2003.
- Near-infrared spectroscopy as a convenient analytical method for alkyl polyglycosides. J. Pharm. Biomed. Anal.. 2001;26:73-78.
- [Google Scholar]
- Characterization of mixtures of alkyl polyglycosides (plantacare) by liquid chromatography-electrospray ionization quadrupole time-of-flight mass spectrometry. Pharm. Res.. 2004;21:2347-2353.
- [Google Scholar]
- Analytik: Daten, Formeln, Übungsaufgaben (109th ed.). Berlin: De Gruyter; 2019.
- Interaction of membrane proteins and lipids with solubilizing detergents. Biochim. Biophys. Acta - Biomembr.. 2000;1508:86-111.
- [Google Scholar]
- Alkyl polyglycoside: a green and efficient surfactant for enhancing heavy oil recovery at high-temperature and high-salinity condition. J. Pet. Explor. Prod. Technol.. 2019;9:2671-2680.
- [Google Scholar]
- Mann, F.V., Everson, P.T., Lentsch, E.S., 2004. Reinigungsmittelzusammensetzung und Verfahren zum Entfernen von Schmutz. DE 600 08 366 T2.
- Morris, T., Hansberry, M., Hessel, J.F., 1996. Industrial and institutional liquid cleaning compositions containing alkyl polyglycoside surfactants. WO1996025479A1
- Determination of reducing sugars by the neocuproine method using flow injection analysis. Food Chem.. 1992;43:65-69.
- [Google Scholar]
- Binding of alkyl polyglucoside surfactants to bacteriorhodopsin and its relation to protein stability. Biophys. J.. 2008;94:3647-3658.
- [Google Scholar]
- Alkyl polyglucosides as components of water based lubricants. J. Surf. Deterg.. 2013;16:369-375.
- [Google Scholar]
- Selective solubilization of microsomal electron-transfer proteins with alkylglucoside. Anal. Sci.. 1997;13:747-751.
- [Google Scholar]
- Spectrophotometric determination of vitamin E (α-tocopherol) using copper(II)-neocuproine reagent. Talanta. 1997;44:249-255.
- [Google Scholar]


