

Translate this page into:
DNA binding ability mode, spectroscopic studies, hydrophobicity, and in vitro antibacterial evaluation of some new Fe(II) complexes bearing ONO donors amino acid Schiff bases
⁎Corresponding author. ahmed_benzoic@yahoo.com (Ahmed M. Abu-Dief)
-
Received: ,
Accepted: ,
This article was originally published by Elsevier and was migrated to Scientific Scholar after the change of Publisher.
Peer review under responsibility of King Saud University.

Abstract
New series of Fe(II) complexes and Schiff base amino acids have been designed and synthesized from the bioactive ligands by condensation of 5-bromo-2-hydroxybenzaldehyde and α-amino acids (l-alanine (ala), l-phenylalanine (phala), l-aspartic acid (aspa), l-histidine (his) and l-arginine (arg)). Elemental analyses, infrared, ultraviolet–visible spectra, as well as conductivity and magnetic susceptibility measurements are used to elucidate the structure of the newly prepared iron(II) complexes. Moreover, the stoichiometry and the stability constants of the prepared complexes have been determined spectrophotometrically. The results suggest that the prepared Schiff base amino acid ligands behave as dibasic tridentate ONO ligands and bind to Fe(II) in octahedral geometry according to the general formula [Fe(bs:aa)2].nH2O. The DNA interaction of these complexes was tested at pH = 7.2, by using electronic absorption spectra and viscosity measurements. The experimental results indicated that the investigated complexes could bind to DNA via intercalative mode and showed a different DNA binding activity according to the sequence: bsari > bshi > bsali > bsasi > bsphali. Moreover, the prepared compounds are tested for their in vitro antibacterial activity against three types of bacteria, Escherichia coli, Pseudomonas aeruginosa and Bacillus cereus. The results show that the metal complexes are more reactive with respect to their corresponding Schiff base ligands.
Keywords
Amino acid
Hydrophobicity
Fe(II) complexes
Calf Thymus DNA
Binding constant
Antibacterial

1 Introduction
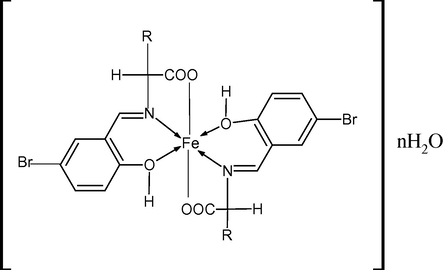
Schiff base complexes possess a wide variety of activities against bacteria (Prashanthi et al., 2008), fungi (Daniel et al., 2008), and certain types of tumors (Galal et al., 2009). They have been used as radiotracers in nuclear medicine and drugs (Du Preez et al., 1984). Some drugs show increased activity when administered as metal chelates and inhibit the growth of tumors (You et al., 2004). Moreover, the development in the field of bioinorganic chemistry has increased the interest in Schiff base complexes, since it has been recognized that many of these complexes may serve as models for biologically important species (Ghosh et al., 2010; Zhong et al., 2007; Abdallah et al., 2009; Liu and Yang, 2009; Sathisha et al., 2008). It is clear that Schiff base transition metal complexes are very important chelates because they are cheap, easy to synthesize and possess chemical and thermal stability. Moreover, these complexes have extensive applications in the fields of medicine, photo and magnetic chemistry (Yang et al., 2006), and electrochemistry (Chiericato Junior et al., 2004). Schiff base amino acid complexes act as good chelating agents (Nath and Yadov, 1997), behave as efficient biologically active (El-Said et al., 2001) and cytotoxic agents (Wang et al., 2002). In addition, Schiff base amino acid complexes are considered to constitute new kinds of potential antibacterial and anticancer reagents (Wang et al., 2005). From a bioinorganic point of view, iron Schiff base complexes provide useful structural and electronic models for the similarly coordinated sites found in the heme iron enzymes. Moreover, these complexes are also important for the asymmetric oxidation of organic substrates, since their structure and catalytic activity are analogous with those of iron porphyrins (Canali and Sherrington, 1999). The investigation of drug-DNA interaction is of importance for understanding the molecular mechanism of drug action and for the design of specific DNA-targeted drug. The possible interaction model between small molecules and DNA generally follows three models (i) electrostatic binding between cation species and negative charge DNA phosphate (ii) groove binding in which molecule bound in groove of DNA involving hydrogen bonding, van der Waals interaction force and (iii) intercalative binding involves drug and base pairs. Studying the interaction between transition metal complexes and DNA has attracted many interests (Erkkila et al., 1999; Vijayalakshmi et al., 2000; Liu et al., 2004; Wang et al., 2006; Raman et al., 2007; Chaviara et al., 2008; Mahalakshmi and Rajavel, 2010; Sabolová et al., 2011) due to their importance in cancer therapy, design of new types of pharmaceutical molecules and molecular biology. On the other hand, few studies were carried out concerning the interaction of DNA with Schiff base amino acid complexes (Cheng et al., 2009; Begum et al., 2010; Jianfanga et al., 2011). In addition to, the capability of transition metal complexes of cleaving DNA on irradiation with visible light, they have important potential applications in photodynamic therapy (PDT) of cancer Patra et al., 2009. PDT has emerged as a non-invasive mode of treatment for cancer in which selective photoactivation of the drug at the cancer cells leads to damage of the photo-exposed cells only, leaving healthy cells unaffected (Bonnett, 2000; Henderson et al., 2000). Bearing the above facts in mind, and as a part of our continuing research (Abdel-Rahman et al., 2013a), the present study deals with preparation and characterization of some novel Fe(II) Schiff base amino acid complexes. Moreover, the interaction with DNA of the studied complexes is screened. The choice of these types of amino acids Schiff bases under study is to be helpful to understand the interaction modes and their different structural features on the side chains that may result in different DNA binding modes by hydrogen bonding, van der Waals force or hydrophobic interaction. The knowledge gained from this study should be useful for the development of potential probes for DNA structure and new therapeutic reagents for tumors and other diseases as well as further understanding of the pharmacological effects of these complexes. Furthermore, In vitro antibacterial activity of the prepared compounds is screened. The structures of the Schiff base amino acid ligands studied in this investigation are shown in Scheme 1 .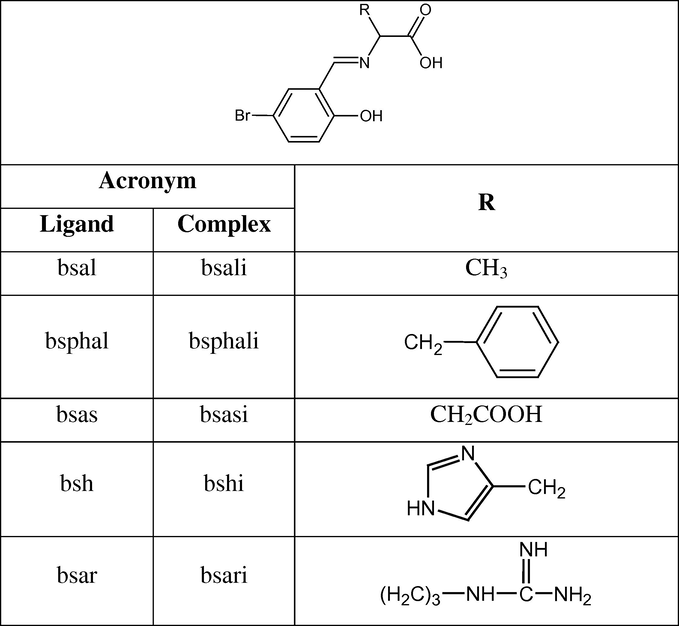
Structures and abbreviations of the Schiff base ligands and their corresponding complexes.
2 Experimental
All the starting materials of chemicals used in this investigation such as 5-bromo-2-hydroxybenzlaldehyde (bs), amino acids, the metal salt (FeSO4.(NH4)2SO4.6H2O), Calf thymus DNA (CT-DNA) and Tris[hydroxymethyl]-aminomethane (Tris) were purchased from Sigma–Aldrich Chemie (Germany). Spectroscopic grade ethanol and HCl products were used.
2.1 Preparation of Schiff base amino acid ligands
The investigated Schiff base ligands were synthesized according to the literature (Sakiyan et al., 2004; Abdel-Rahman et al., 2013b). 5 mmol of the 5-bromo-2-hydroxybenzlaldehyde was dissolved in appropriate volume of ethanol and added to 5 mmol of each amino acid (l-alanine, l-phenylalanine, l-aspartic acid, l-histidine, l-arginine) solution in aqueous-ethanol mixture (50% ethanol). The mixture was refluxed for 5 h and the solution was rotary evaporated to 1/4 of its original volume and then cooled to ambient temperature. After one day, the yellow crystals were obtained, filtered off and washed with ethanol then with diethyl ether and finally dried in vacuo over silica gel. The obtained yield for the prepared ligands was 72–83%. The results of the elemental analysis are in Table 1.
Compound
Empirical formula (formula weight)
Molar conductance Λm (Ω−1 cm2 mol−1)
Magnetic moment, BM
M. P. and decom. temp. (oC)
Analysis Found (Calculated)
C
H
N
Br
bsal
C10H10NO3Br (272.09)
_
_
86
44.27
3.61
5.22
29.45
(44.14)
(3.70)
(5.15)
(29.37)
bsali
C20H22FeN2O8Br2 (634.046)
37.00
4.34
190
38.11
3.43
4.29
25.11
(37.88)
(3.50)
(4.42)
(25.20)
bsphal
C16H14NO3Br (348.18)
_
_
106
55.32
4.21
3.91
22.78
(55.19)
(4.12)
(4.02)
(22.95)
bsphali
C32H32FeN2O9Br2 (804.246)
64.00
4.82
210
47.76
3.92
3.26
19.71
(47.79)
(4.01)
(3.48)
(19.87)
bsas
C11H10NO3Br (284.10)
_
_
92
46.52
3.52
4.85
27.86
(46.46)
(3.55)
(4.93)
(27.81)
bsasi
C22H20FeN2O11 Br2 (704.05)
47.50
4.03
195
37.62
2.95
3.85
22.65
(37.53)
(2.86)
(3.98)
(22.70)
bsh
C13H12N3O3Br (338.16)
_
_
110
46.28
3.46
12.31
23.75
(46.17)
(3.58)
(12.43)
(23.63)
bshi
C26H28FeN6O9Br2 (784.194)
55.10
4.55
310
40.02
3.71
10.64
20.21
(39.82)
(3.60)
(10.72)
(20.38)
bsar
C13H17N4O3Br (357.21)
_
_
101
43.86
4.73
15.81
22.44
(43.71)
(4.80)
(15.69)
(22.37)
bsari
C26H36FeN8O8Br2 (804.278)
61.00
4.75
217
39.03
4.38
13.81
19.65
(38.82)
(4.51)
(13.94)
(19.87)
2.2 Preparation of Fe(II) Schiff base amino acid complexes
An ethanolic solution of 5 mmol (20 ml) from each prepared ligand was treated with ethanolic solution of 2.5 mmol FeSO4.(NH4)2SO4.6H2O (20 ml). In order to avoid oxidation of Fe(II), a few drops of glacial acetic acid were added (Shaker et al., 2003). The resulting solution was stirred magnetically for 6 h under nitrogen at 25 °C then evaporated over night. The resulting solid product was filtered, washed with water and dry ether respectively and finally dried in a desiccator over anhydrous CaCl2 at room temperature. The prepared complexes were recrystallized from ethanol. The obtained yield for the prepared complexes was 73–82%.
2.3 Physicochemical properties of the prepared ligands and their Fe(II) complexes
All the prepared Schiff base amino acid ligands and their complexes were subjected to (C, H, N and Br) elemental analysis which was performed at the analytic unit of the central laboratory of Cairo University by Elemental analyzer Perkin-Elmer model 240c. Conductivity measurements were carried out using JENWAY conductivity meter model 4320 at 298 K using ethanol as solvent. Magnetic moment measurements of the investigated complexes were carried out on a vibrating sample magnetometer (MSB-AUTO). Infrared spectra of the metal chelates were monitored using Shimadzu FTIR model 8101 in the region 4000–400 cm−1 using dry KBr disks with a high resolution of 2 cm−1. UV–Vis spectra of the prepared ligands and their Fe(II) complexes in ethanol were monitored using 10 mm matched quartz cells on PG spectrophotometer model T + 80. The measurement of spectrum was thermostatically controlled by an ultrathermostate (CRIOTERM model 190) water circulator. The values of absorbance of 5 × 10⁻³ M of each complex were measured at different pH values. The pH values were adjusted by using a series of Britton universal buffers (Britton, 1952). pH measurements were carried out using HANNA 211 pH meter at 298 K.
2.4 Solubility measurements
Solubilities of the prepared complexes were measured at 298 ± 0.1 K by agitating a generous excess of each complex with the appropriate water–ethanol and water-dimethyl sulfoxide mixtures in a thermostated vessel for seven hours. This time is enough to prepare the best saturated solution from the solid compound in aqueous-solvent mixtures. Then portions of supernatant from the saturated solution were removed and centrifuged rapidly using a centrifuge before withdrawing an aliquot by using a micropipette. The solution was diluted as necessary. Then the absorbance was measured at λmax for each complex (Abu-Gharib et al., 2011, 2013). All aliquots of equilibrated solutions were diluted with the solvent and the dependences of λmax on solvent composition, were found to be very small for the studied complexes, and thus ignored in calculation of solubilities. The customary precautions were taken to avoid heating of aliquots of saturated solutions before dilution and to prevent any solid material being carried through with samples of saturated solutions. The spectra were measured at different sampling times to verify a constant concentration has been achieved. The concentrations of the saturated solutions were determined by applying Beer’s law (Aabs = ɛcl) where “ɛ” is the molar extension coefficient in dm3 mol−1 cm−1, “c” is the concentration in mol dm−3 and “l” is the length of the cell in cm. The molar extension coefficient “ɛ” in dm3 mol−1 cm−1 for each complex was determined from the least square of the standard curve using Beer’s law.
2.5 DNA binding experiments
2.5.1 Methodology for DNA binding using absorption spectroscopic studies
All the experiments involving the interaction of the complexes with DNA were carried out in Tris–HCl buffer (50 mM, pH 7.2). CT-DNA was purified by centrifugal dialysis before use. A solution of calf thymus DNA in the buffer gave a ratio of UV absorbance at 260 and 280 nm of about >1.86, indicating that the DNA was sufficiently free from protein contamination (Murmur, 1961; Raman et al., 2011; Abdel-Rahman et al., 2013a,b). The concentration of DNA was determined by monitoring the UV absorbance at 260 nm using ε260 = 6600 mol−1 cm2. The stock solution was stored at 4 °C and used within only one day. Spectrophotometeric titration experiment was performed by maintaining the metal complex concentration constant while varying the nucleic acid concentration in the interaction medium. The absorption due to free CT-DNA was eliminated by adding an equimolar CT-DNA to pure buffer solution in the reference compartment and the resulting spectra were considered to result from the metal complexes and the DNA – metal complex aggregates. From the absorption data, the intrinsic binding constant (Kb) was determined by plotting [DNA]/(εa − εf) vs. [DNA] according to the following equation: Where, [DNA] is the concentration of DNA in base pairs, εa, εf and εb are the apparent, free and fully bound complex absorption coefficients, respectively. In particular, εf was determined from the calibration curve of the isolated metal complex; following the Beer’s law. εa was determined as the ratio between the measured absorbance and the metal(II) complex concentration, Aobs/[complex]. The data were fitted to the above equation with a slope equal to 1/(εb − εf) and y-intercept equal to 1/[Kb(εb − εf)] and Kb was obtained from the ratio of the slope to the intercept (Wolf et al., 1987). The standard Gibb’s free energy for DNA binding was calculated from the following relation (Sabolová et al., 2011):
2.5.2 Viscosity experiments for interaction of the prepared complexes with DNA
Viscosity measurements were carried out using an Oswald microviscometer, maintained at constant temperature at 25 ± 1 °C in thermostat. The flow times were recorded for different concentrations of the complex (10–250 μM), maintaining the concentration of DNA constant (250 μM). Mixing of the solution was achieved by bubbling the nitrogen gas through the viscometer. The average value of the three measurements was used to determine the viscosity of the samples. The buffer flow time in seconds was recorded as t°. The relative viscosities for DNA in the presence (η) and absence (η°) of the complex were calculated using the relation η = (t − t°)/t°. Where, t is the observed flow time in seconds and the values of the relative viscosity (η/η°) were plotted against 1/R (R = [DNA]/[Complex]) (Satyanarayana et al., 1992).
2.6 Antibacterial screening (in vitro)
All the synthesized Schiff base ligands and their corresponding Fe(II) complexes were screened in vitro for their antibacterial activity against two Gram-negative (Escherichia coli, Pseudomonas aeruginosa) and one Gram-positive (Bacillus cereus) bacterial strains using agar well diffusion method (Raman et al., 2001). Ofloxacin and Ciprofloxacin were used as standards for antibacterial activity. Each compound was dissolved in dimethyl sulfoxide at different concentrations (5, 10 and 20 mg/ml). DMSO was used as solvent and also for control. DMSO was found to have no antimicrobial activity against any of the test organisms. 1 cm3 of a 24 h broth culture containing 106 CFU/cm3 was placed in sterile Petri-dishes. Molten nutrient agar (15 cm3) maintained at ca. 45 °C was then poured into the Petri-dishes and allowed to solidify. Then holes of 6 mm diameter were formed in the agar using a sterile cork borer and these holes were completely filled with the test solutions. The plates were incubated for 24 h at 37 °C. The zones of inhibition based upon zone size around the wells were measured.
3 Results and discussion
3.1 Characterization of the prepared complexes
3.1.1 Melting points and decomposition temperature measurements
The prepared complexes are stable in the air. The decomposition temperature of all prepared complexes is higher than the reported melting points of the Schiff base ligands, so it is differing from all reagents used in the preparation (cf. Table 1). This can be used as an evidence for the higher thermal stability of reagents via complexation with the Fe(II) ion Banerjee et al., 1984 The formation of the investigated Schiff base amino acid ligands and their complexes is represented in Scheme 2.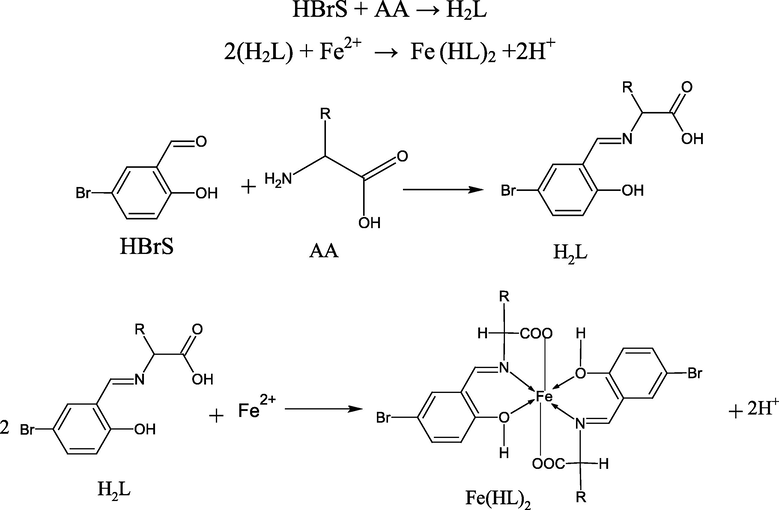
HBrS = 5-bromosalicylaldehyde, AA = amino acid (ala, phala, aspa, his or arg), H2L = Schiff base amino acid ligand, Fe(HL)2 = Fe(II) Schiff base amino acid complexes (bsali, bsphali, bsasi, bshi or bsari).
3.1.2 Microanalyses and molar conductance measurements
Microanalyses data of the prepared complexes are reported in Table 1 and suggested that the Schiff base ligands act as tridentate and form complexes in 1:2 ratio metal to ligand. Thus the general formula of the prepared complexes is suggested to be [Fe(HL)2]·nH2O. The presence of water as crystalline water is confirmed by heating the prepared complexes at 110 °C for about 2 h and the obtained weight loss percent data at 110 °C, for crystallization water, were consistent with the corresponding microanalytical data. The following results show a comparison between thermogaravimetric data at 110 °C and microanalytical data for crystallization water in the prepared complexes: {bsali: 5.5 (5.68)%; bsphali: 6.75 (6.72)%; bsasi: 2.51 (2.56)%; bshi: 6.85 (6.89)%; bsari: 4.49 (4.48)%}.
Consequently the divalent anions of the Schiff base amino acid ligand are coordinated to the central metal Fe(II) ion. The measured molar conductance values of 10−3–10−4 molar solutions of the prepared Fe(II) complexes in ethanol were found to be in the range 37–64 ohm−1 cm2 mol−1 (cited in Table 1) which is in agreement with the non-electrolytic nature of the complexes (Abdel-Rahman et al., 2013a,b). The non electrolytic nature of the investigated complexes is matched with microanalytical data.
3.1.3 Magnetic moment measurements
In a magnetic field, the paramagnetic compounds will be attracted while the diamagnetic compounds repelled. For paramagnetic substances, the flux is greater within the substance than it would be in vacuum. Therefore, paramagnetic substances will have positive susceptibilities. Thus, the magnetic susceptibility measurements provide information regarding the geometric structure of the complexes. Magnetic susceptibility measurements showed that the prepared complexes have paramagnetic character and suggested high spin values (4.03–4.75 BM) i.e., the studied Schiff base amino acid ligands are so weak that they exhibited low t2g and eg d-splitting of the octahedral structures of the complexes (Canpolat and Kaya, 2002; El-Tabl et al., 2008; Abdel-Rahman et al., 2013a,b).
3.1.4 Infrared spectra of the prepared ligands and their Fe(II) complexes
The IR spectra provide valuable information regarding the nature of functional groups attached to the metal atom (Raman et al., 2007). The basic theory involved is that the stretching modes of the ligands changes upon complexation due to weakening/strengthening of the bonds involved in the bond formation resulting in subsequent change in the position of the bands appearing in the IR spectrum. To achieve an idea about the groups involved in the complex formation as well as the influence of the electrical field of the central metal ion on the charge distribution within the ligand, the difference between the spectrum of the free ligand and that of the complexes can full into three types:
-
Shift in band position
-
Intensity changes.
-
Band splitting and disappearance of bands and appearance of new bands.
The IR spectra of the investigated complexes are compared with those of the free ligands to determine the coordination sites which may be involved in chelation (cf. Table 2). The basic theory involved is that the stretching modes of the ligands change upon complexation due to weaking/strengthening of the bonds involved in the bond formation resulting in subsequent change in the position of the bands appearing in the IR spectrum. The spectrum of Schiff base ligands exhibits a characteristic band at 3396–3446 cm−1 due to the stretching vibration of the OH group υ(OH). On the other hand, the recorded IR spectra of all the prepared complexes (cf. Table 2) show broad band at 3451–3414 cm−1 which have been assigned to υ(OH) stretching vibration of water molecules, in accordance with the results of the elemental analysis listed in Table 1 (Shaker et al., 2003; Sharma and Dubey, 1994). The spectrum of the ligands show a sharp band at 1664–1638 cm−1, due to an azomethine group (C⚌N) stretching vibration which indicates the presence of the imine structure (Begum et al., 2010). This band is shifted to lower wave numbers in the spectra of all complexes (1645–1619 cm−1) indicating the involvement of the nitrogen atom of the azomethine group in the coordination to the metal ion (Thankamony and Mohanan, 2007; Garg et al., 2008). In the IR spectra of the Schiff bases, the two bands appeared at 1601–1577 and 1462–1406 cm−1 are attributed to the asymmetric and symmetric stretching vibrations of the carboxylate group υas(COO) and υs(COO). These bands are shifted to lower wave number values upon complexation indicating that the oxygen atom of the carboxylate group is coordinated to the metal ion (cf. Table 2) Sharma and Dubey, 1994; Nakamoto, 1978. It is worth noting that the asymmetric vibration band of COO− is obscured by the high intensity of band of the C⚌C stretching vibration (Teyssie and Charette, 1963; Abdel-Rahman et al., 2013b). All Schiff base ligands showed an absorption band in the region of 1374–1318 cm−1 which can be attributed to the stretching vibration of the phenolic (C–O) group υ(CO)(phenolic). The shifting of these bands to lower wave number values upon complexation indicates that the oxygen atoms of the phenolic groups are coordinated to the metal ion (Sharma and Dubey, 1994). The bands observed in the regions 2940–2871 and 3054–3031 cm−1 can be assigned to υ(C–H) aliphatic and υ(C–H) aromatic stretching vibrations, respectively (Abdel-Mawgoud, 1998). The IR bands found at 3359 and 3168 cm−1 for the bsari complex which contains an arginine moiety could be assigned to the presence of the terminal guanidinium group (Ibrahim et al., 1999). Assignment of the proposed coordination sites is further supported by the appearance of two new medium bands at 553–540 and 478–450 cm−1 which could be attributed to υ(Fe–N) and υ(Fe–O), respectively (Thomas et al., 1995; Abdel-Rahman et al., 2013a). s = Strong, m = medium, w = weak.
Compound
υ(OH)/H2O stretching
υ (–C⚌N) stretching
υ(C = C) stretching
υ(C–H) aromatic stretching
υ(C–H) aliphatic stretching
υs(COO-)
υas(COO-)
υ(C–O) phenolic
υ(Fe–N)
υ(Fe–O)
υ(–NH2) stretching
υ(–NH) stretching
Assignment
bsal
3422 (w)
1651 (s(
1463 (m)
3084 (w)
2875 (w)
1416 (m)
1593 (w)
1364 (m)
–
–
–
–
bsali
3432 (m)
1645 (s)
1462 (m)
3045 (w)
2871(w)
1374 (w)
1584(w)
1275 (m)
540(w)
478(m)
–
–
bsphal
3440 (w)
1659 (s)
1471 (m)
3123 (w)
2871 (w)
1408 (w)
1601 (m)
1318 (m)
–
–
–
–
bsphali
3394 (m)
1619 (s)
1451 (w)
3040 (w)
2924 (w)
1366 (w)
1548(w)
1292 (w)
548(w)
457(w)
–
–
bsas
3421 (m)
1638 (s)
1462 (m)
3072 (w)
2935 (w)
1462 (m)
1587 (w)
1349 (m)
–
–
–
–
bsasi
3414 (m)
1628 (s)
1454 (w)
3038 (w)
2935 (w)
1375 (m)
1556(w)
1282 (m)
553 (w)
450 (w)
–
–
bsh
3396 (m)
1645 (s)
1467 (m)
3035 (w)
2876 (w)
1418 (m)
1581 (w)
1351 (m)
–
–
–
3151 (m)
bshi
3437 (m)
1630 (s)
1453 (m)
3035 (w)
2925 (w)
1360 (m)
1523(w)
1298 (w)
550 (m)
460(w)
–
3130 (w)
bsar
3446 (w)
1664 (s)
1467 (m)
3045 (w)
2937 (w)
1406 (m)
1577 (w)
1374 (w)
–
–
3337 (m)
3147 (m)
bsari
3451 (m)
1627 (s)
1454 (m)
3031 (w)
2940 (w)
1364 (m)
1532(w)
1293 (m)
549 (w)
465 (w)
3359 (w)
3168 (m)
3.1.5 Electronic spectra
The electronic absorption spectra of ethanolic solutions of ligands and their complexes were recorded at the wavelength range 800–200 nm and at 298 K. The absorption region, the molar extinction coefficients and the band assignment of the different bands in the recorded spectra of the complexes were resulted from Figs. 1, 2). The ligand exhibits absorption bands in UV–Vis region around 380 and 410 nm which is assigned to n → π∗ transition originating from the amide or imine function of the Schiff base ligand (Ahmad et al., 2002). Another band is observed below 306 nm, this band is assigned to π → π∗ transition. The spectra of the complexes are dominated by intense intraligand bands centered at λmax = 368–398 nm (εmax = 2744–1310 mol−1 cm2) and charge transfer bands centered at 428–440 nm (εmax = 1518–824 mol−1 cm2), since it is known that metal/metalloids are capable of forming dπ–pπ bonds with ligands containing nitrogen and oxygen as donor atoms (West and Nasar, 1999). Furthermore, the L → MCT band is followed by a long and a broad band lying in the region 458–494 nm (εmax = 2650–900 mol−1 cm2). This band could be mainly attributed to the d → d transition in the octahedral structure of the prepared complexes (Shaker et al., 2003; Lever, 1968; Abdel-Rahman et al., 2013b).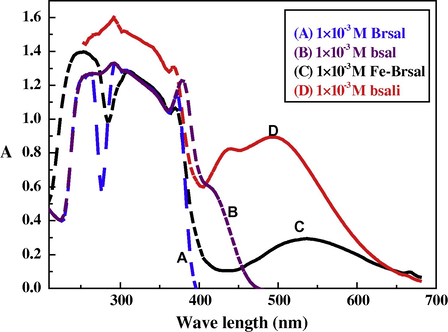
Molecular electronic spectra of bsali complex and its components in ethanol at 298 K.
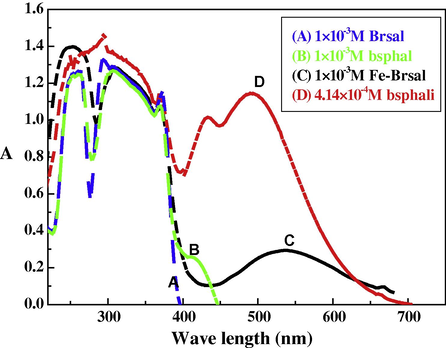
Molecular electronic spectra of bsphali complex and its components in ethanol at 298 K.
3.1.6 Determination of the stoichiometry of the investigated complexes
The spectrophotometric methods were utilized to establish the stoichiometry of various Schiff base amino acid complexes. The simplest spectrophotometric technique adopted to study the equilibria in solutions of complex compounds, is the molar ratio method (Yoe and Jones, 1944; El-Shiekh et al., 2011; Shah and Parmar, 2011) and the continuous variation method (Shah and Parmar, 2011; Job, 1928), as shown in Fig. 3. The results suggest the possible formation of 1:2 complexes as presented in Scheme 3. The curves of the continuous variation method (Fig. 3) displayed maximum absorbance at mole fraction Xligand = 0.65–0.7 indicating the formation of complexes with metal ion to ligand ratio 1:2. Moreover, the data resulted from applying the molar ratio method support the same metal ion to ligand ratio of the prepared complexes (see supplementary material) (see Fig. 1).![Continuous variation plots for the prepared complexes in aqueous-alcoholic mixture at [bsali] = 2 × 10⁻³ M, [bsphali] = 1 × 10⁻³ M, [bsasi] =5 × 10⁻³ M, [bshi] = 1 × 10⁻³ M, [bsari] = 1 × 10⁻³ M and 298 K.](/content/184/2017/10/2_suppl/img/10.1016_j.arabjc.2013.07.010-fig5.png)
Continuous variation plots for the prepared complexes in aqueous-alcoholic mixture at [bsali] = 2 × 10⁻³ M, [bsphali] = 1 × 10⁻³ M, [bsasi] =5 × 10⁻³ M, [bshi] = 1 × 10⁻³ M, [bsari] = 1 × 10⁻³ M and 298 K.
The suggested structures of bsali, bsphali, bsasi, bshi complexes, bsali: n = 2, bsphali and bshi: n = 3, bsasi: n = 1 (R as shown in Scheme 1).
3.1.6.1 Evaluation of the apparent formation constants of the synthesized complexes
The formation constants (Kf) of the studied Fe(II) Schiff base amino acid complexes formed in solution were obtained from the spectrophotometric measurements by applying the continuous variation method (Shaker et al., 2003; Issa et al., 2006) (cf. Table 3) according to the following relation:
Where, Am is the absorbance at the maximum formation of the complex, A is the arbitrary chosen absorbance values on either side of the absorbance mountain col (pass) and C is the initial concentration of the metal. As mentioned in Table 3, the obtained Kf values indicate the high stability of the prepared complexes. The values of Kf for the studied complexes increase in the following order: bsari > bsali > bsphali > bshi > bsasi. Moreover, the values of the stability constant (pK) and Gibbs free energy (ΔG≠) of the investigated complexes are cited in Table 3. The negative values of Gibbs free energy mean that the reaction is spontaneous and favorable.
Complex
Type of complex
Kf
pK
ΔG≠ kJ mol−1
bsali
1:2
3.22 ± 0.02 × 10⁹
9.98
−57.03
bsphali
1:2
3.67 ± 0.02 × 10⁹
9.67
−54.56
bsasi
1:2
1.31 ± 0.02 × 10⁹
8.86
−50.57
bshi
1:2
1.18 ± 0.02 × 10¹⁰
8.96
−51.13
bsari
1:2
3.15 ± 0.02 × 10⁹
10.44
−59.55
The pH-profile (absorbance vs. pH) presented in Fig. 4 showed typical dissociation curves and a wide stability pH range (4–10) of the studied complexes. This means that the formation of the complex greatly stabilizes the Schiff base amino acid ligands. Consequently, the suitable pH range for the different applications of the prepared complexes is from pH = 4 to pH = 10.![Dissociation curves of the prepared bromosalicylidene Schiff base amino acid Fe(II) complexes in aqueous alcoholic mixture at [complex] = 5 × 10⁻³ M and 298 K.](/content/184/2017/10/2_suppl/img/10.1016_j.arabjc.2013.07.010-fig7.png)
Dissociation curves of the prepared bromosalicylidene Schiff base amino acid Fe(II) complexes in aqueous alcoholic mixture at [complex] = 5 × 10⁻³ M and 298 K.
Based on the results of elemental analysis, molar conductance, magnetic susceptibility, infrared and electronic spectra, the suggested structure of the complexes is shown in Scheme 3, 4 .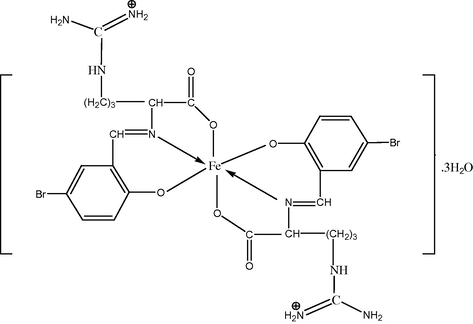
The suggested structure for bsari complex.
3.1.7 Effect of hydrophilic/hydrophobic character of the investigated complexes on their solubilities
The hydrophobicity of the investigated Fe(II) Schiff base amino acid complexes can be rationalized to the low solubility of the investigated complexes in aqueous medium (cf. Tables 4). Moreover, the results of negative values transfer chemical potentials of CQ∗∗∗ the investigated Fe(II) Schiff base amino acid complexes in (cf. Table 5) can mainly be ascribed to of the hydrophobic nature of the investigated complexes. It observed that the hydrophobicity of the investigated complexes leads to stabilization of them with increasing solvent percent. The order of hydrophobicity can increase in the direction:
Thus the results show preferential solvation by the solvent as molecule size increases. Also the order of hydrophobicity of bromosalicylidene Schiff base amino acid complexes could be attributed to the effect complexes.
Solvent
Complex
104 Solubility mol dm−3
0
20
40
60
EtOH
bsali
1.89
4.97
11.30
16.80
bsphali
0.25
0.90
5.59
9.76
bsasi
2.10
4.12
8.43
15.18
bshi
0.41
1.25
2.75
7.50
bsari
1.40
3.92
8.92
14.50
DMSO
bsali
1.89
7.75
14.42
22.51
bsphali
0.25
3.75
10.61
13.96
bsasi
2.10
7.55
11.46
20.39
bshi
0.41
3.91
5.89
11.15
bsari
1.40
6.85
12.34
19.40
Solvent
Complex
δmμθ kJ mol−1
20
40
60
EtOH
bsali
−2.42
−4.43
−5.42
bsphali
−3.16
−7.7
−9.05
bsasi
−1.67
−3.45
−4.9
bshi
−2.76
−4.72
−7.21
bsari
−2.55
−4.57
−5.8
DMSO
bsali
−3.5
−5.04
−6.14
bsphali
−6.71
−9.29
−9.97
bsasi
−3.17
−4.21
−5.64
bshi
−5.59
−6.61
−8.19
bsari
−3.94
−5.4
−6.52
3.1.7.1 Effect of solvent polarity on the values of transfer chemical potentials of the studied complexes
The dielectric constant (D) is obviously an important factor in determining the ease of dissolution of a compound. A high dielectric constant seems to be a necessary requirement, but by no means the only one. Formamide, N-methylformamide, sulfuric acid and liquid hydrogen cyanide have higher dielectric constants than water. Solvent ‘electrostatic factors’, equal to the product of dielectric constant and dipole moment, have found use in classifying solvents in respect to their dissolving powers and other properties. The polarity, dipole moment, polarizability and hydrogen bonding of a solvent determine its ability to solvate the charged and none charged compounds. By comparison of the values of transfer chemical potentials (cf. Tables 4 and 5) of the studied complexes between aqueous-solvent mixtures, it was observed that the investigated complexes are more stabilized by increasing solvent%. This is due to the hydrophobicity of these compounds, where the polarity of the used solvents increases in the order: water > ethanol > dimethysulfoxide. Thus the order of stabilization of the investigated complexes with increasing the ratio of solvent is: water < ethanol < dimethysulphoxide.
3.2 DNA-binding study
Titration with electronic absorption spectroscopy is an effective method to investigate the binding mode of DNA with metal complexes (Kelly et al., 1985). The spectra were recorded as a function of the addition of the buffer solutions of pretreated CT-DNA to the buffer solutions of the metal complexes. If the binding mode is intercalation, the orbital of the intercalated ligand can couple with the orbital of the base pairs, reducing the π–π∗ transition energy and resulting in bathochromism. If the coupling orbital is partially filled by electrons, it results in decreasing the transition probabilities and resulting in hypochromism (Pyle et al., 1989). The extent of the hypochromism or hyperchromism in the metal-to-ligand charge transfer (MLCT) band is commonly consistent with the strength of intercalative interaction (Liu et al., 2005). The electronic absorption spectra of bsali and bsasi complexes in the absence and presence of different concentrations of buffered CT-DNA are given in Fig. 5. By adding DNA, the absorption intensities of MLCT band are gradually increased. Moreover, addition of increasing amounts of CT-DNA resulted in a decrease of absorbance for each investigated complex. Representative spectra illustrating this hypochromicity and the presence of isosbestic points observed for the interaction of bsali and bsasi with CT-DNA are given in (cf. Fig. 5 and Fig. 2 in supplementary material). The spectral parameters for the DNA interaction with the prepared complexes are shown in Table 6. It can be realized from the high percent of hyperchromicity that the high strength binding of the prepared complexes with DNA. Thus, the investigated complexes could bind to DNA via an intercalative mode with the sequence: bsari > bshi > bsali > bsasi > bsphali. The results revealed that the structure differences of the amino acids might lead to obvious difference of DNA binding abilities of the complexes. The high binding constant of bsari complex could be attributed to two types of interaction modes one of them is intercalation through insertion of an aromatic ring and the other one is hydrogen and electrostatic bonding of the guanidinium group of bsari with DNA.![(a) Spectrophotometeric titration of bsasi complex (10−4 M) in 0.01 M Tris buffer (pH 7.5, 25 °C) with CT DNA (from top to bottom, 0–40 μM DNA, at 5 μM intervals). (b) Plot of [DNA]/(εa−εf) vs. [DNA] for the titration of DNA with bsasi complex.](/content/184/2017/10/2_suppl/img/10.1016_j.arabjc.2013.07.010-fig9.png)
(a) Spectrophotometeric titration of bsasi complex (10−4 M) in 0.01 M Tris buffer (pH 7.5, 25 °C) with CT DNA (from top to bottom, 0–40 μM DNA, at 5 μM intervals). (b) Plot of [DNA]/(εa−εf) vs. [DNA] for the titration of DNA with bsasi complex.
Compound
λmax free (nm)
λmax bound (nm)
Δn (nm)
Chromism (%)a
Type of chromism
Binding constant Kb × 104 M−1
ΔG≠ kJ mol−1
bsali
494
488
6
15.97
Hypo
6.70 ± 0.01
−27.53
426
384
42
76.75
Hyper
bsphali
500
492
8
4.98
Hypo
5.79 ± 0.01
−27.17
432
398
34
49.26
Hyper
bsasi
490
476
14
4.66
Hypo
6.23 ± 0.01
27.35
454
392
62
51.27
Hyper
bshi
486
484
2
2.72
Hypo
7.04 ± 0.01
−27.65
422
392
80
10.19
Hyper
bsari
492
490
2
4.79
Hypo
10.70 ± 0.01
−28.69
432
364
68
49.32
Hyper
In order to further clarify the interaction nature between the prepared complexes and DNA, viscosity measurements were carried out. Optical photophysical probes provide necessary data but not sufficient evidence to support a binding mode of DNA with the metal complexes. Hydrodynamic methods such as viscosity measurements which are sensitive to length increase or decrease of DNA are regarded as the most effective means of studying the binding mode of complexes to DNA in the absence of crystallographic structural data and NMR (Baguley and LeBret, 1984). For further clarification of the binding mode, viscosity measurements were carried out. Under appropriate conditions, a classical intercalative mode such as intercalation of drugs like ethidium bromide (EB) causes a significant increase in the viscosity of DNA solution due to an increase in the separation of base pairs at the intercalation site and hence an increase in the overall DNA length. On other hand, drug molecules binding exclusively to the DNA grooves cause less pronounced, or no obvious change, in DNA solution viscosity (Liu et al., 2008) a partial and/or nonclassical intercalation of complex may bend the DNA helix, resulting in the decrease of its effective length and, concomitantly, its viscosity (Shi et al., 2006).
The relative viscosity of DNA solution increases significantly as the amount of the complex increases, as shown in Fig. 6. This may be due to the insertion of the aromatic ring in Schiff base ligand into the DNA base pairs resulting in a bend in the DNA helix, hence, increase in the separation of the base pairs at the intercalation site and increasing in DNA molecular length (cf. Scheme 5). Moreover, the sequence of the observed increase in the values of viscosity was correlated with the binding affinity to DNA i.e. bsari shows the highest binding affinity to DNA and the highest viscosity. The information obtained from this work could be helpful to the understanding of the mechanism of the interaction of small molecules with nucleic acids, and should be useful in the development of potential probes of DNA structure and conformation.![The effect of increasing the amount of the synthesized complexes on the relative viscosities of DNA at [DNA] = 0.5 mM, [complex] = 25–250 μM and 298 K.](/content/184/2017/10/2_suppl/img/10.1016_j.arabjc.2013.07.010-fig10.png)
The effect of increasing the amount of the synthesized complexes on the relative viscosities of DNA at [DNA] = 0.5 mM, [complex] = 25–250 μM and 298 K.
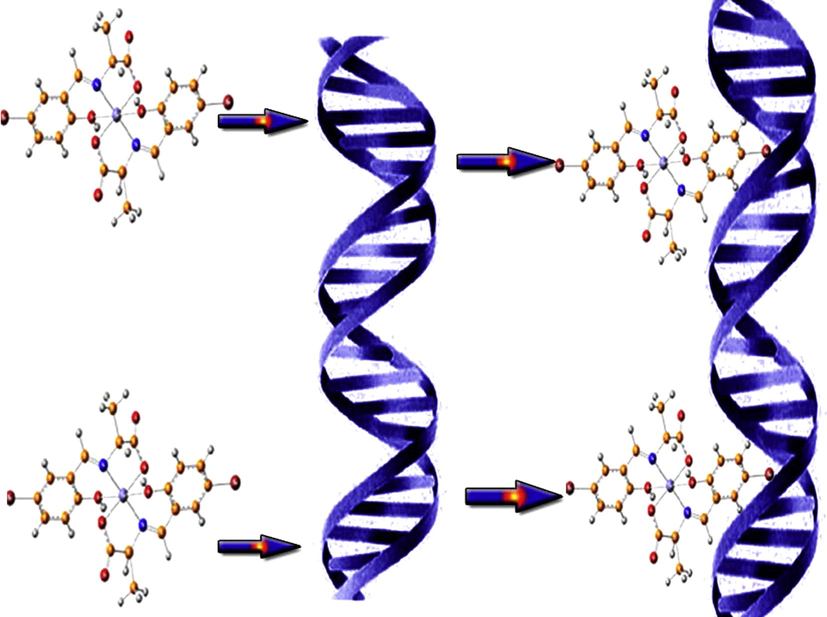
Schematic diagram illustrating the prepared complexes intercalating into CT DNA base pairs.
3.3 Biological activity
The contribution of the field of bioinorganic chemistry is important, consequently, the synthesized Schiff base amino acid and their Fe(II) complexes have been evaluated for their antimicrobial actions. The susceptibilities of certain strains of bacteria to Schiff base amino acid and their complexes were evaluated by measuring the size of the bacteriostatic diameter. The antimicrobial activity data of all synthesized compounds are summarized in Table 7 and show that the newly synthesized ligands and their Fe(II) complexes possess biological activity. The antibacterial screening results exhibited a marked enhancement in activity on coordination with the metal ions against one or more testing bacterial strains (cf. Fig. 7). This enhancement in the activity can be rationalized to the basis of the structures of the ligands that possessing an additional azomethine (C⚌N) linkage which is important in elucidating the mechanism of transamination and resamination reaction in biological system (Nishat et al., 2010). It has also been suggested (Avajia et al., 2009; Chohan et al., 2004) that the ligands with nitrogen and oxygen donor systems might inhibit enzyme production, since the enzymes which require these groups for their activity appear to be especially more susceptible to deactivation by the metal ions upon chelation. The polarity of the metal ion is reduced by chelation (Rehman et al., 2005) and this is mainly because of the partial sharing of its positive charge with the donor groups and possibly with the delocalized π – electrons within the whole chelation ring, which is formed because of the coordination. This process of chelation increases the lipophilic nature of the central metal atom, which in turn favors its permeation through the lipoid layer of the membrane (Chohan et al., 2006). This is also responsible for the increasing of the hydrophobic character and liposolubility of the molecules in crossing the cell membrane of the microorganism and hence enhances the biological utilization ratio and activity of the testing drug/compound. Moreover, it was found that the prepared compounds show moderate to high activity compared to the standard drugs used in the investigation (cf. Table 7).
Bacteria
[Comp] (mg/ml)
Aa
Ba
bsal
basli
bsphal
bsphali
bsas
bsasi
bsh
bshi
bsar
bsari
Compound (zone of inhibition in mm)
P. aeruginosa
5
9
8
–
7
–
5
2
9
1
8
1
9
10
13
12
4
9
2
6
6
13
5
11
4
12
20
16
17
7
12
4
11
7
15
8
15
7
15
E. coli
5
10
11
–
8
–
7
2
9
3
11
3
11
10
14
13
5
11
3
8
8
14
6
14
5
14
20
22
23
8
14
6
12
10
18
10
19
7
15
B. cereus
5
18
19
4
19
5
15
3
11
4
12
3
12
10
23
24
7
24
7
18
5
15
6
15
5
15
20
38
40
12
36
9
28
7
20
8
19
8
17
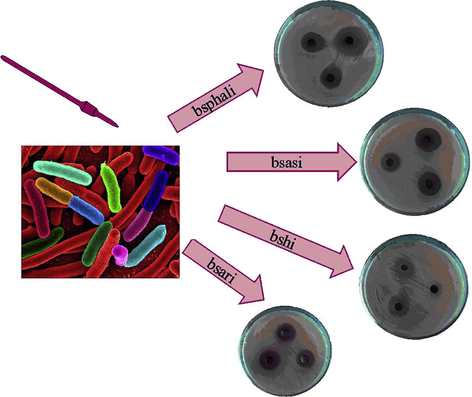
Photograph showing the antibacterial effect of bsphali, bsasi bshi and bsari complexes on Bacillus cereus.
4 Conclusion
Binary iron(II) Schiff base amino acid complexes having five essential amino acids, namely, alanine, phenylalanine, aspartic acid, histidine and arginine were prepared and characterized by different techniques such as elemental analysis, conductance measurements, magnetic susceptibility, thermogravimetric analysis, electronic and IR spectra. In these complexes, the tri-dentate Schiff base ligand is coordinated to Fe(II) ion through phenolic-oxygen atoms, azomethine-nitrogen atom and carboxylate–oxygen atom forming stable octahedral complexes with the general formula [Fe(HL)2]·nH2O. The suggested formulas were confirmed by applying the molar ratio and continuous variation methods. Moreover, the obtained Kf values indicate the high stability of the prepared complexes and their values increase in the following order: bsari > bali > bsphali > bshi > bsasi. The cationic pendant groups in the crescent-shaped structure of bsari have structural similarity with the antitumor antibiotic netropsin in binding to DNA. Furthermore, The DNA binding study takes place via an intercaltive mode. These findings clearly indicate that transition metal based complexes have many potential practical applications, like the development of nucleic acid molecular probes and new therapeutic reagents for diseases. Also the prepared compounds show antibacterial activity.
Acknowledgement
The authors express their sincere thanks to Prof Dr. said Mohammed Ibrahim, professor of inorganic chemistry, Assiut University, Assiut, Egypt for making magnetic moment measurements.
References
- Spectrochim. Acta A. 2009;73(5):833-840.
- Synth. Inorg. Met. Org. Chem.. 1998;28(4):555-570.
- Spectrochim. Acta Part A. 2013;111:266-276.
- J. Mol. Struct.. 2013;1040:9-18.
- Z. Phys. Chem.. 2011;225:1-14.
- Arab. J. Chem. 2013 in press
- Synth. React. Inorg. Met. Org. Chem.. 2002;32(4):665-687.
- Eur. J. Med. Chem.. 2009;44(9):3552-3559.
- Biochemistry. 1984;23:937-943.
- J. Indian Chem. Soc. 1984;LXI:256-257.
- J. Inorg. Biochem.. 2010;104:477-484.
- J. Inorg. Bio. Chem.. 2010;104:477-484.
- Bonnett, R., 2000. Chemical aspects of photodynamic therapy, Gordon and Breach, London, UK.
- Hydrogen Ions (third ed.). London, UK: Chapman and Hall; 1952.
- Chem. Soc. Rev.. 1999;28:85-93.
- J. Coord. Chem.. 2002;55:961-968.
- J. Inorg. Biochem.. 2008;102:1749-1764.
- Cent. Eur. J. Chem.. 2009;7(1):105-110.
- Polyhedron. 2004;23:1953-1960.
- Inhib. Med. Chem.. 2004;19:79-84.
- Inhib. Med. Chem.. 2006;21:95-103.
- Spectrochim. Acta A. 2008;70(2):403-410.
- Coord. Chem. 1984;13:173-178.
- Trans. Met. Chem.. 2001;26:13.
- J. Am. Sci.. 2011;7(4):797-807.
- J. Coord. Chem.. 2008;61(15):2380-2401.
- Chem. Rev.. 1999;99:2777-2796.
- Eur. J. Med. Chem.. 2009;44(4):1500-1508.
- Russ. J. Coord. Chem.. 2008;34:198-203.
- J. Inorg. Biochem.. 2010;104:9-18.
- Cancer Res.. 2000;60:525-529.
- Trans. Met. Chem.. 1999;24(3):294-298.
- Chin. J. Chem.. 2011;29:259-266.
- Ann. Chem.. 1928;9:113-203.
- Nucleic Acids Res.. 1985;13:6017-6034.
- Lever, A.B.P., 1968. Inorganic Electronic Spectroscopy, Elsevier Publishing, Amsterdam, 298, 326.
- Inorg. Chem. Commun.. 2009;12(8):704-706.
- Coord. Chem. Rev.. 2004;248:147-168.
- J. Inorg. Biochem.. 2005;99:2372-2380.
- J. Coord. Chem.. 2008;61:3213-3224.
- Int. J. Pharm. Technol.. 2010;2(4):1133-1157.
- J. Mol. Biol.. 1961;3:208-218.
- Infrared and Raman spectra of coordination compounds. New York: John Wiley; 1978. pp. 143–253
- Bull. Chem. Soc. Jpn.. 1997;70:1131.
- J. Coord. Chem.. 2010;63(21):3859-3870.
- Inorg. Chem.. 2009;48:2932-2943.
- Spectrochim. Acta A. 2008;70(1):30-35.
- J. Am. Chem. Soc.. 1989;111:3051-3058.
- Synth. React. Inorg. Met. Org. Chem.. 2001;31(7):1249-1260.
- J. Chem. Sci.. 2007;119(4):303-309.
- J. Chem. Sci.. 2007;119(4):303-310.
- J. Mol. Struct.. 2011;1000:135-144.
- Inhib. Med. Chem.. 2005;20:333-340.
- Int. J. Bio. Macromol.. 2011;48:319-325.
- Biometals. 2004;17:115-120.
- Eur. J. Med. Chem.. 2008;43(11):2338-2346.
- Biochemistry. 1992;31:9319-9324.
- Der Pharma Chemica. 2011;3(1):318-321.
- Synth. React. Inorg. Metal Org. Chem.. 2003;33(1):103-107.
- Proc. Indian Acad. Sci. (Chem. Sci.). 1994;6(1):23-27.
- J. Inorg. Biochem.. 2006;100:385-395.
- Spectrochim. Acta. 1963;19(9):1407-1423.
- Ind. J. Chem.. 2007;A46:249.
- Synth. React. Inorg. Metal Org. Chem.. 1995;25:471-479.
- Biochim. Biophys. Acta. 2000;1475:157-162.
- J. Inorg. Biochem.. 2002;89:97-106.
- Inorg. Chem. Commun.. 2005;8(4):368-371.
- Bioorg. Med. Chem.. 2006;14:6745-6751.
- Trans. Met. Chem.. 1999;24:617-621.
- Biochemistry. 1987;26:6392-6396.
- Chem. Commun.. 2006;7:1836-1838.
- J.H. Yoe, A.L. Jones, Ind. Eng. Chem. (Analyst. Ed.) 16 (1944) 111–115.
- Anorg. Allg. Chem. 2004;630:1617-1622.
- Bioorg. Med. Chem. Lett.. 2007;17(13):3774-3777.
Appendix A
Supplementary data
Supplementary data associated with this article can be found, in the online version, at http://dx.doi.org/10.1016/j.arabjc.2013.07.010.
Appendix A
Supplementary data
Supplementary data
Supplementary data


