Translate this page into:
COVID-19 chloroquine drug detection using novel, highly sensitive SnO2-based electrochemical sensor
⁎Corresponding author. akawde@sharjah.ac.ae (Abdel-Nasser Kawde)
-
Received: ,
Accepted: ,
This article was originally published by Elsevier and was migrated to Scientific Scholar after the change of Publisher.
Peer review under responsibility of King Saud University.
Abstract
A highly sensitive, selective, stable, and cost-effective SnO2-based electrochemical sensor is reported for the detection of chloroquine phosphate (CQP). Hydrothermal synthesis is used to synthesize SnO2 nanoparticles, which are mixed with graphite and form a highly electrochemically active composite. The SnO2 nanoparticles and SnO2/graphite composite are fully characterized physico- and electrochemically. Using the optimal SnO2/graphite composite, an excellent analytical performance is demonstrated with an electrode sensitivity of 35.7 µA/µM.cm2, a linear range of 0.1–23.3 µM, and limits of detection and quantification of 0.01 µM and 0.04 µM, respectively. High CQP selectivity with minimal interference at 100 concentration of interferents is shown. The sensor is also highly repeatable and reproducible with RSD of 2.46 % and 1.86 %, respectively, and can retain > 85 % of its activity upon storage. The validity of the new sensor for real sample analysis is shown by applying it to CQP tablets using the standard addition method, obtaining an excellent percentage recovery of ∼ 102 %. The low cost, facile processing, and superior performance of the SnO2/graphite electrode make it an up-and-coming candidate for the commercial electrochemical detection of CQP and other small molecules.
Keywords
COVID-19 Drug
Chloroquine
Tin oxide
Composite electrode
Electrochemical sensor
Voltammetry
1 Introduction
Chloroquine phosphate (CQP) is a multi-use active pharmaceutical ingredient with different indications. CQP is a 4-aminoquinoline molecule with an alkylamino side chain (Oliveira et al., 2020; Radi, 2005) that has been long used as an anti-parasitic agent in the prophylaxis and treatment of malaria and amebiasis. It also has anti-inflammatory properties and has found use in treating rheumatoid arthritis, macrophage necrosis factor, and lupus erythematosus (Ganguly and Hwa, 2022; Srivastava et al., 2019; Rainsford et al., 2015; Stevens et al., 2021). In addition, it is a high-potential antiviral agent and radio/chemo-sensitizer in cancer therapy (Srivastava et al., 2019; Stevens et al., 2021; Mashhadizadeh and Akbarian, 2009). It has also been recently investigated as a potential treatment for coronavirus disease 2019 (COVID-19) caused by severe acute respiratory syndrome coronavirus 2 (SARS-CoV-2) (Oliveira et al., 2020; Stevens et al., 2021). On the other hand, CQP has shown several side effects and toxicities, including minor ones such as nausea, vomiting, diarrhea, and gastrointestinal upset, and more severe consequences, such as heart problems, arrhythmia, cytotoxicity, and retinal toxicity that could seriously impact vision (Ganguly and Hwa, 2022; Srivastava et al., 2019; Stevens et al., 2021). The risk of these side effects is further increased by the narrow therapeutic index of CQP (Oliveira et al., 2020), where drug level monitoring is of utmost importance. Another profound negative impact of CQP is environmental toxicity; its persistence and bioaccumulation in soil, ground, and surface waters have a detrimental effect on aquatic life and lead to loss of therapeutic efficiency and development of antimicrobial resistance (Ganguly and Hwa, 2022; Zurita et al., 2005). The wide use of CQP, its serious side effects, and environmental toxicity necessitate monitoring its level in blood during therapy and potentially contaminated sites where contamination by pharmaceutical industrial waste or drug disposal is suspected. Thus, developing efficient, practical, and inexpensive sensors are in high demand for such a purpose.
The electrochemical detection of CQP has many advantages over conventional analytical systems. Although several analytical methodologies have been developed for detecting CQP, such as high-performance liquid chromatography (Martins et al., 2021), spectrophotometry (Castro e Souza et al., 2020), and chemiluminescence (Liang et al., 2004), the high cost, lengthy analysis time, and high operation skill required are hindering their application, especially in remote areas for environmental monitoring. Electrochemical systems are more facile, compact, easier to operate, time/cost-effective, and highly sensitive and selective (Baig et al., 2022; Baig et al., 2022; Baig et al., 2021; Elgamouz et al., 2021; Ibrahim et al., 2020; Ibrahim et al., 2020). Carbon paste electrode (CPE) is a practical and cost-effective electrode that has found wide application in different electrochemical systems. It has a wide potential window, minimal background current, limited ohmic resistance, easy operation and regeneration protocols, and low cost. Moreover, its performance can be easily enhanced by incorporating different kinds of electron transfer mediators and electrocatalysts, such as nanomaterials (Mashhadizadeh and Akbarian, 2009; Shahamirifard and Ghaedi, 2019; Thomas et al., 2013). CPE-based systems for CQP detection need to be further investigated and improved as they are versatile and cost-effective systems with a high potential for commercial application. Nanoparticles are a high-value choice for CPE modification due to their small size and high surface area and volume ratio, which result in enhanced charge transfer and high electrochemical activity, reflecting positively on the system's sensitivity and selectivity (Amani-Beni and Nezamzadeh-Ejhieh, 2018; Zhu et al., 2020; Sharma et al., 2020). Metal oxide nanoparticles have high catalytic activity, excellent stability, and biocompatibility (Madhu et al., 2018; Kaçar et al., 2017). In addition, they are easy and more environmentally friendly to synthesize and scale up, as compared to other ceramics, such as chalcogenides. SnO2, in particular, has a relatively high electrical conductivity, perfect electrochemical activity, and low cost, which make it an up-and-coming candidate for electrochemical sensors (Madhu et al., 2018; Kaçar et al., 2017; Lavanya and Sekar, 2017). The excellent electrochemical properties of SnO2 and the synergistic effect of nanosize resulted in the adoption of SnO2 nanoparticles as a CPE modifier, showing excellent performance. SnO2 nanoparticle-based CPE electrodes have been used for the detection of various biomolecules and active pharmaceutical ingredients, including nicotinamide adenine dinucleotide (Moshirian-Farahi et al., 2022), cholesterol (Tığ et al., 2016), and diltiazem (Attaran et al., 2016).
Despite the advantages of electrochemical sensors for CQP detection, few systems have been reported so far. Srivastava et al. used WS2/graphene composite as an electrocatalyst on a glassy carbon electrode (GCE) for CQP voltammetric detection (Srivastava et al., 2019). Similarly, Ganguly and Hwa used ZnSe on screen-printed electrodes (Ganguly and Hwa, 2022). Oliveira et al. also reported a voltammetric CQP analytical system using a boron-doped diamond electrode (Oliveira et al., 2020). Only two reports have investigated the electrochemical analysis of CQP using CPE (Radi, 2005; Mashhadizadeh and Akbarian, 2009), including a study using a voltammetric stripping technique based on the interaction of CQP and DNA that is not economical for wide-scale use (Radi, 2005). More CPE-based electrochemical systems need to be investigated for the electrochemical analysis of CQP. SnO2 nanoparticles would be an ideal CPE modifier for a high-sensitivity CPE-based CQP electrochemical analysis system.
Herein, we report a novel electrochemical system for the analysis of CQP (Scheme 1). Our approach is based on a composite of SnO2 nanoparticles and graphite in a CPE. The facile and low-cost synthesis of the oxide nanoparticles and their high surface area and electrochemical activity makes our system highly practical, efficient, and cost-effective. The electrochemical system was fully optimized, achieving a very high sensitivity of 35.7 µA/µM.cm2 and a very competitive limit of detection (LOD) and limit of quantification (LOQ) of 0.01 µM and 0.04 µM, respectively. These results are among the best reported in the literature. We obtained an excellent linear range as low as 0.1 µM and as high as 23.3 µM, together with excellent electrode repeatability and reproducibility. Our system was highly selective, with most interferents showing minimal effect even at 100
CQP concentration. The electrode was quite stable, with ∼ 85 % of the signal retained upon storage over seven days. We tested our system for the analysis of CQP in a commercial pharmaceutical product, achieving an excellent percentage recovery of ∼ 102 %. The excellent performance of our analytical system, together with its facile preparation, processing, and regeneration, makes it very promising for commercial application.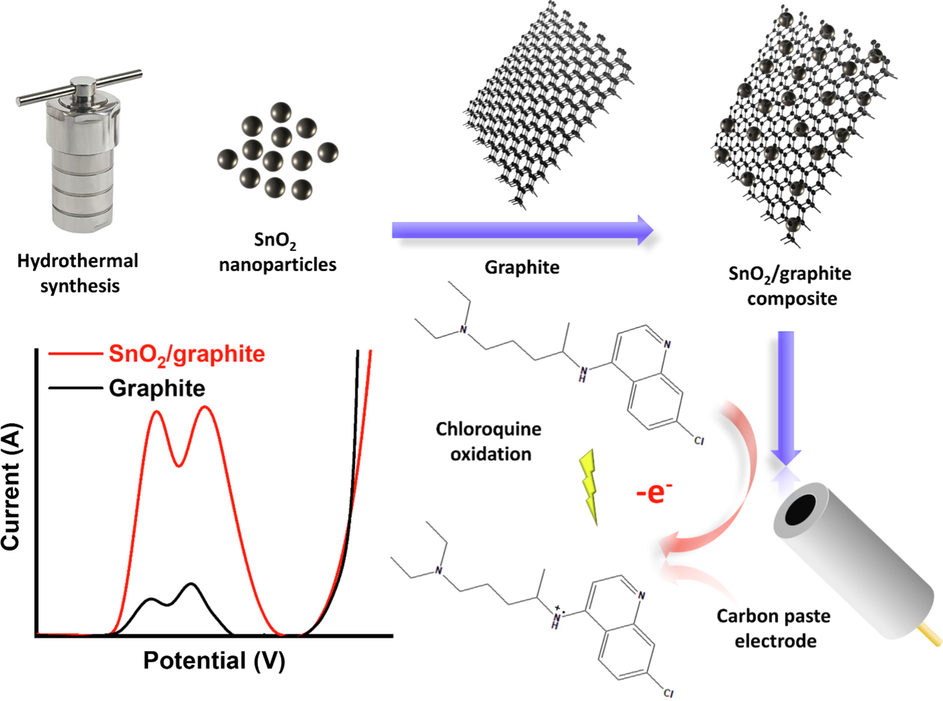
SnO2/graphite-based system for electrochemical detection of CQP.
2 Experimental
2.1 Chemicals and reagents
Chloroquine diphosphate, graphite, mineral oil, potassium ferricyanide, sodium chloride, and sucrose were purchased from Sigma-Aldrich. Ascorbic acid and urea were purchased from VWR. Tin dichloride dihydrate, potassium ferrocyanide trihydrate, glucose, KCl, and CaCl2 were purchased from SDFCL, Wardle chemicals, Applichem, Eurolab, and Avonchem, respectively. Reconil drug was purchased from a local pharmacy in Sharjah, UAE. Ultrapure water was produced using Milli-Q Elix Essential® 5 water purification system.
2.2 Synthesis of SnO2 nanoparticles
SnO2 nanoparticle synthesis was carried out according to a previous report with modifications (Sephra et al., 2018). 4.2 mmol of SnCl2·2H2O was dissolved in 60 mL absolute ethanol, followed by the addition of 2.0 mL of concentrated HCl and stirring for 10 min. The solution was poured into a Teflon-lined 100 mL autoclave and heat treated at 180 °C for 12 h. The autoclave was cooled down naturally, and the product was washed using water and ethanol by centrifugation and finally dried at 60 °C.
2.3 Electrode preparation
CPE was prepared by mixing SnO2 nanoparticles, graphite, and mineral oil at different weight ratios. The weight ratio of SnO2 nanoparticles ranged from 0 to 50 %, while the ratio of the mineral oil was kept constant at 20 %. The paste was packed into the cavity of an electrode comprising a hollow cylindrical tube with an internal Cu rod with a cavity diameter of 2 mm. The electrode components were mixed well using a mortar and pestle for at least 15 min to ensure homogeneity. The electrode surface was polished against weighing paper.
2.4 Instrumentation
Scanning electron microscopy (SEM) and field emission scanning electron microscopy (FESEM) were carried out using Tescan Vega3 and Thermo Scientific Apreo C systems, respectively, both fitted with an Oxford energy dispersive X-ray spectroscopy (EDX) analyzer. Powder X-ray diffractometry (XRD) was conducted using Bruker D8 Advance with a Cu source (λ = 0.15406 nm) at a voltage of 40 kV, current of 40 mA, using a step of 0.02° and time per step of 0.15 s. X-ray photoelectron spectroscopy (XPS) was carried out using Nexsa G2 Surface Analysis System (Thermo Scientific) using monochromatic Al Kα X-ray (1486.6 eV) at an ultra-high vacuum of ∼ 10-9 mbar. Dynamic light scattering (DLS) was done using Microtrac Nanotrac Wave II. Fourier-transform infrared (FTIR) and Raman spectroscopies were done using Bruker Tensor II and Renishaw inVia system, respectively. Brunauer–Emmet–Teller (BET) surface area was determined using nitrogen adsorption–desorption isotherms obtained using surface area and porosity analyzer (Quantachrome Instruments). Pore size was determined using Barrett–Joyner–Halenda (BJH) method using the desorption branch. Total pore volume (<50 nm) was calculated based on nitrogen adsorbed at P/P0 0.97649. Thermogravimetric analysis (TGA) was conducted using Shimadzu TGA-50 at 10 °C/min in an air atmosphere. Electrochemical experiments were carried out using a Zahner Zennium Pro workstation. A 3-electrode electrochemical setup was used in all experiments, with a CPE working electrode comprising graphite, SnO2 (0–50 wt%), and mineral oil (20 wt%), Pt wire as the counter electrode, and Ag/AgCl (1.0 M KCl) reference electrode. Buffer pH was measured using OHAUS Starter 2100 pH meter.
3 Results and discussion
SnO2 nanoparticles were synthesized using a facile one-step hydrothermal method in an acidic ethanolic solution that induced the formation of SnO2 crystals, which grew in size via oriented attachment (Sephra et al., 2018). The product was highly dispersible in water (Fig. 1a), indicating the small size of the particles and their hydrophilic nature. DLS further confirmed the nanosize, demonstrating two size ranges at ∼ 190 nm and 450 nm (Fig. 1b), which indicated a hydrodynamic size of ∼ 190 nm and some particle attachment forming assemblies<500 nm in size. The primary size of the SnO2 nanoparticles was determined using FESEM to be < 100 nm (Fig. 1c) with an average size of ∼ 50 nm (Fig. 1d). EDX confirmed the SnO2 composition with an Sn:O atomic ratio of ∼ 1:2 (Fig. 2a-c). The crystal structure of the SnO2 nanoparticles was assessed using XRD (Fig. 2d). The main 2θ peaks in the XRD pattern appeared at 26.6°, 33.9°, 37.9°, and 51.8° corresponding to (1 1 0), (1 0 1), (2 0 0), and (2 1 1) planes of tetragonal SnO2 (space group P42/mnm), as matched to ICDD PDF #04–005-6880. The crystallite size was calculated using the Scherrer equation (Eq. (1)) (Goyal et al., 2022) to be 19.4 nm, and the dislocation density (δ) and lattice strain (ε) (Ganguly and Hwa, 2022) were calculated to be 2.4x10⁻³ nm−2 and 1.8x10⁻³, according to Eqs. (2) and (3), respectively.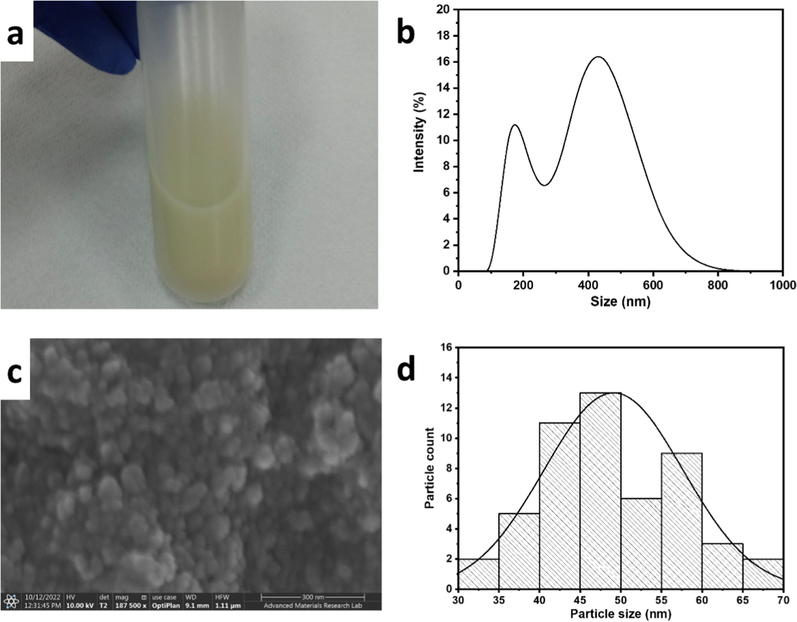
(a) Digital photograph, (b) DLS profile, (c) FESEM image, and (d) particle size distribution of SnO2 nanoparticles.
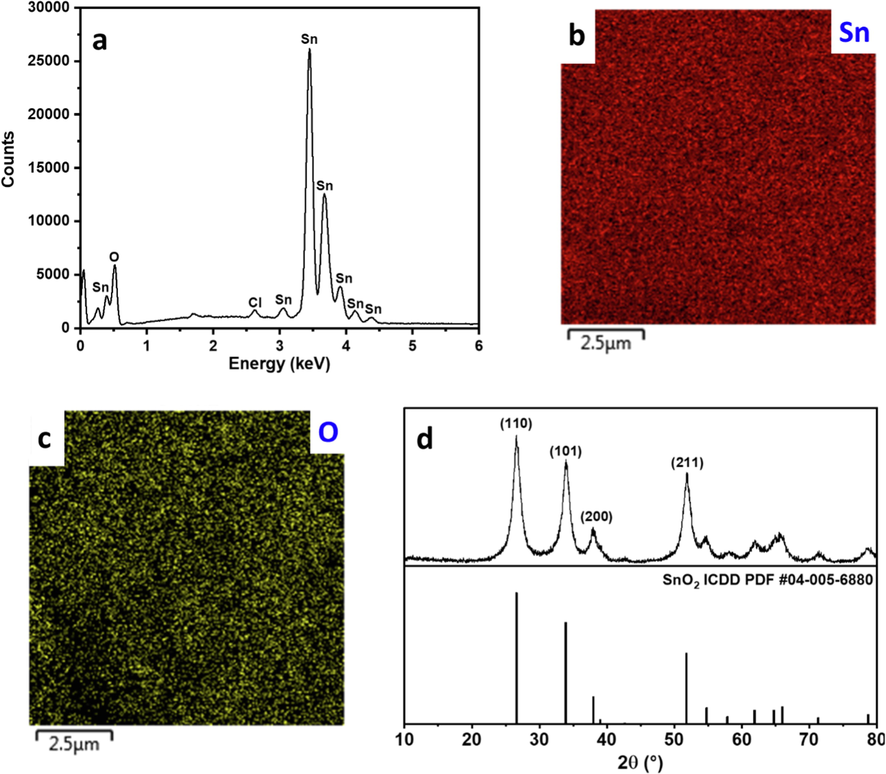
(a) EDX spectrum and (b-c) mapping images, and (d) XRD pattern of SnO2 nanoparticles.
Where D is the crystallite size in nm, λ is Cu Kα wavelength of 0.15406 nm, β is the full width at half maximum, and θ is Bragg's angle. The small crystallite size accompanied by significant grain boundaries leads to crystallite imperfections and defects, as shown by the dislocation density and lattice strain, which induced good electronic properties, and are favorable for high electrochemical activity (Hwa et al., 2021). To gain further insights into the chemical composition of the SnO2 nanoparticles, they were analyzed using XPS. The XPS survey spectrum displayed only Sn and O peaks (Fig. 3a), demonstrating sample purity. Core level Sn 3d spectrum showed a spin–orbit doublet at 495.24 eV and 486.83 eV, corresponding to Sn 3d3/2 and Sn 3d5/2, respectively, with a peak-to-peak separation of ∼ 8.4 eV and a peak area ratio of ∼ 1.5 (Fig. 3b). O 1 s core level spectrum showed a single peak at 530.8 eV (Fig. 3c), which could be attributed to O-Sn-O bonding (Ahmed et al., 2019; Ahn et al., 2004). This analysis confirmed the 4 + valence state of Sn and the SnO2 chemical composition.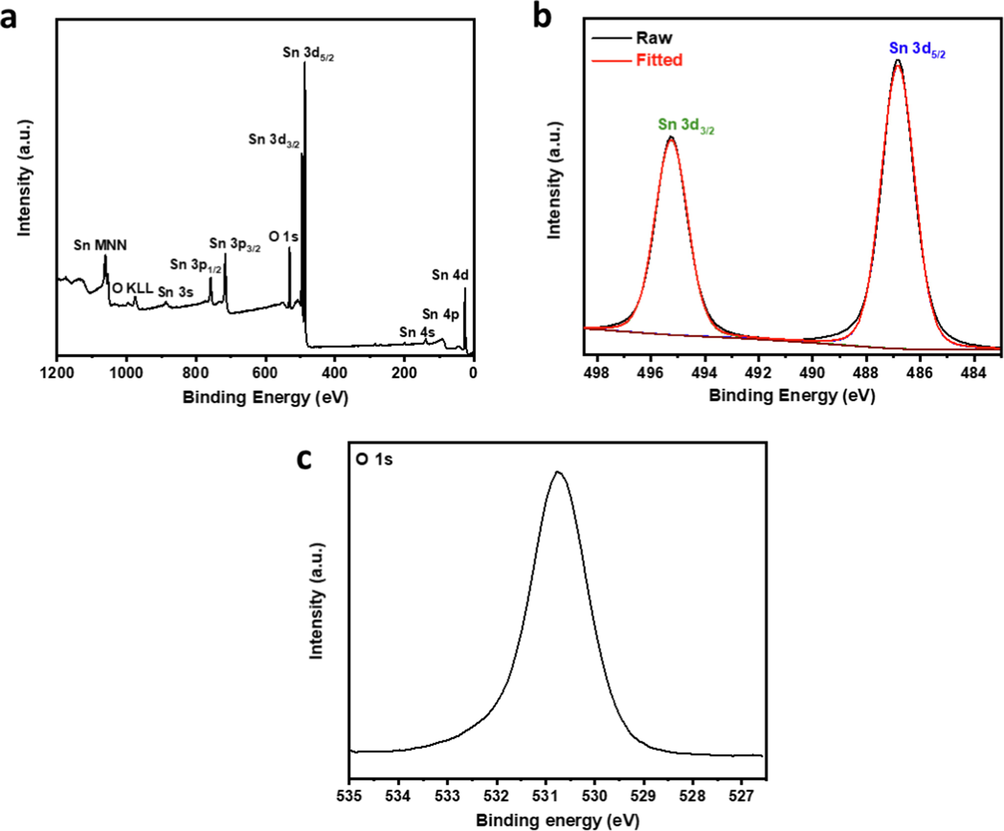
XPS (a) survey, (b) Sn 3d core level, and (c) O 1 s core level spectra of SnO2 nanoparticles.
Raman spectroscopy is an essential tool to study the characteristic vibrational frequencies of materials and their structural disorder and surface defects that are difficult to analyze otherwise. The Raman spectrum of SnO2 nanoparticles showed the three classical SnO2 vibrational modes of Eg, A1g, and B2g at ∼ 472 cm−1, ∼627 cm−1, and ∼ 771 cm−1, respectively (Fig. 4a). The peak broadening around A1g peak. The appearance of a high-intensity S1 band in addition to lower-intensity S2 and S3 bands at ∼ 581 cm−1, 508 cm−1, and 685 cm−1 indicated the small SnO2 particle size and the presence of surface defects. The peaks further confirmed the small particle size at ∼ 252 cm−1 and ∼ 292 cm−1, which could be attributed to Eu (TO) and Eu (L.O.), which are typically active only in small-size SnO2 (Jayapandi et al., 2019; Diéguez et al., 2001; Rumyantseva et al., 2005). The surface defects showed by Raman spectroscopy are especially favorable for high electrochemical activity (Sun et al., 2004). FTIR pattern showed a peak at ∼ 3457 cm−1 and a prominent, broad peak centered at ∼ 1811 cm−1, which are mainly due to O.H. groups, adsorbed H2O, and hydroxylated SnO2 surface. Two peaks appeared at ∼ 665 cm−1 and ∼ 546 cm−1 and could be ascribed to the antisymmetric and symmetric vibrations of Sn-O-Sn bonds, associated with Eu (TO) and A2u (TO) modes at 618 cm−1 and 477 cm−1, respectively (Fig. 4b). The positive shift seen in these two peaks indicated nano SnO2 size (Elci et al., 2018; Wan et al., 2018; Zhan et al., 2013). Surface properties and porosity play an essential role in electrode behavior due to their effect on the exposure of electroactive sites to the electrolyte. SnO2 nanoparticles showed a Type IV nitrogen adsorption–desorption isotherm with an H3 hysteresis loop, indicating the mesoporous nature of the nanoparticles and the cylindrical shape of the pores, respectively (Fig. 4c) (Xu et al., 2020; Henderson, 1995; Shanmugam et al., 2016; Xu et al., 2016). The surface area was determined using the BET method to be ∼ 19 m2/g, which agreed with previously reported values of SnO2 nanoparticles. Pore volume was estimated to be ∼ 7.5 cm3/g, and the average pore size was ∼ 8.5 nm, as determined using BJH analysis (Fig. 4d). The high surface area and porosity of the SnO2 nanoparticles could enhance interaction with the electrolyte leading to a positive effect on the electrode's electrochemical properties.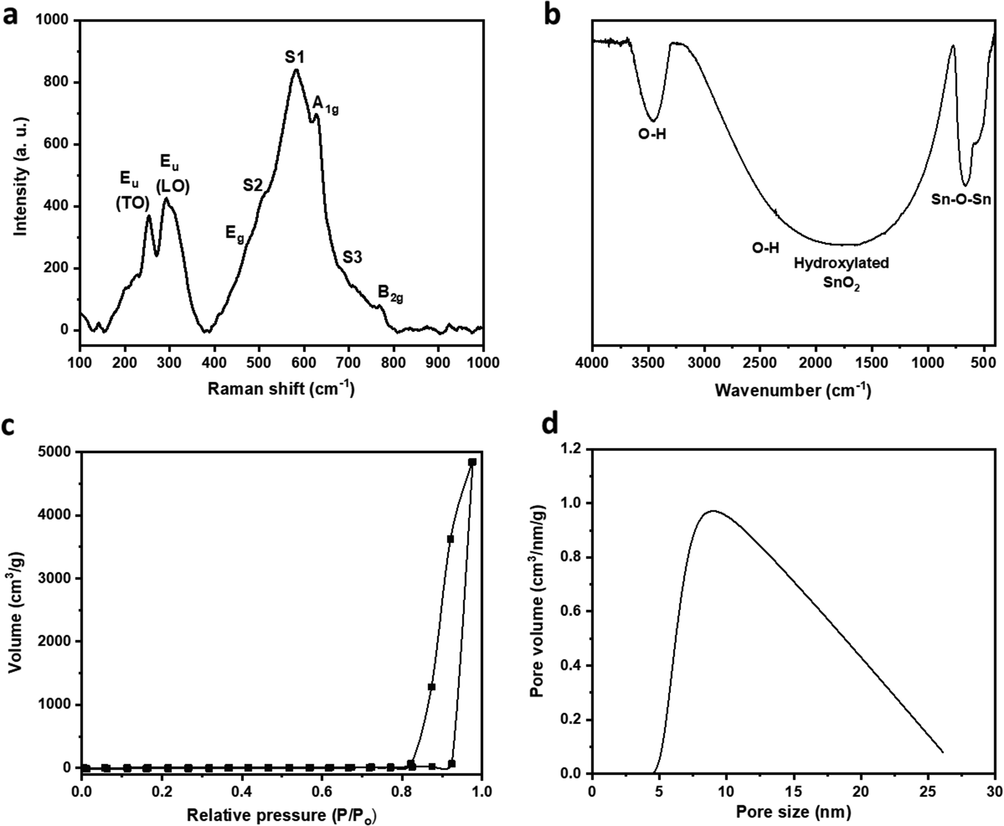
(a) Raman, (b) FTIR spectra, (c) nitrogen adsorption–desorption isotherm, and (d) pore size distribution of SnO2 nanoparticles.
SnO2 nanoparticles are very promising for electrochemical sensor electrodes, with their interesting attributes of small size, surface defects, favorable surface properties, and electrocatalytic activity. To this end, SnO2 nanoparticles were incorporated into CPE comprising graphite and mineral oil binder. Increasing ratios of SnO2 nanoparticles were applied to the CPEs to assess the effect of SnO2 content on the electrochemical activity and sensing properties. 4 CPE compositions were tested with the SnO2 nanoparticles content ranging from 0 % to 40 %, specifically, 0 %, 20 %, 30 %, and 40 %, corresponding to SnO2:graphite ratios of 0:1, 0.3:1, 0.6:1 and 1:1, respectively. SnO2 nanoparticles were seeded on the graphite sheets' surface, allowing for good electrolyte exposure and high stability. Graphite supported the SnO2 nanoparticles and provided a conductive matrix essential for electrical connectivity and good electrochemical performance. SEM was conducted on all CPE compositions to analyze their morphology and assess the distribution of SnO2 nanoparticles within the electrodes. Interestingly, no obvious morphology change was detected after SnO2 incorporation within the electrodes, probably due to the minimal size of the SnO2 nanoparticles that resulted in their facile incorporation within the graphite sheets. Moreover, EDX analysis showed a very homogeneous Sn/C distribution that reflected perfect homogeneity and suitability for electrochemical sensor electrodes (Fig. 5). The SnO2 contents in the four compositions were calculated to be 0 wt%, 23 wt%, 35 wt%, and 46 wt%, which were very close to the prepared ratios, reflecting the excellent SnO2 distribution over the entire electrode.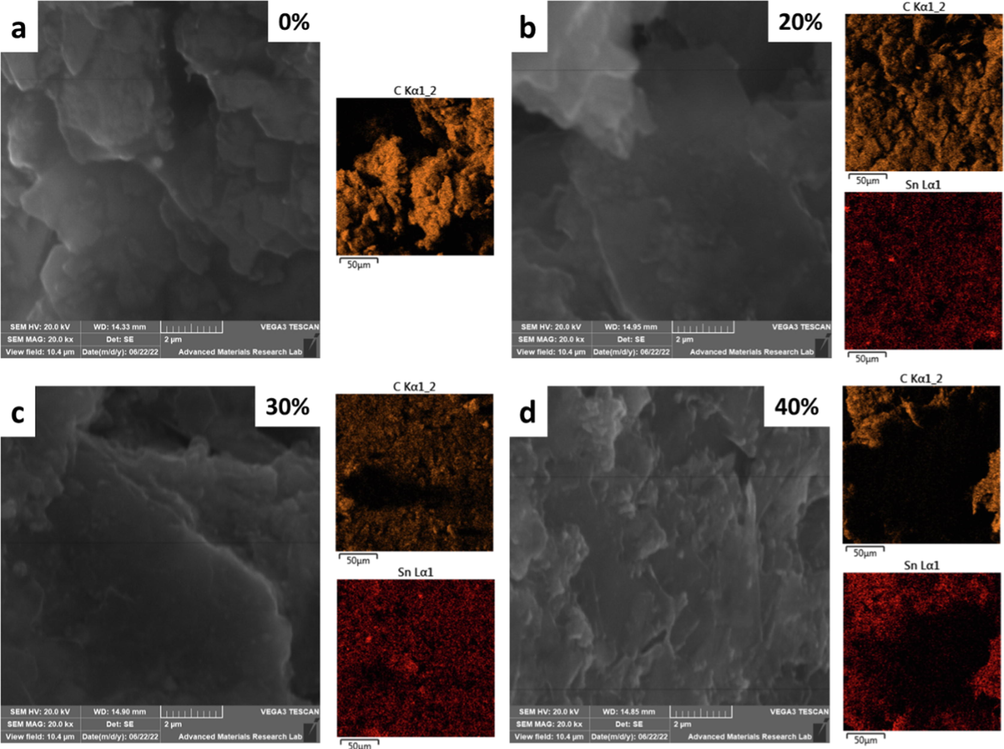
SEM and their corresponding EDX mapping images of CPEs at different SnO2 wt%.
The electrochemical activity of the SnO2-modified CPEs was evaluated using 5.0 mM of Fe(CN)63-/4- in 0.1 M KCl. Bare CPE showed a redox couple at 0.34/0.13 V, which agreed with previous reports (Ganguly and Hwa, 2022; Ibrahim et al., 2020). SnO2 enhanced the electrochemical activity of the CPE significantly, especially at > 10 wt%. The Ipa of bare CPE was 53.0 µA, which was very similar after 10 % SnO2 incorporation. However, Ipa increased to 72.4 µA, 89.2 µA, and 168 µA at SnO2 wt% of 20 %, 30 %, and 40 %, corresponding to an oxidation peak current increase of 36.6 %, 68.3 %, and 217.0 %, respectively (Fig. 6a). The large impact of SnO2 nanoparticles on the electrochemical redox peaks of Fe(CN)63-/4- indicated their high electrocatalytic activity that could accelerate charge transfer and facilitate the electrochemical reaction and reflected their significant effect on enhancing the electrodes' electroactive surface area. The incorporation of SnO2 within the CPE also impacted the peak-to-peak potential separation (ΔE) that was comparable for 0 % SnO2 and 10 % SnO2 at 222.5 mV and 234.5 mV, respectively. However, it decreased significantly to 210.6 mV and 186.6 mV at 20 % and 30 % SnO2, respectively, which indicated higher reaction reversibility and faster charge transfer rate.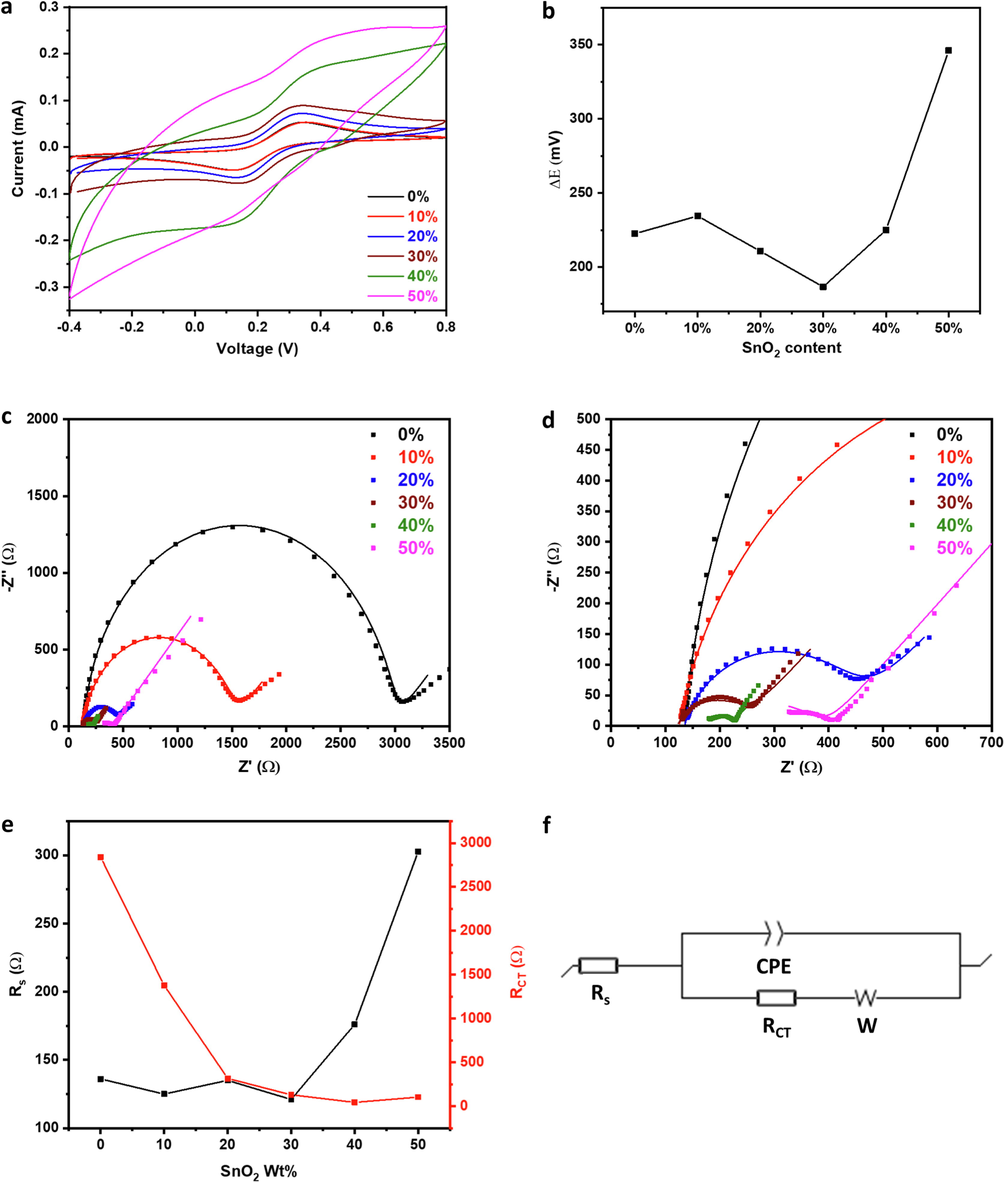
(a) CV profiles, (b)
E analysis, (c) full and (d) partial Nyquist plots (lines: fitted data) and their (e) quantitative analysis upon fitting using (f) Randles circuit of SnO2-CPEs with different SnO2 wt% in Fe(CN)63-/4-/0.1 M KCl.
At a high SnO2 content of 40 %, ΔE increased back to 225.0 mV, which could be due to an increase in the electrode's resistance as a result of the high content of SnO2 nanoparticles that have low inherent electronic conductivity and rely on the graphite for electric connectivity (Fig. 6b). This increase in the peak-to-peak separation accompanied by the change in the CV profile indicated significant electrode polarization, which would be much more pronounced at higher SnO2 content. This observation was exacerbated upon increasing the SnO2 content to 50 %, with ΔE increasing to 346 mV. Electrochemical impedance spectroscopy (EIS) was conducted to assess the conductivity of the electrodes and the rate of charge transfer taking place at their surfaces (Fig. 6c-d). Nyquist plots were fitted using a Randles circuit (Fig. 6f) for the quantitative determination of solution (Rs) and charge transfer (RCT) resistances (Fig. 6e and Table S2). A solution resistance of ∼ 126 Ω was observed for the bare electrode, and it was similar upon SnO2 incorporation till 30 wt% with an average of ∼ 129 Ω, indicating similar electrode conductivity. However, at 40 wt% SnO2, Rs increased by ∼ 36 %, showing an increase in electrode resistance (Chen et al., 2009), and it increased further at 50 wt%, reaching ∼ 303 Ω, which agreed with the high polarization observed in its CV profile. Bare CPE exhibited a relatively high RCT of ∼ 2840 Ω that decreased as SnO2 wt% increased, reaching 44 Ω at 40 wt% SnO2, reflecting the significant impact of SnO2 on accelerating the rate of charge transfer and thus the electrochemical activity of the CPE (Ganguly and Hwa, 2022; Ibrahim et al., 2020; Pauliukaite et al., 2010). At 50 wt% SnO2, RCT increased to ∼ 103 Ω, which corroborated the high electrode resistance. Therefore, the electrode with 50 wt% SnO2 was excluded from the further electrochemical investigation. The Fe3+/Fe2+ redox reaction was conducted at increasing scan rates to study the electrochemical response and determine the electrochemical surface area of the electrodes (Fig. 7a-d). The anodic peak current (Ipa) increased linearly with the square root of the scan rate for all electrodes with a high coefficient of determination (R2), ranging from 0.994 to 0.998 (Fig. 7e), indicating a diffusion-controlled electrochemical reaction (Ibrahim et al., 2020). The effective surface area of the electrodes was calculated using the Randles-Sevcik equation (Eq. (4)) (Ganguly and Hwa, 2022; Ibrahim et al., 2020).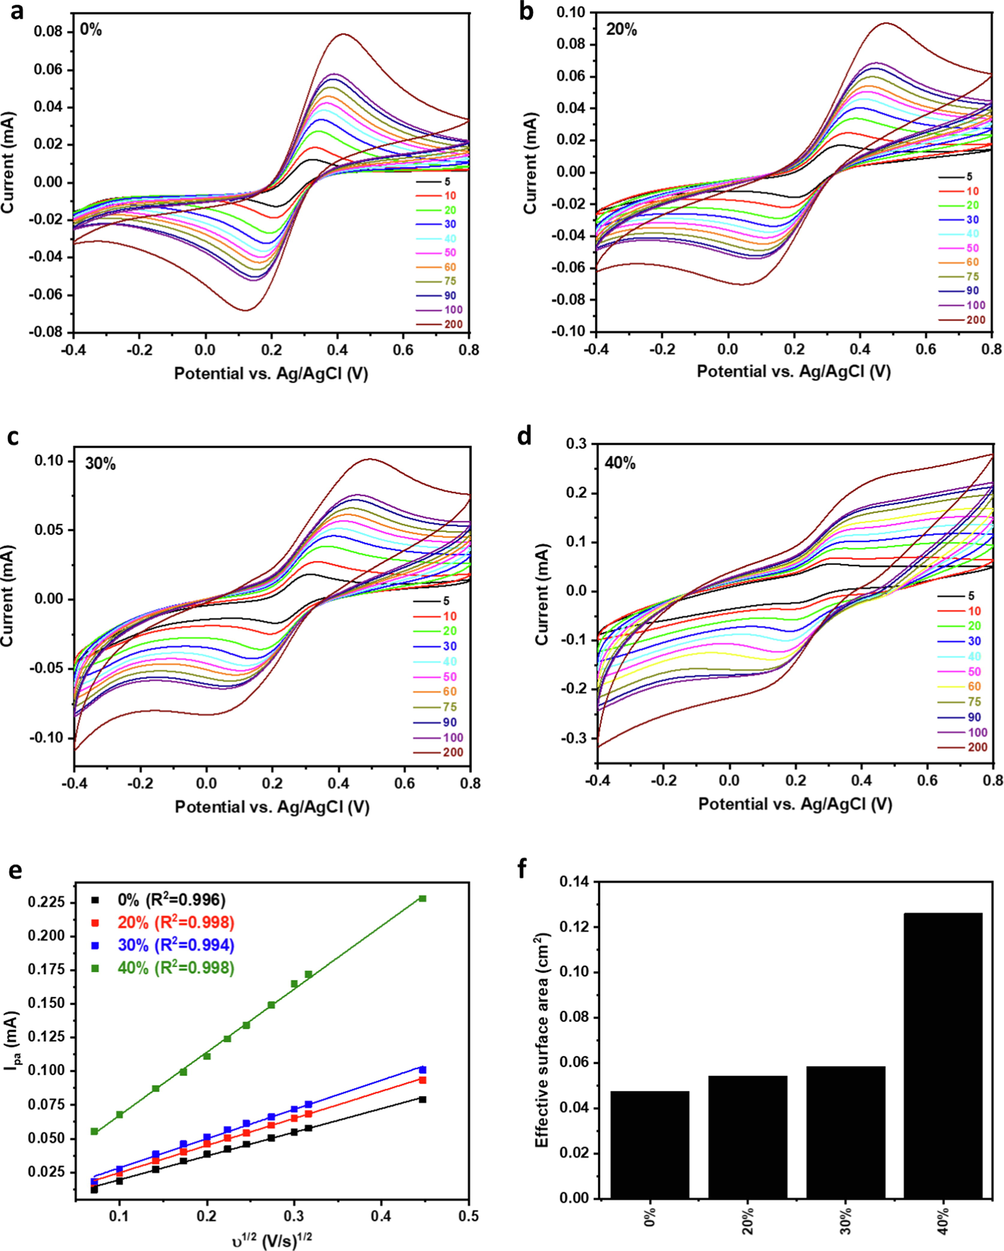
(a-d) CV profiles of 0–40 % SnO2-CPEs in Fe(CN)63-/4-/0.1 M KCl at different scan rates and their corresponding (e) Ipa vs v1/2 plots and (f) effective surface areas.
Where Ipa is the anodic peak current in A, n is the number of electrons transferred (n = 1) during the electrochemical process, D is the diffusion coefficient (7.6 × 10⁻⁶ cm2/s), and C is the concentration in mol/cm3 of the redox active species. A is the electroactive surface area in cm2. The electroactive surface area of the bare CPE was calculated to be ∼ 0.05 cm2, and it increased slightly with increasing SnO2 content to 30 %, where it reached ∼ 0.06 cm2. A significant increase in surface area was observed upon increasing SnO2 content to 40 wt%, where it increased ∼ 3 , as compared to bare CPE, reaching ∼ 0.13 cm2 (Fig. 7f). The increase in the electroactive surface area could be explained by the small size of the SnO2 nanoparticles and their uniform distribution over the surface of the graphite sheets, together with their intrinsic electrocatalytic activity, which resulted in significant enhancement of the electrochemical surface area and thus the electrochemical activity of the electrode.
CQP is known to show one or two irreversible anodic peaks due to the oxidation of the nitrogen atoms in the N-heterocyclic ring of the aminoquinoline moiety and the alkylamino side chain (Radi, 2005). The impact of SnO2 electrode modification on CQP detection was evaluated using differential pulse voltammetry (DPV). CPE displayed two anodic peaks at 0.79 V and 0.89 V with peak currents of 0.92 µA and 1.3 µA, respectively. Upon SnO2 incorporation with the CPE, the peak current increased significantly, doubling at 30 % SnO2 and quadrupling at 40 % SnO2 (Fig. 8a-b). This reflected the enhanced electrocatalytic activity and charge transfer kinetics of CPE upon SnO2 modification and agreed with the previously observed increase in electroactive surface area and electrochemical activity.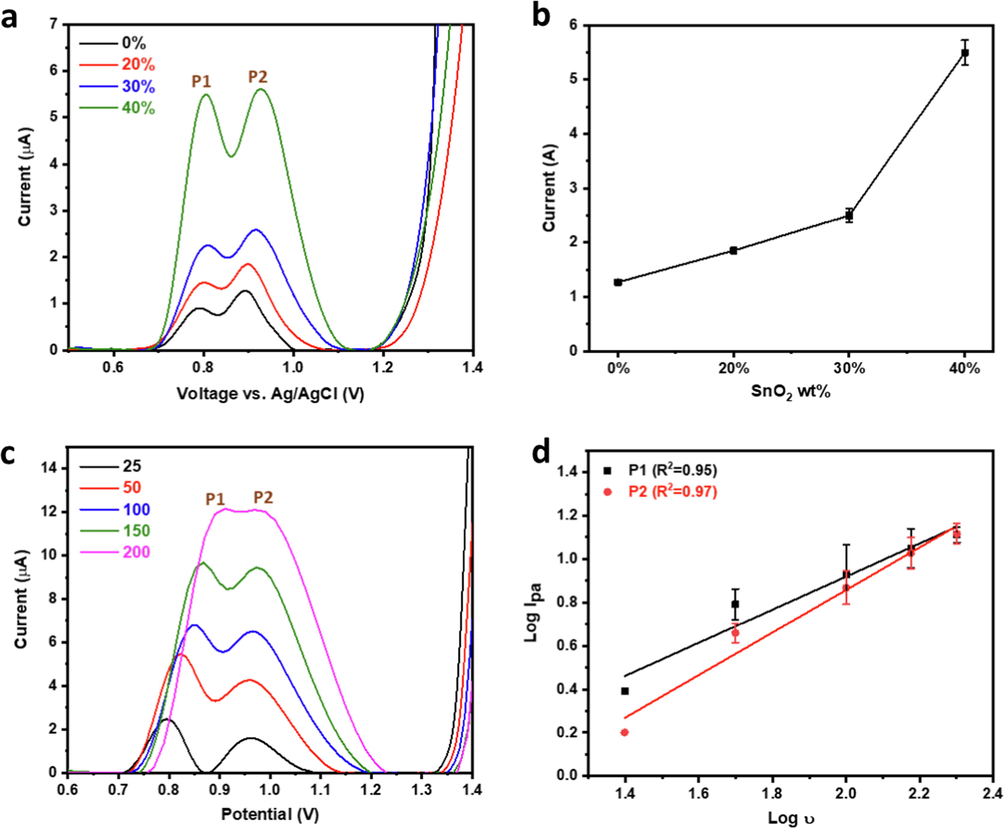
(a) DPV profiles and (b) corresponding P2 current analysis, (c) LSV profiles at different scan rates and their corresponding log Ipa vs log v plot of 35 µM CQP in pH 7.0 phosphate buffer using 40 % SnO2-CPE.
Interestingly, the anodic peak potential showed a slight positive shift upon SnO2 incorporation, where the anodic peak doublet potential reached 0.80/0.93 V at 40 % SnO2. This could be explained by the relatively higher resistance of the modified CPE electrodes compared to the bare ones, which could have resulted in the observed slight overpotential. Due to the significantly high CQP oxidation current achieved by 40 % SnO2-CPE, our study used this electrode composition thereafter.
The best-performing 40 % SnO2-CPE was further characterized and compared with unmodified CPE. FTIR of CPE with 0 % SnO2 showed peaks at ∼ 2917 cm−1, ∼2851 cm−1, and ∼ 1458 cm−1, the first 2 could be assigned to asymmetric and symmetric CH2 stretching, respectively (Zhang et al., 2015), while the third could be attributed to CH2 bending vibration (Li et al., 2022). Upon addition of 40 % SnO2, a band appeared at ∼ 546 cm−1 corresponding to Sn-O-Sn vibration (Wan et al., 2018) (Fig. S1a). TGA of CPE with 0 % SnO2 showed ∼ 20 % weight loss at 150–350 °C, which could be attributed to the decomposition of mineral oil (Kök et al., 2021), and another major weight loss region beginning at ∼ 650 °C and was still ongoing till 800 °C, which could be attributed to graphite oxidation (Farivar et al., 2021). However, graphite oxidation was incomplete, as indicated by the 31.3 % residue, which corresponded to 39.1 % of the graphite content. The 40 % SnO2-CPE showed a similar TGA profile with a residue of 56.5 %, which corresponded to 40.9 % SnO2 content after excluding the weight of the unoxidized graphite residue (Fig. S1b). XPS survey spectrum of 40 % SnO2-CPE showed C1s, Sn 3d, Sn 4d, and O 1 s peaks, confirming the chemical composition of the electrode (Fig. S1c). The Sn 3d core level spectrum was almost identical to that of SnO2 powder with only a minor positive shift in the binding energy of ∼ 0.3 eV (Fig. S1d), which could be due to minor interaction between the SnO2 nanoparticles with the mineral oil and graphite.
The electrochemical oxidation of CQP was studied via linear sweep voltammetry (LSV) at increasing scan rates (Fig. 8c-d). The relationship between Ipa and the scan rate (v) sheds light on the electrochemical reaction mechanism, where a linear relationship with the scan rate and square root of the scan rate indicates a diffusion-controlled and adsorption-controlled mechanism, respectively (Ibrahim et al., 2020; Wu et al., 2019). Log Ipa vs log v plot showed a linear relationship with slopes of 0.76 and 0.98 for both components of the peak doublet, which are close to 1.0, indicating an adsorption-controlled process (Fig. 8d). The positive shift of the oxidation potentials for both peaks with the scan rate indicated an irreversible reaction (Madej et al., 2019), in agreement with the previous reports on CQP (Ganguly and Hwa, 2022; Srivastava et al., 2019; Mashhadizadeh and Akbarian, 2009). The effect of pH on the electrochemical oxidation of CQP was also studied in phosphate buffer at a pH range of 6.3–7.6 (Fig. 9a). It was observed that the oxidation of CQP was pH dependent where the Ipa increased linearly with the increase in pH until pH 6.9, the rate of increase decreased at higher pH values reaching a maximum at pH 7.3 and then decreased thereafter (Fig. 9b). Both peaks showed similar behavior indicating similar reaction mechanisms for both processes. The effect of pH change on the CQP oxidation potential was also studied. It was found that the CQP oxidation peaks' potentials decreased linearly with the increase in pH with slopes of −70 mV and −100 mV for the first and second peaks, respectively (Fig. 9c), which indicated an electrochemical process with an almost equal number of electrons and protons for the former and higher number of protons involved in the latter (Ibrahim et al., 2020; Ibrahim et al., 2020). Different electrochemical techniques were studied to determine the optimal protocol for the electrochemical analysis of CQP, with all standard parameters, kept constant in the comparison. DPV and square wave Voltammetry (SWV) were carried out at a pulse amplitude of 60 mV, potential increment of 20 mV, pulse period of 200 ms, and sampling width of 5 ms. LSV was conducted at a scan rate of 100 mV that matched that of DPV and SWV. The pulse voltammetry techniques had higher sensitivity than LSV, which could be attributed to their inherent ability to amplify the Faradaic components and thus increase signal sensitivity. SWV was found to be ∼ 50 % higher than DPV, which is a significant increase indicating the high sensitivity of SWV for detecting the oxidation signal of CQP (Fig. 9d). The SWV method was fully optimized, as shown in the supplementary information.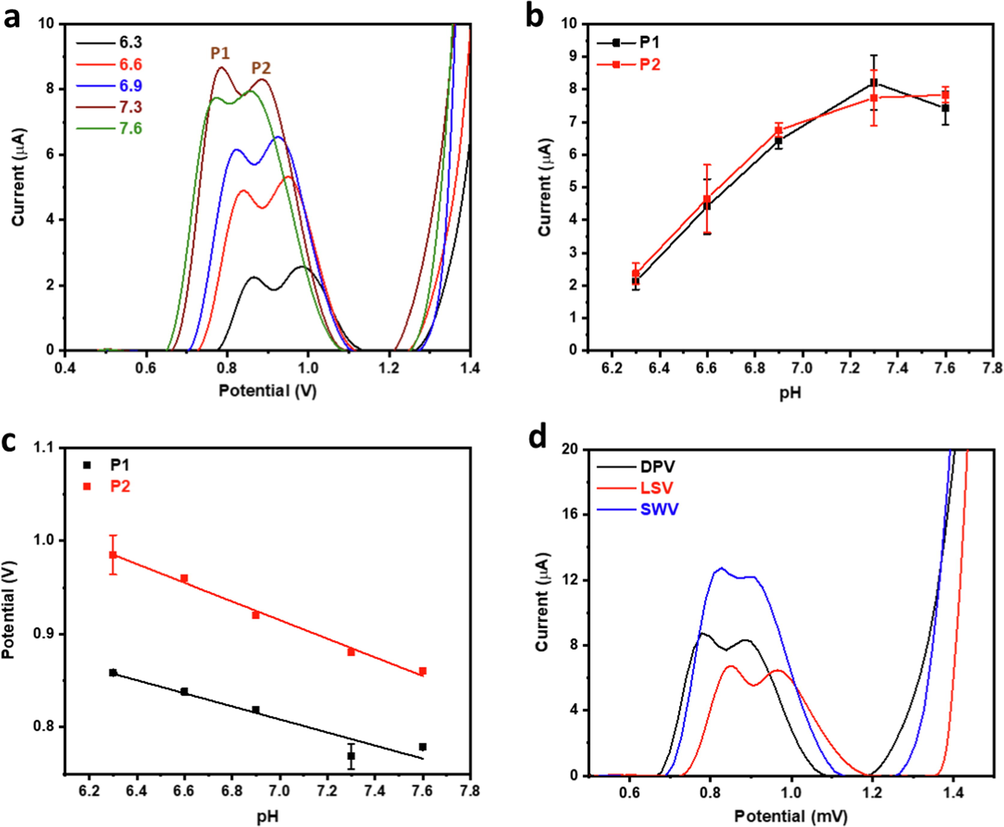
(a) Effect of pH on DPV profile and corresponding (b) peak current and (c) potential analysis, and (d) effect of different voltammetric techniques on oxidation peak of 35 µM CQP using 40 % SnO2-CPE.
A calibration curve was established based on the optimized conditions with two linear regions spanning a wide concentration range of 0.1–23.3 µM (Fig. 10a-b). The two linear ranges of 0.1–9.7 µM and 9.7–23.3 µM have linear regression equations of
and
with R2 of 0.998 and 0.995, respectively. The electrode's sensitivity was calculated based on the slope of the lower linear range of the calibration curve and the electrochemical surface area of the electrode to be 35.74 µA/µM.cm2. The LOD and LOQ were calculated according to Eqs. 5 and 6 (Oliveira et al., 2020; Ibrahim et al., 2020), to be 0.01 µM and 0.04 µM, respectively.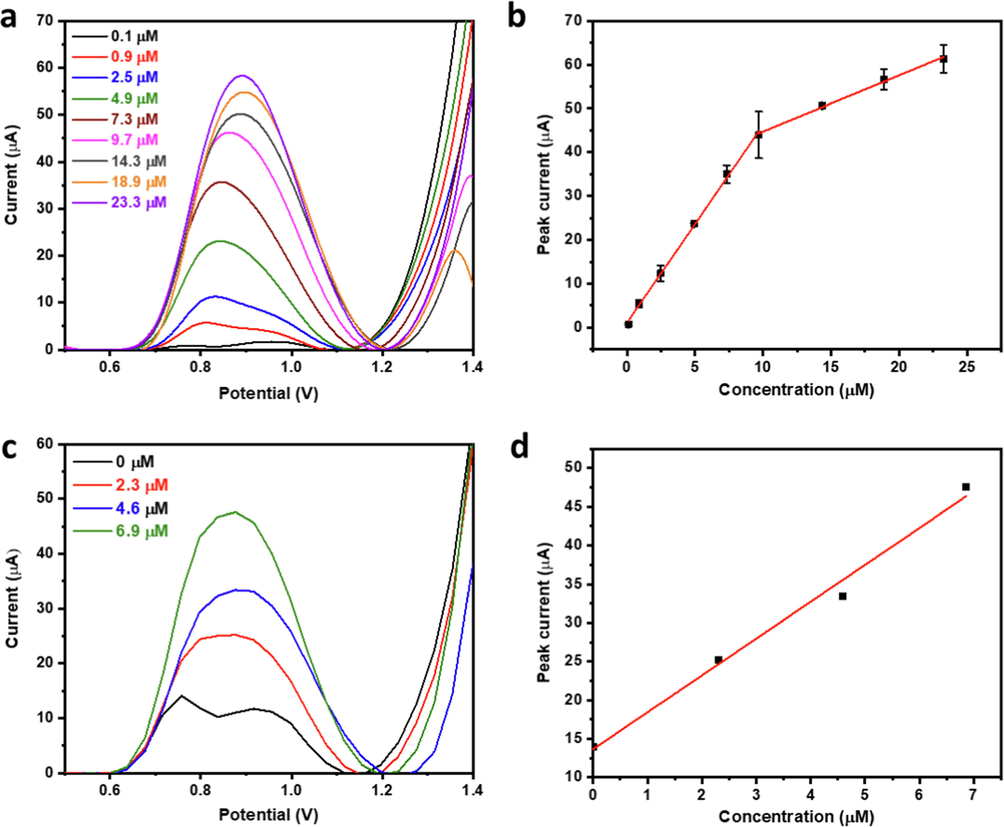
(a) SWV profiles and (b) corresponding calibration curve of CQP in pH 7.3 phosphate buffer using 40% SnO2-CPE. (c) Standard addition SWV profiles and corresponding (d) peak current vs concentration plot for detecting CQP in commercial pharmaceutical tablets.
Where is the standard deviation of the blank and s is the slope of the lower linear range of the calibration curve. Our SnO2-CPE achieved excellent and highly competitive performance. The linear range is as low as 0.1 µM, which is lower than almost all of the previously reported systems (Radi, 2005; Ganguly and Hwa, 2022; Srivastava et al., 2019; Mashhadizadeh and Akbarian, 2009), and our highest limit of 23.3 µM was higher than many of the reported ranges as well (Oliveira et al., 2020; Radi, 2005; Mashhadizadeh and Akbarian, 2009). The obtained LOD of 0.01 µM is lower than most reports (Radi, 2005; Srivastava et al., 2019; Mashhadizadeh and Akbarian, 2009), and our electrode sensitivity is comparable to the best-reported value (Ganguly and Hwa, 2022). In short, we achieved remarkable performance using our SnO2-CPE that superseded most previously reported systems, as summarized in Table S3. The exceptional performance of our electrochemical system could be attributed to the high electrocatalytic activity of SnO2 nanoparticles. The small size and good distribution of the SnO2 nanoparticles within the graphite matrix resulted in high electrochemical surface area, uniform distribution of electroactive sites, and high electrode conductivity and electrochemical activity. Although two electrodes achieved slightly better performance than our SnO2-CPE, namely, boron-doped diamond electrode (Oliveira et al., 2020) and ZnSe/rGO-ODA/SPCE (Ganguly and Hwa, 2022), our system is more facile, easier to prepare and process, and is less costly than such systems. Thus, our electrode can provide comparable performance at much less money, time, and labor cost, which makes it more practical and economical.
The electrochemical system's selectivity, repeatability, reproducibility, and stability are paramount for practical application. To apply our electrochemical system for CQP detection in different areas, such as biological, pharmaceutical QC, and environmental monitoring, the electrode has to be very selective to CQP with minimal response variation in excess amounts of common interferents. To test the selectivity of our electrode, we carried out CQP oxidation in the presence of various potential interferents, including biomolecules, pharmaceutical excipients, and salts, namely glucose, urea, ascorbic acid, KCl, and NaCl at 100
the concentration of CQP and sucrose at 10
CQP concentration (Fig. S4). The interferents have a minor effect on the CQP oxidation peak current, with all of them displaying < 7 % relative error (Fig. 11). We have also demonstrated the repeatability and reproducibility of our sensor over five measurements using the same electrode and different electrodes, achieving a relative standard deviation (RSD) of 2.46 % (Fig. S5a) and 1.86 % (Fig. S5b), respectively, which demonstrated the reliability of our measurements and the robustness of our electrode preparation and processing technique. We also tested the stability of our electrode, demonstrating outstanding performance after one-week storage with > 85 % oxidation current retention (Fig. S6).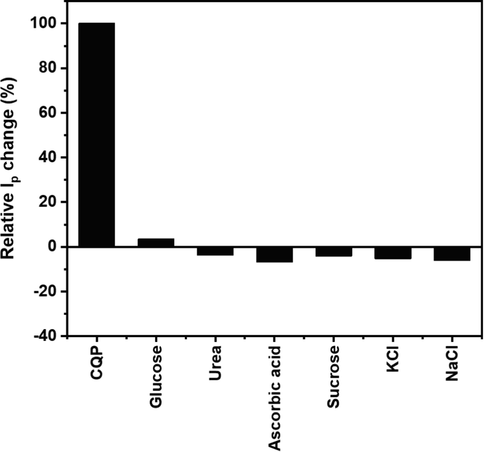
Relative peak current change of CQP in the presence of various interferents at 10–100
molar ratio.
Real sample analysis was conducted to demonstrate the validity of our analytical method for complex matrices and commercial applications. Commercial pharmaceutical CQP tablets were selected for the real sample application. The average tablet weight was determined by weighing five tablets, and then ten tablets were crushed to powder, and the average tablet weight was extracted in ultrapure water and filtered. Analysis was carried out in pH 7.3 phosphate buffer using standard addition to reduce the impact of tablet excipients on the analysis accuracy (Fig. 10c-d). A linear standard addition plot was obtained from which the actual concentration was calculated, achieving a percentage recovery of ∼ 102 %. To further demonstrate the validity of the developed electroanalytical system for practical applications, it was applied for the detection of trace levels of CQP in a tertiary wastewater sample collected from an urban landscape irrigation area. The wastewater sample was spiked with 0.35, 2.1, and 3.5 µM of CQP and analyzed using the SnO2-based CPE sensor, and the CQP was detected quantitatively with recovery percentages of 82.1, 94.7, and 89.2 %, respectively (Fig. S7).
4 Conclusion
In summary, we have developed a novel SnO2-CPE electrochemical sensor for the analysis of CQP with excellent accuracy, sensitivity, and stability. Our SnO2-CPE is inexpensive and easy to process and regenerate. The SnO2 nanoparticles imparted high electrochemical activity resulting in remarkable sensitivity, mainly due to the small size and electrocatalytic properties of SnO2 nanoparticles and their high surface area and good distribution within the CPE. We developed and optimized an SWV analytical technique using 40 % SnO2-CPE for CQP detection. Our system has a high sensitivity of 35.7 µA/µM.cm2, a linear range of 0.1 µM-23.3 µM and very low LOD and LOQ of 0.01 and 0.04 µM, respectively, which are comparable to the best reported in the literature. We have displayed a high selectivity, repeatability, reproducibility, and stability of our system. Moreover, we also demonstrated practical application by analyzing commercial CQP pharmaceutical tablets, achieving an excellent percentage recovery of ∼ 102 %.
Funding
This research is funded by the Research Institute of Science and Engineering (RISE), University of Sharjah, Sharjah, United Arab Emirates, competitive grants: V.C.R.G/ R. 438/2021 and V.C.R.G. / R. 447/2022.
CRediT authorship contribution statement
Ayman AbdelHamid: Methodology, Validation, Formal analysis, Investigation, Data curation, Writing – original draft, Visualization. Abdelaziz Elgamouz: Conceptualization, Methodology, Validation, Formal analysis, Investigation, Resources, Data curation, Writing – original draft, Writing – review & editing, Visualization, Supervision, Project administration, Funding acquisition. Monther Khanfer: Writing – review & editing, Visualization, Supervision, Project administration, Funding acquisition. Abdel-Nasser Kawde: Conceptualization, Methodology, Validation, Formal analysis, Investigation, Resources, Data curation, Writing – original draft, Writing – review & editing, Visualization, Supervision, Project administration, Funding acquisition.
Acknowledgments
Abdel-Nasser Kawde and Abdelaziz Elgamouz acknowledge the financial support received from the Research Institute of Science and Engineering (RISE), University of Sharjah, Sharjah, United Arab Emirates, Competitive Research Project (V.C.R.G/ R. 438/2021), Collaborative Research Project (V.C.R.G. / R. 447/2022) and Seed Project (V.C.R.G. / R. 447/2022).
Declaration of Competing Interest
The authors declare that they have no known competing financial interests or personal relationships that could have appeared to influence the work reported in this paper.
References
- Defect assisted improved room temperature ferromagnetism in Ce doped SnO2 nanoparticles. Appl. Surf. Sci.. 2019;483:463-471.
- [Google Scholar]
- Investigation of the structural and electrochemical properties of size-controlled SnO2 nanoparticles. J. Phys. Chem. B. 2004;108:9815-9820.
- [Google Scholar]
- NiO nanoparticles modified carbon paste electrode as a novel sulfasalazine sensor. Anal. Chim. Acta. 2018;1031:47-59.
- [Google Scholar]
- Voltammetric sensor based on Co3O4/SnO2 nanopowders for determination of diltiazem in tablets and biological fluids. J. Nanostruct. Chem.. 2016;6:121-128.
- [Google Scholar]
- N. Baig, A.-N. Kawde, A. Elgamouz, A cost-effective disposable graphene-based sensor for sensitive and selective detection of uric acid in human urine, Biosens. Bioelectron.: X, 11 (2022) 100205.
- Porous graphene-based electrodes: advances in electrochemical sensing of environmental contaminants. Trends Environ. Anal. Chem.. 2021;30:e00120.
- [Google Scholar]
- Graphene nanosheet-sandwiched platinum nanoparticles deposited on a graphite pencil electrode as an ultrasensitive sensor for dopamine. RSC Adv.. 2022;12:2057-2067.
- [Google Scholar]
- M.A. Castro e Souza, N.F.A. Reis, L. de Souza Batista, I. da Costa César, C. Fernandes, G.A. Pianetti, An Easy and Rapid Spectrophotometric Method for Determination of Chloroquine Diphosphate in Tablets, Curr. Pharm. Anal., 16 (2020) 5-11.
- A flexible carbon counter electrode for dye-sensitized solar cells. Carbon. 2009;47:2704-2708.
- [Google Scholar]
- A. Diéguez, A. Romano-Rodrı́guez, A. Vilà, J.R. Morante, The complete Raman spectrum of nanometric SnO2 particles, J. Appl. Phys., 90 (2001) 1550-7.
- Synthesis of tin oxide-coated gold nanostars and evaluation of their surface-enhanced Raman scattering activities. J. Mater. Sci.. 2018;53:16345-16356.
- [Google Scholar]
- Effect of AgNPs internal solution on the sensing of mercury(II) by an ion-selective electrode based on a thiol coordination from cysteine as ionophore. J. Electroanal. Chem.. 2021;895:115443
- [Google Scholar]
- Unlocking thermogravimetric analysis (TGA) in the fight against “Fake graphene” materials. Carbon. 2021;179:505-513.
- [Google Scholar]
- Construction of zinc selenide microspheres decorated with octadecylamine-functionalized reduced graphene oxide as an effective catalyst for the dual-mode detection of chloroquine phosphate. Mater. Today Chem.. 2022;24:100862
- [Google Scholar]
- Biogenically structural and morphological engineering of Trigonella foenum-graecum mediated SnO2 nanoparticles with enhanced photocatalytic and antimicrobial activities. Mater. Chem. Phys.. 2022;282:125946
- [Google Scholar]
- The analysis of ancient glasses part I: Materials, properties, and early European glass. JOM. 1995;47:62-64.
- [Google Scholar]
- Vanadium selenide decorated reduced graphene oxide nanocomposite: a co-active catalyst for the detection of 2,4,6 - Trichlorophenol. Chemosphere. 2021;282:130874
- [Google Scholar]
- A new hybrid nanocomposite electrode based on Au/CeO2-decorated functionalized glassy carbon microspheres for the voltammetric sensing of quercetin and its interaction with DNA. Anal. Methods. 2020;12:2846-2857.
- [Google Scholar]
- A novel platform based on Au−CeO2@MWCNT functionalized glassy carbon microspheres for voltammetric sensing of valrubicin as bladder anticancer drug and its interaction with DNA. Electroanalysis. 2020;32:2146-2155.
- [Google Scholar]
- S. Jayapandi, S. Premkumar, D. Lakshmi, P. Packiyaraj, K. Balaji viswanath, P. Sivaraj, et al., Reinforced photocatalytic reduction of SnO2 nanoparticle by La incorporation for efficient photodegradation under visible light irradiation, J. Mater. Sci.: Mater. Electron, 30 (2019) 8479-92.
- Amperometric l-lysine biosensor based on carboxylated multiwalled carbon nanotubes-SnO2 nanoparticles-graphene composite. Appl. Surf. Sci.. 2017;419:916-923.
- [Google Scholar]
- TGA and DSC investigation of different clay mineral effects on the combustion behavior and kinetics of crude oil from Kazan region. Russia J. Pet. Sci. Eng.. 2021;200
- [Google Scholar]
- Electrochemical sensor for simultaneous determination of epinephrine and norepinephrine based on cetyltrimethylammonium bromide assisted SnO2 nanoparticles. J. Electroanal. Chem.. 2017;801:503-510.
- [Google Scholar]
- Separation and identification of nanoplastics in tap water. Environ. Res.. 2022;204:112134
- [Google Scholar]
- Flow-injection chemiluminescence determination of chloroquine using peroxynitrous acid as oxidant. Talanta. 2004;62:757-763.
- [Google Scholar]
- Determination of viloxazine by differential pulse voltammetry with boron-doped diamond electrode. Monatsh. Chem.. 2019;150:1655-1665.
- [Google Scholar]
- Nanostructured SnO2 integrated conductive fabrics as binder-free electrode for neurotransmitter detection. Sens. Actuator A Phys.. 2018;269:401-411.
- [Google Scholar]
- HPLC methods for choloroquine determination in biological samples and pharmaceutical products. DARU J. Pharm. Sci.. 2021;29:223-239.
- [Google Scholar]
- Voltammetric determination of some anti-malarial drugs using a carbon paste electrode modified with Cu(OH)2 nano-wire. Talanta. 2009;78:1440-1445.
- [Google Scholar]
- Highly sensitive voltammetric determination of NADH based on N-CQDs decorated SnO2/ionic liquid/carbon paste electrode. Nanotechnology. 2022;33:195502
- [Google Scholar]
- G.G. Oliveira, D.C. Azzi, T.A. Silva, P.R.d. Oliveira, O. Fatibello-Filho, B.C. Janegitz, Sensitive Voltammetric Detection of Chloroquine Drug by Applying a Boron-Doped Diamond Electrode, C, 6 (2020) 75.
- Electrochemical impedance studies of chitosan-modified electrodes for application in electrochemical sensors and biosensors. Electrochim. Acta. 2010;55:6239-6247.
- [Google Scholar]
- Accumulation and trace measurement of chloroquine drug at DNA-modified carbon paste electrode. Talanta. 2005;65:271-275.
- [Google Scholar]
- Therapy and pharmacological properties of hydroxychloroquine and chloroquine in treatment of systemic lupus erythematosus, rheumatoid arthritis and related diseases. Inflammopharmacology. 2015;23:231-269.
- [Google Scholar]
- Raman surface vibration modes in nanocrystalline sno2: correlation with gas sensor performances. Chem. Mater.. 2005;17:893-901.
- [Google Scholar]
- Size controlled synthesis of SnO2 and its electrostatic self- assembly over reduced graphene oxide for photocatalyst and supercapacitor application. Mater. Res. Bull.. 2018;106:103-112.
- [Google Scholar]
- A new electrochemical sensor for simultaneous determination of arbutin and vitamin C based on hydroxyapatite-ZnO-Pd nanoparticles modified carbon paste electrode. Biosens. Bioelectron.. 2019;141:111474
- [Google Scholar]
- Photocatalytic degradation of brilliant green using undoped and Zn doped SnO2 nanoparticles under sunlight irradiation. Appl. Surf. Sci.. 2016;360:283-290.
- [Google Scholar]
- Synthesis of SnO2 nanowires as a reusable and flexible electrode for electrochemical detection of riboflavin. Microchem. J.. 2020;156:104858
- [Google Scholar]
- Voltammetric determination of the antimalarial drug chloroquine using a glassy carbon electrode modified with reduced graphene oxide on WS2 quantum dots. Mikrochim. Acta. 2019;186:415.
- [Google Scholar]
- Nanomedicine reformulation of chloroquine and hydroxychloroquine. Molecules. 2021;26:175.
- [Google Scholar]
- The relationship between nanoscale structure and electrochemical properties of vanadium oxide nanorolls. Adv. Funct. Mater.. 2004;14:1197-1204.
- [Google Scholar]
- Multi-walled carbon nanotube modified carbon paste electrode as a sensor for the amperometric detection of L-tryptophan in biological samples. J. Colloid Interface Sci.. 2013;402:223-229.
- [Google Scholar]
- Fabrication of amperometric cholesterol biosensor based on SnO2 nanoparticles and Nafion-modified carbon paste electrode. Chem. Pap.. 2016;70:695-705.
- [Google Scholar]
- 2D SnO2 nanosheets: synthesis, characterization, structures, and excellent sensing performance to ethylene glycol. Nanomaterials. 2018;8:112.
- [Google Scholar]
- Construction of effective electrochemical sensor for the determination of quinoline yellow based on different morphologies of manganese dioxide functionalized graphene. J. Food Compos. Anal.. 2019;84:103280
- [Google Scholar]
- Three-dimensional coral-like structure constructed of carbon-coated interconnected monocrystalline SnO2 nanoparticles with improved lithium-storage properties. ChemElectroChem. 2016;3:1098-1106.
- [Google Scholar]
- Pore structure and fractal characteristics of different shale lithofacies in the dalong formation in the Western Area of the Lower Yangtze Platform. Minerals. 2020;10:72.
- [Google Scholar]
- A novel flexible room temperature ethanol gas sensor based on SnO2 doped poly-diallyldimethylammonium chloride. Sensors. 2013;13:4378-4389.
- [Google Scholar]
- Analysis of carbonyl value of frying oil by fourier transform infrared spectroscopy. J. Oleo Sci.. 2015;64:375-380.
- [Google Scholar]
- Copper nanoparticles incorporating a cationic surfactant-graphene modified carbon paste electrode for the simultaneous determination of gatifloxacin and pefloxacin. J. Electroanal. Chem.. 2020;857:113730
- [Google Scholar]
- J.L. Zurita, Á. Jos, A.d. Peso, M. Salguero, M. López-Artíguez, G. Repetto, Ecotoxicological evaluation of the antimalarial drug chloroquine, Aquat. Toxicol., 75 (2005) 97-107.
Appendix A
Supplementary material
Supplementary data to this article can be found online at https://doi.org/10.1016/j.arabjc.2023.104674.
Appendix A
Supplementary material
The following are the Supplementary data to this article:Supplementary data 1
Supplementary data 1


