

Translate this page into:
Optimum formulation design and properties of drilling fluids incorporated with green uncoated and polymer-coated magnetite nanoparticles
⁎Corresponding author. rsf760h@pete.soran.edu.iq (Rasan Faisal)
-
Received: ,
Accepted: ,
This article was originally published by Elsevier and was migrated to Scientific Scholar after the change of Publisher.
Peer review under responsibility of King Saud University. Production and hosting by Elsevier.
Abstract
Nanomaterials are materials that possess unique properties due to their high specific surface area and quantum effects. Nanomaterials have diverse applications in different fields including the petroleum and gas industry as additives. One of the classes of nanomaterials that currently have potential usage in the downstream, midstream, and upstream processes of the petroleum industry is nanoparticles (NPs). Among the upstream processes in the petroleum and gas industry is the drilling operations. It is popular that the most critical features that ensure the success of a drilling operation are the rheological and filtration loss characteristics of the drilling fluid. The current work deals with the synthesis of green uncoated and polymer-coated green magnetite nanoparticles (MNPs). The MNPs were characterized and assessed as rheology and filtration loss modifiers for water-based drilling fluids. The optimum formulation design of drilling fluids incorporated the MNPs for high-performance drilling fluids in terms of density, rheological, filtration loss, and sagging properties was identified. The effect of temperature (ambient − 80 °C), and aging time (6–248 h) on the investigated properties were evaluated. The results confirmed that optimum values for plastic viscosity, apparent viscosity, yield Point, gel strength (10sec), gel strength (10 min), mud thickness, and sag index were 13.77 cP, 69.69 cP, 89.87 lb/100ft2, 86.75 lb/100ft2, 128.38 lb/100ft2, ≤ 1 mm, and 0.511, respectively. Most of those values could be reached using an optimum formulation involving 0.92 % MNPs at ambient temperature. Increasing the temperature displays a decrease in the values while increasing the aging time displays an increase in the values. Drilling fluids with MNPs showed insignificant changes in the investigated properties with increasing temperature in particular those incorporated with polymer-coated MNPs compared to the water-based drilling fluids.
Keywords
Green magnetite nanoparticles
Polymer-coated green magnetite nanoparticles
Water-based drilling fluids
Rheology and Filter cake
Aging
Sagging

1 Introduction
Drilling fluids including water-based formulations have always been a very important part of drilling engineering. Their proper functionality helps reduce many drilling problems. Therefore, an efficient understanding of drilling fluids and their proper selection are essential to ensure that the drilling fluid can perform its functions properly including formation collapse prevention, and creating mud cake on the wall of the hole (Faisal et al., 2023b; Adil et al., 2023). In addition, it controls and maintains the stability of uncased well formations, resists or reduces the formation fluid entrance to enter the well, and provides mechanical energy (Alkalbani et al., 2023). Moreover, it protects the drill string against corrosion, cooling and lubricating the bit and drill string, and helps in cementing operation (Zhang et al., 2023). When the circulation system is stopped, the drilling mud keeps the cuttings suspended, carry and transports the cuttings from the subsurface to the surface, and provides a sufficient hydrostatic pressure to control and balance the formation pressure (Ji et al., 2023). On another hand, mud flow properties can be defined by rheological properties in different flow circumstances (Jimoh et al., 2021). Flow rates vary for different sizes and shapes of pipes in a drilling fluid circulating system, therefore it is important to identify the rheological properties, and the mud flow behavior in different points of interest in the mud circulating system. Mud rheology affects the hole-cleaning ability, therefore, it is significant to investigate and develop mud rheology in order to prepare a suitable drilling mud with improved carrying capacity (Adil et al., 2023).
The entrance of drilling fluid into a formation called mud filtrate, filtration of drilling fluid causes several severe damages to the well such as loss of drilling fluid, stuck pipe, sloughing, swelling, reducing the penetration rate (Oseh et al., 2023). However, the deposits of solids in the form of a cake lead to borehole stability and control the invasion of the permeable zone by the liquid phase and thus decrease the formation damage. Ideal mud guarantees small filter loss, thin and compact mud cake. The main factors that influence the filtration properties are permeability of mud cake, time, solids concentration, filtrate viscosity, and differential pressure (Prakash et al., 2023).
In connection, designing a drilling fluid by using nanosized material has paid a lot of interest in the past years. Different nanoparticle type, size and shapes were used to improve the rheology and filtration properties of water-based drilling fluids (Sarbast et al., 2022; Adil et al., 2023). The formulated nanofluids have been shown the capability to hinder the problems of formation damage (Zhong et al., 2023), and improve the physical–mechanical properties of drilling fluids (Afolabi et al., 2017). Advantageously, incorporation of metal oxide NPs in drilling fluids displayed notable performance for HPHT conditions. While, metal oxide nanocomposites and polymer-coated MNPs delivered astonishing outcome for shale inhibition, rheology, fluid loss control, mud cake thickness, and filtration properties (Alqahtani et al., 2023).
It was predicted that incorporation of nanosilica in water water-based drilling fluids enhances lifting and hole cleaning efficiency and mud stability. Also, control the amount of fluid loss in the permeable zones since the nanofluid will create a thin, compacted and impermeable filter cake when added to conventional drilling fluid (Bardhan et al., 2023). It was reported that a water-based drilling fluid fused with 5 % Grewia Optiva fbre powder (GOFP), and 4 % silica nano particles (SNP) lead to decrease the (high pressure, temperature) HPHT and (low pressure, temperature) LPLT filtration loss and filter cake thickness by 78.12, 74.03 % and 42.8 %, respectively compared to the base fluid. It was noted that SNP created an impermeable filter cake that controlled the invasion of any solid and liquid particle into the permeable formation and improved its mightiness due to the cross-linking ability of the nanoparticles that helped in bridging the micro sized (Prakash et al., 2021). The optimization of nano-silica in enhancing the drilling fluid property was studied by (Kevin and Mahmud, 2019). It was figured out that the designed mud for the 200°F and 350°F yielded a non-Newtonian property even when silica nanoparticle added at different concentrations, and the drilling mud rheology performance was accelerated after nano silica inclusion up to 40 % concentration. In another study, functional multi-walled carbon nanotubes (FMWCNTs) due to its higher surface area has improved drilling fluid rheological and filtration properties at 0.01 wt% to 0.5 wt% (Sajjadian et al., 2020). Mixing 0.05 w/v% of TiO2 NPs to polyanionic cellulose (PAC) and xanthan gum (XG) at different temperature ranges positively increased thermal stability and rheology of drilling fluids (Beg et al., 2020). Moreover, the synergy effect of TiO2/PAM at several concentrations 1 and 10 and 14 g significantly increased the drilling mud viscosity. From the results mud thickness has been decreased mainly and fluid loss improved by 64 % compared to traditional drilling fluids (Sadeghalvaad and Sabbaghi, 2015).
On the other hand, among the challenges that face oil and gas productions are increasing the pollution problem resulted from drilling operations including the hazardous nature of some drilling fluid additives generated as wastes during the drilling activities. Thus, drilling industry is looking for economical and biodegradable product to be utilized for reducing the overdependence on such expensive chemicals. Thus, natural products are preferred to be modified and employed in water-based mud systems (Borah and Das, 2022). Tight carbonate reservoirs which have microfractures and regarded as unconventional reservoirs are distributed in the Middle East with average porosity and permeability less than 10 % and 0.1mD, respectively (Rashid et al., 2015). The main factors that control carbonate reservoir properties are the pore microstructure, rock compositions, reservoir heterogeneity, depositional environment and wettability. The pore system of tight carbonate reservoir has a multiscale property ranging from the nano-to micro-scale with high heterogeneity and poor connectivity causing different multiscale formation damage (Bageri et al., 2021; Salih et al., 2023). It was noted that in low permeability carbonate reservoirs water block and stress sensitivity are the main damage mechanisms, and there is an essential need to work with eco-friendly and high performance drilling fluids for tight carbonate formations without formation damage (Borah and Das, 2022).
The main objectives of the current work focus on preparation and characterization of uncoated and polymer- coated green magnetite NPs, and formulation of smart water-based drilling fluids (nanofluids) based on using the green magnetite nanoparticles as additive. Then optimization and modeling the effect of MNPs content, type (coated with polymer and uncoated) and temperature on the rheological, density and filtration properties of the formulated drilling fluids using RSM. Further optimization for the contents of bentonite were carried on the optimum drilling fluid formulation. After finding the optimum concentration for each of the drilling mud ingredients, the drilling mud of the optimum formulation was tested for sagging.
2 Experimental part
2.1 Materials
Analytical grades of chemical reagents NaOH, Ethanol and chitosan are purchased from the Merck and Aldrich chemical company. Bentonite, barite, tap water and xanthan gum are used in formulation the base drilling mud. Iron (III) chloride hexahydrate (FeCl3*6H2O) and iron (II) chloride Dihydrate (FeCl2*2H2O) was purchased from Sigma Aldrich to prepare the green magnetite nanoparticles. All chemicals were used without any further purification.
2.2 Preparation of the green uncoated and polymer-coated MNPs
Magnetite Fe3O4 NPs has been synthesized by eco-friendly approach using a simple, green and one-step process. Cactus plant grow in wild was collected, washed and cut to small pieces, and then stored fresh in sealed containers for experimentation. Cactus extract was prepared by refluxing 25 g of the fresh Cactus in 250 ml distilled water for three hours at 60 °C. The extract was cooled and filtered two times. Separately, 0.1 M iron (II) chloride dihydrate (FeCl2·2H2O), 0.2 M iron (III) chloride hexahydrate (FeCl3·6H2O), and 0.1 NaOH solutions were prepared. The preparation procedures for the experiments include mixing equal volumes of the iron salt solutions with the plant extract. The amount of the cactus extract is first alkalinized by 0.1 M NaOH stepwise till pH reach 11. The alkalinized plant extract was dropped wisely to the mixture of (equal volumes of metal salts solutions) under constant stirring speed at 60 °C. The pH of the reaction was re-checked and maintained at 11 during the reaction period. The color of the reaction solution changes from red to black. The reaction was kept under continuous stirring for 1 h after changing the color. The NPs colloid was filtered and then NPs were purified by washing three times with ethanol, after that the pure NPs were dried in an oven at 70 °C till constant weight. The dried NPs were characterized by using UV, XRD, EDX, and SEM. Fig. 1 shows the scheme for the preparation of the green magnetic NPs.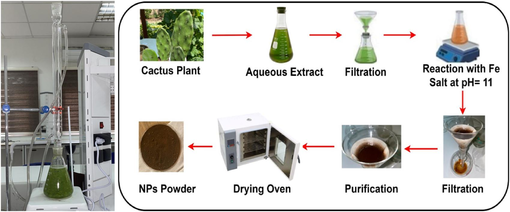
Left: Cactus plant extraction set-up, right: Scheme for the green magnetic NPs preparation.
The coated green MNPs were prepared by coating the virgin MNPs with chitosan. The cationic nature of chitosan has been considered for the development of particulate systems: chitosan can absorb on the negatively charged Fe3O4 nanoparticles. The procedure for the preparation of chitosan coated MNPs was carried out by dissolving 0.1 g of chitosan in 15 ml acetic acid solution in 250 ml beaker. The chitosan solution was stored overnight, then 1.5 g of (Fe3O4 NPs) is added and the mixture was agitated for 2 h at 60 °C, then cooled. The polymer coated MNPs were separated by centrifugation, washed, dried and stored.
2.3 Characterization of the green uncoated and polymer-coated MNPs
The green MNPs were prepared using cactus extract in an ecofriendly method. Fe ions from Iron (III) chloride hexahydrate and iron (II) chloride Dihydrate salt were used in the synthesis step, where they reacted with the cactus plant extract phytochemicals to create MNPs. UV–VIS spectroscopy, Energy Dispersive X-ray (EDX), X-ray diffraction (XRD), and scanning electron microscopy (SEM) were used to characterize the produced magnetite Fe3O4 NPs. SEM shows the geometry and morphology of Fe3O4 NPs, and UV–VIS spectroscopy, were done on the band gap and optical characteristics in the 300–700 nm wavelength. Whereas Energy Dispersive X-ray (EDX) was used to determine their elemental composition. Fig. 2 presents the results of characterizing green magnetite Fe2O3 NPs. Fig. 2a shows the UV–Visible spectra of green Fe3O4 NPs. A maximum absorption peak around 370 nm confirms the creation of Fe3O4 NPs. Similar UV results were found in the literature for magnetite NPs [18–21]. The Energy Dispersive X-ray (EDX) plots depicts that Fe is the main components of the MNPs structures (Fig. 2b). Fig. 2c show the scanning electron microscopy (SEM) image of Fe3O4 NPs. The SEM image shows the spherical shape, cubic-like shapes of MNPs with cluster formation morphologies. The XRD patterns of the green Fe3O4 NPs are illustrated in Fig. 2d. Fe3O4 NPs were scanned at 20 to 80 degrees 2 theta in accordance with JSPDS cards 98–016–––1291. Fe3O4 nanoparticles have a diffraction pattern that closely matches the crystalline magnetite peaks. The phytochemicals in the cactus plant extract are caused the oxide peaks. The average crystallite size was calculated by using Debye–Scherrer equation: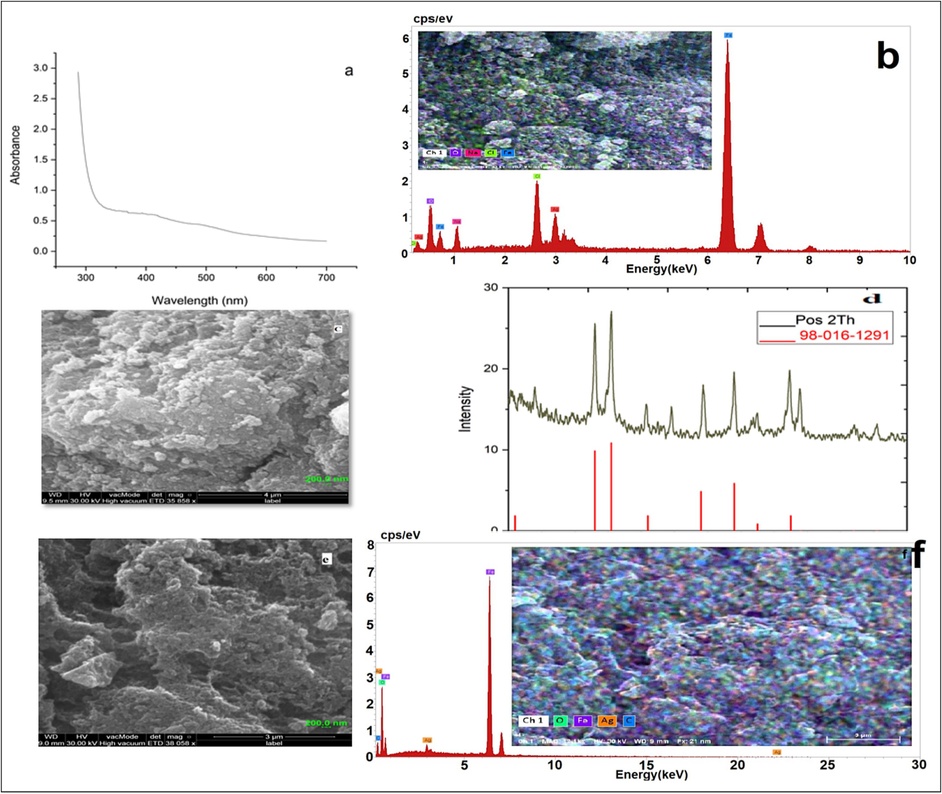
Characterization on Fe3O4 NPs. a: UV spectra, b: EDX pattern, c: SEM image, d:, XRD pattern (for the uncoated MNPs), e: SEM image; f: EDX pattern (for the chitosan-coated MNPs).
The polymer- coated MNPs were characterized by using EDX and SEM. Fig. 2e shows the SEM image of chitosan-coated MNPs. The image showed that the chitosan-coated MNPs have similar morphology of the uncoated virgin MNPs, but they agglomerated with more spaces between agglomerates. Similar trend was observed in literature with coated iron oxide NPs coated with xanthan gum [22]. The Energy Dispersive X-ray (EDX) images in Fig. 2f shows that C of chitosan is one of the components of the polymer coated MNPs structure, while Fe is the main component.
2.4 Drilling fluids formulations
The water based drilling fluid was of volume 400 ml, weighing 25.7 g bentonite, 4 wt% volume barite, 0.1 % xanthan, 0.29 g NaOH and tap water using an industrial scale electronic balance model LT1002T with a maximum capacity of 1000 g. At the beginning half of the fresh water is poured into a mixing cup and NaOH is added till dissolving, followed by bentonite and barite. The digital high shear speed mixer dispersator 220 V ± 5 % AC:50 Hz (model GJ-S5) was used to mix the drilling fluids prepared in this study. The remaining water was added and stirred with the handheld mixer for 5 min. The solution is allowed to stand for 16 h minimum for the bentonite to swell. Ten samples of water-based drilling fluids containing different percentage of the green magnetite NPs (0.075––0.92) g were formulated at different temperatures (21.7–78.8) oC according to a two factorial central composite design to investigate the effect of MNPs content and temperature on the rheological and filtration properties of the drilling mud.
2.5 The rheological, density and filtration loss testing
The rheological properties of the drilling muds were measured using Electronic six - speed rotational viscometer ZNN - D6B drilling fluid slurry viscosity shear rate tester 110/220 V. Plastic viscosity (PV), apparent viscosity (AP) and yield point (YP) were calculated via Eqs. (2)–(4).
The drilling mud density was calculated via mud balance equipment. The device consists of a constant volume cup with a lever arm and rider calibrated to read directly the density of the fluid in ppg. The API filter presses cylindrical mold was used to calculate the fluid loss of the prepared drilling fluids. The drilling fluid was exposed to 100 psi pressure. Up to 30 min of liquids were recovered from the mud (API 13A). The test consists of monitoring the rate at which fluid is forced from a filter press under specific conditions of time (30 min), temperature and pressure (100 psi), then measuring the fluid loss volume and the thickness of the residue deposited upon the filter paper. Fig. 3 presents a schematic diagram for the processes for drilling fluids formulation and testing.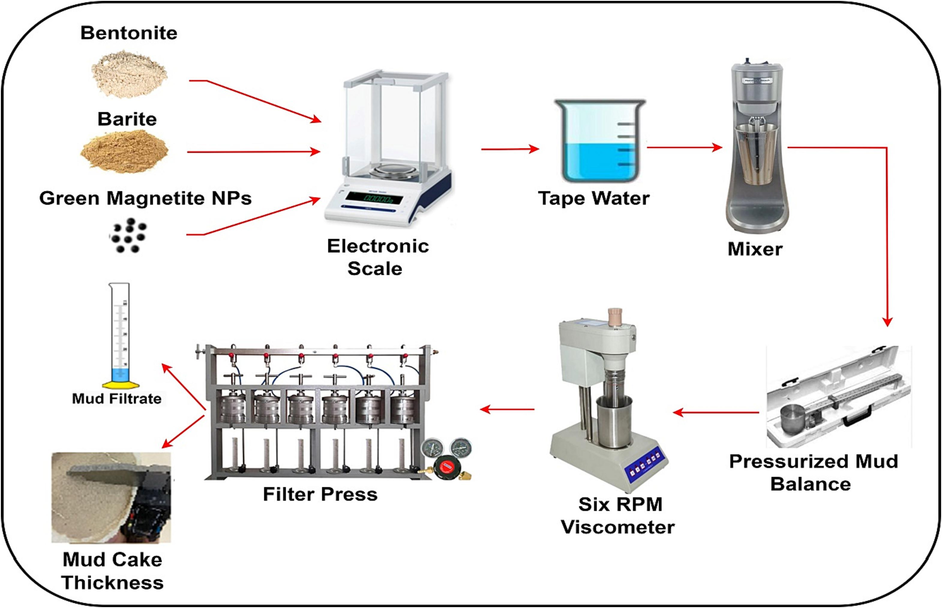
A schematic diagram illustrating the set of processes carried out for drilling fluids formulation and properties.
Extra experiments were designed manually to optimize the bentonite and barite content. The experimental data of the rheology dial readings and filtration loss for 10 experiments designed using RSM are presented in Table 1.
No
Temp oc
Nano wt.%
PV (cP)
AP (cP)
YP
(Ib/100 ft2)
Gel strength lb/100ft2
(10sec)
Gel strength lb/100ft2 (10 min)
Filtrate volume (ml)
Mud cake thickness (mm)
1
21.7
0.5
12
56
88
84
125
13
1.3
2
70.0
0.8
11
54
86
82
122
14
1.5
3
50.0
0.92
12.5
56.8
88.5
85
126
11.5
1.2
4
30.0
0.2
9
50
84
78
115
14.5
1.4
*5
50.0
0.5
11
54.5
87
83
123
15
1.5
6
30.0
0.8
13
57.5
89
86
127
12
1.3
7
78.3
0.5
10
52.5
85
79
119
18
2.5
8
70.0
0.2
8
49.5
83
76
113
17
2
9
50.0
0.075
7
48
82
72
109
18.5
2.5
2.6 Sag test
After finding the optimum concentration for each of the drilling mud ingredients. The sag tests were performed for the optimum formulation of the drilling fluid using various barite concentrations (4, 5, 6, and 8) wt.%. The sag test was conducted to evaluate the effect of barite concentration on the drilling fluid stability. Static sag test was performed at vertical conditions by using static sag test apparatus. The test was run for 24 h at 250F. The idea of sag test is to estimate the drilling mud homogeneity by calculating the mud density at the top and bottom of the drilling fluid column after 24 h. The sag factor is used to evaluate the fluid homogeneity along the drilling fluid column. The sag factor is calculated from the density of both top and bottom fluid samples using eq. (5). The Sag factor should be within 0.50 and 0.53 rang for a stable and homogeneous fluid, while particle settlement is predicted if the sag factor is exceeding this value.
3 Experimental results and discussion
3.1 Barite optimization
Drilling mud density is one of the critical parameters that is used to study the effect of drilling fluids on the filter cake properties, filtrate loss and formation damage. In this study barite (BaSO4) as one of the most common weighting material was used. Barite was used with a range of (1, 2, 4, 6, and 8) wt.%. It was added gradually to the base drilling mud formulation to increase the mud density. The effect of the barite wt.% on the density of the formulated muds is illustrated in Fig. 4.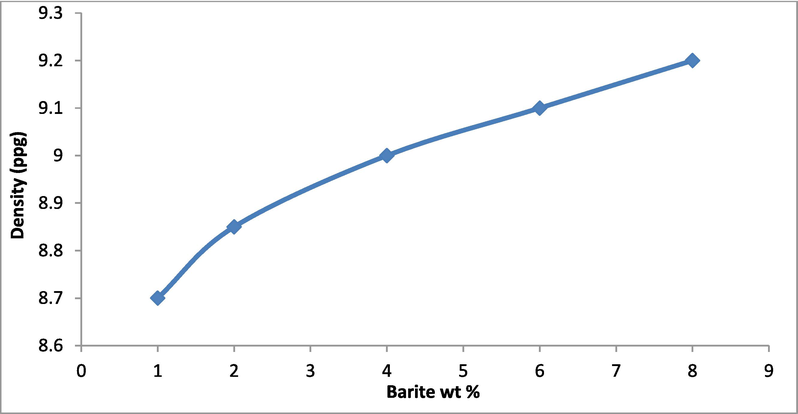
Drilling fluid density at various barite wt.%.
It is clear that with increasing barite wt.%, the higher mud densities are obtained. The control of density during drilling operation is significant since an unreasonably heavy drilling mud may lead to formation breakdown, consequently cause partial or a complete loss of a well, and increasing drilling cost. On the other hand, too small mud density value may lead to well kick or blowout. The effects of barite wt. % on the drilling mud rheology are shown in Fig. 5. It is indicated that rheological properties changes with barite content, thus, to guarantee a favorable rheological property of a drilling mud the barite concentrations must be optimized. The results declared that increasing barite concentration increases the PV, AP, YP, and gel strength value of the formulated water-based muds. However, higher PV is achieved with 4 wt% of barite. Regarding the effect of barite wt. % on the mud cake thickness and filtrate volume, the study revealed that the thickness of the filter cake and the filtrate volume ranges change with barite content. Adding the proper content of the weighting material to drilling mud leads to better mud cake quality and the filtrate volume (Osei et al., 2021). It is worthy to notice that mud cake thickness and filtrate volume from a drilling fluid with 4 wt% barite exhibits the lowest values (Fig. 6).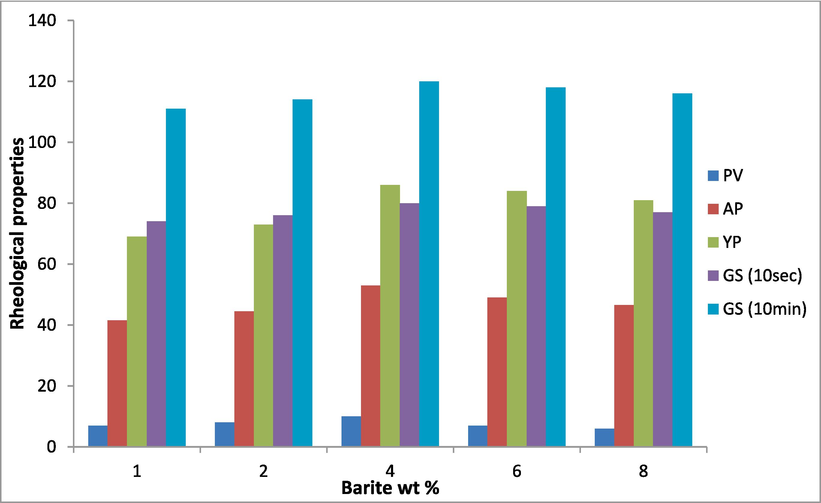
Effect of barite wt.% on the drilling mud rheological properties.
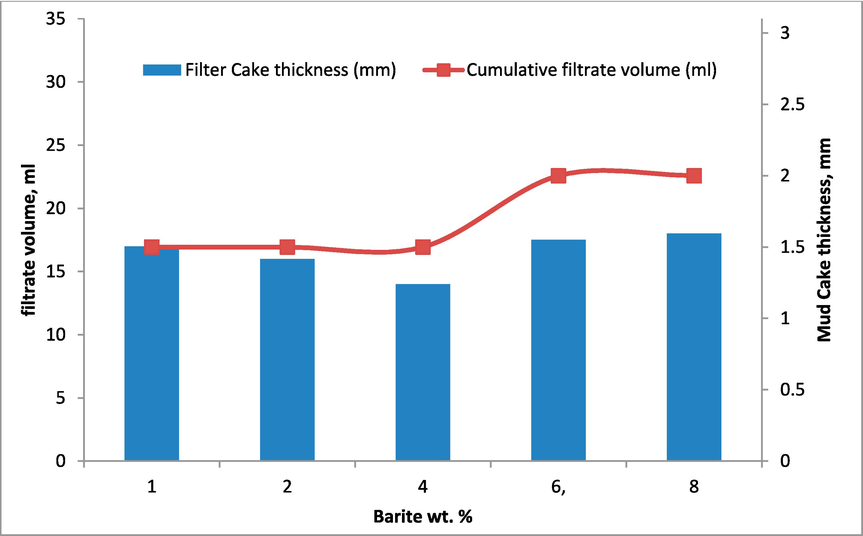
Variation of Mud cake thickness and filtrate volume.
3.2 ANOVA results
The effect of two independent variables (temperature and MNPs concentration) on the plastic viscosity, apparent viscosity, yield point, 10 sec and 10 min gel strength were investigated. Ten different experiments were developed using RSM including five temperature ranges (21.7, 30, 50, 70, and 78.3) OC and five MNPs (0.075, 0.2, 0.5, 0.8 and 0.92) wt.%.
3.2.1 ANOVA results for plastic viscosity
The evaluation of the absolute magnitude, significance and interactions of the standard effects of the temperature and nano content on the plastic viscosity is constructed in the Pareto chart. The polynomial equations, standardized effects, 3-D estimated response surface, 2-D counter, normal probability and interaction plots are the output of analysis by the software. Fig. 7a showed that the two operating variables are significant reflecting by drawing the reference line on the graph, however, the nano content concentration appeared more effective. The positive sign of the effects of the nano content showed that as the concentration of the nanoparticle in the drilling mud increases, plastic viscosity will increase. Whereas, the negative sign reflects that the plastic viscosity decreases with increase in temperature degree.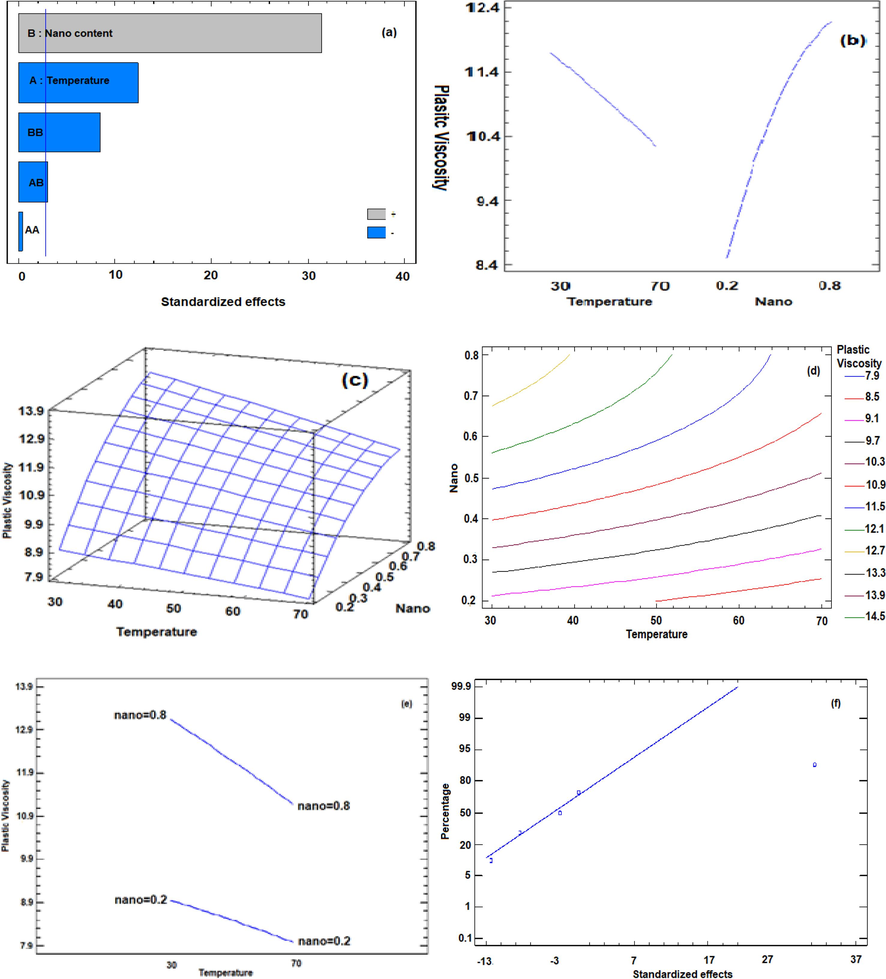
Pareto chart (a) standardized effects plot, (b) main effects on the plastic viscosity (c) 3-D estimated response surface,(d) 2-D counter plots, (e) Interaction plots, (f) Normal probability plot for the plastic viscosity.
The three-dimensional response surface and the effect of the temperature and nano content on plastic viscosity are depicted in Fig. 7b and c. There is no interaction between the factors and the response as confirmed by non-oval-shaped contour estimated response surface lines in Fig. 7d. The former situation is justified by parallel lines of the interaction plots of Fig. 7e. Fig. 7f shows the normal probability plot, which shows that all of the plotted points for the plastic viscosity are very close to the fitted distribution line. This means a good agreement of the experimental data with the predicted model results, so the generated response model, and can be used to estimate the plastic viscosity.
The following mathematical model was derived from the results of Analysis of Variance (ANOVA):
Where N is the nanoparticle content and T is the temperature. The polynomial estimated with a P-values < 0.05 that imply the model and parameter are significant model with high accuracy. The model’s fitness and adequacy are reflected by the computed high coefficients of determination (R2) = 99.6768 % and adjusted coefficients = 99.2727 % estimated with an optimum PV value of 13.77 cP at 21.72 °C and 0.92 wt% MNPs.
3.2.2 ANOVA results for the apparent viscosity
The ANOVA results for apparent viscosity of the drilling mud are illustrated in Fig. 8. The impact of temperature and the MNPs content on apparent viscosity was explored. The Pareto chart (Fig. 8a) revealed that nano content has the maximum significant influence compared to the temperature. The apparent viscosity increases as the amount of nanoparticle increases in the drilling mud formulation, nevertheless the apparent viscosity decreases as the temperature rises as demonstrated in Fig. 8b. The impact of the operating variables is understandable in the 3D-estimated response surface plot (Fig. 8c). The non-interaction influence of the nano content and the temperature degree with the response is clarified in the shaped contour response surface lines in Fig. 8d and the curved lines of the interaction plots in Fig. 8e. The normal probability plot revealed that most of the plotted points for the apparent viscosity are fitting to the distribution line which indicated the high tendency of the experimental results in Fig. 8f.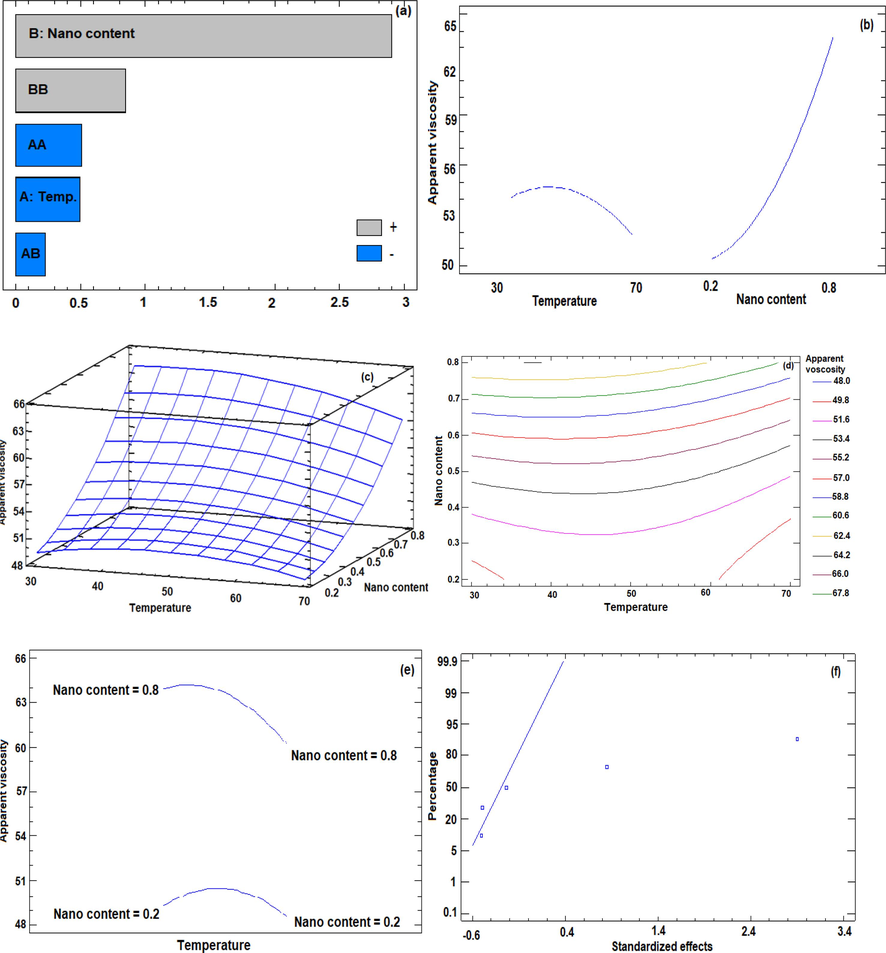
Pareto chart (a) standardized effects plot, (b) main effects on the apparent viscosity (c) 3-D estimated response surface, (d) 2-D counter plots, (e) Interaction plots, (f) Normal probability plot for the apparent viscosity.
The generated mathematical model is defined in the following polynomial equation:
Where N is the nanoparticle content and T is the temperature. The model’s fitness and adequacy is confirmed by a P values < 0.05 and high R2 = 72.1508 % estimated with an optimum AV value of 69.69 cP at 35.62 °C and 0.92 wt% MNPs.
3.2.3 ANOVA results for the yield point
Similar to the other rheological properties the pareto chart was used to evaluate the magnitude, importance, 3D estimated surface responses and interactions of the standard effects of the temperature and nano content on the yield point. In Fig. 9a, the reference line on the graph explains the significance of the two operating variables. The positive sign of the nano content effect confirms that YP improves with the MNPs addition into the drilling mud composition. In contrast, the temperature has negative effect on the yield point, Fig. 9b justified the effects. Fig. 9c and 9d presents the effect of the two variables on the 3D response surface and 2-D counter plots, respectively. The parallel lines of the interaction plots shown in Fig. 9e, declared that there is no interaction between the factors and the response. The experimental data have been studied to estimate the normality of actual values versus expected value for yield point. Fig. 9f shows the normal probability plot which proves that all the plotted points for the MNPs yield are very close to the fitted distribution line. This indicates that the experimental data were in good correlation with the expected model outcomes, consequently the generated response model is relevant and suitable for approximating the yield point.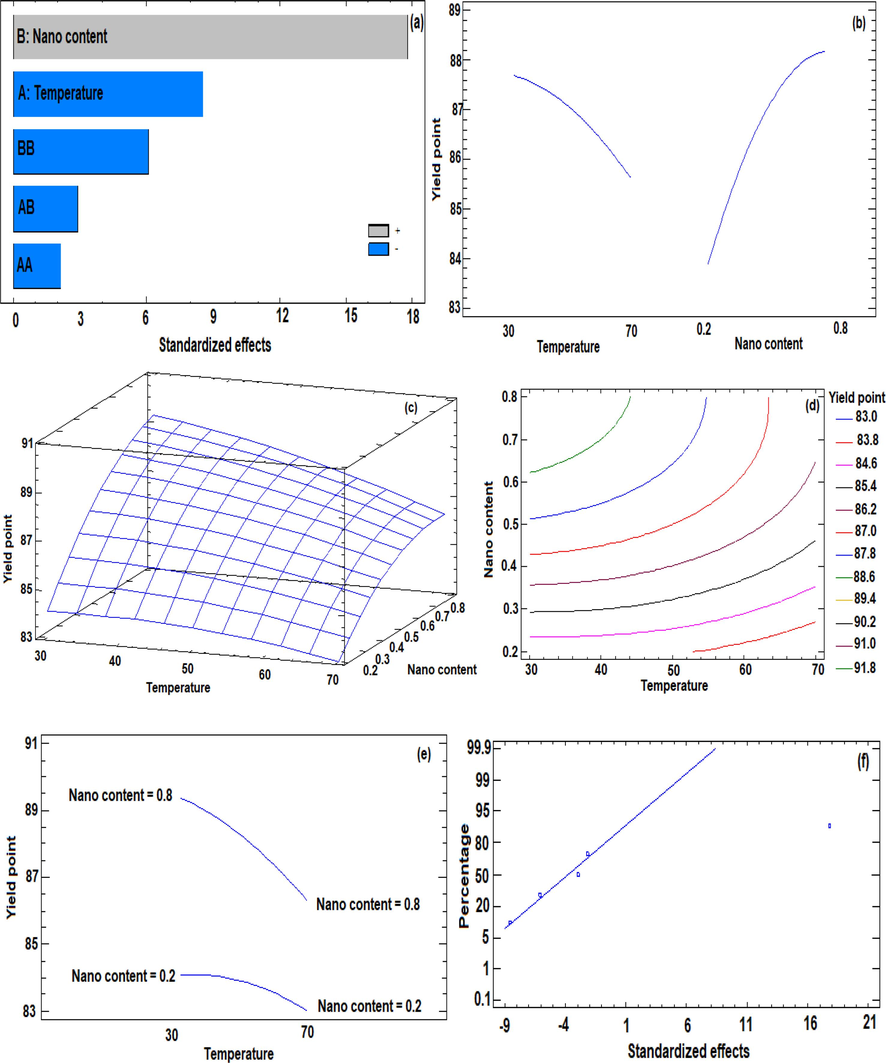
Pareto chart (a) standardized effects plot, (b) main effects on the yield point (c)3-D estimated response surface, (d) 2-D counter plots, (e) Interaction plots, (f) Normal probability plot for the yield point.
The generated mathematical model is defined in the following polynomial equation:
Where N is the nanoparticle content and T is the temperature. The model’s fitness and adequacy is confirmed by a P values < 0.05 (P = 0.0337) and high R2 = 99.0896 % and 97.9517 % for determined and adjusted coefficients respectively estimated for optimum YP value of 89.87 lb/100ft2 at 24.72 °C and 0.92 wt% MNPs.
3.2.4 ANOVA results for the gel strength
The ANOVA results for 10 sec and 10 min gel strength are shown in Figs. 10 and 11, respectively. The Pareto chart (Fig. 10a and 11a) displays that the nano concentration has a positive significant effect on gel strength, while the temperature negatively influences it. The situation is supported by studying the effect of two variables plots in Fig. 10b and 11b. In addition, Fig. 10e and 11e shows that there is no interaction between the two factors. The mathematical models from ANOVA for the effect of two variables on the 10 sec and 10 min gel strength were estimated with high regression coefficients of 98.4655 and 99.4102 with an optimum value of 86.75 lb/100ft2 at 21.72 °C and 0.83 wt% MNPs, and 128.38 lb/100ft2 at 21.72 °C and 0.85 wt% MNPs for10 sec and 10 min gel strength respectively. The high values of the adjusted regression coefficients R2 = 96.55 % and 98.67 % confirmed the accuracy of the models and their high capability to explain the experimental results. The estimated polynomial regression model equations (second order) for 10 sec and 10 min gel strength are represented in Eqs. (9) and (10), respectively.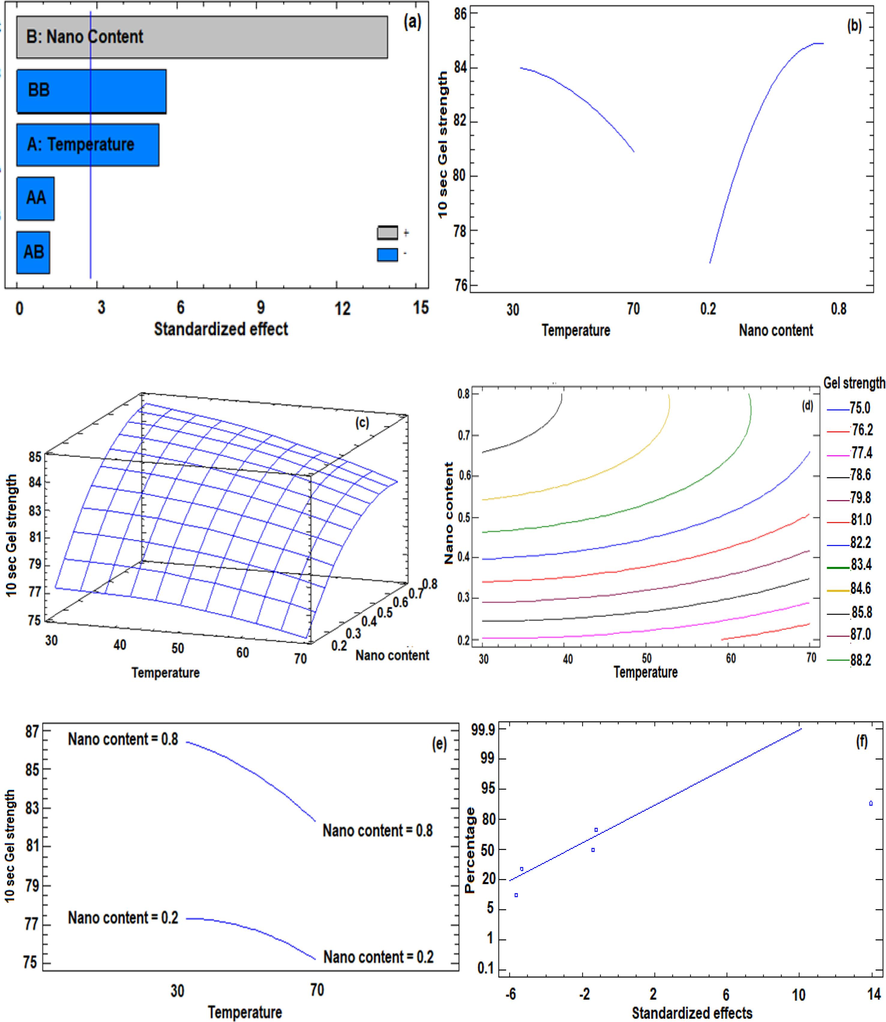
Pareto chart (a) standardized effects plot, (b) main effects on the 10 sec gel strength (c)3-D estimated response surface,(d) 2-D counter plots, (e) Interaction plots, (f) Normal probability plot for the 10 sec gel strength.
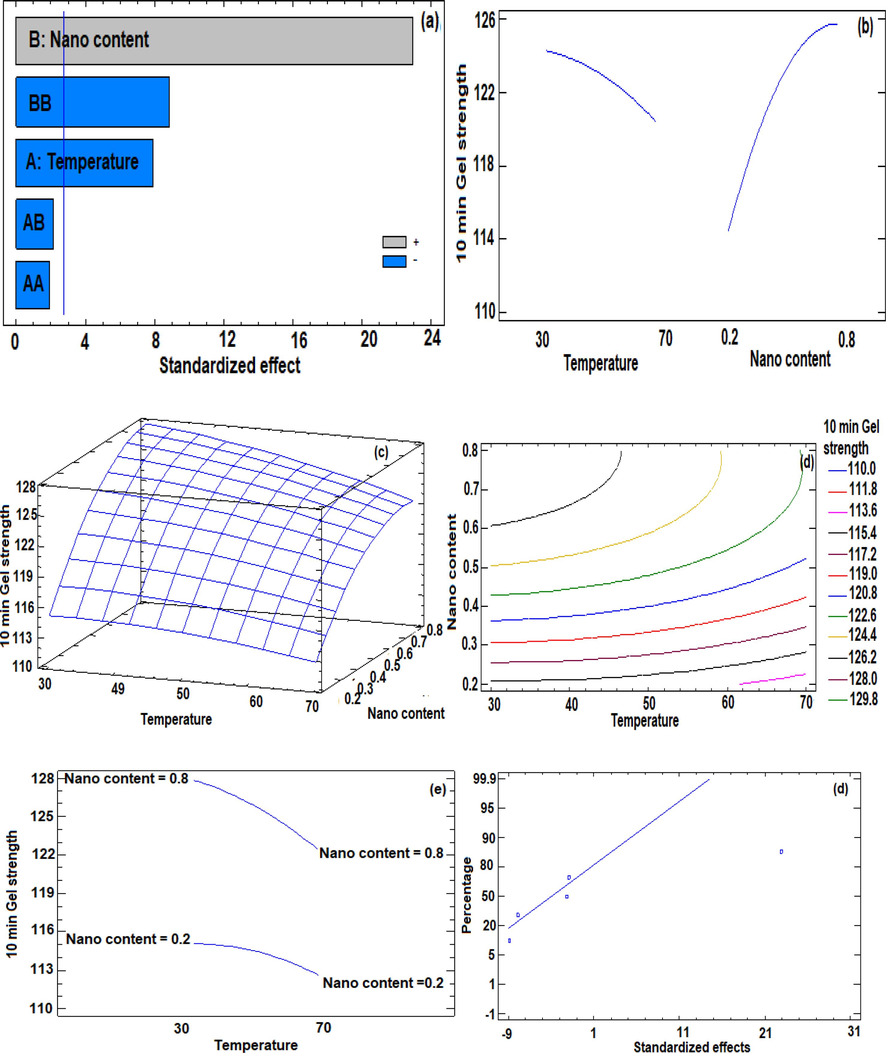
Pareto chart (a) standardized effects plot, (b) main effects on the 10 min gel strength (c)3-D estimated response surface, (d) 2-D counter plots, (e) Interaction plots, (f) Normal probability plot for the 10 min gel strength.
Where N is the nanoparticle content and T is the temperature.
Fig. 12 shows the effect of MNPs content on rheological properties of the drilling fluids at constant temperature (50 °C). It is well remarkable that increasing the MNPs content cause an increase in PV. Besides, AV was also increased; this could lead to better cutting lifting ability by the drilling mud [19]. Regarding the YP, the increase in YP results from an increase in electrochemical forces between the drilling fluid formulations due to the addition of MNPs [20]. The increase in the gel strength value by the increase of the MNPs concentration affects the cutting suspension when the drilling operation stops. However, lower gel strength is needed to reduce the pump power required to recirculate flow after stopping the operation [21]. Fig. 13 shows the effect of increasing the temperature at constant content of the MNPs (0.5 wt%). It can be inferred that when the temperature increases the rheological properties decreases. The situation is in line with that reported in literature for water-based drilling fluids incorporated with zinc oxide NPs (Alvi et al., 2020; Faisal et al., 2023a).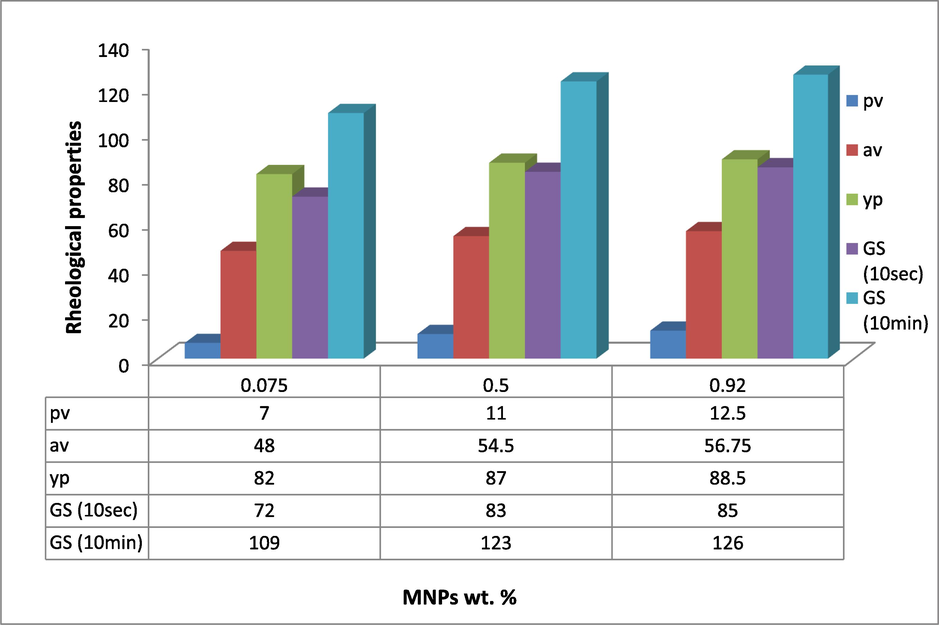
Rheological responses for the drilling fluid containing different MNPs concentration at 50 °C.
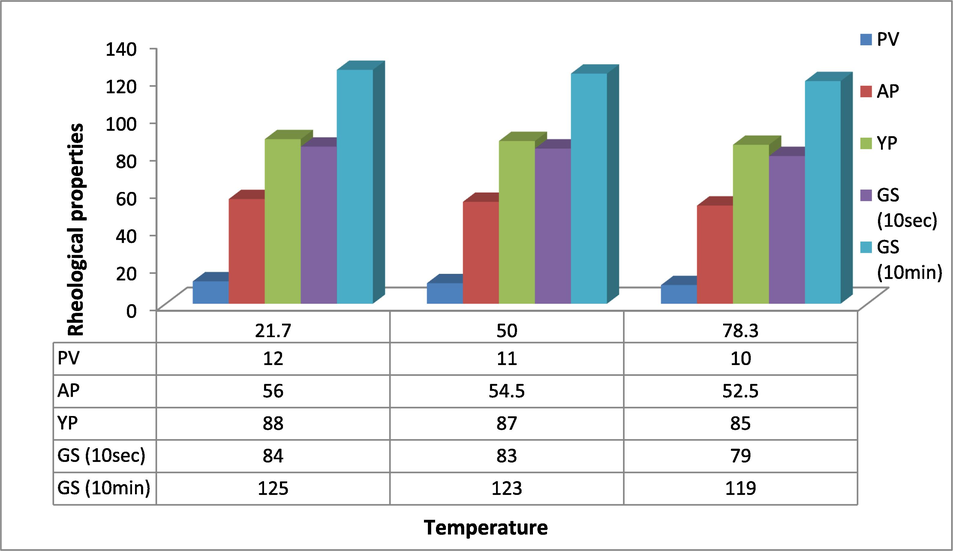
Rheological properties for function of temperature at constant MNPs content (0.5 wt%).
On another hand, regarding the filtration loss properties, Fig. 14 illustrates that mud cake thickness and the filtrate volume decrease as the mass fraction of the nano particles increases at constant temperature, the situation demonstrated that by using small amounts of MNPs, better and easier solid control and less formation damage can be guaranteed. The reduction in filtration volume obtained after blending MNPs in the drilling mud confirmed the capability of the drilling mud to form a thin, low-permeability mud cake layer to block the liquid from flowing by formation a barrier to avoid the infiltration of drilling fluid into the formation due to its high specific surface area with an enormous area of interaction.(Kalhori et al., 2023). The results confirm the stronger ability of MNPs to create bonds between the particles to hold more fluid. It is worthy to note that mud formulation must have as low as possible fluid loss to mitigate the problems of wellbore instability (Retnanto et al., 2023). However, increasing the temperature resulted in increasing the mud cake thickness and the filtrate volume at a constant mass fraction of the nano particles as shown in Fig. 15.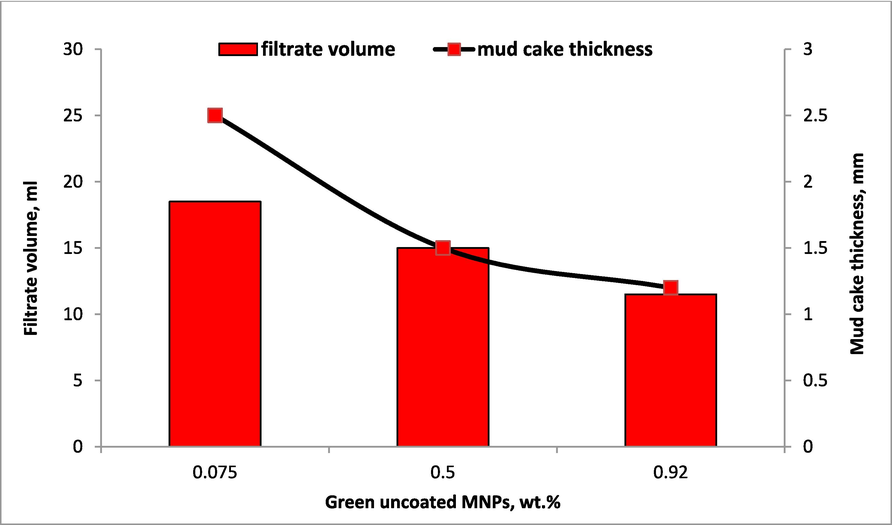
Filtration property of the drilling mud samples having different mnps content at constant temperature (50 °C).
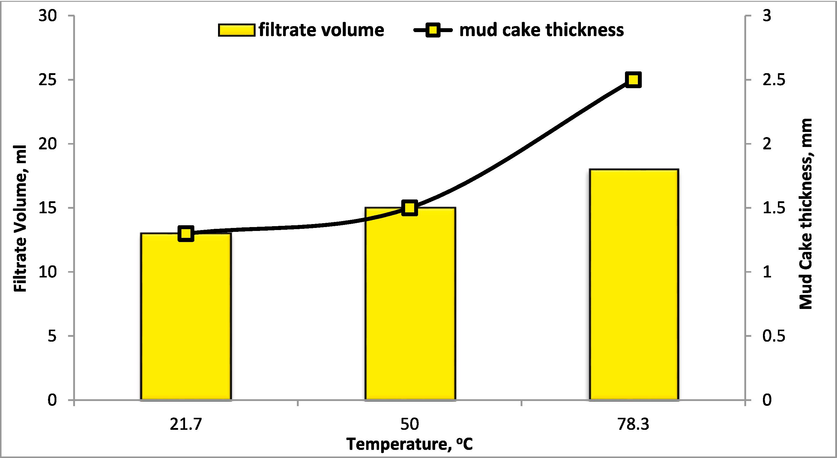
Filtration property of the drilling mud samples having different temperature at constant mnps (0.5 wt%).
For full optimization of the drilling fluid ingredients and to guarantee better drilling fluid performance, the rheological and filtration characteristics were optimized in term of bentonite content. The optimum drilling fluid formulation was incorporated with different bentonite concentration (10, 15, 20, and 25.7) wt.%. The rheological properties along with various bentonite content are illustrates in Fig. 16. It is noted that increasing the concentrations of bentonite resulted in increasing the drilling mud rheological properties. However, it was reported that excessive increasing of the yield point and gel strength by adding bentonite may lead to the drilling mud aggregation and flocculation which causes particles to join together (Al-Malki et al., 2016).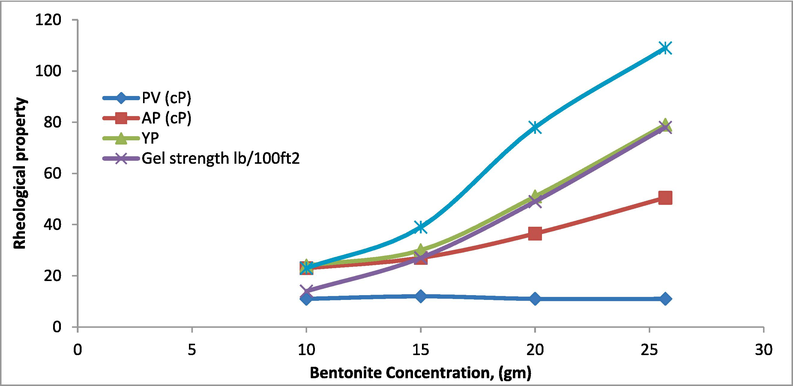
Rheological properties of drilling fluids with various bentonite concentrations.
The effect of bentonite concentration on the filtration properties are depicted in Fig. 17. It seemed that as the content of the bentonite increases the filtration volume decreases. Similar trends were observed by Yu Zhang team (Zhang et al., 2022). It can be seen from Fig. 17 that the thickness of the mud cake decreases by 20 % with the increase of the bentonite slurry concentration from 5 to 10 wt%. Beyond 15 wt% bentonite, there was no change in the mud cake thickness. A conclusion may be withdrawn that the concentration 15 wt% bentonite could be considered to control the filtration properties. Regarding the effect of bentonite concentration on the drilling mud density, it is clear from Fig. 18 that the increase of bentonite concentration has minimal effect on the drilling mud density this is due to the bentonite functionality. Bentonite is effective for improving the drilling mud viscosity unlike barite which is used to control the mud density (Osei et al., 2021).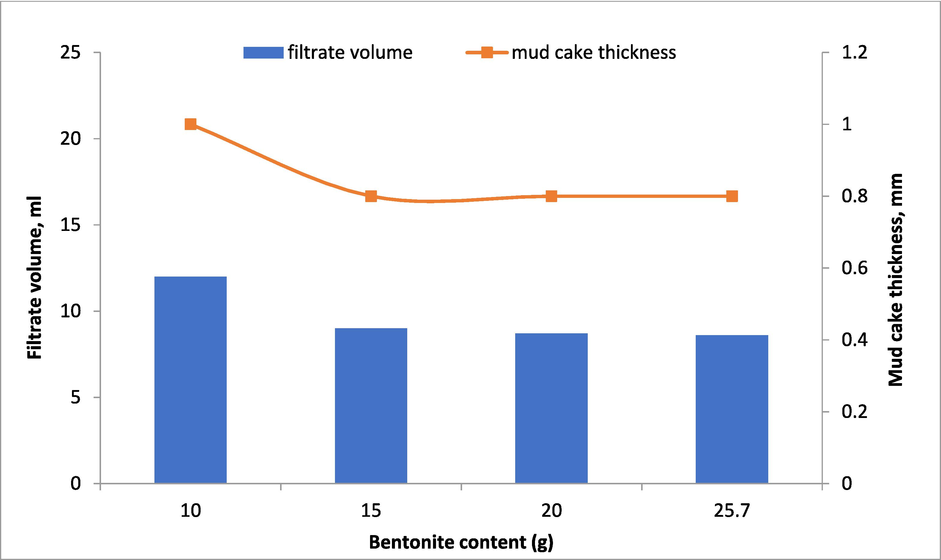
Filtrate volume and mud cake thickness at constant temperature and different bentonite content.
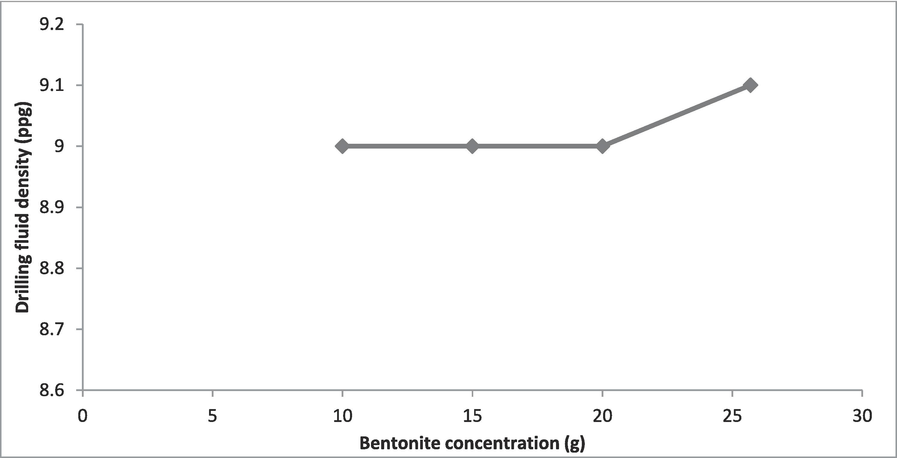
Drilling fluids density at various bentonite content.
3.3 Barite sag
Sag test was conducted based on standard protocol (Mohamed et al., 2020). It was documented that the acceptable sag factor should be within the range of 0.50–––0.53 (AlAbdullatif et al., 2014). Fig. 19 showed that the sag factor range for drilling fluids contain barite (4, 5,6 and 8) wt. % were 0.511 and 0.518 and 0.522, respectively. These values are within the acceptable range. The sag factor results declared that all the drilling muds including our drilling mud of optimum rheology and filtration loss performance that contain 4 % wt. % barite have good fluid stability.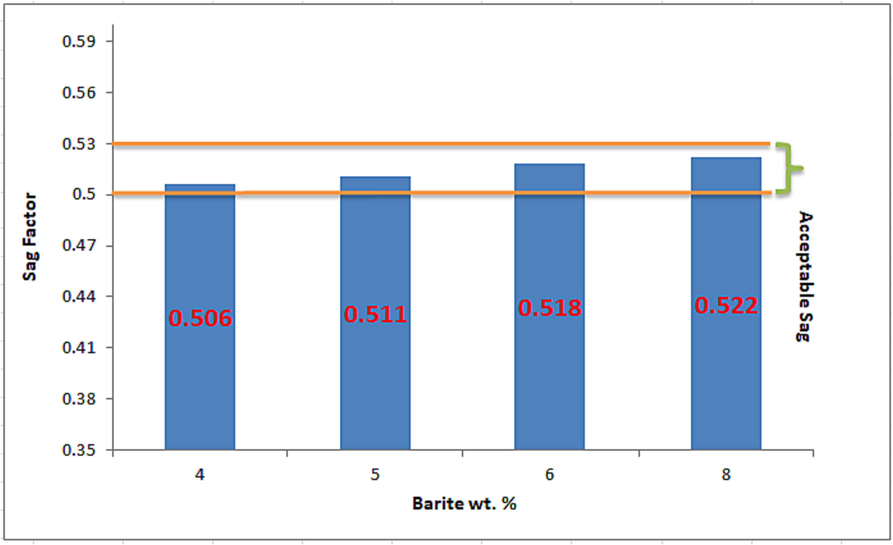
Effect of barite concentration on the sag factor.
Based on the aforementioned results, the formulation of the drilling fluid for optimum rheology and filtration performance is: 4 wt% barite, 15 wt% bentonite, 0.92 wt% green magnetite NPs.
3.4 The optimum drilling fluid formulation: The effect of temperature on rheological and filtration properties using uncoated and polymer coated MNPs
The effect of different temperature (ambient, 30, 50, and 80) oC on rheological, density and filtration loss properties of a base drilling mud with the optimized ingredient contents including uncoated green MNPs, and mud with the optimized ingredient contents including polymer coated green MNPs were investigated. It was observed that the values of all the properties investigated decreased with increasing the temperature from ambient to 80 °C (Table 2).
Mud Type
% Decrease
PV
AV
YP
Gel strength (10sec)
Gel strength (10 min)
filtrate volume
(ml)
Cake thickness
(mm)
Mud density
g/cm3
Reference
25
18.4
13.6
41.7
22.2
24
50
1.12
MNPs
25
16.6
10
30
16.1
22
14.2
1.11
Polymer- coated MNPs
15.4
12.2
9.6
25.6
15.6
18.8
0
1.11
PV represents the frictional forces resulted from solid to solid, solid to liquid and liquid to liquid itself. The change in PV of the drilling fluids is illustrated in Fig. 20. The results confirmed that PV of the drilling fluid increased with the incorporation of MNPs and polymer coated magnetic nanoparticle in the base mud. Here, nano particles work as chain joiner points and let the chains have higher molecular weight and boosts viscosity increasing. Increasing the temperature resulted in decreasing PV value due to the thermal scission of the attractive forces among the drilling fluid particles. However, the results proved that there is less change in the value of the rheological characteristics after addition of the polymer coated MNPs compared to the mud formulated with the uncoated MNPs and the base mud The phenomena indicate the enhancing of the thermal stability of the drilling mud incorporated with the polymer coated MNPs when the drilling fluid employed at high temperature.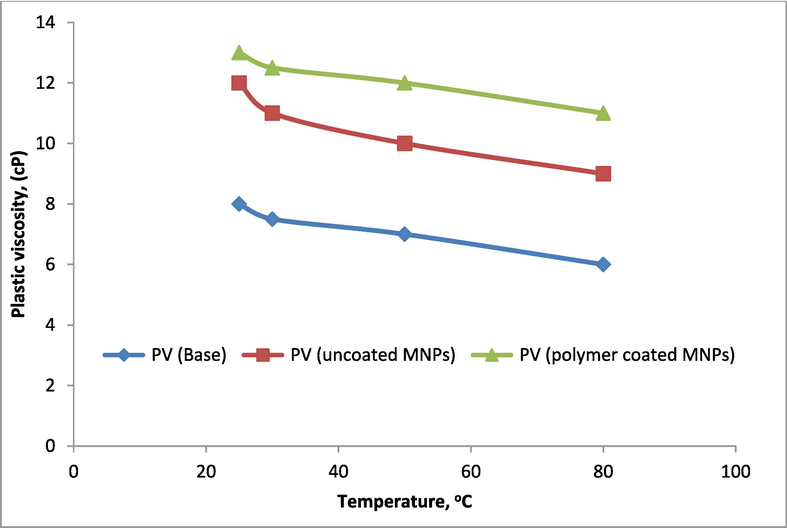
Effect of temperature on PV for the three mud types.
Besides, the same trend was found for AV and YP (Figs. 21 and 22). However, It is obvious to note that at higher temperatures nanoparticles may aggregate, while the polymer coated MNPs stabilizes and hinders the nanoparticle agglomeration and settlement (Alvi et al., 2020). Therefore, drilling fluids incorporated with polymer coated MNPs can withstand high temperature environment as compared to the base drilling fluid and the fluid incorporated with uncoated MNPs.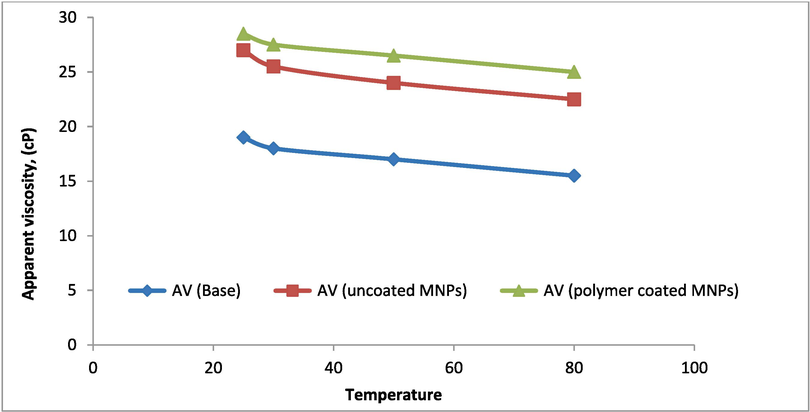
Effect of temperature on AV for the three mud types.
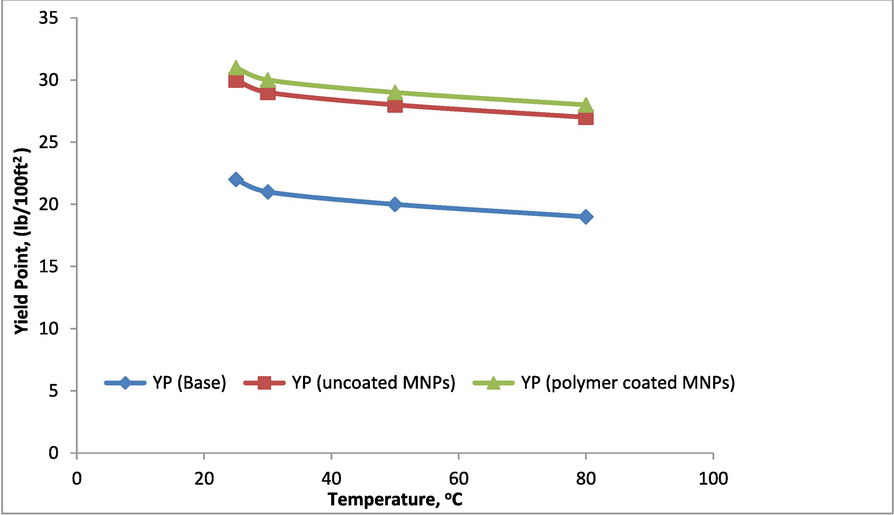
Effect of temperature on YP for the three mud types.
Like other rheological properties gel strength is also affected by incorporation MNPs in drilling muds. Most of the studies proved that the incorporation of NPs lead to increase the gel strength [34, 35]. However, by increasing the temperature, the drilling muds incorporated with the green MNPs showed more resistance for gel strength decrement compared to the base fluid as seen in Fig. 23.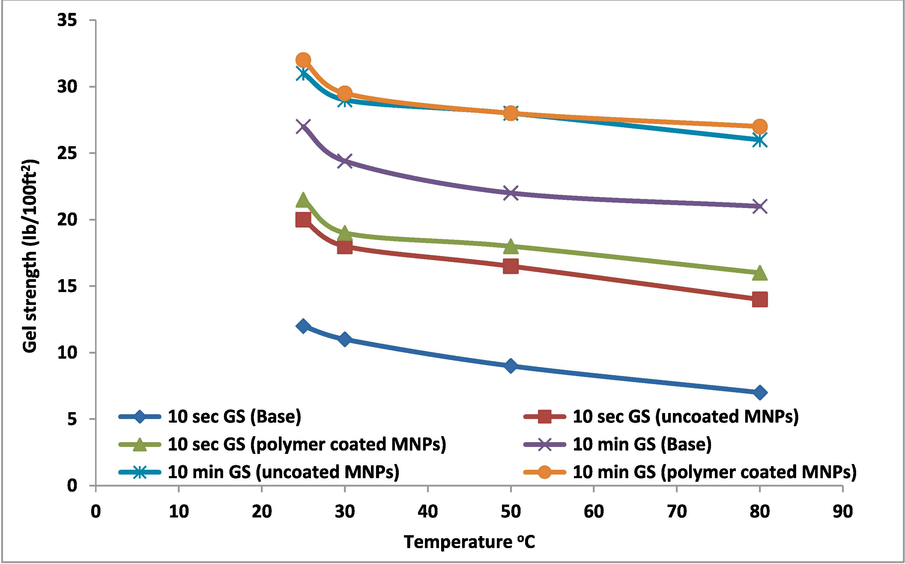
Effect of temperature on 10 sec and 10 min gel strength for the three mud types.
It can be deducted from the above explanation that the rheological parameters of the drilling mud decreased to a certain degree at high temperature environment. however, it can be understood from Figs. 20–23 that the drilling mud samples containing MNPs and polymer coated MNPs after rolling at high temperature withstand the thermal effect and did not show a sharp decrease in the rheological properties.
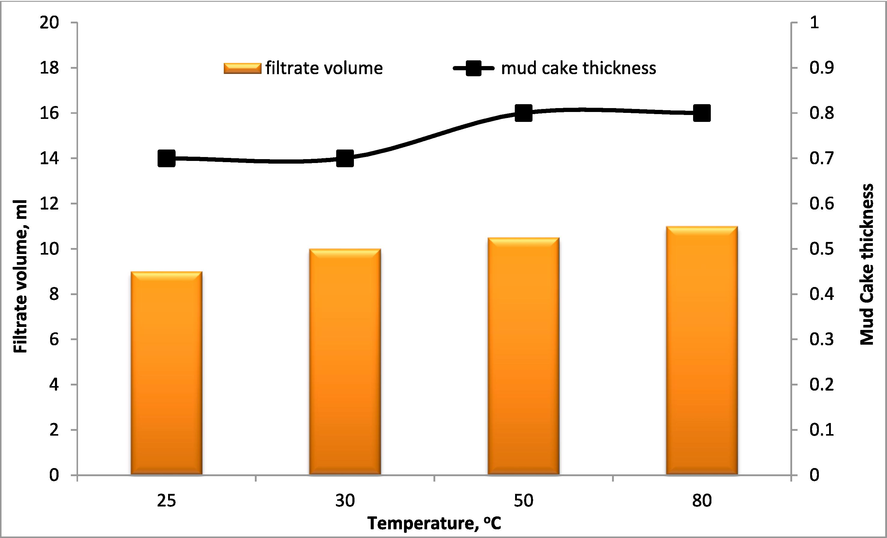
On the other hand, the filtration loss represents the ability of drilling fluid to plug permeable or producing formations by forming low filtrate volume and a thinner mud cake (36). A remarkable resistance in alteration of the mud cake thickness and filtrate volume for the drilling fluids incorporated with polymer MNPs exposed to 80 °C was observed compared to the base fluid as shown in Figs. 24-26. The findings indicated that the drilling fluids incorporated with polymer coated MNPs have the higher filtration loss control ability at high temperature environments.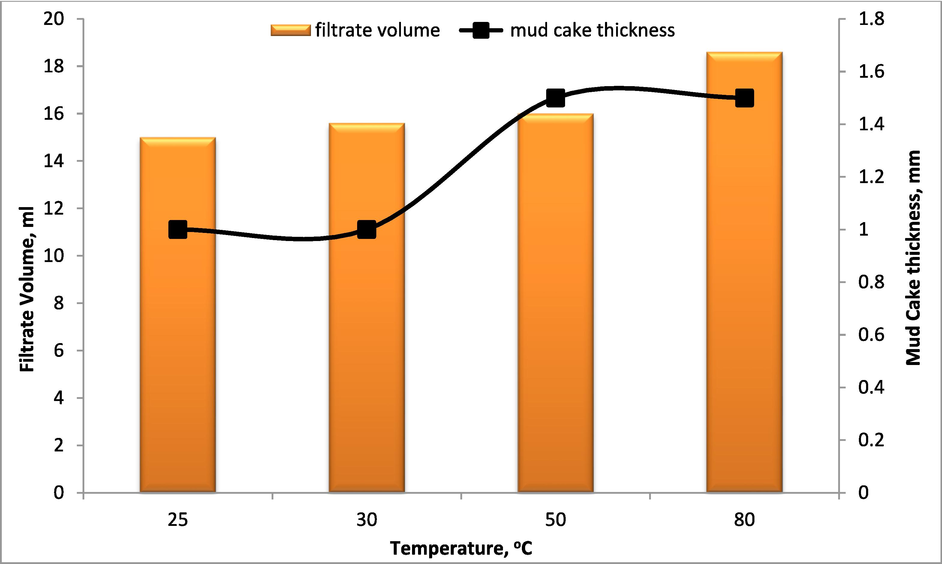
Filtrate volume and mud cake thickness of the base mud at different temperature.
Filtrate volume and mud cake thickness of the mud incorporated with uncoated MNPs at different temperature.
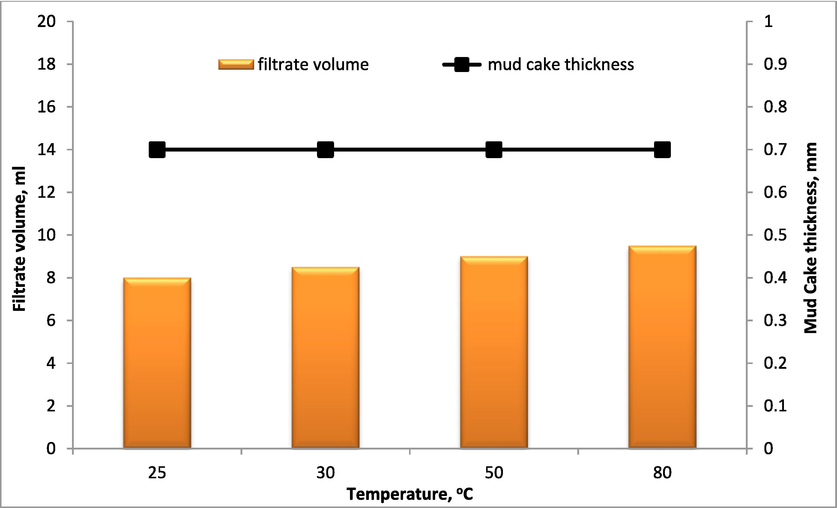
Filtrate volume and mud cake thickness of drilling fluid incorporated with polymer- coated MNPs at different temperatures.
Although the three types of the investigated drilling muds showed inverse relation of density with temperature as shown in Fig. 27. Nevertheless, drilling fluids incorporated with MNPs seemed to poses slightly higher density compared to the base fluid, but showed less remarkable change in density with increasing the temperature in particular for drilling fluid incorporated with polymer coated MNPs, which reflected less value of thermal expansion coefficient, similar trend was documented in literature (Ahmed and Makwashi, 2021).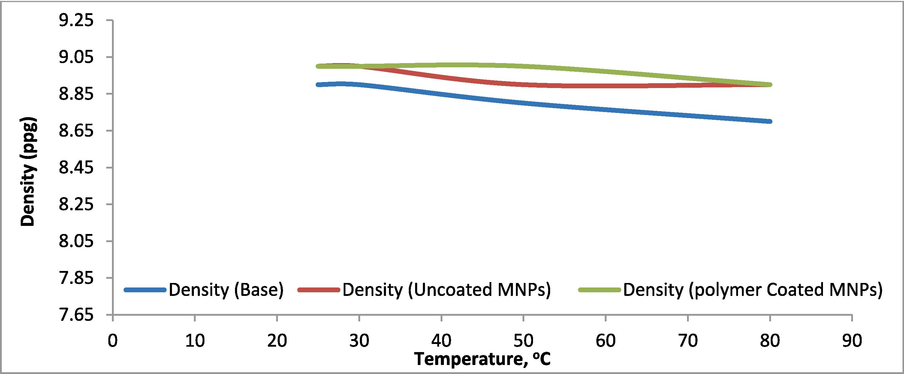
Density of the three mud sample having different temperature degree.
3.5 Aging time effect on the drilling mud rheology, filtration loss and density
The aging of drilling muds is the process whereby a drilling mud formulated can more fully develop its rheological and filtration properties. Thus, in drilling operation it is important to understand how the mud properties will vary as it age. This section aims to assess the influence of time ageing on rheological and filtration properties. Thus, static aging experiments were conducted for the prepared samples by storing them in a sealed container and allowed to age at room temperature for 0, 16, 24 and 48 h, then the density, rheological and filtration testes of the samples were determined. It is evident from the findings in (Figs. 28, 29 and 30) that the rheological properties of the three mud types are steadily increasing as the aging time increases. Regarding the mud viscosity the explanation for the increase may be related to the composition of the formulated mud and to the fact that the degree of dispersion and flocculation increased when the mud was aged statically. Regarding the increase in yield point and gel strength it could be explained that as ageing increases, the internal structure of the mud becomes stronger and will require more pressure to initiate flow (Ahmed and Makwashi, 2021). However, the aging effect is diminishing as the aging time increases especially for the polymer coated MNPs drilling mud type. This result is in good agreement with that found in literature (Wang et al., 2012).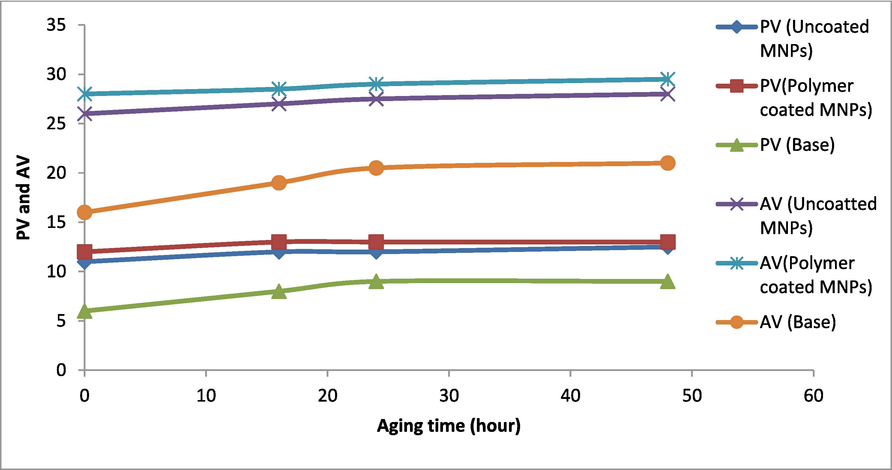
Plastic viscosity and apparent viscosity of the three mud samples at different aging time.
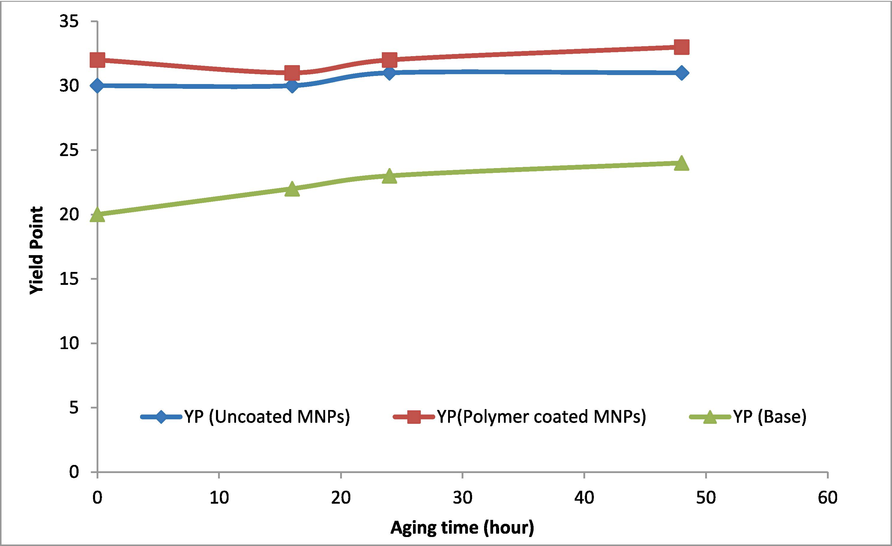
Yield point of the three mud samples at different aging time.
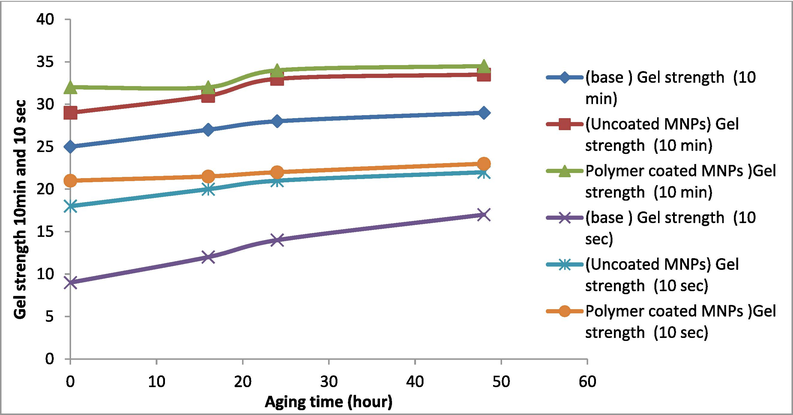
Gel strength of the three mud samples at different aging time.
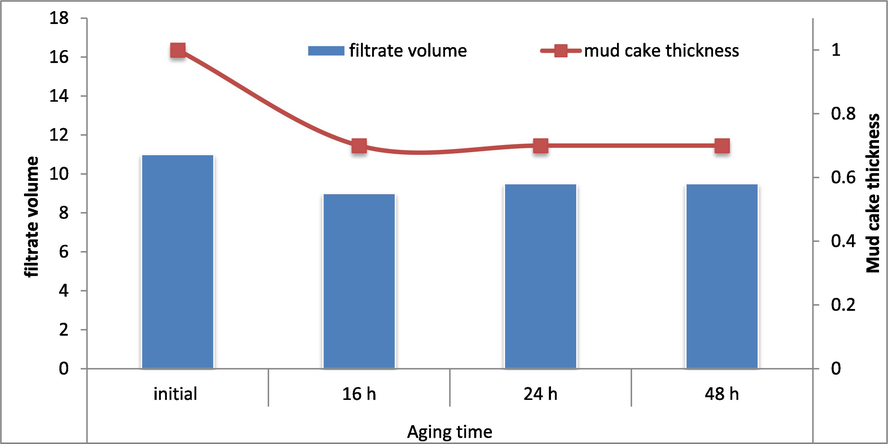
As explained earlier, a good mud must keep the loss of fluid to the formation as less as possible while preventing excessively thick filter cake. Thus, thinner and less permeable are desired characteristics of a good filter cake. It was observed that the effect of time aging on the mud cake thickness and filtration volume was minimal for drilling mud occupied nano and polymer- coated MNPs (Figs. 32 and 33). However, for the base mud a notable decrease in mud cake thickness and filtrate volume was observed (Fig. 31).The independent of the filtration loss properties on aging time for the drilling mud incorporated polymer-coated MNPs is a promising factor from economical point of view.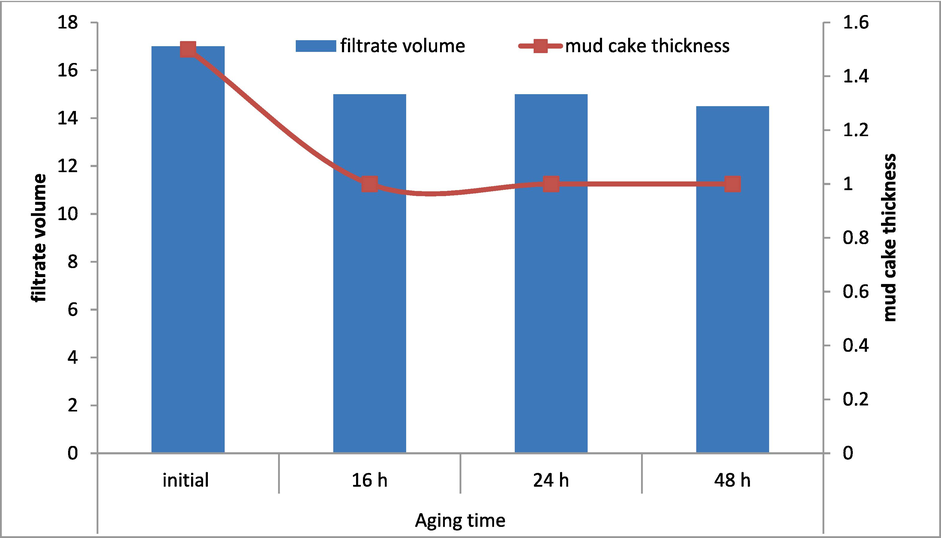
Filtrate volume and mud cake thickness of the base mud at different aging time.
Filtrate volume and mud cake thickness of the MNPs mud at different aging time.
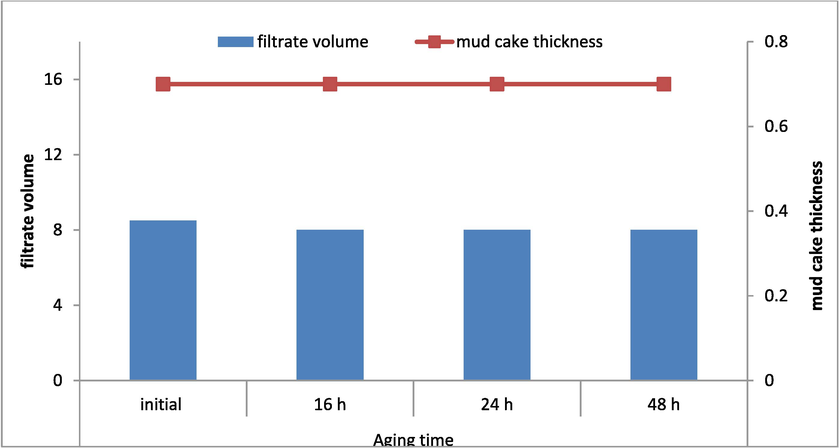
Filtrate volume and mud cake thickness of the polymer coated MNPs mud at different aging time.
Fig. 34 showed the effect of aging time on density. It can be deducted from the results that aging time has a minimal effect on the density of all the three mud types (base, uncoated MNPs and polymer coated MNPs). From Fig. 34 it is evidence that the effect of aging time on the three mud samples was only in early aging stages, this could be due to the fact that the degree of dispersion and flocculation increased when the mud was aged statically. The effect diminished with the increase in aging time.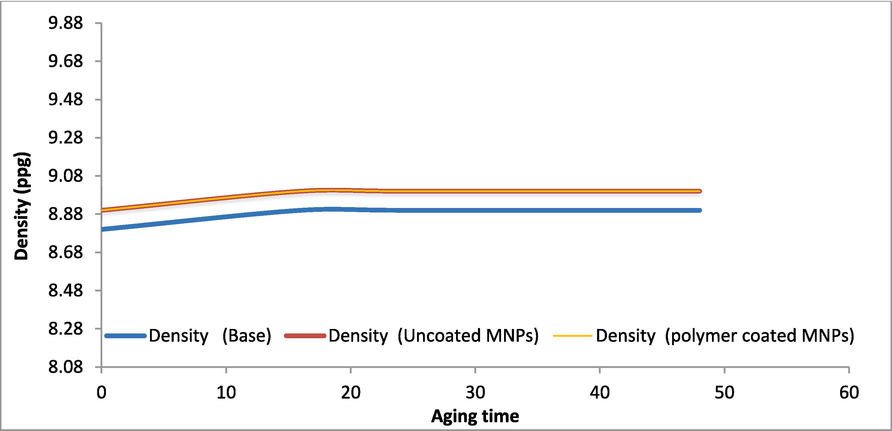
The effect of the aging time on the density of the drilling muds.
4 Conclusions
Rheology and filtration loss characteristics of drilling fluids are critical aspects to study while ensuring the efficacy of a drilling operation. On another hand, the incorporation of green MNPs in drilling fluids is one of the developed processes that have potential contribution to improve the performance of drilling fluids. In connection, modification the surface properties of the MNPs by simple and cost-effective processes like coating with polymers, form another prominence factor to enhance the performance of drilling fluids occupied MNPs. The integration in rheological and filtration loss properties of the drilling fluids with MNPs, in particular the polymer-coated MNPs serves in minimizing the formation damage via decreasing the filtration volume and mud cake thickness by 49 % and 53 % respectively compared to the base drilling mud at 80 °C. The green MNPs are cheap additives could be easily manufactured using biosynthesis approaches, also the produced drilling fluids that used the green MNPs as additive could be employed directly after formulation without aging, and its rheological and filtration loss characteristics resist the alteration during applications at relatively high temperatures. Besides, optimization of the effect of incorporation of MNPs on rheological and filtration loss performance is of great significance to identify the optimum drilling formulation for high performance drilling operations. The optimum drilling fluid formulation is considered as one of drilling fluid success factors in the planning and construction of an extended reach well. Response Surface Methodology is one of the efficient tools that could be used in optimization and modeling drilling fluid formulation and properties.
Declaration of Competing Interest
The authors declare that they have no known competing financial interests or personal relationships that could have appeared to influence the work reported in this paper.
References
- Nanoparticle-Based Cutting Fluids in Drilling: A Recent Review. The International Journal of Advanced Manufacturing Technology. 2023;1–18
- [CrossRef] [Google Scholar]
- Optimizing the Rheological Properties of Silica Nano-Modified Bentonite Mud Using Overlaid Contour Plot and Estimation of Maximum or Upper Shear Stress Limit. Cogent Engineering. 2017;4:1287248.
- [CrossRef] [Google Scholar]
- An Experimental Investigation of Temperature and Ageing Effects on Bentonite and Sepiolite Drilling Fluids.. 2021;6:61-75.
- [CrossRef]
- AlAbdullatif, Z., Al-Yami, A., Wagle, V., Bubshait, A. & Al-Safran, A. Development of New Kill Fluids with Minimum Sagging Problems for High Pressure Jilh Formation in Saudi Arabia. Abu Dhabi International Petroleum Exhibition and Conference, 2014. OnePetro. Doi: 10.2118/171683.
- Experimental Investigation of the Rheological Properties of Water Base Mud with Silica Nanoparticles for Deep Well Application. Ain Shams Engineering Journal 2023:102147.
- [CrossRef] [Google Scholar]
- Controlling Bentonite-Based Drilling Mud Properties Using Sepiolite Nanoparticles. Petroleum Exploration and Development. 2016;43:717-723.
- [CrossRef] [Google Scholar]
- Alqahtani, H. S., Arfaj, M. K., Alhassni, M. F. & Alotaibi, M. A. Environmentally Friendly Nanoshale Inhibitor Water-Based Drilling Fluids. Middle East Oil, Gas and Geosciences Show, 2023. OnePetro. Doi: 10.2118/213755-MS.
- Effect of Iron Oxide Nanoparticles on the Properties of Water-Based Drilling Fluids. Energies. 2020;13:6718.
- [CrossRef] [Google Scholar]
- Evaluating Drilling Fluid Infiltration in Porous Media – Comparing Nmr, Gravimetric, and X-Ray Ct Scan Methods. Journal of Petroleum Science and Engineering. 2021;198:108242
- [CrossRef] [Google Scholar]
- Bardhan, A., Khan, F., Kesarwani, H., Vats, S., Sharma, S. & Kumar, S. Performance Evaluation of Novel Silane Coated Nanoparticles as an Additive for High-Performance Drilling Fluid Applications. International Petroleum Technology Conference, 2023. OnePetro. https://doi.org/10.2523/IPTC-22878-MS.
- Effect of High Temperature Ageing on Tio2 Nanoparticles Enhanced Drilling Fluids: A Rheological and Filtration Study. Upstream Oil and Gas Technology. 2020;5:100019
- [CrossRef] [Google Scholar]
- A Review on Applications of Bio-Products Employed in Drilling Fluids to Minimize Environmental Footprint. Environmental Challenges. 2022;6:100411
- [CrossRef] [Google Scholar]
- X-ray Computed Tomography (CT) to Scan the Structure and Characterize the Mud Cake Incorporated with Various Magnetic NPs Concentration: An Application to Evaluate the Wellbore Stability and Formation Damage. Nanomaterials. 2023;13(12):1843
- [CrossRef] [Google Scholar]
- Faisal, R.S., Kamal, I., Salih, N.M., Préat, A. 2023b. Aqueous drilling fluids systems incorporated with green nanoparticles and industrial spent caustic: Optimum rheology and filtration loss properties. E3S Web of Conf. 405. International Conference on Sustainable Technologies in Civil and Environmental Engineering (ICSTCE 2023). doi:10.1051/e3sconf/202340501013.
- Investigation on Tribological Performance of Ionic Liquid Filled Microcapsules as Additives under Water-Based Drilling Mud Conditions. Tribology International 2023:108439.
- [CrossRef] [Google Scholar]
- Rheological Study of a New Water-Based Drilling Fluid Using Ubakala Clay in the Presence of Natural Polymers. Chemical Engineering Communications. 2021;208:1335-1343.
- [CrossRef] [Google Scholar]
- Effect of Cevo4/Al2o3/Rgo Nanocomposite on Rheological Properties and Thermal Conductivity of Water-Based Drilling Fluid. Geoenergy Science and Engineering. 2023;221:111312
- [CrossRef] [Google Scholar]
- Optimization of Nano-Silica in Enhancing the Properties of Synthetic Based Drilling Fluids for Tight Gas Reservoir Conditions. IOP Conference Series: Materials Science and Engineering. 2019;495:012075
- [CrossRef] [Google Scholar]
- Prevention of Barite Sag in Water-Based Drilling Fluids by a Urea-Based Additive for Drilling Deep Formations. Sustainability. 2020;12:2719.
- [CrossRef] [Google Scholar]
- Polymer Nanocomposites Application in Drilling Fluids: A Review. Geoenergy Science and Engineering. 2023;211416
- [CrossRef] [Google Scholar]
- Osei, H., Thompson Brantson, E. & Larbi Michael, G. 2021. Comparative Analysis of the Ef-Fect of Barite and Hematite on the Rheology of Water-Based Drilling Mud. Trends Petro Eng, 1, 1-7. Doi: 10.53902/TPE.2021.01.000508.
- Effect of Silica Nano Particles on the Rheological and Hthp Filtration Properties of Environment Friendly Additive in Water-Based Drilling Fluid. Journal of Petroleum Exploration and Production Technology. 2021;11:4253-4267.
- [CrossRef] [Google Scholar]
- Application of New Environment Friendly Natural Product in Water Based Drilling Fluid to Improve Its Filtration Properties. International Journal of Environmental Science and Technology. 2023;20:993-1006.
- [CrossRef] [Google Scholar]
- Porosity and Permeability of Tight Carbonate Reservoir Rocks in the North of Iraq. Journal of Petroleum Science and Engineering. 2015;133:147-161.
- [CrossRef] [Google Scholar]
- Evaluation of the Viability of Nanoparticles in Drilling Fluids as Additive for Fluid Loss and Wellbore Stability. Petroleum 2023
- [CrossRef] [Google Scholar]
- The Effect of the Tio2/Polyacrylamide Nanocomposite on Water-Based Drilling Fluid Properties. Powder Technology. 2015;272:113-119.
- [CrossRef] [Google Scholar]
- The Porous-Permeable Zones in Heterogeneous Carbonate Reservoirs: A Case Study from Amara Oilfield. Iraq. Proceedings. 2023;87(1):35
- [CrossRef] [Google Scholar]
- Experimental Evaluation of Nanomaterials to Improve Drilling Fluid Properties of Water-Based Muds Hp/Ht Applications. Journal of Petroleum Science and Engineering. 2020;190:107006
- [CrossRef] [Google Scholar]
- A Critical Overview of ASP and Future Perspectives of NASP in EOR of Hydrocarbon Reservoirs: Potential Application, Prospects, Challenges and Governing Mechanisms. Nanomaterials. 2022;12(22):4007
- [CrossRef] [Google Scholar]
- High Temperature and High Pressure Rheological Properties of High-Density Water-Based Drilling Fluids for Deep Wells. Petroleum Science. 2012;9:354-362.
- [CrossRef] [Google Scholar]
- Effect of Eccentricity with Different Shape Wellbores on the Flushing Efficiency of Drilling Fluid Filter Cake. Journal of Petroleum Science and Engineering. 2023;220:111112
- [CrossRef] [Google Scholar]
- Properties of Bentonite Slurry Drilling Fluid in Shallow Formations of Deepwater Wells and the Optimization of Its Wellbore Strengthening Ability While Drilling. ACS Omega. 2022;7:39860-39874.
- [CrossRef] [Google Scholar]
- Nano-Caco3/Aa-Am-Amps Cross-Linked Polymer Core-Shell Structural Nanocomposite as High Temperature and High Salt Resistant Filtration Reducer in Water-Based Drilling Fluid. Geoenergy Science and Engineering 2023:211590.
- [CrossRef] [Google Scholar]


