Translate this page into:
Development in gelatin-matrix composite films: The incorporation of vitamin C adducts enhances the optical behaviors of gelatin films†
⁎Corresponding author at: Department of Chemistry, College of Science, University of Sulaimani, Sulaimani, Kurdistan Region, Iraq. srood.rashid@univsul.edu.iq (Srood Omer Rashid)
-
Received: ,
Accepted: ,
This article was originally published by Elsevier and was migrated to Scientific Scholar after the change of Publisher.
Peer review under responsibility of King Saud University.
Abstract
The chemical cross-linking method continues to be widely recognized as the most efficient and popular strategy for modifying gelatin. However, the exploration of enhancing the optical and electrical characteristics of gelatins through the use of organic molecules is still in its early stages. In this investigation, two stable dopants of ascorbic acid adducts were synthesized via the smooth and facile procedure, and their identities were validated through Fourier transform-infrared (FT-IR) and nuclear magnetic resonance spectroscopy techniques, including FT-1H NMR, and FT-13C NMR. The novel gelatin-matrix composite films were fabricated by blending vitamin C adducts with various gelatins including pork gelatin (PG), fish gelatin (FG), bovine gelatin (BG), and chicken gelatin (CG) using the casting method. The chemical and homogenous interactions between dopants and gelatin matrixes were verified through several spectroscopic techniques. The XRD spectra of the composite films show a significant elevation in their amorphous structures when compared to the pure gelatin host. The FT-IR spectra of both the gelatin matrix and their composites demonstrate strong chemical interactions among the functional groups within the gelatin composite films. The UV–vis spectra provided the primary optical information for the synthesized hybrid film. Remarkably, the index of refraction (n) and dielectric loss (ɛi) magnitudes are raised, while the average optical band gap energy (Eg) decreased from 4.9 (pure gelatin) to 3.4 eV. By applying Tauc's model, we successfully recognized the direct electronic transition occurring between the valence band (VB) and the conduction band (CB). The results of our research highlights that minor changes in the adduct composition significantly impact optical and textural properties in polymer composites, offering a plethora of potential technological opportunities. These applications include materials packaging, blocking of harmful light, and encapsulation purposes.
Keywords
Biodegradable vitamins
Biopolymers
Edible films
Optical properties
Band gap energy

1 Introduction
The inherent appeal of gelatin lies in its captivating chemical composition and structure, sourced from collagen in animal skin, bones, and connective tissues. It comprises 19 amino acids, with glycine, proline, and hydroxyproline making up 57 %.(Alipal et al., 2019; Noor et al., 2021; Rather et al., 2022) The remaining 43 % encompasses diverse amino acids such as glutamic acid, alanine, arginine, and aspartic acid. The chemical composition is influenced by extraction, purification, and modification steps.(Díaz-Calderón et al., 2017) Gelatin A and B, obtained through acidic or alkaline hydrolysis, differ slightly but share applications in biomaterials for wound healing.(Alipal et al., 2019; Tabata & Ikada, 1998), (Huang et al., 2020; Pępczyńska et al., 2019).
Gelatin's chemical structure features a blend of single and double uncoiled chains with hydrophilic properties. It includes α-chains (individual polymer/single chain), β-chains (two α-chains covalently cross-linked), and γ-chains (three covalently bonded α-chains) with molar masses of approximately 90 x 103, 180 x 103, and 300 x 103 g/mol, respectively (Alipal et al., 2019; Noor et al., 2021). Additionally, leveraging gelatin as a benign, odorless, tasteless, transparent, water-soluble, and cost-effective biopolymer offers a strategic approach to enhance diverse physical and biological behaviors for various industrial and scientific applications.(Lu et al., 2022; Noor et al., 2021).
Despite gelatin's remarkable biodegradability and biocompatibility, it faces challenges in certain physicochemical applications(Lu et al., 2022; Spencer et al., 2018), such as sustainability concerns (Ning et al., 2020; Rather et al., 2022), poor thermal stability (Mozafari & Moztarzadeh, 2010; Quero et al., 2015; Tyuftin & Kerry, 2021), limited solubility at low temperatures (Hu et al., 2016), and relatively weak mechanical behavior (Quintero et al., 2006). In the endeavor of enhancing the physicochemical properties and environmental sustainability of gelatin films through the formation of gelatin-matrix composites, a multitude of efforts have been observed, comprising both metal-based (Azarian & Wootthikanokkhan, 2020; Mozafari & Moztarzadeh, 2010; Salahuddin et al., 2021) and metal-free approaches.(Cao et al., 2007; Skopinska-Wisniewska et al., 2021; Yin et al., 2018) In general, their findings indicate that the favorable outcomes are contingent upon various factors, including film composition and thickness, humidity levels, gelatin source, and the incorporation of ingredients.(Fraga & Williams, 1985; Z. He et al., 2022; Salahuddin et al., 2021; Tyuftin & Kerry, 2021).
Surprisingly, the literature review highlights a notable gap in the investigation of the optical properties of gelatin-matrix composite films. Only a few studies have allocated a portion of their research to study the optical and electrical characteristics of these composite films, which are composed of natural and metal-free compounds(Calixto et al., 2018; Mozafari & Moztarzadeh, 2010) F. Quero and colleagues reported the pioneering discovery of a gelatin-matrix composite film incorporating cellulose in 2015. This natural composite film possesses adjustable optical properties, with the ability to modify transparency to visible light and opacity to UV light based on the weight fraction of cellulose present. This suggests the potential application of these composites as UV-blocking coatings for food.(Quero et al., 2015).
The chitin or chitosan- gelatin, and polysaccharide-gelatin composites.(Afewerki et al., 2019; Kavya et al., 2013; Sahraee et al., 2017) are the widely studied gelatin composites, has gained popularity primarily for its applications as a hemostatic agent in biomedical fields and in food packaging processes.(Campa-Siqueiros et al., 2020) In 2018, C. Chen and coworkers synthesized a nanocomposite material consisting of chitin nanofibers (ChNF) and gelatin. The UV analysis revealed that the inclusion of gelatin in the nanocomposite led to a notable enhancement in the transmittance of ChNF. Specifically, the transmittance at 600 nm improved from 65 % to 88.7 %. This enhancement in transparency, coupled with the improved mechanical properties, makes the ChNF/gelatin nanocomposite films highly promising for applications in food packaging and biomedical industries.(Chen et al., 2018).
In 2021, LSF Leite and their research team successfully developed a gelatin-based composite by combining tannic acid and cellulose nanocrystals (CNC) with gelatin matrix. The composite film demonstrated an impressive capacity to block 76 % of UV light while retaining exceptional transparency to visible light, making it highly suitable for packaging light-sensitive foods.(Leite et al., 2021).
In 2023, Y. Huang et al. developed GTPC (Gel-Tara tannin-PVA-CNTs), a new conductive hydrogel designed for strain sensing in both air and underwater settings. The GTPC composite hydrogel was synthesized using a simple procedure that involved combining gelatin (Gel) and polyvinyl alcohol (PVA) as polymers, Tara tannin serves as the bonding agent, while multiwalled carbon nanotubes (CNTs) function as the conductive material. This innovative formulation enables rapid and precise strain sensing capabilities in diverse environments.(Z. He et al., 2022).
Over the decades, there was a remarkable upsurge in the utilization of naturally occurring vitamin C (VC) and its derivatives in the fields of medicine and pathological treatments.(Guerrero et al., 2020; Lim, 2022; Luo et al., 2018; Mohammadi et al., 2018; Mozafari & Moztarzadeh, 2010; Quero et al., 2015; Regenstein & Zhou, 2006; H. Wang et al., 2015) In recent times, researchers have shown sizable interest in the reaction between excess vitamin c and diazonium salts, leading to the formation of ascorbic acid adducts. This straightforward and cost-effective method has drawn attention as a viable approach for synthesizing a range of organic molecules, utilizing the stable and benign vitamin C adduct.(Antoniewski & Barringer, 2010; Bella et al., 1995; Li et al., 2018; Sahraee et al., 2017; Shankar et al., 2019; Sow & Yang, 2015; Q. Wang et al., 2020; W. B. Wang et al., 2013; Yoshioka et al., 1998).
A groundbreaking development took place in 2022 when Bahez Y. Ahmed and Srood O. Rashid introduced a novel Vitamin C adduct with a sulfonamide linkage. This innovative approach aimed to enhance the optical properties of polyvinyl chloride (PVA).(Yaseen Ahmed & Omer Rashid, 2022).
Recently, the S. O. Rashid research group conducted two distinct studies in 2023, revealing the promising applications of the vitamin C adduct. In the first study, successfully integrated environmentally friendly vitamin C adduct into zinc oxide nanoparticles (ZnO NPs). They characterized and effectively improved the physical properties and catalytic photo-degradation of ZnO NPs.(Kader et al., 2023) In another research pursuit, they fabricated an innovative known as magnesium oxide nanoparticles conjugated with ascorbic acid adduct (MgONPs@VCA). This novel nanocomposite was utilized to catalyze the photo-redox process for the direct thiocyanation of anilines and phenols.(Kader & Omer, 2023) These noteworthy findings expand the potential applications of vitamin C adducts across diverse fields, paving the way for further exploration and utilization.
In this study, ecofriendly vitamin C adducts were produced and recognized using FT-IR, 1H NMR and 13C NMR spectroscopy. These adducts were then incorporated into various gelatin types, including pork gelatin (PG), fish gelatin (FG), bovine gelatin (BG) and chicken gelatin (CG) to fabricate gelatin-matrix film composites using standard aqueous procedure. The newly developed metal-free gelatin composites underwent characterization through XRD, FT-IR, and UV–visible spectroscopy. The experimental findings demonstrated that the ascorbic acid adducts exhibited uniform interaction with the gelatins. The optical properties of both gelatins and gelatin composites were derived from UV–vis spectroscopic data. As a result, a considerable decrease in the average band gap energy (Eg) was observed in the produced composite films, accompanied by a significant elevation in both refractive index (n) and dielectric loss (ɛi) values when compared to pristine gelatins.(Shafiee et al., 2020) Also, this study underscores that even slight modifications in the adduct composition can exert a significant impact on enhancing the optical and textural properties of polymer composites. Furthermore, spectroscopic investigations revealed a preference for direct transitions in electronic band-to-band transitions. Collectively, these aspects position the synthesized gelatin composites as promising contributors to the progression of optical applications, including the packaging of light-sensitive materials, optical devices, and for encapsulating purposes.
2 Experimental part
2.1 Chemicals, instruments and characterization
Sigma-Aldrich supplied all chemicals in their original, pristine condition, and they were utilized without any pre-treatment or purification processes. However, the gelatins (bovine BG, fish FG, chicken CG, and porcine PG) were purchased from Mr.P Ingredients company as premium quality powders.
The chemicals used in the synthesis of vitamin C adducts and their composites are 3,4-dichloroaniline (C6H5Cl2N, 98 %, CAS number of 95–76-1) and 3,5-dichloroaniline (C6H5Cl2N, 98 %, CAS number of 626–43-7), hydrochloric acid (HCl, 37 %, CAS number of 7647–01-0), sodium nitrite (NaNO2, 99 %, CAS number of 7632–00-0), and L-ascorbic acid (C6H8O6, 99 %, CAS number of 50–81-7), acetone (CH3COCH3, ≥99.5 %, CAS number of 67–64-1), and ethanol (CH3CH2OH, 95 %, CAS number of 64–17-5). For all aqueous solutions and the preparation of gelatin films, double-distilled water served as the solvent. The reaction progresses were monitored by an aluminum TLC plate (silica gel coated 60 with fluorescent indicator F254). The TLC spots were observed using ultraviolet (UV) light at a wavelength of 254 nm. The recorded melting points were acquired utilizing an automated melting point apparatus (OptiMelt, Sunnyvale, CA, USA). For obtaining the FT-IR spectra, the compact infrared disks were created by mixing a small amount of the specimen with the KBr powder and applying a pressure of 15 tons to them. Then a Perkin-Elmer spectrophotometer (Waltham, MA, USA) operating in the range of 400–4000 cm−1 was utilized. The proton and carbon-13 NMR spectra (1H NMR and 13C NMR) were obtained using the Bruker DRX-400 MHz instrument (Billerica, MA, USA). The chemical shift (δ) was recorded relative (downfield) to TMS (tetramethylsilane) and expressed in ppm units. Notations such as s for singlet, d for doublet, t for triplet, and q for quadruplet were used to describe the spectral features. The UV–visible spectroscopic information for both pure gelatins and their polymer composites was collected using a PerkinElmer double-beam UV–visible-near-infrared (UV–vis-NIR) spectrometer, specifically the Lambda 25 model. Polymeric films were produced in varying thicknesses, and their measurements were conducted using a digital handheld micrometer (51031 Käfer, Villingen-Schwenningen, Germany) with a precision of 0.01 mm. Multiple measurements, typically ranging from five to ten, were taken at different locations on each film, and an average thickness value was employed to measure the optical properties. The structural information of the samples was acquired using an X-ray diffractometer (X’PERT-PRO MRD). The equipment featured a Cu Kα (λ = 0.154 nm) X-ray source and operated over the 2θ range from 10° to 80°, with a scanning rate of 2° per minute.
2.2 General procedures
2.2.1 General procedure 1 (GP1): Synthesis of ascorbic acid adducts (dopants)
To a clear solution of aniline derivatives (10 mmol; 1 equiv. in 5 mL, of ethanol (95 %), 12 mL of 6 N HCl). a sodium nitrite solution NaNO2 (0.76 g, 11 mmol; 1.1 equiv. in 3 mL of distilled water) was added dropwise using glass syringes over 30 min and maintaining temperature below 5 °C. The mixture of substances quickly transformed into a clear solution, brownish solution. The mixture solution was stirred for 1 h to produce a clear yellow mixture of diazonium salt. To the resulting solution, a cold solution of well-dissolved L-ascorbic acid (4.67 g, 26 mmol; 2.6 equiv. in 15 mL of water) was added dropwise. In the first stage of the reaction an elastic orange precipitate was formed which must be separated from the L-ascorbic acid-diazonium salt solution, then continue to add the L-ascorbic acid. A yellow precipitate was produced which indicated adduct formation, the solution underwent vacuum filtration and multiple rinses with distilled water to eliminate any surplus L-ascorbic acid, the crude product was purified by recrystallization with water and ethanol. Drying of the precipitate was performed in a desiccator.
2.2.2 General procedure 2 (GP2): Fabrication of pure gelatin films
Initially, pure gelatin solutions were prepared for CG, PG, BG, and FG by dissolving 1 g of each gelatin powder in 50 mL of distilled water at 40 °C, with 30 min of continuous stirring. Following that, the solutions were poured into clean plastic petri dishes and allowed to evaporate slowly at 25 °C for 96 h to form dried films. Afterward, the films were carefully removed from the petri dishes and prepared for spectroscopic analysis, including XRD, FT-IR, and UV–Visible spectroscopy. All spectroscopic data and optical properties were evaluated using the average film thickness values (See ESI, Table S1).
2.2.3 General procedure 3 (GP3): Fabrication of gelatin matrix films
At the start, gelatin solutions (CG, PG, BG, and FG) were prepared following the procedure (GP2): 1.00 g of gelatin powder was dissolved in 50 mL of distilled water at 40 °C with continuous stirring for 30 min. Subsequently, these solutions were mixed with dopant solutions (0.07 g of vitamin c adducts, 0.2 mmol, 9 mL of acetone, and 3 mL of distilled water). The resulting aqueous mixture was heated at 40 °C for 30 min. The gelatin composite films were then synthesized by casting the mixture into cleaned plastic petri dishes, and the films were dried by slow solvent evaporation at 25 °C over a 96-hour period. Following this, the films were gently extracted from the petri dishes and prepared for spectroscopic analysis, including XRD, FT-IR, and UV–Visible spectroscopy. All spectroscopic data and optical properties were assessed using the average film thickness values (See ESI, Table S2).
2.2.3.1 Synhesis of (3a): (3R)-4-hydroxy-2-oxotetrahydrofuran-3-yl,2-(2-(3,4-dichlorophenyl)hydrazineyl)-2-oxoacetate (3a)
According to (GP1), the chemicals were mixed: solution of 3,4-dichloroaniline (1a) (1.62 g, 10 mmol; 1 equiv. in 5 mL of ethanol, 12 mL of 6 N HCl), sodium nitrite NaNO2 solution (0.76 g, 11 mmol; 1.1 equiv. in 3 mL of distilled water), L-ascorbic acid solution (4.67 g, 26 mmol, 2.6 equiv. in 15 mL water), the title compound were afforded as a yellow precipitate (2.35 g, 90 %). mp: 117 °C, Rf: 0.81, (Ethyl acetate: n-Hexane 3:1); FT-IR ( ): 3428, 3372, 3268, 2980, 2919, 1786, 1766, 1700, 1596, 1007, 810, 510 cm−1. 1H NMR (DMSO, 400 MHz): δ11.11 (s, 1H), 8.49 (s, 1H), 7.38 (d, J = 8.8 Hz, IH), 6.94 (d, J = 2.7 Hz, 1H), 6.75 (dd, J = 7.46 Hz and 8.44 Hz, 1H), 6.20 (s, 1H), 5.71 (d, J = 7.8 Hz, 1H), 4.72 (q, J = 7.9 Hz, 1H), 4.53 (t, J = 8.0 Hz, 1H), 4.09 (dd, J = 8.32 Hz and 8.20 Hz, 1H). 13C NMR (DMSO, 101 MHz): δ 170.71, 159.01, 156.34, 148.71, 131.83, 131.16, 120.54, 113.81, 113.22, 76.46, 70.10, 69.82.
2.2.3.2 Synhesis of (3b): (3R)-4-hydroxy-2-oxotetrahydrofuran-3-yl,2-(2-(3,5-dichlorophenyl)hydrazineyl)-2-oxoacetate (3b)
According to (GP1), the chemicals were mixed: solution of 3,5-dichloroaniline (1b) (1.62 g, 10 mmol; 1 equiv. in 5 mL of ethanol, 12 mL of 6 N HCl), sodium nitrite NaNO2 solution (0.76 g, 11 mmol; 1.1 equiv. in 3 mL of distilled water), L-ascorbic acid solution (4.67 g, 26 mmol, 2.6 equiv. in 15 mL water), the title compound were afforded as a pale yellow precipitate (2.369 g, 92 %). mp: 119 °C, Rf: 0.75, (Ethyl acetate: n-Hexane 3:1); FT-IR ( ): 3430, 3375, 3269, 2976, 2914, 1788, 1767, 1700, 1596, 1007, 807, 503 cm−1. 1H NMR (DMSO, 400 MHz): δ 11.11 (s, 1H), 8.63 (s, 1H), 6.89 (t, J = 1.8 Hz, 1H), 6.74 (d, J = 2.0 Hz, 2H), 6.19 (d, J = 4.8 Hz, 1H), 5.69 (d, J = 7.9 Hz, 1H), 4.72 (qd, J = 7.9 and 4.6 Hz, 1H), 4.59 (dd, J = 7.8 Hz and 8.2 Hz, 1H), 4.09 (dd, J = 8.2 Hz and 8.4 Hz, 1H). 13C NMR (DMSO, 101 MHz): δ 170.73, 158.90, 156.32, 150.97, 134.96, 118.35, 110.97, 76.48, 70.15, 69.81.
2.2.3.3 Synthesis of gelatin-incorporated-(3a) vitamin C adduct (VC-3a@Gel)
According to (GP3) the solutions were mixed: 3,4-dichloroaniline vitamin C adduct (3a) solution (0.07 g, 0.2 mmol; in 9 mL of acetone, 3 mL of distilled water), gelatin solution (1.00 g powder of CG, PG, BG and FG) dissolved in 50 mL of distilled water, gave the title polymer solution as a light yellow, viscous liquid. Then the mixture casted into cleaned plastic petri dishes, and the film was dried by slowly evaporating the solvent at (25 °C) for 96 h. The composite films (VC-3a@CG, VC-3a@PG, VC-3a@BG and VC-3a@FG) were then gently removed from the petri dish and were characterized using XRD, FT-IR, and UV–Visible spectroscopy.
2.2.3.4 Synthesis of gelatin-incorporated-(3b) vitamin C adduct (VC-3b@Gel)
According to (GP3) the starting solutions were mixed: 3,5-dichloroaniline vitamin C adduct (3b) (0.07 g, 0.2 mmol; in 9 mL of acetone, 3 mL of distilled water), (1.00 g gelatin powder (CG, PG, BG and FG) dissolved in 50 mL of distilled water at (40 °C) with stirring for 30 mins) gave the title polymer solution as a pale yellow, viscous liquid. Then the mixture casted into cleaned plastic petri dishes, and the film was dried by slowly evaporating the solvent at (25 °C) for 96 h. The composite films (VC-3b@CG, VC-3b@PG, VC-3b@BG and VC-3b@FG) were then gently removed from the petri dish and were characterized using XRD, FT-IR, and UV–visible spectroscopy.
3 Results and discussion
3.1 Chemical synthesis
Both L-ascorbic acid adducts (3a and 3b) were synthesized using a two-step chemical process in a single reaction vessel, involving diazotization and coupling reactions. To start, the anilines were dissolved in an appropriate solvent, typically ethanol, and protonated using an excess of concentrated HCl. Following this, they were carefully diazotized at temperatures between 0 and 5 °C using NaNO2 to produce diazonium salts (2a and 2b). Subsequently, the resultant diazonium salts were coupled with an excess (2.5 equiv.) of vitamin C solution to produce the adducts. These reactions are straightforward, cost-effective, and do not require chromatography with relatively high yield%, as outlined in Scheme 1.
Synthesis of l-ascorbic adducts (3a and 3b).
Later, we produced two sets of gelatin composite films, namely VC-3a@CG, VC-3a@PG, VC-3a@BG, and VC-3a@FG, as well as VC-3b@CG, VC-3b@PG, VC-3b@BG, and VC-3b@FG (see Scheme 2). These films were created by blending the dopant adducts (3a and 3b) with their hosted gelatin solutions (CG, PG, BG, and FG). The identity of the resulting films and the assessment of their optical properties were verified through XRD, FT-IR, and UV–vis. spectroscopy.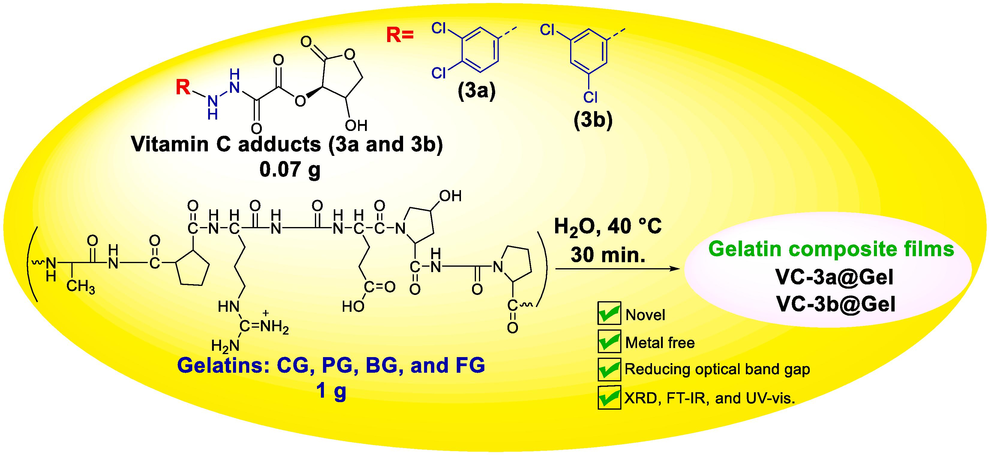
Synthesis of gelatin-matrix composites (VC-3a@Gel and VC-3b@Gel).
3.2 Characterization of ascorbic acid adducts (3a and 3b)
3.2.1 FT-IR
Absorption of broadband IR energy excites infrared-active compounds from ground vibrational energy states to higher ones, yielding an IR signal that aids in identifying specific functional groups and offering pertinent insights.(Allen et al., 1993; Mohamed et al., 2017) The diagnostic region of FT-IR spectra for both L-ascorbic adducts (3a and 3b) provide valuable insights into the essential vibrational stretching of characteristic functional groups within the adduct molecules (See Fig. 1).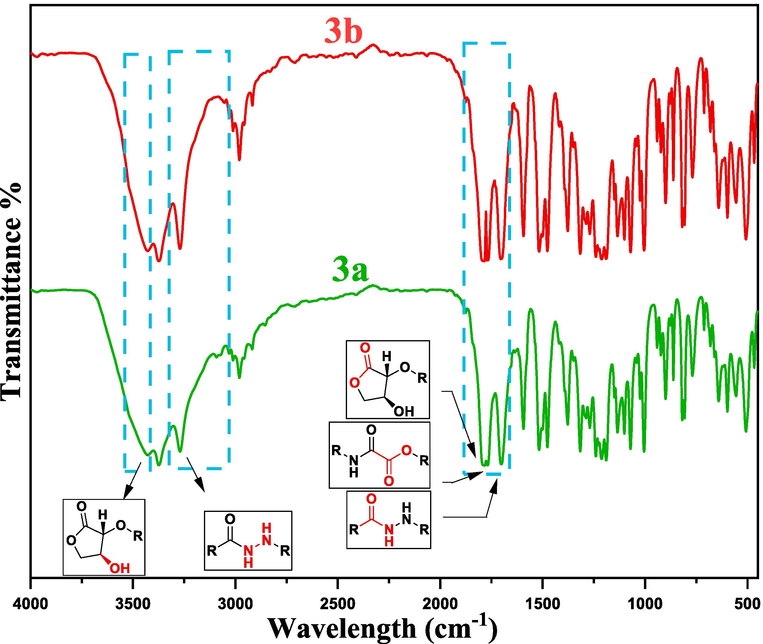
FTIR spectrum of a dopant vitamin C adducts (3a and 3b).
The most polar group, O–H stretching vibrations, exhibit strong IR vibrational signals at approximately 3460–3430 cm−1. Meanwhile, N–H stretching vibrations manifest as sharp and intense doublet signals, with asymmetric N–H stretching around 3370–3360 cm−1 and symmetric N–H stretching around 3260–3230 cm−1. The degree of broadening and intensity observed in IR peaks serves as a strong indicator of hydrogen bonding (HB) presence. In this context, polar groups like O–H and N–H within adducts with minimal HB are more predisposed to forming intermolecular HB interactions with other molecules, such as the host polymers.(Hu et al., 2016).
The vibrational stretching signals for C–H stretching in both sp2 and sp3 carbons were observed at (3095–2910 cm−1), respectively. Significantly, the carbonyl groups in the adducts (3a and 3b) exhibit three distinctive stretching vibrations, yielding peaks at 1788, 1766, and 1700 cm−1. The two ester C = O stretching vibrations in both adducts are observed at higher wavenumbers (approximately 1788 and 1766 cm−1) due to the inductive effect of the electronegative oxygen atoms. In contrast, the C = O stretching vibrations in the amide groups appear at lower wavenumbers, influenced by the mesomeric effect, providing strong confirmation of the formation of the ascorbic acid adducts. Moreover, the fingerprint region in the IR spectrum serves as additional confirmation of the molecular structure of dopants (3a and 3b). Within this region, the stretching vibrations for C–O and C–N bonds were detected at approximately 1318 and 1190 cm−1, respectively.
3.2.2 1H NMR
The hydrogen arrangement within adducts was identified and characterized through 1H NMR spectroscopy. The 1H NMR spectrum of compounds (3a and 3b) was acquired by dissolving the samples in DMSO‑d6, as illustrated in Figs. 2-4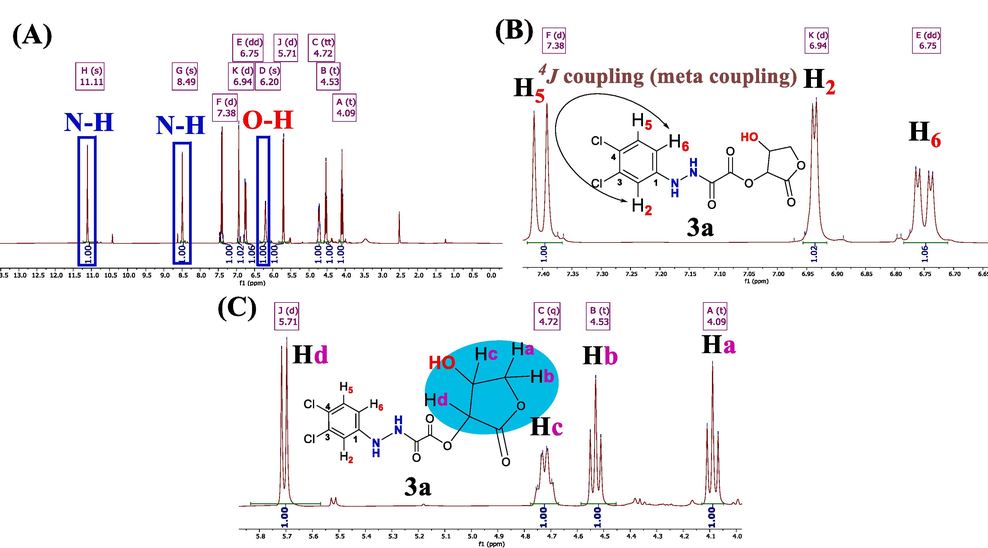
1H NMR spectrum of 3a. (A) Exchangeable protons. (B) Aromatic protons. (C) Protons of lactone moiety.
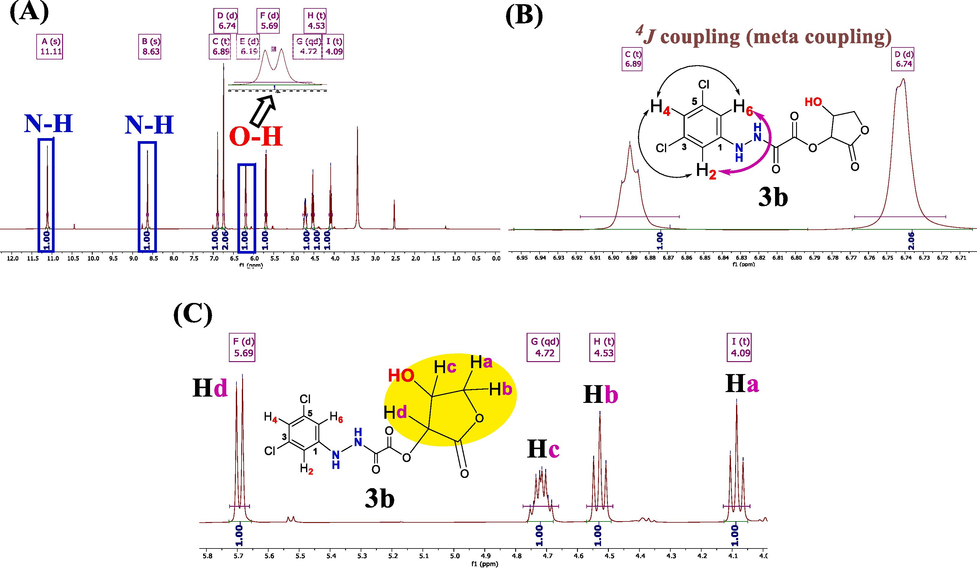
1H NMR spectrum of 3b. (A) Exchangeable protons. (B) Aromatic protons. (C) Protons of lactone moiety.
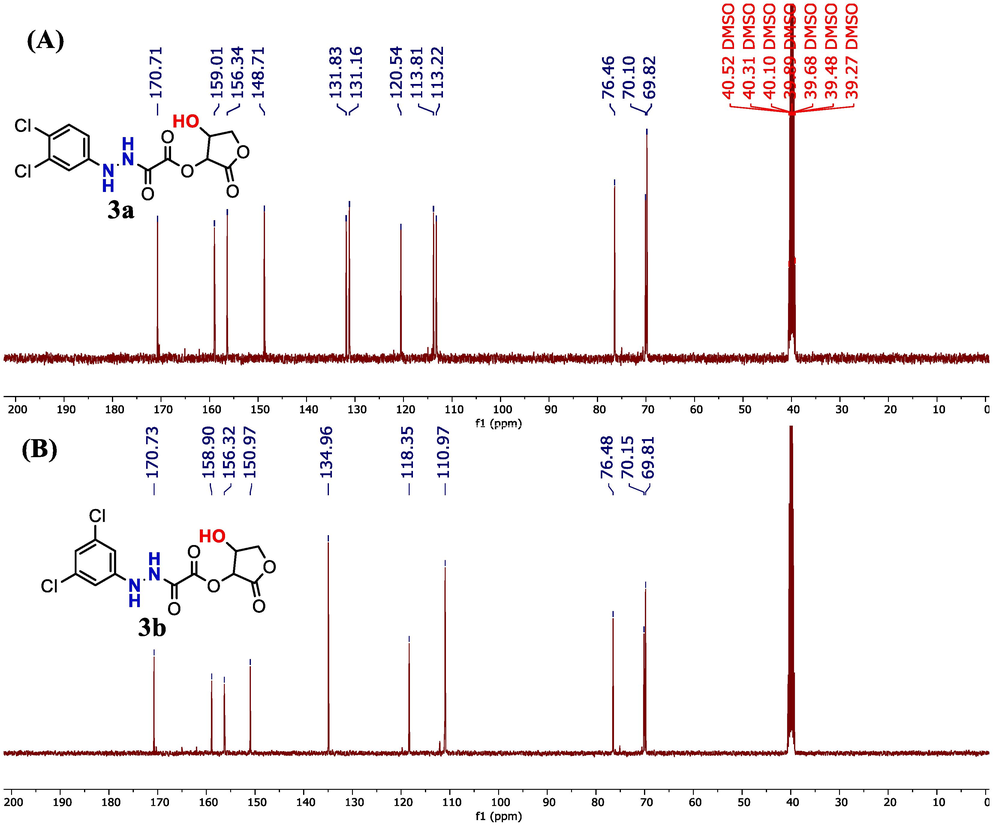
13C NMR spectra of adducts. (A): 3a and (B): 3b.
The 1H NMR spectra distinctly reveal the presence of the two kinds of exchangeable protons (O–H and N–H) in the dopant compounds (see Fig. 2a and 3a).(Browne et al., 2011) Specifically, the two hydrogen signals of N–H are observed as singlets at more downfeild (higher frequencies): 3a (δ = 11.11 and 8.49 ppm) and 3b (δ = 11.11 and 8.63 ppm). The (O–H) proton in 3a exhibits slight shielding effect, resonating at frequencies around (δ = 6.20 ppm, s, 1H). Conversely, the O–H proton in 3b is trapped and coupled with its neighboring geminal proton (Hc). As a result, it manifests as a signal at (δ = 6.19 ppm, doublet, 2J = 4.8 Hz, 1H). This behavior arises from the reduced exchange rate of the O–H proton in 3b, occurring less frequently than once per millisecond (1/1000 s).
Regarding the three aromatic protons (H2, H5, and H6) in dopant (3a), they appeared as three distinct signals falling within the range of (δ = 6.7– 7.4 ppm). H5 (δ = 7.38 ppm, d, J = 8.80 Hz) and H6 (δ = 6.75 ppm, dd, J = 8.80, 2.7 Hz) were coupled together through a vicinal coupling constant (3J = 8.80 Hz). Additionally, H2 (δ = 6.94 ppm, d, J = 2.7 Hz) exhibited a slight coupling effect (meta coupling) with H6 (δ = 6.75 ppm, dd, J = 8.80, 2.7 Hz), through a long-range coupling constant of (4J = 2.7 Hz), as depicted in Fig. 2b. In compound 3b, the three phenyl protons (H2, H4, and H6) appeared as two signals in the δ = 6.9–6.7 ppm range. H2 and H6, considered equivalent protons, show slight coupling due to a long-range meta coupling at δ = 6.74 ppm (d, with 4J = 2.00 Hz, 2H). Meanwhile, the H4 proton appears at δ = 6.89 ppm (t, with 4J = 1.8 Hz, 1H), resulting from double long-range couplings with both H2 and H6 protons, as illustrated in Fig. 3b.
The proton signals (Ha to Hd) originating from the lactone ring in both 3a and 3b are highlighted in Fig. 2c and 3c, falling within the range of δ = 6.19–4.00 ppm. Specifically, the Hd proton signals of the asymmetric carbon are observed at δ = 5.71 ppm (d, with 3J = 7.8 Hz, 1H) for 3a and δ = 5.69 ppm (d, with 3J = 7.9 Hz, 1H) for 3b. In 3a, the Hc signals on the adjacent chiral carbon appear at δ = 4.72 ppm (q, with 3J = 7.9 Hz, 1H). However, in compound 3b, Hc manifests as a complex NMR signal at δ = 4.72 ppm (qd, with J = 7.9 Hz and 4.6 Hz, 1H), confirming its geminal coupling with the hydroxyl proton (O–H), which exhibits a 2J = 4.8 Hz coupling constant.
The remaining diastereotopic protons (CH2) in both 3a and 3b present themselves as two pairs of unresolved triplets.(Hu et al., 2016) Further analysis reveals the existence of two pairs of potential doublet of doublets. In 3a, one signal appears at δ = 4.53 ppm (dd, J = 7.46 Hz and 8.44 Hz, Hb), while another (Ha) is observed at δ = 4.09 ppm, displaying very slight spin coupling (dd, J = 8.32 Hz and 8.20 Hz). For dopant 3b, the signal at δ = 4.59 ppm (dd, J = 7.8 Hz and 8.2 Hz, Hb) and the other (Ha) at δ = 4.09 ppm exhibit similar slight spin coupling (dd, J = 8.2 Hz and 8.4 Hz, Hb).
3.2.3 13C NMR
The validation of the carbon skeleton in compounds 3a and 3b was confirmed through analysis of their 13C NMR spectra, as illustrated in Fig. 4. The 13C NMR spectrum of compounds 3a and 3b clearly displays three different signals corresponding to carbonyl groups (C = O). Particularly, the lactonic carbonyl groups exhibit the most deshielded signal in the spectra, appearing at δ = 170.71 ppm for 3a and δ = 170.73 ppm for 3b. The esteric carbonyl groups show resonances at δ = 159.01 ppm for 3a and δ = 158.90 ppm for 3b, closely resembling each other in their chemical shifts. The amidic carbonyl groups in both 3a and 3b are characterized by signals at δ = 156.34 ppm and δ = 156.32 ppm for 3a and 3b, respectively. The chemical shifts of 3b align perfectly with the 13C NMR analysis of the compound previously synthesized and examined by Browne et al.(Browne et al., 2011) The 13C NMR signals arising from the aromatic rings in both 3a and 3b serve as additional evidence of adducts' synthesis. In 3a, all six non-equivalent aromatic carbons are observed at δ = (148.71, 131.83, 131.16, 120.54, 113.81, 113.22) ppm, while for 3b, the four aromatic carbon signals are detected at δ = (150.97, 134.96, 118.35, 110.97) ppm. The three distinctive sp3 carbons located within the lactone rings of both 3a and 3b are evident at δ = (76.46, 70.10, 69.82) ppm and δ = (76.48, 70.15, 69.81) ppm, respectively.
3.3 Characterization of gelatin-matrix films and their composite counterparts
3.3.1 FT-IR
FT-IR spectroscopy is a widely employed procedure for characterizing the functional groups in organic compounds and for conducting variety spectroscopic investigations. This method provides valuable diagnostic information for studying polymer composition, monitoring polymerization processes, characterizing polymer structures, analyzing polymer surfaces, and investigating polymer degradation processes.(Boerio & Wirasate, 2001; Kaminski & Smolka, 2011; Stuart, 2005) Table 1 Key IR Spectral regions of fabricated Films.
Entries
Films
Amide-A &Amide-B
Amide-I
Amide-II
Amide-III
1
CG
2904–3348
1620
1524
1207
2
VC-3a@CG
2904–3579
1624
1523
1230 & 1199
3
VC-3b@CG
2769–3587
1620
1527
1226 & 1199
4
PG
2915–3560
1617
1519
1230 & 1201
5
VC-3a@PG
2881–3579
1623
1523
1226 & 1199
6
VC-3b@PG
2835–3449
1616
1515
1225 & 1195
7
BG
2912–3490
1623
1519
1230 & 1195
8
VC-3a@BG
2815–3641
1623
1519
1226 & 1195
9
VC-3b@BG
2835–3629
1623
1523
1222 & 1195
10
FG
2908–3521
1619
1519
1230 & 1199
11
VC-3a@FG
2804–3579
1616
1519
1230 & 1199
12
VC-3b@FG
2908–3617
1627
1511
1226 & 1203
Average in cm−1
1620.91
1520.08
1225.66 & 1198.09
Fig. 5 and Table 1 showcase IR spectroscopic data for both pristine gelatin films (CG, PG, BG, FG) and their respective composite films (VC-3a@CG, VC-3b@CG, VC-3a@PG, VC-3b@PG, VC-3a@BG, VC-3b@BG, VC-3a@FG, VC-3b@FG). For the evaluation and tracking of chemical modifications within hybrid polymer films, we analyzed the five primary characteristic absorption bands in gelatins (Amide: A, B, I, II, and III).(Alam et al., 2022; Ejaz et al., 2018; Esteghlal et al., 2018; Preethi et al., 2021; Rajkumar et al., 2017; X. Wang et al., 2018) This analysis enables us to gain further insights into the synthesis of composite films by investigating the effects of electrostatic interactions between the hosted gelatin polymers and dopants (3a and 3b). We will accomplish this by observing variations in the shapes, strengths, and positions of the λ-max (maximum absorption wavelength) across all functional groups within polymer films.(Brza et al., 2021; Q. He et al., 2016).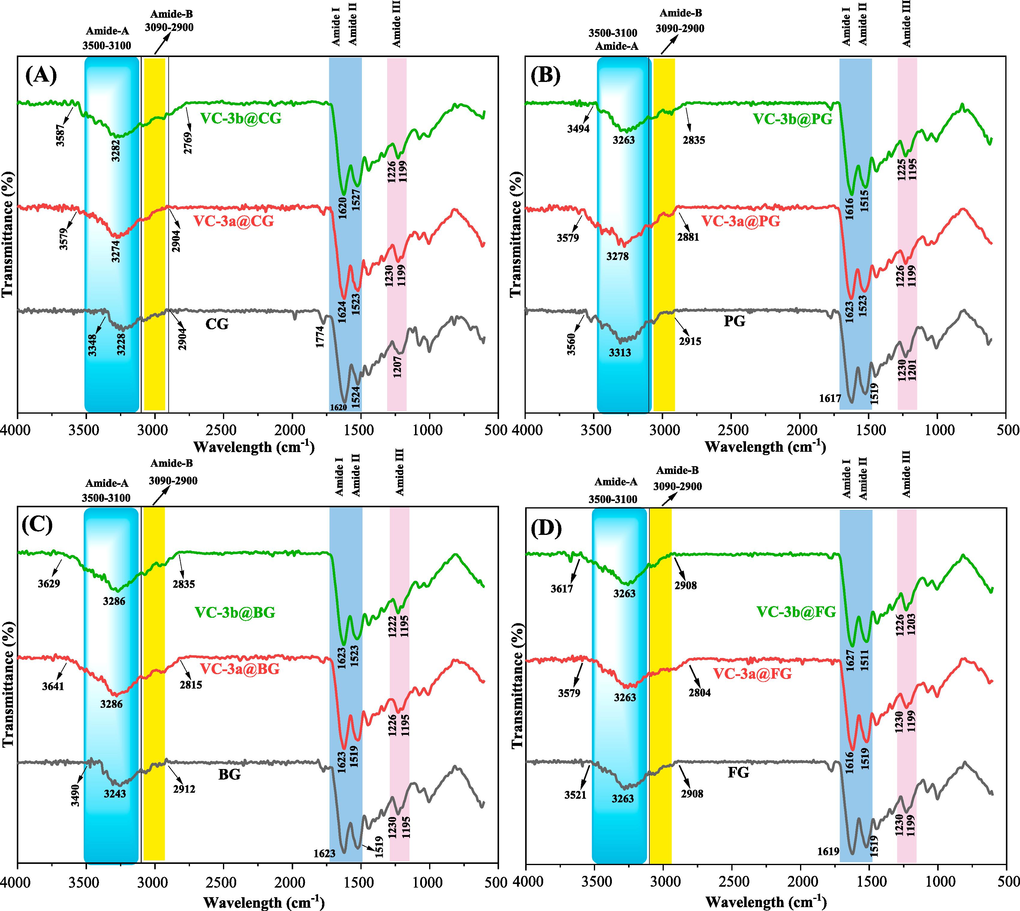
FT-IR spectra of gelatin films and their corresponding composite films.
The most informative segments within all the film IR spectra, as depicted in Fig. 5(A-D) and detailed in Table 1 entries 1–12, include the Amide-A region (∼3100–3500 cm−1) and the Amide-B region (∼2900–3090 cm−1). The Amide-A region signifies the presence of the most polar groups, including O–H and N–H, characterized by higher vibrational frequencies within the molecule. Additionally, the Amide-B region (around 3090–2900 cm−1) corresponds to the absorption bands of saturated and unsaturated hydrocarbon moieties (C-Hstr.).(Alam et al., 2022; Bommalapura Hanumaiah et al., 2021; Ejaz et al., 2018; Hanumaiah Anupama et al., 2022; Rajkumar et al., 2017).
In all eight polymer composite films (Table 1, entries: 2, 3, 5, 6, 8, 9, 11, and 12), there were significant alterations in the shapes, intensities, and positions of O-Hstr., N-Hstr., and C–H stretching compared to their respective pure gelatin films (Table 1, entries: 1, 4, 7, and 10). These alterations resulted in broader and more intense IR signals, primarily due to the substantial molecular hydrogen bonding occurring between the polar groups of dopants (3a and 3b) and the polar groups within gelatin matrices.
Nonetheless, the Amide regions (Amide: I, II, and III) in all gelatin composite films remained nearly unaltered, with average wave numbers of Amide I (C = Ostr = 1621 cm−1), Amide II (N–H bending coupled C-Nstr. = 1520 cm−1), and Amide III (N–H bending) at 1225 and 1198 cm−1.(Esteghlal et al., 2018; Geng et al., 2009; Mahmoud & Abbo, 2013; Preethi et al., 2021) This suggests that the primary interactions between dopants (3a and 3b) and the hosted gelatins predominantly involve the most polar groups, such as the (O–H and N–H) groups.
3.3.2 XRD study
X-ray diffraction (XRD) serves as a widely employed method for discerning the amorphous and crystalline components within electrolyte film specimens. The utilization of XRD analysis facilitated the investigation of the structural attributes of solid materials and polymer composites, providing accurate, immediate, and efficient insights into their composition.(Anderson & Paulo, 2014; Nofal et al., 2020) Fig. 6a-d displays the XRD diffraction spectra of the samples, containing pure forms of gelatins and the composites associated with each of them (VC-3a@Gel and VC-3b@Gel). It is worth noting that the XRD pattern of the pure gelatin samples shows a significantly broad diffraction peak centered at 2θ = 20°, which corresponds to the spacing between amino acid residues and is indicative of a triple-helical structure.(Bella et al., 1995; Bommalapura Hanumaiah et al., 2021; Lavorgna et al., 2010; Li et al., 2018; Qiao et al., 2017; Rivero et al., 2010).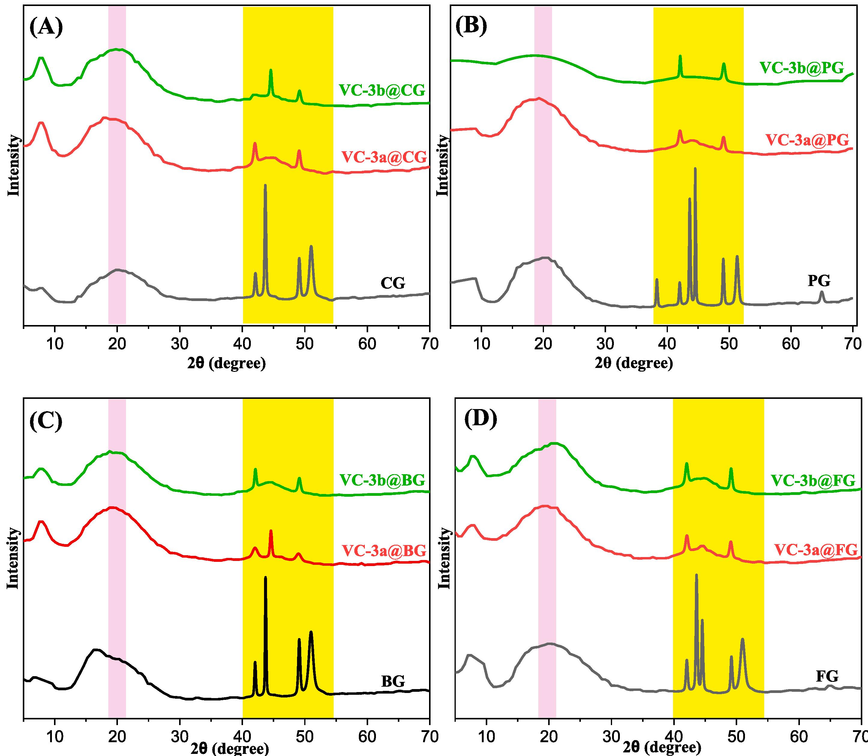
XRD pattern of pure gelatin films and their respective hybrid polymer films.
The diffractograms of the eight samples all display an amorphous character, suggesting a lack of inclination towards recrystallization at approximately 2θ = 20°. This phenomenon can likely be ascribed to the substantial stability and heightened moisture content found in the gelatin films.(Lavorgna et al., 2010).
Despite the similarities in the results obtained for all hosted gelatin films, variations in both intensity and the amorphous structure of hybrid films were observed, contingent on the specific types of gelatins and dopants used (3a and 3b).(Suderman et al., 2018) Furthermore, the XRD patterns of pure gelatins exhibit a limited number of crystalline peaks in the 2θ range of 40°–55°, which can be attributed to the inherent crystalline nature of certain nutritional ingredients, such as table salt and sugar, present in the gelatin powder utilized for this research.(Hassan et al., 2020; Qiu et al., 2023; Yang et al., 2020) The most useful region, spanning 2θ = 40°–55°, of the XRD spectra for the polymer composite broadening films reveals a significant reduction in intensity and of the XRD signals. This phenomenon indicates an increase in the amorphous structure within the resulting hybrid films. This change is likely a result of the replacement of regular intermolecular hydrogen bonding found in pure gelatins with random intermolecular hydrogen bonding in the composite films.(Hanumaiah Anupama et al., 2022; Saber-Samandari et al., 2017).
To unveil this information, the crystalline percentage of gelatins and their fabricated composites was determined by calculating the ratio of the areas corresponding to crystalline peaks to the total area of the entire gelatin after baseline correction. Consequently, pure CG exhibited the highest crystallinity at 32.61 %, whereas pure PG demonstrated the lowest crystal index at 24.50 %. The introduction of dopants 3a and 3b resulted in an augmentation of amorphicity. Notably, 3a exerted a significant influence in reducing the crystal index in BG to 8.81 %, surpassing its impact on other gelatins (CG, PG, and FG). Simultaneously, the adduct 3b has a remarkable influence by reducing crystallinity % in CG to 8.95 % compared to other gelatins (BG, PG, and FG), as illustrated in Table 2. The average of experimental XRD data indicates that 3b exhibits a substantial impact on decreasing crystallinity (10.71 %) compared to 3a (12.18 %).
Gelatin films
Total area of crystalline peaks
Total area
Crystalline%
CG
107.66
330.05
32.61
VC-3a@CG
75.88
521.19
14.55
VC-3b@CG
43.40
484.55
8.95
PG
128.29
523.50
24.50
VC-3a@PG
68.14
600.35
11.35
VC-3b@PG
50.13
424.04
11.82
BG
154.09
518.09
29.74
VC-3a@BG
52.44
594.94
8.81
VC-3a@BG
56.36
519.36
10.85
FG
137.95
488.49
28.24
VC-3a@FG
54.83
391.53
14.00
VC-3b@FG
54.23
483.11
11.22
Moreover, the inclusion of dopants (3a and 3b) significantly obstructs the formation of the triple helix structure, especially in the regions centered at 2θ = 20°. This hindrance leads to broader peaks with relatively lower intensity, a consequence of the homogeneous interactions between gelatin and ascorbic acid adducts.(Bao et al., 2017; Lavorgna et al., 2010; Qiao et al., 2017; Rabiei et al., 2020; Saber-Samandari et al., 2017; Suderman et al., 2018; Venezia et al., 2022; Yalçin & Mutlu, 2012).
3.3.3 UV–visible study
3.3.3.1 Molecular absorption study
The fabricated films underwent a molecular-level analysis through the well-established UV–Vis spectroscopy technique. This analysis aimed to assess various physical characteristics such as the molar absorption coefficient, bandgap, and refractive index, among others. Fig. 7(a-d) visually represents the electronic transitions occurring within both the gelatin matrix films and their corresponding composite films when exposed to ultraviolet–visible light. These spectra were produced through the absorption of UV–Vis. light (190 – 1000 nm) and analyzed in accordance with Beer's law. (Venkatachalam, 2016).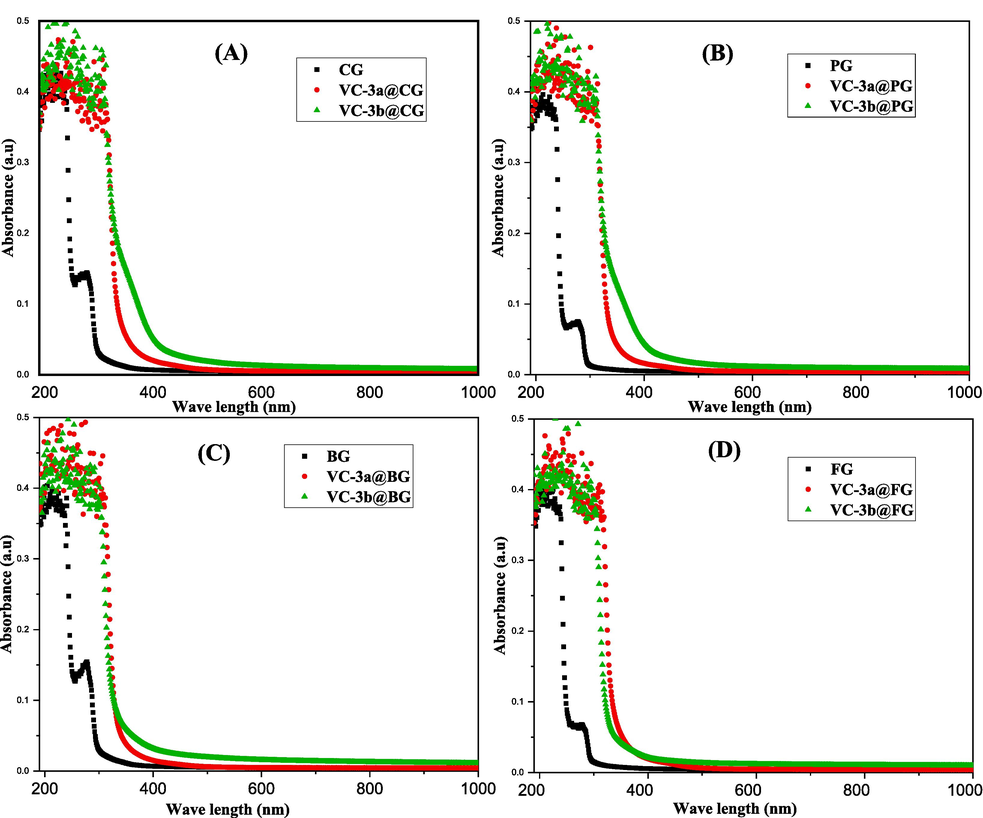
UV–vis. absorption spectra of pure gelatins and their composite films.
In all absorption spectra (CG, PG, BG, and FG), two prominent peaks emerge in the UV region, specifically around 230 nm and approximately 275 nm, as corroborated by various references.(Evanoff & Chumanov, 2005; Hanumaiah Anupama et al., 2022; Mahmoud & Abbo, 2013; Shehap et al., 2017) These two peaks can be attributed to specific electronic transitions. The strong absorption at 230 nm is likely linked to π → π* transitions arising from unsaturated C = C and C = O bonds found in amide and acetyl groups (non-aromatic amino acids). The second peak, observed at the longest wavelength interval (∼275 nm), is attributed to n → π* transitions, which involve the free electrons of oxygen and nitrogen atoms within gelatin structures and the presence of aromatic amino acids, as documented in various sources.(Abrusci et al., 2004; Bommalapura Hanumaiah et al., 2021; Evanoff & Chumanov, 2005; Hanumaiah Anupama et al., 2022).
When a small quantity of dopant vitamin C adducts (3a and 3b, %W/W = 7) is introduced into pristine gelatin polymers, a remarkable enhancement in the optical properties of all resulting composites becomes obvious. Particularly, Fig. 7a-c illustrates that 3b exhibits significant optical improvements when compared to 3a in CG, PG, and BG polymers, while Fig. 7d reveals that 3a demonstrates a slightly more effective enhancement in the optical properties of the FG polymer when compared to 3b. This improvement is discernible in the form of a noticeable shift in absorption towards longer wavelengths (redshift). Furthermore, this alteration leads to a significant increase in absorption across the entire UV region and an extension into the visible region. This occurrence can be ascribed to the decrease in the band gap energy of the composite films.(Abdul-Kader, 2013; Baycan Koyuncu et al., 2011; Prashanth Kumar et al., 2014).
3.3.3.2 Refractive index study
The refractive index (n) of polymers is a fundamental optical property that describes how light propagates through these materials. Typically, unlike inorganic materials such as glass or metals, polymers tend to display lower n values due to the reduced velocity of light within polymer structures.(Aziz et al., 2020; Brza et al., 2019; Marquez & Nau, 2001; Shehap et al., 2017) The n value is mathematically determined through the utilization of Kramer’s -Kronig relations:
As outlined in equation (1), the refractive indices (n) at specific wavelengths (λ) were computed using the corresponding reflectance (R) and extinction coefficient (K), which are intimately tied to wave propagation via the equation K = λα/4πt. In this context, λ represents the wavelength of the incident light, while t implies the thickness of the thin films. α, which stands for the optical absorption coefficient, represents a vital optical parameter derived from mathematical analysis of molecular absorption data.(Muheddin et al., 2023) This parameter plays a pivotal role in determining the optical band gap energy of polymer materials.(El-Nahass et al., 2012; T.S.Moss, 1959).
The refractive index of polymers varies depending on their chemical composition, structure, and processing conditions.(Abbate et al., 1978; Muheddin et al., 2023; Singh, 2002) Understanding the n of polymers is crucial in various applications, including optics, coatings, and materials engineering, as it influences light transmission, reflection, and dispersion within these materials.(Bommalapura Hanumaiah et al., 2021; Marquez & Nau, 2001; Shehap et al., 2017; Taha, 2019).
Fig. 8a-d depicts the refractive indices (n) of pure gelatins and their hybrid composites (VC-3a@Gel and VC-3b@Gel). Remarkably, the figure reveals enhanced dispersion patterns in the refractive indices for the hybrid films. In essence, the n of pure gelatins (around 1.15) showed an increase upon the introduction of dopants (3a and 3b), reaching approximately 1.32 for VC-3b@Gel and about 1.17 for VC-3a@Gel (See Fig. 8c). It demonstrated a gradual decrease over the wavelength range spanning nearly 330 to 590 nm. Furthermore, the outcomes of this study indicate that dopant 3b has a more pronounced impact on the dispersion of refractive indices compared to 3a. This can be returned to the enhanced bundling density and amplified polarization of gelatin matrixes resulting from the insertion of these dopant adducts.(Bommalapura Hanumaiah et al., 2021) So, these diversities in refractive index of these polymer composites offers advantages such as customizability, cost-effectiveness, lightweight properties, and suitability for various applications, making them a valuable choice in the optical industry.(Marquez & Nau, 2001; Shehap et al., 2017; Taha, 2019).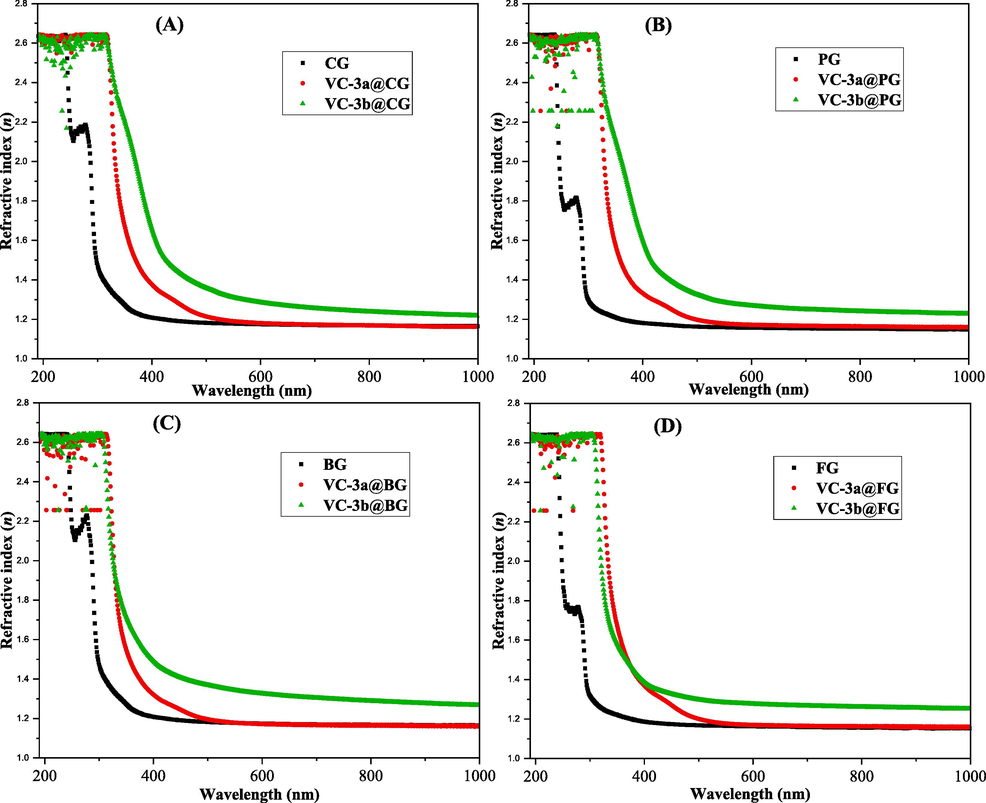
Refractive index (n) versus wavelength (λ) for the pristine gelatin and their hybrid films.
3.3.3.3 Band gap study
Assessing the band gap energy (Eg) serves a valuable approach for estimating the optical properties, electrical, and thermal conductivity traits of polymers.(Brza et al., 2021; Taha, 2019) Eg is a fundamental physical constant that quantifies the energy disparity between a polymer's conduction and valence bands (CB and VB bands).(Aziz et al., 2021) In order to achieve a more precise understanding of the predominant electron transition types and to gain insights into the structure–property correlation (whether the material behaves as an insulator, semiconductor, or metal) within the polymer films, it is crucial to thoroughly grasp the complex dielectric function (ε*).(Aziz, 2016) ε* describes how a material interacts with electromagnetic radiation over a broad range of wavelengths and is expressed in terms of the optical refractive index 'n' and the extinction coefficient 'K'.(Soni et al., 2011) This function is sum of imaginary (εi = 2nK) and real (εr = n2 - K2) parts of optical dielectric loss parameter, as illustrated in equation (2):
In this study, we experimentally determine the Eg value of prepared films by utilizing the more accurate imaginary component of the optical dielectric loss parameter (εi). Meanwhile, we elucidate the nature of the electronic transitions occurring between the conduction band (CB) and valence band (VB) using Tauc's model, as elaborated in equation (3): (Hussein et al., 2020)
Where hυ represents photon energy, B is a constant of proportionality, and the value of n is an exponent depends on the nature of the electronic transitions happening within the polymer.(Hussein et al., 2020) In Fig. 9a-d, the optical energy band gap for all solid films, comprising both pure polymers and their eight composites, was determined by pinpointing the intercept point of the extrapolated linear segment on the plot, denoted as (αhν)n on the y-axes, in relation to the photon energy (hν) on the x-axis.(Ahmed et al., 2009) In all cases, the determined average band gap energy (Eg) value for pure gelatins, approximately 4.9 eV, consistently decreases when compared to the composites (VC-3a@Gel and VC-3b@Gel), which have an average Eg value of around 3.6 eV. Fig. 9a illustrates a slightly broader range of energy band gaps for CG gelatin, spanning from approximately 4.9 to 3.4 eV when 3b was added. Clearly, these results demonstrate that the inclusion of 3a and 3b in pure gelatin polymers induces changes in the energy states between the valence and conduction bands. The reduction in the optical band gap can be attributed to a decline in the degree of crystallinity in the samples, resulting from alterations in the polymer structure.(Su & Zhou, 2019).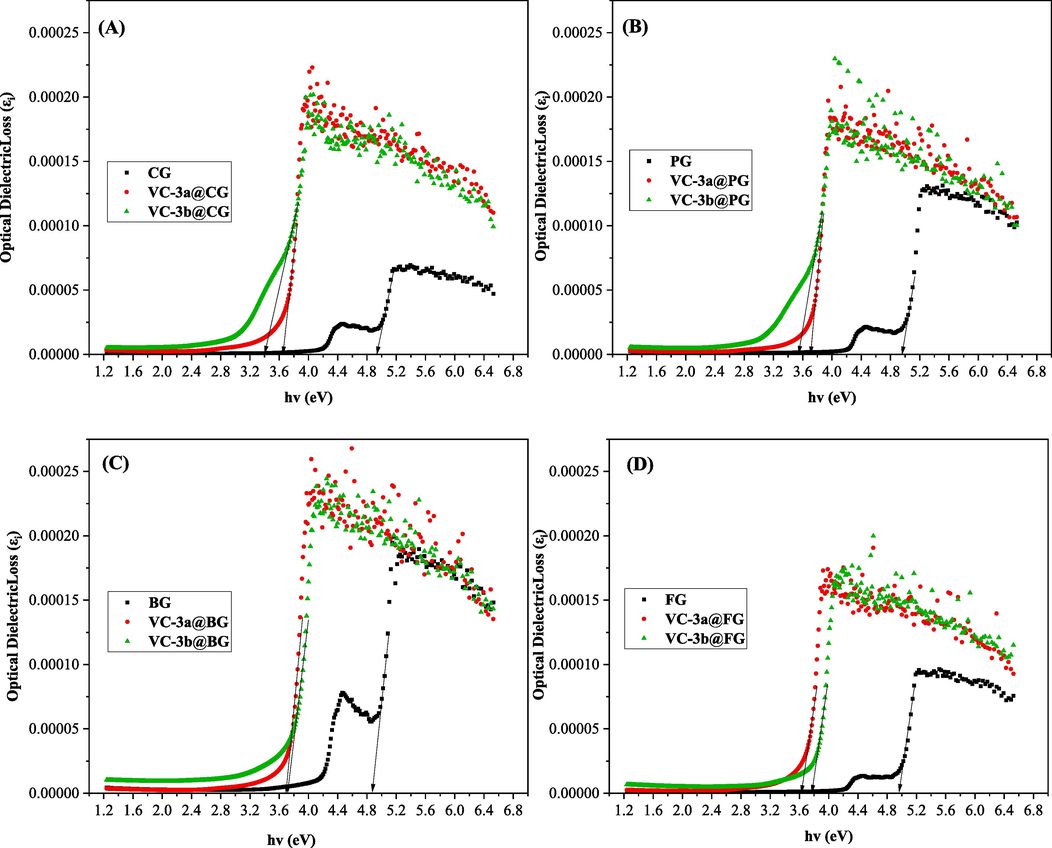
Optical dielectric loss plot for pure gelatins and their associated polymer composites.
Additional investigation has been implemented to determine the nature of band-to-band transitions within polymers. It is crucial to note that these wide-ranging band-band transitions must conform to a selection rule in molecular absorption spectroscopy. As mentioned previously, the direct use of Tauc's equation for determining Eg is not feasible due to the various possible values of the exponent 'n', such as n = 1/2, 2/3, 2, and 1/3. Tauc's equation serves the purpose of describing the absorption behavior of a material in proximity to its band gap energy (Eg). It helps ascertain whether the transitions in these polymers are direct or indirect, and whether they are allowed or forbidden. For comprehensive information, refer to Table 3.(Muheddin et al., 2023). (*) = indirect allowed; (#) = direct forbidden; (§) = direct allowed; (†) = indirect forbidden transitions.
Films
n = 1/2*
n = 2/3#
n = 2§
n = 1/3†
Dielectric loss, εi
CG
4.8
4.9
5
4.6
4.9
VC-3a@CG
3.5
3.6
3.7
3.4
3.6
VC-3b@CG
3.2
3.4
3.7
3.2
3.4
PG
4.8
4.9
5
4.8
4.9
VC-3a@PG
3.5
3.7
3.8
3.5
3.7
VC-3b@PG
3.3
3.5
3.7
3.2
3.5
BG
4.7
4.8
4.9
4.5
4.8
VC-3a@BG
3.5
3.6
3.7
3.4
3.6
VC-3b@BG
3.5
3.7
3.8
3.5
3.7
FG
4.8
4.9
5
4.6
4.9
VC-3a@FG
3.5
3.6
3.7
3.4
3.6
VC-3b@FG
3.7
3.7
3.9
3.5
3.7
Hence, the correct band gap energy derived from Fig. 9 for both pure gelatins and their respective composites align with the preferred direct forbidden transition when the 'n' value equals 2/3. This alignment is corroborated by Fig. 10 and Table 3. In the context of enhancing material properties, direct transitions are typically favored over indirect transitions since they result in lower heat energy losses.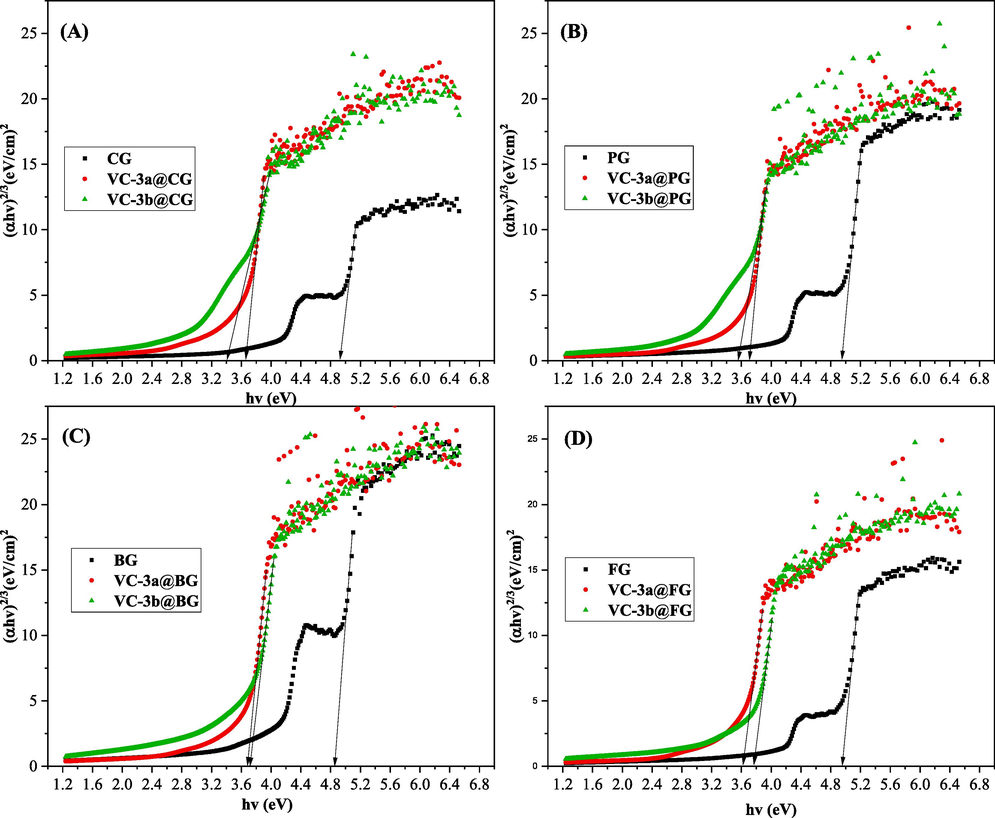
Plot of (αhυ)2/3 versus hυ for the neat gelatins and their composites.
4 Conclusion
In summary, this study has confirmed the enhancement of optical properties in various gelatins (PG, FG, BG, and CG) through chemical cross-linking using small organic molecules. The biodegradable and safe ascorbic acid was successfully utilized in the straightforward synthesis of pairs of organic isomer adducts (dopants). Several spectroscopic analyses (FT-IR, FT-1H NMR, and FT-13C NMR) verified the synthesis of these adducts. Notably, the 1H NMR spectra provided intriguing insights into the hydrogen arrangements and spin–spin coupling of exchangeable, aromatic, and lactone protons within the dopant adducts. The study also observed significant chemical interactions between the adducts and the host gelatins, as confirmed by XRD, FT-IR, and UV–vis spectroscopies, demonstrating the successful fabrication of polymer composites. Improved optical properties, including refractive index (n), dielectric loss (ɛi), and optical band gap energy (Eg), were extracted from UV–vis spectroscopic data for both pure gelatins and their respective composites. Notably, both n and ɛi values elevated compared to pristine gelatins, while the average energy bandgap (Eg) declined from 4.9 eV (pure gelatin) to 3.4 eV. Moreover, this study emphasizes that even minor alterations in the adduct composition, as seen with 3b, can exert a substantial influence on the enhancement of optical and textural properties in polymer composites. Additionally, spectroscopic studies indicated that electronic band-to-band transitions favored direct transitions. The outcomes of this research are anticipated to significantly contribute to the advancement of optical applications involving gelatin-matrix composite films.
Author agreement
The authors wish to make it explicitly clear that, after a thorough review, they have not been able to identify any financial conflicts of interest or personal relationships that could potentially exert any influence over the research that is being presented in this paper.
Declaration of competing interest
The authors declare that they have no known competing financial interests or personal relationships that could have appeared to influence the work reported in this paper.
References
- The temperature dependence of the refractive index of water. J. Phys. D Appl. Phys.. 1978;11(8):1167-1172.
- [CrossRef] [Google Scholar]
- The optical band gap and surface free energy of polyethylene modified by electron beam irradiations. J. Nucl. Mater.. 2013;435(1–3):231-235.
- [CrossRef] [Google Scholar]
- Chemiluminescence study of commercial type-B gelatines. J. Photochem. Photobiol. A Chem.. 2004;163(3):537-546.
- [CrossRef] [Google Scholar]
- Gelatin-polysaccharide composite scaffolds for 3D cell culture and tissue engineering: Towards natural therapeutics. Bioeng. Transl. Med.. 2019;4(1):96-115.
- [CrossRef] [Google Scholar]
- Investigation of the absorption coefficient, refractive index, energy GaN by optical transmission method. J. Nanoelectron. Mater.. 2009;2:189-195.
- [Google Scholar]
- Improved optical, electrical, and thermal properties of bio-inspired gelatin/SWCNT composite. AIP Adv.. 2022;12(4)
- [CrossRef] [Google Scholar]
- Alipal, J., Mohd Pu’ad, N. A. S., Lee, T. C., Nayan, N. H. M., Sahari, N., Basri, H., Idris, M. I., & Abdullah, H. Z. (2019). A review of gelatin: Properties, sources, process, applications, and commercialisation. Materials Today: Proceedings, 42, 240–250. https://doi.org/10.1016/j.matpr.2020.12.922.
- On the absorption of infrared radiation by electrons in semiconductor inversion layers. Solid State Commun.. 1993;88(11–12):939-942.
- [CrossRef] [Google Scholar]
- X-ray diffraction – New eyes on the process Luciano Gobbo Harald van Weeren. Cem. Indus. Tech. Conf. 2014:1-9.
- [CrossRef] [Google Scholar]
- Meat shelf-life and extension using collagen/gelatin coatings: A review. Crit. Rev. Food Sci. Nutr.. 2010;50(7):644-653.
- [CrossRef] [Google Scholar]
- Gelatin-based solid electrolytes for chromogenic windows applications: a review. Ionics. 2020;26(12):5841-5851.
- [CrossRef] [Google Scholar]
- Modifying poly(Vinyl Alcohol) (PVA) from insulator to small-bandgap polymer: A novel approach for organic solar cells and optoelectronic devices. J. Electron. Mater.. 2016;45(1):736-745.
- [CrossRef] [Google Scholar]
- A comprehensive review on optical properties of polymer electrolytes and composites. Materials. 2020;13(17)
- [CrossRef] [Google Scholar]
- Synthesis of pva/ceo2 based nanocomposites with tuned refractive index and reduced absorption edge: Structural and optical studies. Materials. 2021;14(6)
- [CrossRef] [Google Scholar]
- Novel synthesis of plasmonic Ag/AgCl@TiO2 continues fibers with enhanced broadband photocatalytic performance. Catalysts. 2017;7(4)
- [CrossRef] [Google Scholar]
- A new low band gap electrochromic polymer containing 2,5-bis-dithienyl-1H- pyrrole and 2,1,3-benzoselenadiazole moiety with high contrast ratio. Polymer. 2011;52(25):5772-5779.
- [CrossRef] [Google Scholar]
- Hydration structure of a collagen peptide. Structure. 1995;3(9):893-906.
- [CrossRef] [Google Scholar]
- Measurements of the chemical characteristics of polymers and rubbers by vibrational spectroscopy. Handbk. Vib. Spectrosc. 2001
- [CrossRef] [Google Scholar]
- Bommalapura Hanumaiah, A., Al-Gunaid, M. Q. A., & Siddaramaiah. (2021). Performance of nano-K-doped zirconate on modified opto-electrical and electrochemical properties of gelatin biopolymer nanocomposites. Polymer Bulletin, 78(6), 3023–3041. https://doi.org/10.1007/s00289-020-03251-y.
- Piecing together the puzzle: Understanding a mild, metal free reduction method for the large scale synthesis of hydrazines. Tetrahedron. 2011;67(52):10296-10303.
- [CrossRef] [Google Scholar]
- From green remediation to polymer hybrid fabrication with improved optical band gaps. Int. J. Mol. Sci.. 2019;20(16)
- [CrossRef] [Google Scholar]
- Green coordination chemistry as a novel approach to fabricate polymer:Cd(II)-complex composites: Structural and optical properties. Opt. Mater.. 2021;116(April):111062
- [CrossRef] [Google Scholar]
- Nanofibers of gelatin and polivinyl-alcohol-chitosan for wound dressing application: fabrication and characterization. Polimeros. 2020;30(1):1-11.
- [CrossRef] [Google Scholar]
- Preparation and physical properties of soy protein isolate and gelatin composite films. Food Hydrocoll.. 2007;21(7):1153-1162.
- [CrossRef] [Google Scholar]
- Highly transparent chitin nanofiber/gelatin nanocomposite with enhanced mechanical properties. Cellul.. 2018;25(9):5063-5070.
- [CrossRef] [Google Scholar]
- Influence of extraction variables on the structure and physical properties of salmon gelatin. Food Hydrocoll.. 2017;71:118-128.
- [CrossRef] [Google Scholar]
- Zinc oxide nanorods/clove essential oil incorporated Type B gelatin composite films and its applicability for shrimp packaging. Food Packag. Shelf Life. 2018;15(June):113-121.
- [CrossRef] [Google Scholar]
- Structural and optical properties of nano-spin coated sol-gel porous TiO2 films. Trans. Nonferrous Metals Soc. China (Engl. Ed.). 2012;22(12):3003-3011.
- [CrossRef] [Google Scholar]
- Physical and mechanical properties of gelatin-CMC composite films under the influence of electrostatic interactions. Int. J. Biol. Macromol.. 2018;114:1-9.
- [CrossRef] [Google Scholar]
- Synthesis and optical properties of silver nanoparticles and arrays. ChemPhysChem. 2005;6(7):1221-1231.
- [CrossRef] [Google Scholar]
- Preparation of chitosan-stabilized Fe0 nanoparticles for removal of hexavalent chromium in water. Sci. Total Environ.. 2009;407(18):4994-5000.
- [CrossRef] [Google Scholar]
- Effect of fructose and ascorbic acid on the performance of cross-linked fish gelatin films. Polymers. 2020;12(3):1-11.
- [CrossRef] [Google Scholar]
- Hanumaiah Anupama, B., AL-Gunaid, M. Q. A., Shivanna Shasikala, B., Theranya Ereppa, S., Kavya, R., Hatna Siddaramaiah, B., & Sangameshwara Madhukar, B. (2022). Poly (o-anisidine) Encapsulated K2ZrO3 Nano-core based Gelatin Nano Composites: Investigations of Optical, Thermal, Microcrystalline and Morphological Characteristics. ChemistrySelect, 7(30), 1–22. https://doi.org/10.1002/slct.202201621.
- Strategy to enhance the sugar production using recyclable inorganic salt for pre-treatment of oil palm empty fruit bunch (OPEFB) BioResources. 2020;15(3):4912-4931.
- [CrossRef] [Google Scholar]
- He, Z., Liu, J., Fan, X., Song, B., Gu, H., Pv, A., & Ag, D. (2022). Supporting Information for Tara Tannin-Crosslinked , Underwater Adhesive , Super Self-Healing and Recyclable Gelatin-Based Conductive Hydrogel as Strain Sensor. 1–6. https://doi.org/https://doi.org/10.1021/acs.iecr.2c03253.
- Fabrication of gelatin-TiO2 nanocomposite film and its structural, antibacterial and physical properties. Int. J. Biol. Macromol.. 2016;84:153-160.
- [CrossRef] [Google Scholar]
- Exploring flow procedures for diazonium formation. Molecules. 2016;21(7)
- [CrossRef] [Google Scholar]
- Degradable gelatin-based IPN cryogel hemostat for rapidly stopping deep noncompressible hemorrhage and simultaneously improving wound healing. Chem. Mater.. 2020;32(15):6595-6610.
- [CrossRef] [Google Scholar]
- Steps toward the band gap identification in polystyrene based solid polymer nanocomposites integrated with tin titanate nanoparticles. Polymers. 2020;12(10):1-21.
- [CrossRef] [Google Scholar]
- Regioselective direct thiocyanation of anilines and phenols using novel hybrid nanocatalyst (MgONPs @ VCA) under visible light induced photoredox catalysis. Mol. Catal.. 2023;547(July):113409
- [CrossRef] [Google Scholar]
- Green nanocomposite: fabrication, characterization, and photocatalytic application of vitamin C adduct-conjugated ZnO nanoparticles. RSC Adv.. 2023;13(15):9963-9977.
- [CrossRef] [Google Scholar]
- Clausal tableaux for hybrid PDL. Electron. Notes Theor. Comput. Sci.. 2011;278(1):99-113.
- [CrossRef] [Google Scholar]
- Fabrication and characterization of chitosan/gelatin/nSiO2 composite scaffold for bone tissue engineering. Int. J. Biol. Macromol.. 2013;59:255-263.
- [CrossRef] [Google Scholar]
- Study of the combined effect of both clay and glycerol plasticizer on the properties of chitosan films. Carbohydr. Polym.. 2010;82(2):291-298.
- [CrossRef] [Google Scholar]
- Effect of tannic acid and cellulose nanocrystals on antioxidant and antimicrobial properties of gelatin films. ACS Sustain. Chem. Eng. 2021
- [CrossRef] [Google Scholar]
- Facile fabrication of gelatin/bentonite composite beads for tunable removal of anionic and cationic dyes. Chem. Eng. Res. Des.. 2018;134:336-346.
- [CrossRef] [Google Scholar]
- 3-O-ethyl-L-ascorbic acid doped enteric-coated gelatin capsules towards the advanced oral curcumin delivery for cancers. Polymers. 2022;14(11)
- [CrossRef] [Google Scholar]
- Application of gelatin in food packaging: A review. Polymers. 2022;14(3)
- [CrossRef] [Google Scholar]
- Development of gelatin/ascorbic acid cryogels for potential use in corneal stromal tissue engineering. Acta Biomater.. 2018;65:123-136.
- [CrossRef] [Google Scholar]
- Synthesis, characterization and optical properties of gelatin doped with silver nanoparticles. Spectrochim. Acta - Part A: Mol. Biomol. Spectrosc.. 2013;116:610-615.
- [CrossRef] [Google Scholar]
- Polarizabilities inside molecular containers. Angew. Chem. - Int. Ed.. 2001;40(23):4387-4390.
- [CrossRef] [Google Scholar]
- Mohamed, M. A., Jaafar, J., Ismail, A. F., Othman, M. H. D., & Rahman, M. A. (2017). Fourier Transform Infrared (FTIR) Spectroscopy. In Membrane Characterization. Elsevier B.V. https://doi.org/10.1016/B978-0-444-63776-5.00001-2.
- Physico-mechanical and structural properties of eggshell membrane gelatin- chitosan blend edible films. Int. J. Biol. Macromol.. 2018;107(PartA):406-412.
- [CrossRef] [Google Scholar]
- Optical properties of semicoundutors. NY: Academic Press; 1959. p. :345-346.
- Controllable synthesis, characterization and optical properties of colloidal PbS/gelatin core-shell nanocrystals. J. Colloid Interface Sci.. 2010;351(2):442-448.
- [CrossRef] [Google Scholar]
- Variation in the optical properties of PEO-based composites via a green metal complex: Macroscopic measurements to explain microscopic quantum transport from the valence band to the conduction band. Polymers. 2023;15(3)
- [CrossRef] [Google Scholar]
- Embedded 3D bioprinting of gelatin methacryloyl-based constructs with highly tunable structural fidelity. ACS Appl. Mater. Interfaces. 2020;12(40):44563-44577.
- [CrossRef] [Google Scholar]
- Synthesis of porous proton ion conducting solid polymer blend electrolytes based on PVA: CS polymers: Structural, morphological and electrochemical properties. Materials. 2020;13(21):1-21.
- [CrossRef] [Google Scholar]
- Application of green technology in gelatin extraction: A review. Processes. 2021;9(12)
- [CrossRef] [Google Scholar]
- Interaction and fragility study in salmon gelatin-oligosaccharide composite films at low moisture conditions. Food Hydrocoll.. 2019;97(June):105207
- [CrossRef] [Google Scholar]
- Synthesis and study of optical properties of linear and hyperbranched conjugated polymers containing thiophene and triphenylamine units. Des. Monomers Polym.. 2014;17(1):7-18.
- [CrossRef] [Google Scholar]
- Facile synthesis of Zr4+ incorporated chitosan/gelatin composite for the sequestration of Chromium(VI) and fluoride from water. Chemosphere. 2021;262:128317
- [CrossRef] [Google Scholar]
- Molecular interactions in gelatin/chitosan composite films. Food Chem.. 2017;235(May):45-50.
- [CrossRef] [Google Scholar]
- Sintering properties of tetragonal zirconia nanopowder preparation of the NaCl + KCl binary system by the sol-gel-flux method. ACS Sustain. Chem. Eng.. 2023;11(3):1067-1077.
- [CrossRef] [Google Scholar]
- Stress transfer quantification in gelatin-matrix natural composites with tunable optical properties. Biomacromolecules. 2015;16(6):1784-1793.
- [CrossRef] [Google Scholar]
- Tumor-promoting activity of p-hydroxybenzenediazonium is accelerated in Mg-deficient rats. Chem. Biol. Interact.. 2006;159(3):186-195.
- [CrossRef] [Google Scholar]
- Measurement modulus of elasticity related to the atomic density of planes in unit cell of crystal lattices. Materials. 2020;13(19):1-17.
- [CrossRef] [Google Scholar]
- A simple preparation of graphite/gelatin composite for electrochemical detection of dopamine. J. Colloid Interface Sci.. 2017;487:149-155.
- [CrossRef] [Google Scholar]
- A comprehensive review on gelatin: Understanding impact of the sources, extraction methods, and modifications on potential packaging applications. Food Packag. Shelf Life. 2022;34(April):100945
- [CrossRef] [Google Scholar]
- Regenstein, J. M., & Zhou, P. (2006). Collagen and gelatin from marine by-products. In Maximising the Value of Marine By-Products. Woodhead Publishing Limited. https://doi.org/10.1533/9781845692087.2.279.
- Correlations between structural, barrier, thermal and mechanical properties of plasticized gelatin films. Innov. Food Sci. Emerg. Technol.. 2010;11(2):369-375.
- [CrossRef] [Google Scholar]
- Adsorption of anionic and cationic dyes from aqueous solution using gelatin-based magnetic nanocomposite beads comprising carboxylic acid functionalized carbon nanotube. Chem. Eng. J.. 2017;308:1133-1144.
- [CrossRef] [Google Scholar]
- Physicochemical and antifungal properties of bio-nanocomposite film based on gelatin-chitin nanoparticles. Int. J. Biol. Macromol.. 2017;97:373-381.
- [CrossRef] [Google Scholar]
- Hybrid gelatin hydrogels in nanomedicine applications. ACS Appl. Bio Mater.. 2021;4(4):2886-2906.
- [CrossRef] [Google Scholar]
- Energy band gap investigation of biomaterials: A comprehensive material approach for biocompatibility of medical electronic devices. Micromachines. 2020;11(1)
- [CrossRef] [Google Scholar]
- Effect of melanin nanoparticles on the mechanical, water vapor barrier, and antioxidant properties of gelatin-based films for food packaging application. Food Packag. Shelf Life. 2019;21(January):100363
- [CrossRef] [Google Scholar]
- Shehap, A. M., Mahmoud, K. H., Abdelkader, M. F. H., & El-basheer, T. M. (2017). Optical properties of gelatin / TGS composites. 2, 103–121.
- Refractive index measurement and its applications. Phys. Scr.. 2002;65(2):167-180.
- [CrossRef] [Google Scholar]
- Comparative study of gelatin hydrogels modified by various cross-linking agents. Materials. 2021;14(2):1-17.
- [CrossRef] [Google Scholar]
- Electronic and optical modeling of solar cell compounds CuGaSe 2 and CuInSe 2. J. Electron. Mater.. 2011;40(11):2197-2208.
- [CrossRef] [Google Scholar]
- Effects of salt and sugar addition on the physicochemical properties and nanostructure of fish gelatin. Food Hydrocoll.. 2015;45:72-82.
- [CrossRef] [Google Scholar]
- Electroconductive gelatin methacryloyl-PEDOT:PSS composite hydrogels: Design, synthesis, and properties. ACS Biomater Sci. Eng.. 2018;4(5):1558-1567.
- [CrossRef] [Google Scholar]
- Infrared spectroscopy: Fundamentals and Applications. Austria: Wiley; 2005.
- Improvement of transparencies and mechanical properties of poly(cyclohexylene dimethylene cyclohexanedicarboxylate) parts using a compounding nucleating agent to control crystallization. Materials. 2019;12(4)
- [CrossRef] [Google Scholar]
- Characterization on the mechanical and physical properties of chicken skin gelatin films in comparison to mammalian gelatin films. IOP Conf. Ser.: Mater. Sci. Eng.. 2018;440(1)
- [CrossRef] [Google Scholar]
- Protein release from gelatin matrices. Adv. Drug Deliv. Rev.. 1998;31(3):287-301.
- [CrossRef] [Google Scholar]
- Optical properties of PVC/Al2O3 nanocomposite films. Polym. Bull.. 2019;76(2):903-918.
- [CrossRef] [Google Scholar]
- Tyuftin, A. A., & Kerry, J. P. (2021). Gelatin films: Study review of barrier properties and implications for future studies employing biopolymer films. Food Packaging and Shelf Life, 29(August 2020), 100688. https://doi.org/10.1016/j.fpsl.2021.100688.
- Adding humic acids to gelatin hydrogels: A way to tune gelation. Biomacromolecules. 2022;23(1):443-453.
- [CrossRef] [Google Scholar]
- Venkatachalam, S. (2016). Ultraviolet and visible spectroscopy studies of nanofillers and their polymer nanocomposites. In Spectroscopy of Polymer Nanocomposites. Elsevier Inc. https://doi.org/10.1016/B978-0-323-40183-8.00006-9.
- Synthesis and bioactivity of gelatin/multiwalled carbon nanotubes/hydroxyapatite nanofibrous scaffolds towards bone tissue engineering. RSC Adv.. 2015;5(66):53550-53558.
- [CrossRef] [Google Scholar]
- One-step in situ fabrication of a granular semi-IPN hydrogel based on chitosan and gelatin for fast and efficient adsorption of Cu2+ ion. Colloids Surf. B Biointerfaces. 2013;106:51-59.
- [CrossRef] [Google Scholar]
- Preparation of dumbbell manganese dioxide/gelatin composites and their application in the removal of lead and cadmium ions. J. Hazard. Mater.. 2018;350(February):46-54.
- [CrossRef] [Google Scholar]
- Facile fabrication of bubbles-enhanced flexible bioaerogels for efficient and recyclable oil adsorption. Chem. Eng. J.. 2020;402:126240
- [CrossRef] [Google Scholar]
- Structural characterization of some table salt samples by XRD, ICP, FTIR and XRF techniques. Acta Phys. Pol. A. 2012;121(1):50-52.
- [CrossRef] [Google Scholar]
- Salt and sugar derived high power carbon microspheres anode with excellent low-potential capacity. Carbon. 2020;163:288-296.
- [CrossRef] [Google Scholar]
- Synthesis, characterization, and application of metal-free sulfonamide-vitamin C adduct to improve the optical properties of PVA polymer. Arab. J. Chem.. 2022;15(10):104096
- [CrossRef] [Google Scholar]
- 3D bioprinting of low-concentration cell-laden gelatin methacrylate (GelMA) bioinks with a two-step cross-linking strategy. ACS Appl. Mater. Interfaces. 2018;10(8):6849-6857.
- [CrossRef] [Google Scholar]
- Yoshioka, H., Mori, Y., Tsukikawa, S., & Kubota, S. (1998). Yoshioka_et_al-1998-Polymers_for_Advanced_Technologies. 9(September 1997), 155–158.
Appendix A
Supplementary material
Supplementary data to this article can be found online at https://doi.org/10.1016/j.arabjc.2023.105541.
Appendix A
Supplementary material
The following are the Supplementary data to this article:Supplementary data 1
Supplementary data 1


