

Translate this page into:
Cytotoxic diterpenoids from the roots of Euphorbia jolkinii Boiss against human pancreatic cancer SW1990 cells by regulating the expressions of Bcl-2, Bax, and Caspase-3 proteins
⁎Corresponding authors. huweiyan2004@163.com (Weiyan Hu), zhrpkm@163.com (Rongping Zhang)
-
Received: ,
Accepted: ,
This article was originally published by Elsevier and was migrated to Scientific Scholar after the change of Publisher.
Abstract
Sixteen undescribed diterpenoids were identified from Euphorbia jolkinii Boiss, a widespread invasive plant in the grassland ecosystem of subalpine meadows in southwest China, through a combination of spectroscopic data analysis. These included two casbane diterpenoids (1 and 2), two ent-atisane diterpenoids (3 and 4), and twelve ent-isopimarane diterpenoids (5–16). All isolates were evaluated the cytotoxicity on pancreatic cancer SW1990 cells in which compounds 1 and 9 exhibited obvious bioactivities against the tumor cells with the IC50 values of 26.50 ± 6.36 and 21.09 ± 5.98 μM respectively. Moreover, compounds 1 and 9 were found to promote the pre-apoptosis of SW1990 cells and regulate the expressions of Bcl-2, Bax, and Caspase-3 proteins to display anti-tumor abilities. Compounds 1 and 9 were subjected to Bcl-2 protein via molecular ducking to reveal their anti-tumor mechanism further. The druggability prediction showed that they possessed good drug properties with development and utilization scenarios.
Keywords
Euphorbia jolkinii Boiss
Diterpenoids
SW1990 cells
Cytotoxicity
Bcl-2

1 Introduction
Grassland ecosystem is an indispensable part of terrestrial ecosystem and an important support for human agricultural production (Guo et al., 2019). A large area of subalpine meadows is distributed in southwest China, which plays an important role in the development of local agriculture (Yang et al., 2019). However, the degradation problems of subalpine meadows in southwest China have occurred due to invasive plants (Feng et al., 2017). Euphorbia jolkinii Boiss, one of the widely distributed invasive plants in this area, is a perennial poisonous plant of Euphorbiaceae family with developing root system, strong cold resistance, drought resistance, and nutrient competition ability (Pharmacopoeia of P.R. China, 1997; Zhao et al., 2012). In recent years, it has been spreading in the degraded alpine meadow, resulting in the disappearances of the excellent herbaceous grasses and the degradations of grasslands which seriously affects the sustainable development of local agriculture and the protection of biodiversity (Niu et al., 2024; Li et al., 2021). Therefore, the preventions and utilizations of E. jolkinii have been become a hot research area.
Pancreatic cancer is one of the most common and highly malignant tumors in digestive system. Its morbidity and mortality are increasing which seriously threatens human health (Siegel et al., 2024; Siegel et al., 2023). Pancreatic cancer is easy to be misdiagnosed due to its hidden onset and the lack of specific manifestations in the early stage (Garg and Chari, 2020; Gupta et al., 2020). Once patients are diagnosed, they are in the advanced stage and difficult to undergo surgical treatment (Neoptolemos et al., 2018; Kunovaky et al., 2018). Thus, chemotherapy is often the preferred treatment strategy for patients with pancreatic cancer. However, the treatment effect of the existing drugs on pancreatic cancer is not good and the prognosis is poor which suggests that there is an urgent need to develop new drugs for the treatment of pancreatic cancer. Natural products have continually contributed with the treatment of pancreatic cancer by influencing the proteins associated with apoptosis such as Bcl-2, Bax, and Caspase-3 proteins. Piperine induced the apoptosis of pancreatic cancer cells through the regulation of Caspase-3, Bax, and Bcl-2 proteins (Zhong et al., 2020). The combination of melatonin and gemcitabine could down-regulate the expression of Bcl-2 protein and up-regulate the expression of Bax protein in human pancreatic cancer SW1990 cells to promote the apoptosis and necrosis of pancreatic cancer cells (Xu et al., 2013). The extracts of Armeniaca vulgaris Lam. seeds accelerated the apoptosis of human pancreatic cancer cells by up-regulating the ratios of Bax/Bcl-2 and Caspase-3 expressions (Aamazadeh et al., 2020).
Diterpenoids are the characteristic secondary metabolites of E. jolkinii roots from which ent-atisane diterpenoids, ent-isopimarane diterpenoids, and ent-abietane diterpenoids have been reported (Huang et al., 2014; He et al., 2008). Jolkinolide B, the main abietane diterpenoid obtained from E. jolkinii roots, presented obvious anti-tumor abilities to inhibit the growth of human chronic myeloid leukemia K562, prostate cancer cells LNCaP, and human breast cancer cells MCF-7 (Liu et al., 2002; Luo and Wang, 2006; Xu et al., 2013). But the cytotoxic effects of the diterpenoids from E. jolkinii roots on pancreatic cancer cells were unclear yet. Our research group has long been committed to discovery cytotoxic diterpenoids against pancreatic cancer cells. We have found that the diterpenoids isolated from Tripterygium hypoglaucum could kill the pancreatic cancer SW1990 cells by increasing the expression of Bax protein (Chen et al., 2022) which suggested us that diterpenoids were important sources to develop anti-pancreatic cancer drugs. Thus, it was possible to find cytotoxic diterpenoids against pancreatic cancer cells from E. jolkinii that promoted the utilization of E. jolkinii.
In this paper, the cytotoxic diterpenoids against pancreatic cancer cells from E. jolkinii roots were studied. As a result, sixteen undescribed diterpenoids were identified by a combination of spectroscopic data analysis and quantum-chemical electronic circular dichroism (ECD) calculations including two casbane diterpenoids, two ent-atisane diterpenoids, and twelve ent-isopimarane diterpenoids (Fig. 1). They were all evaluated the cytotoxicity on pancreatic cancer SW1990 cells in which compounds 1 and 9 exhibited obvious bioactivities against the tumor cells. 1 and 9 could regulate the expressions of apoptosis proteins, such as Bcl-2, Bax, and Caspase-3 proteins to display anti-tumor abilities. And we also evaluated their effects on the growth cycle of tumor cells and subjected them to the target protein via molecular ducking to reveal their anti-tumor mechanism and drug properties. Herein, we reported the isolation, structural illumination, and cytotoxicity on pancreatic cancer SW1990 cells of these diterpenoids from E. jolkinii roots.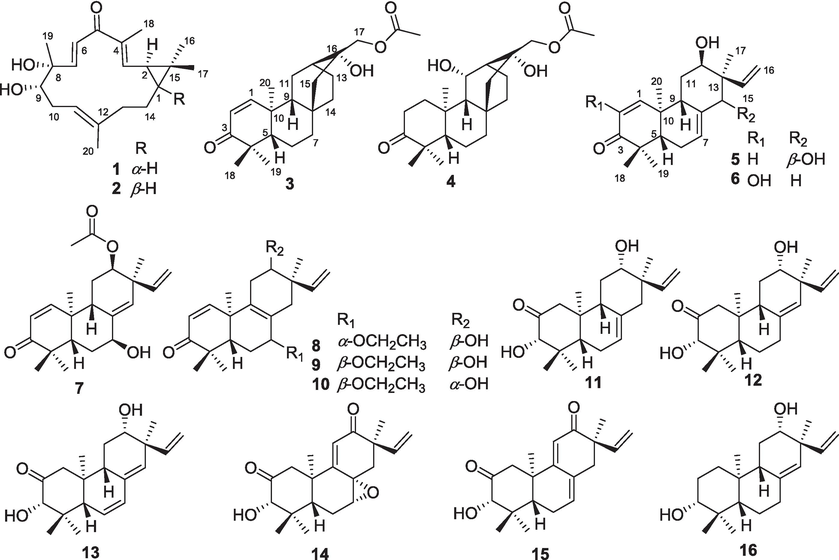
The chemical structures of compounds 1–16.
2 Materials and methods
2.1 General experimental procedures
The high-resolution mass spectra were detected on LC-MS-IT-TOF (Shimaduz, Japan) and Agilent LC-MS-Q-TOF G6530 (Agilent Technologies, Santa Clara, USA). NMR data were conducted with a Brucker Advance III-600 spectrometer (Brucker, Massachusetts, USA) using tetramethylsilane (TMS) as an internal standard. The ultraviolet (UV) spectra were measured on a UV-2401 UV spectrometer (Shimadzu, Kyoto, Japan) and the electronic circular dichroism (ECD) spectra were recorded using a Chirascan instrument (Applied Photophysics, Surrey, UK). Infrared (IR) spectra were performed using KBr lithography on a NICOLET iS10 infrared spectrometer (Thermo Fisher Scientific Inc, Massachusetts, USA). Optical rotation data (ORD) were collected with Jascomodel 1020 polarimeter (Horiba, Tokyo, Japan). The LC-52 system (Beijing Saipuruisi Technology Co., Ltd., Beijing, China) was employed for high-performance liquid chromatography (HPLC) purifications with a ReproSil-Pur 120 CN column (10 × 250 mm, 5 μm). Silica gel (200–300 mesh, Qingdao Makall group Co. Ltd., Qingdao, China), Sephadex LH-20 (20–50 μm, Amersham Bioscience, Sweden), MCI gel CHP 20P (Mitsubishi Chemical Corporation, Tokyo, Japan), and Rp-C18 column (40–70 μm, Mitsubishi Chemical Corporation, Tokyo, Japan), and thin-layer chromatography plate (GF254, 200 × 200 mm, Liyan Technology Co., Ltd., Kunming, China) were employed for the isolations. The thin layer chromatography (TLC) plate was sprayed with a 10 % H2SO4-EtOH (v/v) solution as a chromogenic agent. Microplate reader (HBS-1096B, DeTie, Nanjing, China) and thermostatic cell incubator (Thermo Forma 3310, Thermo Fisher Scientific Inc, Massachusetts, USA) were used. Fluorescein FITC-labelled Annexin-V, Propidine iodide (PI) and CCK-8 kit were obtained form BD Pharmingen, San Diego, USA. Paclitaxel (HPLC ≥ 98 %) was purchased from Liyan Technology Co., Ltd., Kunming, China. Primary antibodies against Bcl-2 (ab194583, abcam), Bax (ab32503, abcam), Caspase-3 (ab184787, abcam), β-actin (ab8226, abcam) were were purchased from Abcam Co. Ltd., Cambridge, UK. Human pancreatic cancer cells (SW1990) were obtained from the Kunming Cell Bank of the Typical Culture Preservation Committee of the Chinese Academy of Sciences.
2.2 Plant materials
The roots of Euphorbia jolkinii Boiss were collected in Shangri-la county, Yunnan province, in August 2020 and authenticated by Prof. Lu Lu (Kunming Medical University). A voucher specimen (No. 2020-0812) was deposited in Yunnan Key Laboratory of Southern Medicine Utilization.
2.3 Extraction and isolation
30.0 Kg of E. jolkinii roots were smashed and extracted with MeOH (3 × 150 L) for three times at room temperature. The combined methanol extracts were suspended in H2O and extracted with ethyl acetate to obtain the EtOAc part (1.5 kg). Then the EtOAc fraction was fractionated by D101 macroporous resin column using an EtOH-H2O gradient system (30:70, 50:50, 70:30, and 90:10, v/v) to afford four fractions (Fr.1–Fr.4).
Fr.3 (480 g) was subjected to MCI column chromatography (CC) and eluted with a gradient system of MeOH-H2O (50:50–90:10, v/v) to give four fractions, Fr.3-1–Fr.3-4. Fr.3-2 (95.6 g) was subjected to silica gel CC eluting with a CH2Cl2-EtOAc gradient system (95:5, 80:20, and 70:30, v/v) to yield five fractions, Fr.3-2-1–Fr.3-2-5. Fr. 3-2-2 (15.3 g) was separated on RP-C18 CC and eluted with MeOH-H2O (40:60–80:20, v/v) to afford four fractions, Fr.3-2-2-1–Fr.3-2-2-4. Fr.3-2-2-2 (2.5 g) was chromatographed on Sephadex LH-20 CC washing with MeOH and further separated by the semi-preparative HPLC (MeOH-H2O, 60:40, v/v, λ = 254/210 nm, 3.0 mL/min) to afford compounds 11 (tR = 15 min, 15 mg), 16 (tR = 17 min, 17 mg), 13 (tR = 18 min, 5 mg), and 12 (tR = 21 min, 7 mg). Fr.3-2-2-3 (1.7 g) was subjected to silica gel CC eluting with CH2Cl2-MeOH (98:2 and 95:5, v/v) and then isolated by semi-preparative HPLC (MeCN-H2O, 40:60, v/v, λ = 254/202 nm, 3.0 mL/min) to provide compounds 8 (tR = 16 min, 25 mg), 10 (tR = 18 min, 7 mg), 9 (tR = 19 min, 49 mg), and 7 (tR = 22 min, 8 mg). Fr. 3-2-3 (9.6 g) was isolated by RP-C8 CC eluted with MeOH-H2O (30:70–70:30, v/v) to afford five fractions, Fr.3-2-3-1–Fr.3-2-3-5. Fr.3-2-3-2 (1.1 g) was repeatedly separated on Sephadex LH-20 CC (MeOH) and semi-preparative HPLC (MeCN-H2O, 30:70 → 90:10, v/v, λ = 254/210 nm, 3.0 mL/min) to obtain compounds 5 (tR = 19 min, 21 mg), 6 (tR = 21 min, 28 mg), 14 (tR = 22 min, 5 mg), and 15 (tR = 25 min, 26 mg). Fr. 3-3-3-3 (3.3 g) was fractionated on a Rp-C18 CC (MeOH-H2O, 30:70, 50:50, 70:30, and 90:10, v/v), silica gel CC (petroleum ether-EtOAc, 10:90–70:30, v/v), semi-preparative HPLC with YMC-Pack ODS-A column (MeCN-H2O, 50:50, v/v, λ = 254/210 nm, 3.0 mL/min) to give out compounds 1 (tR = 17 min, 41 mg), 2 (tR = 18 min, 38 mg), 4 (tR = 20 min, 7 mg), and 3 (tR = 22 min, 11 mg).
Jolkiniiol A (1). White solids, C20H30O3, (+)-HR-ESI-MS [M + H]+ m/z 319.2274 (calcd. 319.2268, +1.9 ppm);
− 13.86 (c 0.07, MeOH); UV (MeOH) λmax (log ε) 203 (4.15), 280 (3.84) nm; IR (KBr) νmax 3372, 2926, 1615, 1458, 1386, 1277, 1057, 1022, 988, 902, 871, 615 cm−1; ECD (c 0.35, MeOH) λmax (Δε) 207 (+3.10), 212 (+2.96), 219 (+3.14), 242 (+3.73), 283 (−1.37), 306 (−0.76), 330 (−1.28) nm; 1H and 13C NMR data: see Table 1.
Pos.
1
2
3
4
δC, type
δH (J)
δC, type
δH (J)
δC, type
δH (J)
δC, type
δH (J)
1
33.6, CH
1.15 (1H, overlapped)
38.0, CH
0.53 (1H, br.d, 13.6)
158.5, CH
6.92 (1H, d, 10.1)
39.4, CH2
α: 2.63–2.56 (1H, m)
β: 1.66–1.61 (1H, m)
2
27.0, CH
1.48 (1H, t, 8.6)
32.2, CH
1.13 (1H, overlapped)
125.1, CH
5.81 (1H, d, 10.1)
34.2, CH2
α: 2.63–2.56 (1H, m)
β: 2.41–2.35 (1H, m).
3
143.8, CH
6.26 (1H, d, 9.5)
148.6, CH
5.80 (1H, d, 10.3)
205.2, C
–
218.0, C
–
4
137.8, C
–
132.1, C
–
44.6, C
–
47.7, C
–
5
195.6, C
–
199.4, C
–
53.6, CH
1.63 (1H, m)
56.6, CH
1.31(1H, d, 10.7)
6
128.5, CH
6.42 (1H, d, 16.5)
129.6, CH
6.36 (1H, d, 16.0
19.0, CH2
1.46–1.55 (2H, m)
19.8, CH2
1.56–1.49 (2H, m)
7
147.1, CH
6.63 (1H, d, 16.5)
154.3, CH
6.97 (1H, d, 16.0)
38.6, CH2
α: 1.46–1.48 (1H, m)
β: 1.25–1.29 (1H, m)38.4, CH2
α: 1.42–1.38 (1H, m)
β: 1.16–1.10 (1H, m)
8
75.4, C
–
76.1, C
–
33.4, C
–
34.2, C
–
9
78.7, CH
3.70 (1H, br.s)
78.3, CH
3.82 (1H, br.s)
45.7, CH
1.59–1.61 (1H, m)
55.0, CH
1.45 (1H, d, 10.6)
10
31.7, CH2
2.38–2.42 (2H, m)
31.7, CH2
2.47–2.59 (2H, m)
40.1, C
–
38.2, C
–
11
119.8, CH
5.22 (1H, t, 6.8)
120.7, CH
5.43 (1H, br.s)
22.9, CH2
α: 1.37–1.40 (1H, m)
β: 2.22–2.26 (1H, m)66.9, CH
4.77 (1H, d, 10.3)
12
138.3, C
–
135.2, C
–
32.6, CH
1.84 (1H, t, 2.5)
42.2, CH
1.69 (1H, d, 2.3)
13
39.3, CH2
α: 2.24–2.30 (1H, m)
β: 1.83 (1H, t, 11.4)39.0, CH2
α: 2.28–2.32 (1H, m)
β: 2.07–2.14 (1H, m)23.1, CH2
α: 1.57–1.61 (1H, m)
β: 1.50–154 (1H, m)15.6, CH2
α: 2.06–2.00 (1H, m)
β: 1.42–1.38 (1H, m)
14
25.5, CH2
α: 0.83–0.89 (1H, m)
β: 2.12–2.17 (1H, m)24.4, CH2
α: 1.25 (1H, br.s)
β: 2.07–2.14 (1H, m)27.5, CH2
α: 1.87–1.91 (1H, m)
β: 0.84–0.90 (1H, m)26.3, CH2
α: 1.98–1.94 (1H, m)
β: 0.85–0.79 (1H, m)
15
26.0, C
–
27.1, C
–
52.0, CH2
1.25 (2H, s)
51.9, CH2
α: 1.23–1.21 (1H, m)
β: 1.16–1.10 (1H, m)
16
29.0, CH3
1.18 (3H, s)
21.8, CH3
1.15 (3H, s)
72.7, C
–
72.3, C
–
17
16.1, CH3
1.01 (3H, s)
23.5, CH3
1.08 (3H, s)
70.1, CH2
4.11(1H, d, 11.4)
3.97 (1H, d, 11.4)70.3, CH2
4.10 (1H, d, 11.5)
3.98 (1H, d, 11.5)
18
12.3, CH3
1.90 (3H, s)
12.8, CH3
1.88 (3H, s)
27.5, CH3
1.14 (3H, s)
26.7, CH3
1.06 (3H, s)
19
24.8, CH3
1.33 (3H, s)
24.7, CH3
1.28 (3H, s)
21.6, CH3
1.08 (3H, s)
21.5, CH3
1.04 (3H, s)
20
15.6, CH3
1.61 (3H, s)
14.1, CH3
0.62 (3H, s)
17.5, CH3
1.23 (3H, s)
16.6, CH3
1.37 (3H, s)
—COCH3
171.1, C
–
171.2, C
–
—COCH3
20.9, CH3
2.11 (3H, s)
20.9, CH3
2.10 (3H, s)
Jolkiniiol B (2). White solids, C20H30O3, (−)-HR-ESI-MS [M + Cl]− m/z 353.1884 (calcd. 353.1889, −1.3 ppm); + 11.08 (c 0.10, MeOH); UV (MeOH) λmax (log ε) 203 (3.75), 284 (3.43) nm; IR (KBr) νmax 3419, 2924, 1639, 1454, 1379, 1278, 1152, 1094, 1055, 884, 721 cm−1; ECD (c 0.50, MeOH) λmax (Δε) 228 (+0.26), 247 (+1.27), 266 (+0.77), 287 (+1.14), 334 (−1.66) nm; 1H and 13C NMR data: see Table 1.
Jolkiniiol C (3). White solids, C22H32O4, (+)-HR-ESI-MS [M + H]+ m/z 361.2389 (calcd. 361.2373, +4.0 ppm); − 46.80 (c 0.10, MeOH); UV (MeOH) λmax (log ε) 228 (3.96) nm; IR (KBr) νmax 3444, 2936, 1739, 1667, 1448, 1386, 1237, 1040, 918, 828, 585 cm−1; ECD (c 0.33, MeOH), λmax (Δε) 207 (+5.08), 236 (−9.30), 342 (+2.08) nm; 1H and 13C NMR data: see Table 1.
Jolkiniiol D (4). White solids, C22H34O5, (−)-HR-ESI-MS [M + HCOO]− m/z 423.2378 (calcd. 423.2388, −2.2 ppm); − 6.48 (c 0.05, MeOH); UV (MeOH) λmax (log ε) 202 (2.97), 265 (2.04) nm; IR (KBr) νmax 3432, 2931, 1702, 1449, 1384, 1250, 1051 cm−1; ECD (c 0.50, MeOH) λmax (Δε) 211 (+0.31) nm; 1H and 13C NMR data: see Table 1.
Jolkiniiol E (5). White solids, C20H28O3, (+)-HR-ESI-MS [M + H]+ m/z 317.2112 (calcd. 317.2111, +0.7 ppm);
+ 10.72 (c 0.05, MeOH); UV (MeOH) λmax (log ε) 202 (3.60), 224 (3.52) nm; IR (KBr) νmax 3431, 2928, 1671, 1382, 1273, 1004, 830, 580 cm−1; ECD (c 0.50, MeOH) λmax (Δε) 210 (+3.61), 242 (−0.28) nm, 355 (+0.34); 1H and 13C NMR data: see Table 2.
Pos.
5
6
7
8
δC, type
δH (J)
δC, type
δH (J)
δC, type
δH (J)
δC, type
δH (J)
1
154.0, CH
6.92 (1H, d, 10.2)
123.6, CH
6.21 (1H, s)
154.9, CH
6.95 (1H, d, 10.2)
154.8, CH
7.17 (1H, d, 10.3)
2
125.7, CH
5.93 (1H, d, 10.2)
143.6, C
–
126.9, CH
5.95 (1H, d, 10.2)
126.7, CH
5.91(1H, d, 10.3)
3
204.2, C
–
200.5, C
–
204.5, C
–
204.2, C
–
4
43.9, C
–
43.4, C
–
44.0, C
–
44.1, C
–
5
47.8, CH
1.98 (1H, dd, 11.0/5.1)
48.0, CH
1.85 (1H, dd, 11.8/3.7)
43.9, CH
2.46 (1H, dd, 10.9/2.4)
46.2, CH
1.96 (1H, overlapped)
6
22.9, CH2
2.14 (2H, m)
22.7, CH2
α: 1.98–2.00 (1H, m)
β: 2.07–2.12 (1H, m)29.2, CH2
α: 1.85–1.90 (1H, m)
β: 1.79 (1H, td, 14.2/2.3)25.9, CH2
α: 1.65–1.71 (1H, m)
β: 2.17 (1H, dd, 11.8/7.6)
7
127.7, CH
5.88 (1H, br.s)
122.6, CH
5.51 (1H, d, 4.9)
72.2, CH
4.40 (1H, br.s)
78.9, CH
3.83 (1H, t, 7.0)
8
136.8, C
–
133.4, C
–
138.2, C
–
128.8, C
–
9
37.7, CH
2.71 (1H, d, 11.5)
47.6, CH
2.07–2.12 (1H, m)
39.9, CH
2.60 (1H, t, 6.3)
135.0, C
–
10
36.8, C
–
36.3, C
–
40.8, C
–
40.8, C
–
11
27.1, CH2
α: 1.78 (1H, td, 13.5/2.3)
β: 2.03–2.06 (1H, m)27.3, CH2
α: 1.42–1.48 (1H, m)
β: 1.92–1.96 (1H, m)23.5, CH2
α: 1.93–1.98 (1H, m)
β: 1.85–1.90 (1H, m)32.0, CH2
α: 2.45(1H, dd, 16.7/5.2)
β: 2.01 (1H, overlapped)
12
74.5, CH
3.98 (1H, br.s)
73.8, CH
3.53 (1H, dd, 11.5/4.2)
75.2, CH
4.88 (1H, dd, 8.7/3.4)
73.9, CH
3.62 (1H, dd, 9.6/5.4)
13
43.6, C
–
42.7, C
–
41.3, C
–
40.2, C
–
14
81.7, CH
3.96 (1H, s)
45.5, CH2
2.02–2.04 (2H, m)
132.4, CH
5.60 (1H, s)
38.8, CH2
α: 2.32 (1H, d, 18.5)
β: 1.97 (1H, overlapped)
15
142.7, CH
6.30 (1H, dd, 17.8, 11.0)
146.1, CH
5.75 (1H, dd, 17.5, 10.8)
141.4, CH
5.82 (1H, dd, 17.4/10.6)
140.0, CH
5.84(1H, dd, 17.6/10.9)
16
114.4, CH2
5.34 (1H, d, 17.8)
5.29 (1H, d, 11.0)114.5, CH2
5.16 (2H, t, 14.9)
115.0, CH2
5.14 (1H, d, 10.6)
5.00 (1H, d, 17.4)115.1, CH2
5.15 (1H, d, 10.9)
5.05 (1H, d, 17.6)
17
22.1, CH3
0.88 (3H, s)
13.7, CH3
0.91 (3H, s)
25.6, CH3
1.15 (3H, s)
23.7, CH3
1.15 (3H, s)
18
25.0, CH3
1.16 (3H, s)
25.3, CH3
1.20 (3H, s)
26.6, CH3
1.18 (3H, s)
26.6, CH3
1.17 (3H, s)
19
22.8, CH3
1.13 (3H, s)
22.4, CH3
1.16 (3H, s)
21.9, CH3
1.09 (3H, s)
21.4, CH3
1.11 (3H, s)
20
14.6, CH3
1.08 (3H, s)
15.8, CH3
1.11 (3H, s)
16.0, CH3
1.08 (3H, s)
24.1, CH3
1.27 (3H, s)
—COCH3
170.8, C
–
—COCH3
21.2, CH3
2.03 (3H, s)
—OCH2CH3
64.3, CH2
3.71 (1H, dq, 14.0/7.0)
3.46 (1H, dq, 14.1/7.0)
—OCH2CH3
15.7, CH3
1.24 (3H, t, 7.0)
Jolkiniiol F (6). White solids, C20H28O3, HR-ESI-MS [M + H]+ m/z 317.2115 (calcd. 317.2111, +0.9 ppm); + 20.96 (c 0.06, MeOH); UV (MeOH) λmax (log ε) 203 (3.92), 267 (3.80) nm; IR (KBr) νmax 3410, 2971, 1647, 1410, 1221, 1059, 915, 643 cm−1; ECD (c 0.30, MeOH) λmax (Δε) 202 (+5.92), 224 (+0.60), 245 (+0.90), 285(−0.12), 332 (+0.54) nm; 1H and 13C NMR data: see Table 2.
Jolkiniiol G (7). White solids, C22H30O4, (+)-HR-ESI-MS [M + H]+ m/z 359.2208 (calcd. 359.2217, −2.5 ppm); + 5.17 (c 0.06, MeOH); UV (MeOH) λmax (log ε) 202 (3.05), 215 (2.88) nm; IR (KBr) νmax 3439, 2924, 1637, 1383, 1043, 668 cm−1; ECD (c 0.60, MeOH) λmax (Δε) 199 (+1.56), 233 (−0.24), 355 (+0.31) nm; 1H and 13C NMR data: see Table 2.
Jolkiniiol H (8). White solids, C22H32O3, (+)-HR-ESI-MS [M + Na]+ m/z 367.2248 (calcd. 367.2244, +1.0 ppm), − 32.00 (c 0.10, MeOH); UV (MeOH) λmax (log ε) 205 (3.78), 224 (3.81) nm; IR (KBr) νmax 3436, 2971, 1716, 1668, 1455, 1385, 1262, 1064, 830, 581 cm−1; ECD (c 0.43, MeOH) λmax (Δε) 204 (+0.37), 222 (−3.41), 256 (+0.63), 348 (+0.41) nm; 1H and 13C NMR data: see Table 2.
Jolkiniiol I (9). White solids, C22H32O3, (+)-HR-ESI-MS [M + H]+ m/z 345.2427 (calcd. 345.2424, +0.6 ppm),
− 25.73 (c 0.09, MeOH); UV (MeOH) λmax (log ε) 203 (3.46), 225 (3.53) nm; IR (KBr) νmax 3435, 2969, 1453, 1384, 1075, 831, 568 cm−1; ECD (c 0.69, MeOH) λmax (Δε) 207 (−1.38), 226 (−4.36), 263 (+0.19), 344 (+0.56) nm; 1H and 13C NMR data: see Table 3.
Pos.
9
10
11
12
δC, type
δH (J)
δC, type
δH (J)
δC, type
δH (J)
δC, type
δH (J)
1
154.6, CH
7.15 (1H, d, 10.3)
154.5, CH
7.19 (1H, d, 10.3)
51.3, CH2
α: 2.57 (1H, d, 12.9)
β: 2.26 (1H, d 12.9)50.9, CH2
α: 2.43 (1H, d, 12.7)
β: 2.29 (1H, d 12.6)
2
127.0, CH
5.91(1H, d, 10.3)
127.0, CH
5.93 (1H, d, 10.2)
210.5, C
–
210.5, C
–
3
204.7, C
–
204.6, C
–
82.3, CH
3.93(1H, s)
82.5, CH
3.96 (1H, d)
4
43.9, C
–
43.9, C
–
45.0, C
–
45.6, C
–
5
42.5, CH
2.30 (1H, dd, 13.1/1.4)
42.6, CH
2.29 (1H, br.d, 15.3)
50.9, CH
2.16 (1H, d, 12.1)
52.9, CH
1.68 (1H, d, 12.4)
6
23.9, CH2
α: 1.65 (1H, td, 13.7/4.2)
β: 1.93 (1H, d,14.1)24.0, CH2
β: 1.94 (1H, d, 14.3)
α: 1.67 (1H, td, 13.7/4.2)23.3, CH2
1.98–2.06 (2H, m)
21.9, CH2
α: 1.75 (1H, dd, 13.1/2.7)
β: 1.44–1.48 (1H, m)
7
74.8, CH
3.50 (1H, d, 2.4)
74.6, CH
3.50 (1H, br.s)
122.3, CH
5.44 (1H, s)
34.2, CH2
α: 2.43 (1H, d, 12.7)
β: 2.13 (1H, td, 12.6/4.9)
8
128.0, C
–
128.0, C
–
133.2, C
–
136.3, C
–
9
134.7, C
–
134.7, C
–
48.8, CH
1.77 (1H, dd, 11.4/4.1)
51.9, CH
2.24 (1H, t, 9.4)
10
40.9, C
–
41.1, C
–
42.4, C
–
44.4, C
–
11
31.5, CH2
α: 2.43 (1H, dd, 16.6/5.0)
β: 2.03 (1H, dd, 15.9/10.4)29.2, CH2
α: 2.10–2.17 (1H, m)
β: 2.49 (1H, dd, 17.0/5.5)27.4, CH2
α: 1.35 (1H, t, 12.2)
β: 1.65 (1H, dd, 11.4/5.2)28.4, CH2
α: 1.39–1.40 (1H, m)
β: 1.60 (1H, overlapped)
12
74.4, CH
3.58 (1H, td, 9.3/7.1)
72.0, CH
3.60–3.66 (1H, m)
73.7, CH
3.50 (1H, dd, 11.5/3.7)
75.5, CH
3.46 (1H, d, 11.8)
13
40.3, C
–
40.9, C
–
42.0, C
–
43.9, C
–
14
39.6, CH2
α: 1.88 (1H, d, 17.5)
β: 2.53 (1H, d, 17.3)40.3, CH2
α: 2.29 (1H, d, 17.5)
β: 1.98 (1H, d, 17.7)44.9, CH2
1.98–2.06 (2H, m)
128.6, CH
5.12 (1H, s)
15
139.8, CH
5.87 (1H, dd, 17.6/10.9)
145.7, CH
5.78 (1H, dd, 17.3/10.8)
146.6, CH
5.73 (1H, dd, 17.5/10.8)
141.4, CH
5.87 (1H, dd, 17.5/10.6)
16
115.6, CH2
5.17 (2H, t, 13.5)
115.2, CH2
5.21 (2H, t, 13.4)
114.4, CH2
5.08–5.17 (2H, m)
117.0, CH2
5.21 (1H, d, 10.6)
5.07 (1H, d, 17.5)
17
23.8, CH3
1.14 (3H, s)
14.4, CH3
0.98 (3H, s)
13.6, CH3
0.84 (3H, s)
24.9, CH3
1.15 (3H, s)
18
26.8, CH3
1.17 (3H, s)
26.8, CH3
1.17 (3H, s)
28.5, CH3
1.13 (3H, s)
29.7, CH3
1.25 (3H, s)
19
21.5, CH3
1.11 (3H, s)
21.5, CH3
1.12 (3H, s)
16.3, CH3
0.74 (3H, s)
16.6, CH3
0.70 (3H, s)
20
23.0, CH3
1.16 (3H, s)
23.0, CH3
1.17 (3H, s)
15.4, CH3
0.88 (3H, s)
15.0, CH3
0.78 (3H, s)
—OCH2CH3
64.8, CH2
3.65 (1H, dq, 14.1/7.0)
3.41 (1H, dq, 14.1/7.0)64.8, CH2
3.60–3.66 (1H, m)
3.34–3.43 (1H, m)
—OCH2CH3
15.0, CH3
1.20 (3H, t, 7.0)
15.6, CH3
1.19 (3H, t, 7.0)
Jolkiniiol J (10). White solids, C22H32O3, (+)-HR-ESI-MS [M + H]+ m/z 345.2433 (calcd. 345.2424, +2.5 ppm); − 10.00 (c 0.10, MeOH); UV (MeOH) λmax(log ε) 201 (2.02) nm; IR (KBr) νmax 3437, 2923, 1637, 1383, 1047, 373 cm−1; ECD (c 1.00, MeOH) λmax (Δε) 225 (−0.27), 355 (+0.39); 1H and 13C NMR data: see Table 3.
Jolkiniiol K (11). White solids, C20H30O3, (+)-HR-ESI-MS [M + H]+ m/z 319.2270 (calcd. 319.2268, +0.6 ppm); + 10.80 (c 0.10, MeOH); UV (MeOH) λmax (log ε) 203 (3.65), 238 (2.83) nm; IR (KBr) νmax 3434, 2970, 1716, 1636, 1390, 1111, 1058, 921, 587 cm−1; ECD (c 0.33, MeOH) λmax (Δε) 226 (+0.15), 248 (+0.42) nm; 1H and 13C NMR data: see Table 3.
Jolkiniiol L (12). White solids, C20H30O3, (+)-HR-ESI-MS [M + H]+ m/z 319.2270 (calcd. 319.2268, +0.6 ppm); − 56.32 (c 0.10, MeOH); UV (MeOH) λmax (log ε) 204 (3.96), 239 (3.27) nm; IR (KBr) νmax 3456, 2954, 1701, 1388, 1280, 1117, 1055, 926, 657 cm−1; ECD (c 0.33, MeOH) λmax (Δε) 229 (+0.65), 289 (−0.56) nm; 1H and 13C NMR data: see Table 3.
Jolkiniiol M (13). White solids, C20H28O3, (+)-HR-ESI-MS [M + Na]+ m/z m/z 339.1932 (calcd. 339.1931, +0.3 ppm);
+ 8.04 (c 0.05, MeOH); UV (MeOH) λmax (log ε) 200 (3.20), 240 (3.47) nm; IR (KBr) νmax 3432, 2968, 2927, 1714, 1634, 1386, 1064, 596 cm−1; ECD (c 0.50, MeOH) λmax (Δε) 205 (+0.21), 235 (+0.79) nm; 1H and 13C NMR data: see Table 4.
Pos.
13
14
15
16
δC, type
δH (J)
δC, type
δH (J)
δC, type
δH (J)
δC, type
δH (J)
1
49.7, CH2
α: 2.52 (1H, d, 12.6)
β: 2.34 (1H, d 12.4)50.2, CH2
α: 2.70 (1H, d, 12.3)
β: 2.54 (1H, s, 12.4)48.9, CH2
α: 2.69 (1H, d, 12.6)
β: 2.61 (1H, s, 13.2)36.8, CH2
α: 1.62 (1H, m)
β: 1.14–1.18 (m)
2
210.2, C
–
208.8, C
–
209.5, C
–
26.1, CH2
1.62 (2H, m)
3
82.6, CH
3.96 (1H, d, 2.4)
81.9, CH
3.91 (1H, s)
82.0, CH
3.96 (1H, d, 1.1)
79.0, CH
3.26 (d, J = 9.1 Hz, 1H)
4
44.5, C
–
44.8, C
–
44.9, C
–
39.0, C
–
5
53.4, CH
2.65 (1H, s)
47.5, CH
1.89 (1H,dd, 13.0/5.4)
46.3, CH
1.99 (1H, dd, 11.4/4.6)
54.2, CH
1.08 (0)
6
126.1, CH
5.68 (1H, d, 9.3)
21.7, CH2
α: 2.14 (1H, d, 13.1)
β: 2.29 (1H, dt, 15.4/5.7)22.5, CH2
α: 2.32–2.24 (1H, m)
β: 2.47 (1H, dt, 19.1/4.4)22.2, CH2
α: 1.62 (m)
β: 1.40–1.44 (m)
7
130.7, CH
6.12 (1H, d, 7.4)
60.1, CH
3.47 (1H, d, 6.0)
130.8, CH
6.11 (1H, d, 3.1)
35.4, CH2
α: 2.09 (td, J = 13.6/4.5 Hz, 1H)
β: 2.36 (dd, J = 14.3/2.5 Hz)
8
133.5, C
–
54.9, C
–
129.4, C
–
138.1, C
–
9
49.8, CH
2.55 (1H, overlapped)
163.0, C
–
163.1, C
–
46.3, CH
1.84 (t, J = 8.3 Hz, 1H)
10
42.8, C
–
44.0, C
–
43.0, C
–
38.2, C
–
11
26.3, CH2
α: 1.53 (1H, overlapped)
β: 1.67–1.70 (1H, m)125.0, CH
5.93 (1H, s)
117.6, CH
5.59 (1H, s)
27.5, CH2
1.62 (2H, m)
12
73.3, CH
3.72 (1H, d, 11.1)
202.1, C
–
201.6, C
–
72.8, CH
3.64 (s, 1H)
13
44.1, C
–
47.7, C
–
48.7, C
–
43.8, C
–
14
133.3, CH
5.34 (1H, s)
41.3, CH2
α: 1.63 (1H, s)
β: 2.56 (1H, d, 3.4)43.6, CH2
α: 2.61 (1H, d, 13.2)
β: 2.55 (1H, 14.3)124.6, CH
5.07 (s, 1H)
15
145.0, CH
5.83 (1H, dd, 17.4/10.7)
140.8, CH
6.14 (1H, dd, 17.6/10.8)
140.0, CH
5.82 (1H, dd, 17.5/10.7)
146.2, CH
5.74 (dd, J = 17.0/10.7 Hz, 1H)
16
114.3, CH2
5.15 (2H, dd, 13.9/11.3)
114.0, CH2
5.19 (1H, d, 10.8)
5.07 (1H, d, 17.6)114.9, CH2
5.07 (1H, d, 10.7)
5.05 (1H, d, 17.5)114.1, CH2
5.02 (d, J = 6.4 Hz, 1H)
5.00 (s, 1H)
17
18.6, CH3
1.09 (3H, s)
23.7, CH3
1.37 (3H, s)
22.5, CH3
1.21 (3H, s)
23.5, CH3
1.08 (s, 3H)
18
28.8, CH3
1.26 (3H, s)
28.5, CH3
1.21 (3H, s)
27.9, CH3
1.19 (3H, s)
28.5, CH3
1.02 (s, 3H)
19
16.9, CH3
0.73 (3H, s)
15.9, CH3
0.75 (3H, s)
16.2, CH3
0.80 (3H, s)
15.7, CH3
0.82 (s, 3H)
20
14.1, CH3
0.72 (3H, s)
23.0, CH3
1.17 (3H, s)
21.3, CH3
1.04 (3H, s)
14.7, CH3
0.75 (s, 3H)
Jolkiniiol N (14). White solids, C20H26O4, (+)-HR-ESI-MS [M + H]+ m/z 331.1915 (calcd. 331.1904, +1.4 ppm); + 3.84 (c 0.05, MeOH); UV (MeOH) λmax (log ε) 202 (3.01), 215 (2.94), 238 (2.88) nm; IR (KBr) νmax 3433, 2927, 1718, 1668, 1383, 1113, 585 cm−1; ECD(c 0.50,MeOH)λmax (Δε) 221 (+0.36), 249 (+0.10) nm; 1H and 13C NMR data: see Table 4.
Jolkiniiol O (15), white solids, C20H26O3, (+)-HR-ESI-MS [M + H]+ m/z 315.1960 (calcd. 315.1955, +1.3 ppm); + 98.40 (c 0.15, MeOH); UV (MeOH) λmax (log ε) 202 (3.85), 229 (3.79), 290 (3.79) nm; IR (KBr) νmax 3437, 2972, 1719, 1669, 1454, 1394, 1264, 1194, 1113, 1070, 928 cm−1; ECD (c 0.45, MeOH) λmax (Δε) 212 (−1.86), 288 (+5.47), 336 (−0.57) nm; 1H and 13C NMR data: see Table 4.
Jolkiniiol P (16). white solids, C20H32O2, (+)-HR-ESI-MS [M + H]+ m/z 305.2462. (calcd. 305.2475, −4.3 ppm); − 21.6 (c 0.05, MeOH); UV (MeOH) λmax (log ε) 204 (3.58) nm; IR (KBr) νmax 3429, 2930, 1719, 1633, 1457, 1385, 1035, 919, 556 cm−1; ECD (c 0.33, MeOH) λmax (Δε) 248 (+0.23) nm; 1H and 13C NMR data: see Table 4.
2.4 Cytotoxicity assay
The cytotoxicity of the compounds was detected by CKK-8 method. Pancreatic cancer cells were cultured in a 5 % carbon dioxide incubator containing at 37 °C. The culture mediums were composed of 89 % DMEM, 10 % fetal bovine serum, and 1 % penicillin–streptomycin solution. The cells were digested with 2 mL trypsin for 2 min when the density of cells on the petri dish was greater than 85 %. And then the cells were added with 4 mL mediums and transferred to a 15 mL centrifuge tube via trypsin for centrifugation. The cells were inoculated into a 96-well plate with 100 μL per well after centrifugation and inoculated continuously for 24 h. Then the cells were treated with the compounds and paclitaxel as positive control. The CCK-8 reagents were diluted ten-fold with DMEM medium 24 h later and the cells were cultivated for 2 h. Finally, the absorbances were measured by a microplate reader at 450 nm. Inhibition ratios were calculated as [Acontrol − Asample]/Acontrol × 100 %. The IC50 values were calculated according to Prism.8 software.
2.5 Flow cytometric analysis
Fluorescein FITC-labelled Annexin-V is applied to label the early apoptotic cells due to its high combining capacity with the phosphatidylserine in early apoptotic cells. Propidine Iodide (PI), a nucleic acid dye, is not permeable to the normal cell membranes. But it can through the membranes of apoptotic cells at middle and late-stage (Wei et al., 2023). Thus, Annexin-V and PI are utilized to detect apoptotic cells to determine the cell cycles. Firstly, the tumor cells were inoculated in 6-well plates at an inoculum density of 2 × 10⁶ cells/well. 24 h later, compounds 1 (13 μM, 26 μM), 9 (11 μM, 22 μM), and positive drug (paclitaxel 45 μM) were added. After 3 h, the cells were transferred to a 5 mL centrifuge tube via trypsin for centrifugation. Then FITC (5 μL) and PI (5 μL) were added sequentially into the cells for the incubation at room temperature of 15 min. Then 400 μL PBS were added to each culture tube, and the cells were subjected to the flow cytometer. The data were analyzed by FlowJo_v10.8.1 software.
2.6 Western blot assay
The Western blot assay was prepared according to our previous report (Chen et al., 2022). The cell culture procedures were similar with cytotoxicity assay. According to the IC50 values, the concentrations of the samples were set as: 2.5 μM, 5 μM, and 10 μM for compound 1, 3 μM, 6 μM, and 12 μM for compound 9 and 20 μM for positive control. The mediums were removed 3 h later. Then the RIPA lysis buffer (protease inhibitor: EDTA = 98:1:1) was added to lyse the cells for 1 h. After the centrifugation at 13,200 rpm × 30 min, the supernatants were collected and 1/3 vol of protein buffer (β-hydrophobic ethanol: 4 × SDS concentrated gel buffer solution = 1:9) were added. The supernatants were subjected to heat denaturation at 95 °C for 5 min and stored at − 20 °C refrigerator. 30 μg proteins were added in SDS-PAGE and electroblotted onto PVDF membrane. The membranes were blocked with 5 % skim milk in TBS-T, and probed with desired antibodies. Super Signal West Dura Extended Duration Substrate (Pierce, Rockford, IL, USA) was used to detect antibody-antigen complexes. The data were collated and analyzed by ChemiScope Analysis and Prism.8 software.
2.7 Molecular docking and druggability prediction
The molecular docking assay was prepared according to our previous report (Yang et al., 2023). The 3D structure of Bcl-2 protein was downloaded from Protein Data Bank (PDB, https://www.rcsb.org). Molecular docking was conducted using Discovery Studio 4.0 software. LibDockScores of compounds with target proteins were used to evaluate their affinity and the docking results were drawn using PyMol software. Discovery Studio 2016 Client software was used to predict the pharmacokinetics of the compounds.
2.8 Statistical analysis
All the data were statistically analyzed by using GraphPad prism 8.0 statistical software and expressed as mean ± standard deviations (SDs). Multiple comparisons between groups were performed using one-way ANOVA, and pairwise comparisons were conducted by independent t-test. In all cases, differences with P < 0.05 were considered statistically significant.
3 Results and discussions
3.1 Structure elucidation
Compound 1 was obtained as white solids with the molecular formula as C20H30O3 which was determined by the (+)-HR-ESI-MS at m/z 319.2274 ([M + H]+ calcd. 319.2268) indicating six unsaturation degrees. The 1H NMR spectrum of 1 exhibited four olefinic protons at δH 5.22 (1H, t, J = 6.8 Hz), 6.26 (1H, d, J = 9.5 Hz), 6.42 (1H, d, J = 16.5 Hz), and 6.63 (1H, d, J = 16.5 Hz) and five methyl signals at δH 1.01 (3H, s), 1.18 (3H, s), 1.33 (3H, s), 1.61 (3H, s), and 1.90 (3H, s) (Table 1). The 13C NMR spectrum presented 20 carbons including five methyls, three methylenes, seven methines, and five quaternary carbons from which a carbonyl unit at δC 195.6 and three double bonds at δC 147.1 (CH), 143.8 (CH), 138.3 (C), 137.8 (C), 128.5 (CH), and 119.8 (CH) were deduced. Thus, the remaining two unsaturation degrees required by the molecular formula of 1 were attributed to two rings. The presence of a quaternary carbon at δC 26.0 (C-15) and a gem-dimethyl functionality at δC 29.0 (C-16)/16.1 (C-17), together with the 1H–1H-COSY correlations between two cyclopropyl protons of H-1 (δH 1.15, overlapped) and H-2 (δH 1.48, t, 8.6), indicated the presence of a substituted cyclopropyl ring (Fig. 2). Consequently, compound 1 was deduced to be a casbane diterpenoid with a 14-membered macrocycle. The 1H–1H-COSY correlations of H-2 and the olefinic proton at δH 6.26 suggested a double bond (δC 143.8 and 137.8) was located between C-3 and C-4. Both of H-3 and H3-18 showed HMBC correlations to the carbonyl unit indicated that C-5 was oxygenated as a carbonyl group. Furthermore, the olefinic proton at δH 6.63 presented 1H–1H-COSY correlations with δH 6.42 and HMBC correlations with C-5 which suggested a disubstituted double bond was posited at C-6 and C-7. The double bond of Δ11(12) was determined by the HMBC cross peaks from H3-20 to δC 119.8 (C-11) and 138.3 (C-12). An oxygenated quaternary carbon and an oxygenated methine were deduced as C-8 (δC 75.4) and C-9 (δC 78.7) respectively via the HMBC correlations of H-6/C-8 and H3-19/C-9. Δ3(4), Δ6(7), and Δ11(12) were all E geometry according to the δC values of CH3-18/CH3-20 (<20 ppm) and the J values of H-6/H-7 (>16 Hz) (Li et al., 2010). The junction of the two rings between C-1 and C-2 was suggested to be cis on the basis of 13C NMR chemical shifts of C-16 (δC 29.0) and C-17 (δC 16.1), analogously with previous cis-fused casbane diterpenoids (Zhang et al., 2005; Li et al., 2010). Two hydroxyls were located at the same side verified by the ROESY correlations of H3-19 and H-9 (Fig. 3). Furthermore, the similarity Cotton effect of the experimental electronic circular dichroism (ECD) spectrum of compound 1 between the calculated ECD spectrum of compounds 1a (1,2-cis-8α,9α-dihydroxyl) (Fig. 4) established compound 1 as (1S,2R,8R,9S)-8,9-diydroxyl-casbane-3,6,11-triene-5-one and named as jolkiniiol A.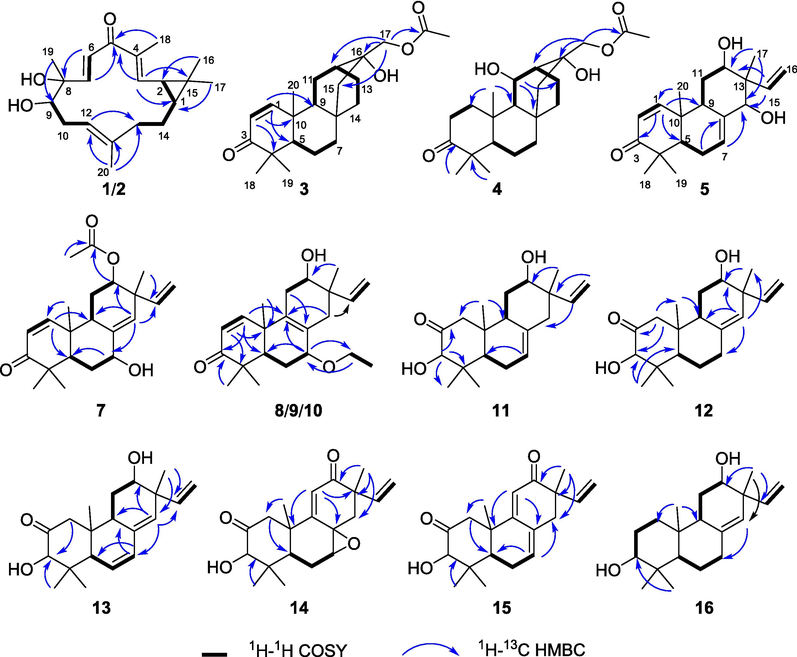
The key 2D NMR of compounds 1–5 and 7–16.
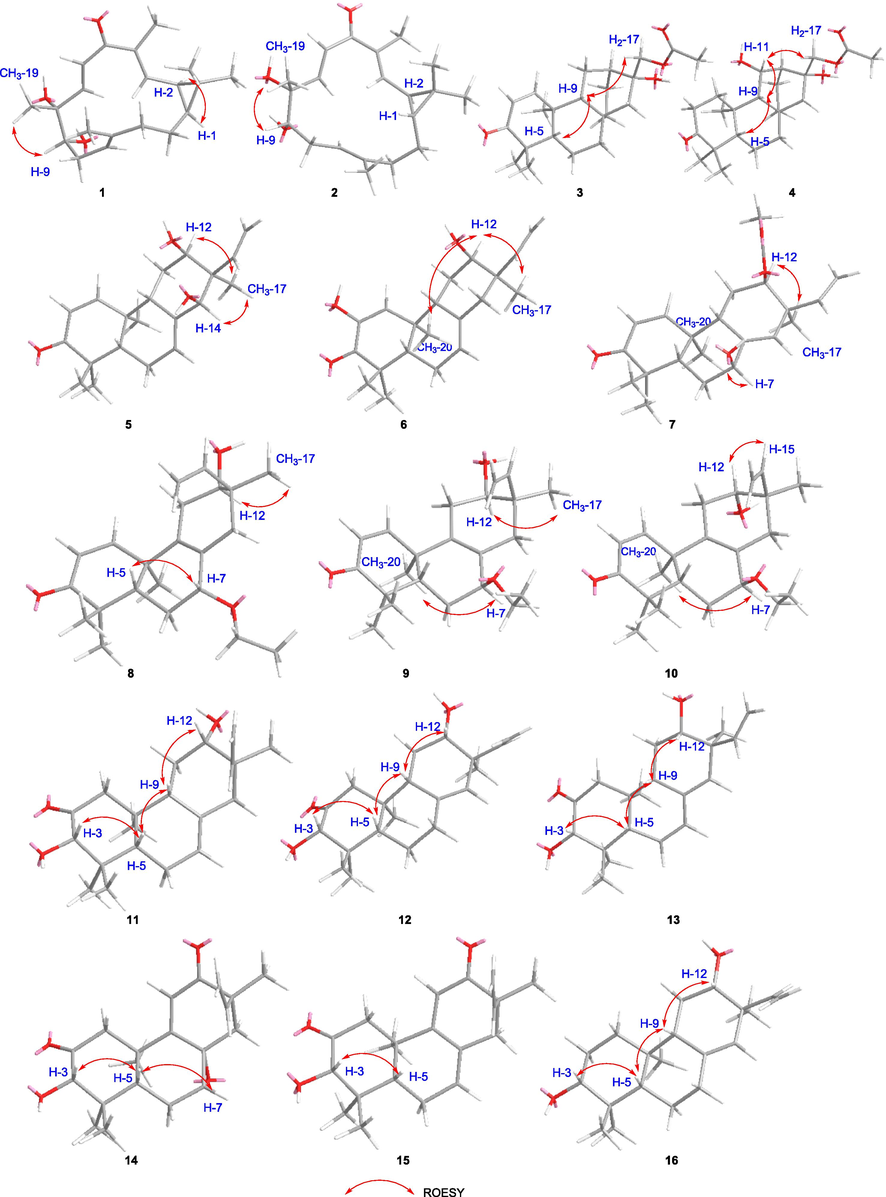
The ROESY correlations of compounds 1–16.
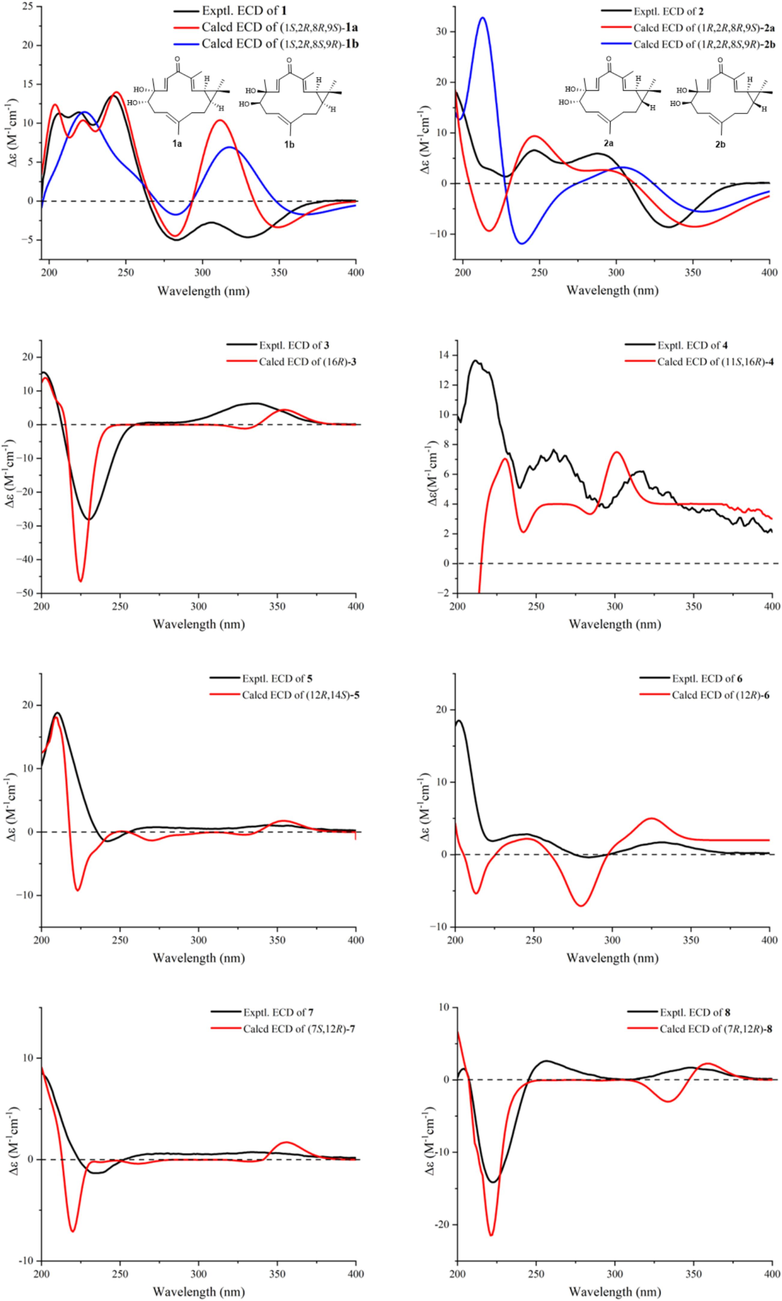
The ECD calculations of compounds 1–16.
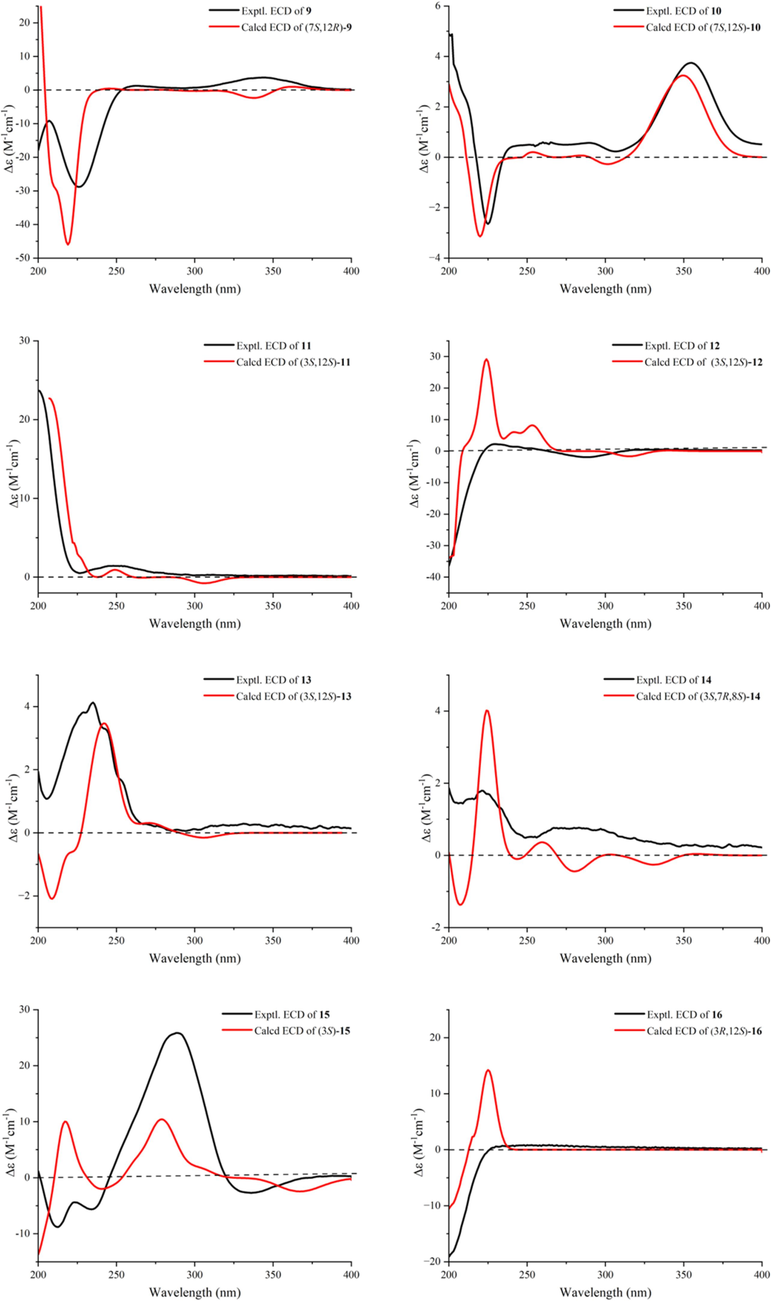
The ECD calculations of compounds 1–16.
The molecular formula of compound 2 was C20H30O3 according to the (−)-HR-ESI-MS at m/z 353.1884 ([M + Cl]−calcd. 353.1889). The NMR data of 2 were similar with those of 1 except for the chemical shifts of C-1 (δC 38.0), C-2 (δC 32.2), C-16 (δC 21.8), and C-17 (δC 23.5) (Table 1) which suggested the trans configuration of C-1 and C-2 on the basis of trans-fused casbane diterpenoids (Li et al., 2010). The two hydroxyls were located at the same side as well by the ROESY correlations of H3-19 and H-9 (Fig. 3). 2a (1,2-trans-8α,9α-dihydroxyl) presented almost the same calculated ECD spectrum with the experimental ECD spectrum of 2 (Fig. 4). So, compound 2 was identified as (1R,2R,8R,9S)-8,9-dihydroxyl-casbane-3,6,11-triene-5-one and named as jolkiniiol B.
Compound 3 was white solids whose molecular formula was C22H32O4 according to the (+)-HR-ESI-MS at m/z 361.2389 ([M + H]+ calcd. 361.2373). Two olefinic hydrogens at δH 6.92 (1H, d, J = 10.1 Hz) and 5.81 (1H, d, J = 10.1 Hz) were observed (Table 1) and were determined as a 1,2-disubstituted double bond by their 1H–1H-COSY correlations (Fig. 2). The 1H NMR spectrum of 3 also afforded four methyl signals at δH 1.08 (3H, s), 1.14 (3H, s), 1.23 (3H, s), and 2.11 (3H, s), and two oxygenated protons at δH 3.97 (1H, d, J = 11.4 Hz) and 4.11 (1H, d, J = 11.4 Hz). In the 13C NMR spectrum, 22 carbons were deduced as four methyls, seven methylenes, five methines, and six quaternary carbons from which two carbonyl units at δC 205.2 and 171.1 were identified. Compared with the know compound, 17-acetoxyl-l6-hydroxyl-ent-atisane-3-one (Awasaki et al., 1987), there was one 1,2-disubstituted double bond in 3. The other NMR data of 3 were similar with those of 17-acetoxyl-16-hydroxyl-ent-atisane-3-one. The HMBC correlatios from δH 6.92 to C-5/C-9 and from δH 5.81 to C-4/C-10 suggested the double bond was located at C-1 and C-2 (Fig. 2). The oxygenated protons displayed HMBC correlations to a carbonyl unit at δC 205.2, an oxygenated quaternary carbon at δC 72.7 (C-16), a methylene at δC 52.0 (C-15), and a methine at δC 32.6 (C-12) which clarified the 17-acetoxyl-16-hydroxyl substituent group of 3. Most of the atisane-type diterpenoids isolated from Euphorbia species were ent-atisane diterpenoids on consideration of biosynthetic pathways (Zhao et al., 2014). Besides, the ROESY correlations of H-5/H-9/H2-17 were found as well that indicated these H-atoms were all located at β configuration (Fig. 3). Finally, the calculated ECD spectrum of 3 exhibited similar Cotton effects with the experimental ECD spectrum of 3 (Fig. 4). So, compound 3 was identified as (16R)-17-acetoxyl-l6-hydroxyl-ent-atisane-1-ene-3-one and named as jolkiniiol C.
Compound 4 afforded the chemical formula of C22H34O5 based on the (−)-HR-ESI-MS at m/z 423.2378 ([M + HCOO]− calcd. 423.2388). Compared with the NMR data of 3, an oxygenated methine at δC 66.9 and δH 4.77 (1H, d, 10.3) (Table 1). At the same time, the absence of the 1,2-disubstituted double bond signal was deduced. On the contrary, two methylenes at δC 39.4 and 34.2 were observed and they were conjugated together due to the 1H–1H-COSY correlations of their protons (Fig. 2). The HMBC correlation of H3-20 to the methylene at 39.4 was observed as well. So, the two methylenes were C-1 and C-2 respectively. The 1H–1H-COSY correlations from H-9 to δH 4.77 suggested that C-11 was an oxygenated methine. The β configuration of H-11 was determined by the ROESY correlations of H-11/H-9/H-5/H2-17 (Fig. 3). The calculated ECD spectrum of 4 presented similar Cotton effects with the experimental ECD spectrum of 4 (Fig. 4). Thus, 4 was identified as (11S,16R)-17-acetoxyl-11,l6-dihydroxyl-ent-atisane-3-one and named as jolkiniiol D.
According to the (+)-HR-ESI-MS at m/z 317.2112 ([M + H]+ calcd. 317.2111), compound 5 afforded the chemical formula of C20H28O3 as white solids. The 1H NMR spectrum of 5 revealed the signals of four tertiary methyl units at δH 0.88, 1.08, 1.13, and 1.16 (each 3H, s), three vinyl protons for ABX system at δH 5.29 (1H, d, J = 17.8 Hz), 5.34 (1H, d, J = 11.0 Hz), and 6.30 (1H, dd, J = 17.8, 11.0 Hz), three other vinyl H-atoms at δH 5.88 (1H, br.s), 5.93 (1H, d, J = 10.2 Hz), and 6.92 (1H, d, J = 10.2 Hz), two oxygenated hydrogens at δH 3.98 (1H, br.s) and 3.96 (1H, s) (Table 2). Twenty carbons including four methyls, three methylenes, eight methines, and five quaternary carbons were observed from its NMR spectrum in which a carbonyl unit at δC 204.2, three pairs of double bonds at δC 154.0/142.7/136.8/127.7/125.7/114.4, and two oxygenated C-atoms at δC 81.7 and 74.5 were determined. The detailed analysis of the HSQC, 1H–1H-COSY, and HMBC (Fig. 2) spectra allowed the position assignment of all the C-atoms and H-atoms. The NMR data of 5 were similar to those of 2,12α-dihydroxyl-ent-isopimara-1,7,15-trien-3-one (Tian et al., 2016) except for the olefinic carbon at δC 125.7 (CH, δH 5.93) and the oxygenated C-atom at δC 81.7 (CH, δH 3.96). The 1H–1H COSY correlation of δH 5.9 and δH 6.92 (H-1) suggested that C-2 was a disubstituted olefinic carbon. H-7 and H-15 showed HMBC correlations to δC 81.7 which positioned C-14 linked with a hydroxyl group. The ROESY correlations of CH3-17 with H-12 and H-14 indicated that these H-atoms were presented on the same side as α-configuration (Fig. 3). The (+) Cotton effect due to the n → π* transition at 355 nm according to the octant rule for α,β-unsaturated ketones suggested the trans junction of A and B rings (Mi et al., 1993). Thus, compound 5 was (12β,14β)-12,14-dihydroxyl-ent-pimara-1,7,15-trien-3-one whose absolute configurations was determined as 12R,14S by the calculated ECD method (Fig. 4), and named as jolkiniiol E.
The (+)-HR-ESI-MS at m/z 317.2115 ([M + H]+calcd. 317.2111) showed that the molecular formula of 6 was C20H38O3. The 1H NMR and 13C NMR data reveled that 6 was an ent-isopimara diterpenoid with a carbonyl group, three pairs of double bonds, and two hydroxyl units (Table 2). Huang et al. (Huang et al., 2014) and Tian et al. (Tian et al., 2016) reported almost the same NMR data of two compounds which were similar with those of 6. The former was identified as 2,12α-dihydroxy-ent-isopimara-1,7,15-trien-3-one and the later was identified as 2,12β-dihydroxy-isopimara-1,7,15-trien-3-one. However, H-12 was not exhibited ROESY correlations with H-5 and H-9 which verified the α-configuration of H-12 (Fig. 3). The ROESY correlations of H-12 to CH3-20 and CH3-17 also deduced the α-configuration of H-12. So, the hydroxyl group posited at C-12 was β-configuration. The trans junction of A and B rings was determined by the (+) Cotton effect at 355 nm according to the octant rule for α,β-unsaturated ketones (Mi et al., 1993). Compound 6 should be 2,12β-dihydroxy-ent-isopimara-1,7,15-trien-3-one and its absolute configurations was determined as 12R by comparing the experimental ECD and calculated ECD spectra of 6 (Fig. 4) which was named as jolkiniiol F.
Compound 7 was white solids with the molecular formula of C22H30O4 determined by the (+)-HR-ESI-MS at m/z 359.2208 ([M + H]+calcd. 359.2217). In the 1H NMR spectrum of 7 the most characteristic signals were five tertiary methyl units at δH 1.08, 1.09, 1.15, 1.18 and 2.03 (each 3H, s), three vinyl protons for ABX system at δH 5.00 (1H, d, J = 17.4 Hz), 5.14 (1H, d, J = 10.6 Hz), and 5.82 (1H, dd, J = 17.4, 10.6 Hz), three other vinyl H-atoms at δH 5.60 (1H, s), 5.95 (1H, d, J = 10.2 Hz), and 6.95 (1H, d, J = 10.2 Hz), two oxygenated hydrogens at δH 4.40 (1H, br.s) and 4.88 (1H, dd, J = 8.7, 3.4 Hz) (Table 2). Its 13C NMR spectrum afforded twenty-two carbons from which two carbonyl units at δC 204.2 and 170.8, three pairs of double bonds at δC 154.9/141.4/138.2/132.4/126.9/115.0, and two oxygenated C-atoms at δC 75.2 and 72.2 were identified. These NMR data were very similar with those of compound 5 except the carbonyl unit at δC 170.8 and a tertiary methyl group at δH 2.03/δC 21.2. They were linked together to form an acetoxyl unit according to the HMBC correlation from δH 2.03 to δC 170.8 (Fig. 2). Besides, the oxygenated H-atom at δH 4.88 showed HMBC correlation with δC 170.8 suggested that the acetoxyl unit was located at C-12 position. H-5, H2-6 and the oxygenated H-atom at δH 4.40 were showed 1H–1H-COSY correlations together indicated there was a hydroxyl group posited at C-7 position. Both the HMBC correlations from the olefinic proton at δH 5.60 to C-7 and C-12 verified the structure of Δ8(14). The junction of A and B rings was determined as trans according to the octant rule for α,β-unsaturated ketones (Mi et al., 1993) as well. The ROESY correlations of CH3-20/H-7 and CH3-17/H-12 showed that H-7 and H-12 were both located at α-configuration (Fig. 3). Thus, compound 7 was (7β,12β)-12-acetoxyl-7-hydroxyl-ent-isopimara-1,8(14),15-trien-3-one whose absolute configurations were determined as 7S,12R by the calculated ECD spectrum of 7 (Fig. 4) and named as jolkiniiol G.
Compounds 8–10 gave the same molecular formula of C22H32O3 according to the (+)-HR-ESI-MS data. It found five methyl units, three vinyl protons for ABX system, two other vinyl H-atoms, and four oxygenated hydrogens in their 1H NMR spectra respectively (Tables 2 and 3). Their 13C NMR spectra afforded twenty-two carbons including a carbonyl unit, three pairs of double bonds, and three oxygenated C-atoms as well. They gave out an oxygenated methylene at δC 64, a methyl group at δC 15, and a double bond at 135/128 without vinyl H-atom which were different from those of 5. The 1H–1H-COSY correlations from the protons of the oxygenated methylene at δC 64 and the methyl at δC 15 suggested they were linked together to make an ethoxyl group (Fig. 2). HMBC correlations from the H-atoms of the oxygenated methylene to C-7 indicated the ethoxyl group was located at C-7 position. The quaternary carbons of double bond were determined as C-8 and C-9 according to the HMBC correlations of H-7/C-9 and H2-11/C-8. Compounds 8–10 exhibited the most same NMR data except the chemical shifts of the oxygenated carbons at C-7 and C-12. For compound 8, the chemical shifts of C-7 and C-12 were at δC 78.9 and 73.9. For 9, these were δC 74.8 and 74.4. And, these were δC 74.6 and 72.0 for 10. We speculated that the configurations of C-7 and C-12 in compounds 8–10 were different. They all showed (+) Cotton effect at 350 nm which suggested the trans junction of A and B rings according to the octant rule for α,β-unsaturated ketones (Mi et al., 1993). The observed ROESY correlations of H-5/H-7 and H-12/CH3-17 in 8, H-7/CH3-20 and H-12/CH3-17 in 9, and H-7/CH3-20 and H-12/H-15 in 10 indicated that the configurations of 8–10 were 7α-ethoxy-12β-hydroxyl, 7β-ethoxy-12β-hydroxyl, and 7β-ethoxy-12α-hydroxyl respectively (Fig. 3). Finally, their absolute configurations were determined according to their experimental ECD and calculated ECD spectra (Fig. 4). So, their structures were identified as shown in Fig. 1 and named as jolkiniiols H-J.
Compound 11 assigned the molecular formula of C20H30O3 on the basis of (+)-HR-ESI-MS [M + H]+ at m/z 319.2270 ([M + H]+calcd. 319.2268). Its 1H NMR spectrum afforded three vinyl protons for ABX system, one other vinyl H-atom, four methyl units, and two oxygenated H-atoms (Table 3). Its 13C NMR data gave twenty carbons including a carbonyl unit, two pairs of double bonds, and two oxygenated C-atoms. Just as that of compound 10, the ABX system was formed by H-15 and H2-16. C-12 was ascribed to link with a hydroxy group by the HMBC correlations from CH3-17 to the oxygenated C-atom at δC 73.7 (Fig. 2). The 1H–1H-COSY correlations of H-9/H2-11/H-12 verified C(12)-hydroxyl as well. Furthermore, 1H–1H-COSY cross peaks of H-5/H2-6/H-7 suggested that H-7 was a vinyl H-atom. The other oxygenated C-atom at C-3 position assigned by the HMBC correlation from CH3-18 to C-3. H-3 presented HMBC correlation to the carbonyl unit which determined C-2 as a carbonyl C-atom. Both of the configurations of the hydroxyl groups at C-3 and C-12 positions were α-oriented according to the ROESY cross peaks of H-3/H-5/H-9/H-12 (Fig. 3). The calculated ECD spectrum of 11 was well matched with the experimental ECD spectrum of 11 (Fig. 4). Thus, 11 was identified as (3S,12S)-3,12-dihydroxyl-ent-isopimara-7,15-dien-2-one and named as jolkiniiol K.
Compound 12 afforded almost the same HR-ESI-MS and NMR data as those of 11. The difference between their NMR data was a double bond. For 11, the chemical shifts were at δC 133.2 and 122.3. For 12, the chemical shifts were at δC 136.3 and 128.6. The Δ8(14) was established by the HMBC correlations from the olefinic H-atom at δH 5.12 to C-7, C-9, C-12, and C-17 (Fig. 2). The ROESY cross peaks of H-3/H-5/H-9/H-12 were observed as well which illuminated the α-oriented hydroxyl groups at C-3 and C-12 positions (Fig. 3). The structure of 12 was (3S,12S)-3,12-dihydroxyl-ent-isopimara-8(14),15-dien-2-one based on the calculated ECD spectrum of 12 (Fig. 4) and named as jolkiniiol L.
Compound 13 presented the molecular formula C20H28O3, 2 mass units lower than that of 12, by (+)-HR-ESI-MS at m/z 339.1932 ([M + Na]+ calcd. 339.1931). Interpretation of the NMR spectrum established the ent-isopimara skeleton of 13 being identical with that of 12, except that there was a double bond in 13 at δH 6.12/5.68 and δC 130.7/126.1 (Table 4). The 1H–1H-COSY correlations of H-5/δH 6.12/5.68 indicated that the double bond was located at C-6 and C-7 positions (Fig. 2). This hypothesis was also corroborated by the observations of HMBC associations of H-7/C-5, H-7/C-9, H-14/C-7. The carbonyl unit, hydroxy groups, and the other two double bonds of 13 were same as those of 12 based on its 2D NMR data. The α-oriented hydroxyl groups at C-3 and C-12 positions were assigned by the ROESY correlations of H-3/H-5/H-9/H-12 (Fig. 3). And then, the absolute configurations of 13 were deduced as 3S,12S by the same Cotton effects of the calculated ECD spectrum of 13 and the experimental ECD spectrum of 13 (Fig. 4). So, 13 was (3S,12S)-3,12-dihydroxyl-ent-isopimara-6,8(14),15-trien-2-one and named as jolkiniiol M.
Compound 14 displayed the molecular formula of C20H26O4 as derived from the (+)-HR-ESI-MS at m/z 331.1915 ([M + H]+ calcd. 331.1904). The 1H NMR spectrum of 14 displayed the characteristic resonances for three vinyl protons for ABX system, one other vinyl H-atom at δH 5.93 (1H, s), four methyl units, and two oxygenated H-atoms at δH 3.91 (1H, d, J = 6.0 Hz) and 3.47 (1H, s) (Table 4). Two carbonyl units at δC 208.8 and 202.1, two pairs of double bonds, and three oxygenated C-atoms at δC 81.9/60.1/54.9 were observed in the 13C NMR spectrum of 14. The oxygenated C-atoms were divided into two methines and one quaternary carbon. C(2)-carbonyl group and C(3)-hydroxyl unit were established by the interpretation of the 2D NMR spectra as those of 11 (Fig. 2). Except for the vinyl protons for ABX system, the other vinyl H-atom at δH 5.93 was displayed HMBC correlations to C-10 and C-13 suggested that this double bond was located between C-9 and C-11. Besides, C-8 was illuminated as an oxygenated quaternary C-atom on the basis of the HMBC correlation of H-11 and the oxygenated quaternary carbon at δC 54.9. The other oxygenated C-atom was C-7 according the 1H–1H-COSY cross peaks of H-5/H2-6/H-7. C-12 was a carbonyl unit assigned by the HMBC correlations from CH3-17 to the carbonyl C-atom at δC 202.1. Thus, the remaining one unsaturation degree required by the molecular formula of 14 was attributed to one ring that might be located as C-7 and C-8 to form an epoxy ring. The configurations of H-3 and H-7 were β-oriented according to the ROESY cross peaks of H-3/H-5/H-7 (Fig. 3). The calculated ECD spectrum of 14 (Fig. 4) determined its absolute configurations were 3S,7R,8S. Thus, 14 was (3S,7R,8S)-7,8-epoxy-3-hydroxy-ent-isopimara-9(11),15-dien-2,12-dione and named as jolkiniiol N.
Compound 15 gave out the molecular formula of C20H26O3 which came from the (+)-HR-ESI-MS at m/z 315.1960 ([M + H]+ calcd. 315.1955). Compared with the NMR data of 14, the absence of the epoxy ring signals and the presence of one double bond at δC 130.8 and 129.4 were observed (Table 4). The 1H–1H-COSY correlations of H-5/H2-6/H-atom at δH 6.11 deduced the double bond was located between C-7 and C-8 positions which was determined by the HMBC correlations from H-7 to C-5 and C-14 as well (Fig. 2). The other NMR signals were similar with those of 14. H-3 was β-oriented according to the ROESY cross peaks of H-3/H-5 (Fig. 3). Thus, the absolute configuration of 15 was 3S based on the comparison of the calculated ECD spectrum of 15 and experimental ECD spectrum of 15 (Fig. 4), Finally, compound 15 was identified as (3S)-3-hydroxy-ent-isopimara-7,9(11),15-trien-2,12-dione and named as jolkiniiol O.
Compound 16 assigned the molecular formula of C20H30O2 based on the (+)-HR-ESI-MS [M + H]+ at m/z 305.2462 ([M + H]+calcd. 305.2475). Just as those of compound 12, three vinyl protons for ABX system, one other vinyl H-atom, four methyl units, and two oxygenated H-atoms were found in its 1H NMR spectrum (Table 4). Its 13C NMR data gave twenty carbons including two pairs of double bonds, and two oxygenated C-atoms. The ABX system was formed by H-15 and H2-16 undoubtedly. The hydroxy group at C-12 position and Δ8(14) were deduced by the HMBC correlations from CH3-17 to the oxygenated C-atom at δC 72.8 and to the olefinic C-atom at δC 124.6 (Fig. 2). Furthermore, 1H–1H-COSY cross peaks of H-1/H-2/the oxygenated at δH 3.26 and the HMBC correlation from CH3-19 to the oxygenated C-atom at δC 79.0 indicated that C-3 was an oxygenated C-atom. H-3 and H-12 were both β-oriented according to the ROESY cross peaks of H-3/H-5/H-9/H-12 (Fig. 3). The calculated ECD spectrum of 16 was well matched with the experimental ECD spectrum of 16 (Fig. 4). Therefore, 16 was identified as (3R,12S)-3,12-dihydroxyl-ent-isopimara-7,15-dien and named as jolkiniiol P.
3.2 Cytotoxicity on pancreatic cancer SW1990 cells
Compounds 1–16 were evaluated the cytotoxicity on pancreatic cancer SW1990 cells using CCK-8 method in vitro and paclitaxel was used as the positive control. The results showed that 1 and 9 displayed obvious cytotoxicity with the IC50 values 26.50 ± 6.36 μM and 21.09 ± 5.98 μM respectively which were stronger than that of paclitaxel (IC50 = 45.01 ± 7.65 μM) (Table 5). Other compounds did not present cytotoxicity on pancreatic cancer SW1990 cells with the IC50 values > 50 μM.
Compounds
IC50 (μM)a
Compounds
IC50 (μM)a
1
26.50 ± 6.36
9
21.09 ± 5.98
2
>50
10
>50
3
>50
11
>50
4
>50
12
>50
5
>50
13
>50
6
>50
14
>50
7
>50
15
>50
8
>50
16
>50
Paclitaxelb
45.01 ± 7.65
3.3 Flow cytometric results
FITC Annexin-V combined with PI were used to detect the effects of compounds 1 and 9 on the apoptosis cycle of tumor cells. The experiments showed that the percentages of SW1990 cells in pre apoptosis cycle were increased with dose dependent after the administration of compounds 1 and 9 (Fig. 5). It suggested us that 1 and 9 could promote the pre-apoptosis of SW1990 cells to act a role in anti-tumor.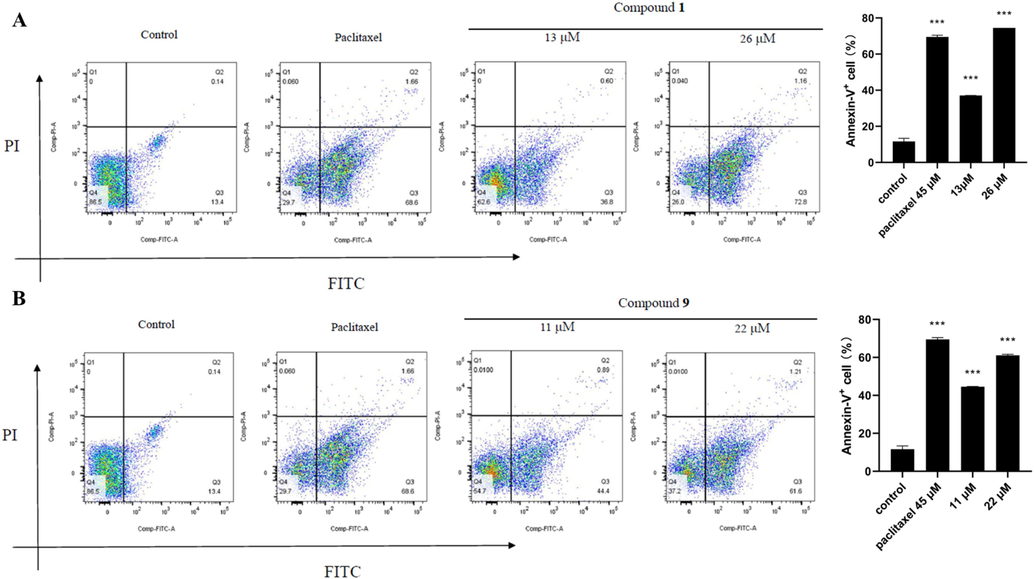
Compounds 1 (A) and 9 (B) induced the apoptosis rates of pancreatic cancer SW1990 cells (means ± SEM, n = 3; ***P < 0.001 vs control (DMSO)).
3.4 Western blot assay results
Bcl-2 is an inhibitor of apoptosis in mitochondria, and Bax is a pro-apoptotic protein. Bcl-2 forms a heterodimer with the Bax and inhibits the pro-apoptotic activity of Bax to maintain the integrity of the mitochondrial outer membrane and block mitochondrial apoptosis (Hu et al., 2015; Zhang et al., 2018). Caspase-3 is an aspartate-specific protease with the ability of breaking down proteins which is recognized as an apoptosis executor as well (Hu et al., 2015; Zhang et al., 2018). Therefore, we investigated the levels of Bcl-2, Bax, and Caspase-3 proteins in pancreatic cancer SW1990 cells after the treatment of compounds 1 and 9. As a result, compound 1 could down-regulate the expressions of Bcl-2 and up-regulate the expressions of Bax and Caspase-3. The protein levels of Bcl-2 in SW1990 cells were decreased significantly with the administration of compound 9. But compound 9 only up-regulated the expressions of Bax and not affected the protein levels of Caspase-3 (Fig. 6). It reminded that compounds 1 and 9 played a role in inhibiting tumor cells by decreasing the expressions of intracellular anti-apoptotic protein Bcl-2 and increasing the levels of apoptotic proteins Bax and Caspase-3.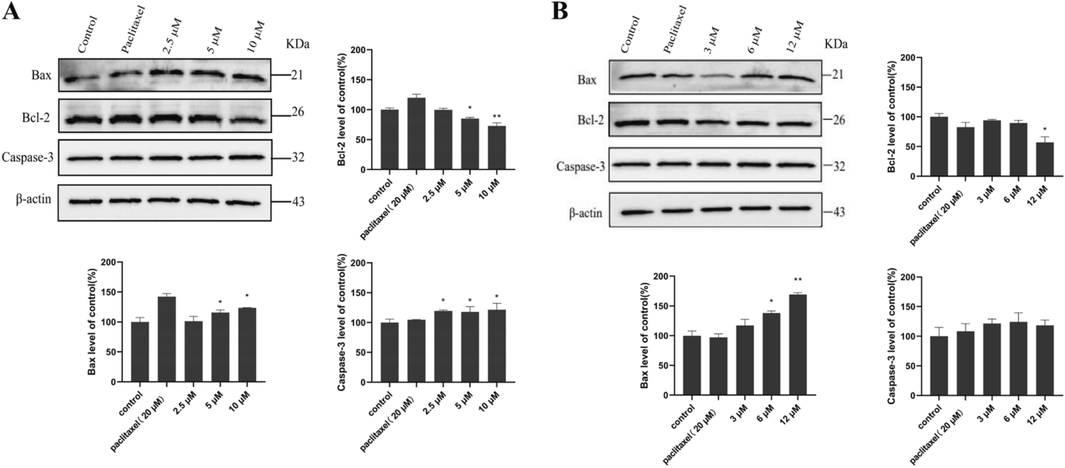
The effects of compounds 1 (A) and 9 (B) on Bcl-2, Bax, and Caspase-3 proteins in pancreatic cancer SW1990 cells (means ± SEM, n = 3; *P < 0.05, **P < 0.01 vs control (DMSO)).
3.5 Molecular docking results and druggability prediction
The above findings suggested that Bcl-2 played an important role in the anti-tumor process of compounds 1 and 9. To reveal their binding sites with Bcl-2, we subjected 1 and 9 to molecular docking with Bcl-2 (Fig. 7). It found that compound 1 was able to inhibit Blc-2 with the binding energy of −6.2 kcal/mol by forming hydrogen bonds with aspartic acid (ASP), arginine (ARG), and asparagine (ASN) residues of Bcl-2 whose bond lengths were 3.0, 3.1, 2.6, and 2.3, respectively. Compound 9 also showed a good free energy binding ability with Bcl-2 with the molecular docking binding energy of −5.4 kcal/mol and formed hydrogen bonds with ASP, ARG, glutamic acid (GLU), and lysine acid (LYS) residues with the bond lengths of 2.3, 2.9, 2.2, 3.5, and 2.3, respectively (Table 6).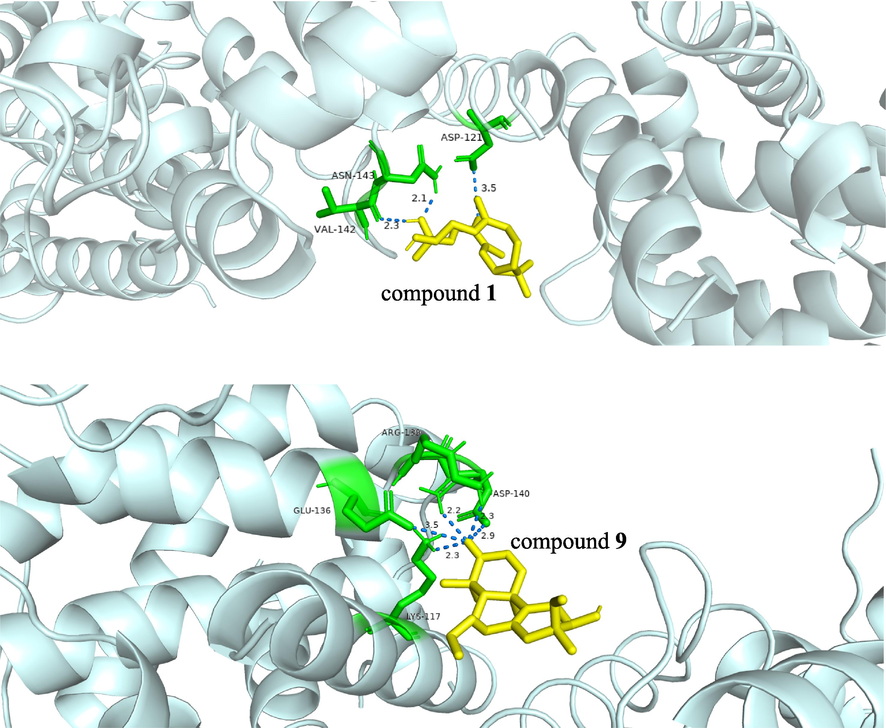
The molecular docking results of 1 and 9 with Bcl-2 protein.
Properties
1
9
Binding energy (kcal/mol)
–6.2
−5.4
Interaction residues
ASP-121, ASN-143, VAL-142
ASP-140, ARG-139, GLU-136, LYS-117
Solubility
2
2
Log of the octanol–water partition coefficient (Log P)
3.635
3.487
Molecular polar surface area (FPSA)
0.154
0.117
Absorption
0
0
Blood brain barrier (BBB)
1
1
Plasma protein binding (PPB)
true
true
CYP2D6
false
false
Hepatotoxicity
false
false
The druggability prediction showed that compounds 1 and 9 were lipophilic molecules with low solubility, low molecular polar surface area, and high Log P values. Thus, they were easily absorbed through the digestive system and displayed high plasma protein binding rates and blood–brain barrier permeabilities. Besides, the predictions also suggested that 1 and 9 could not inhibit the CYP2D6 to generated hepatotoxicity (Table 6). These results provided the basis for the later experimental study of their drug properties.
The spread of E. jolkinii caused serious damages to alpine meadows that prompted the research of E. jolkinii on bioactive compounds and allelochemicals (Huang et al., 2014; He et al., 2008; Duan et al., 2024; Niu et al., 2024). In this paper, we investigated the anti-tumor effects of diterpenoids from E. jolkinii roots that was helpful for the utilization of E. jolkinii and the development of anti-pancreatic cancer drugs. However, the allelochemicals of E. jolkinii were unclear and the prevention of E. jolkinii has not been solved yet. Diterpenoids, as the characteristic compounds isolated from E. jolkinii, they might present ecological significance, such as allelopathy or antifeedant activity. Therefore, we plant design experiments to study the allelopathy of these diterpenoids to reveal the allelochemicals of E. jolkinii in the future which will help to control E. jolkinii and protect the alpine meadow ecosystem.
4 Conclusions
In this study, sixteen new diterpenoids were isolated from E. jolkinii roots including casbane, ent-atisane, and ent-isopimarane types. Compounds 1 and 9 exhibited obvious cytotoxicity on pancreatic cancer SW1990 cells with the IC50 values of 26.50 ± 6.36 and 21.09 ± 5.98 μM respectively. Mechanism study indicated that 1 and 9 could promote the pre-apoptosis of SW1990 cells and regulate the expressions of Bcl-2, Bax, and Caspase-3 proteins to play anti-tumor role. Molecular ducking results showed that both of 1 and 9 displayed strong bond abilities with Bcl-2 protein and possessed good druggabilities. This study suggested that E. jolkinii roots contained diverse diterpenoids with cytotoxicity on pancreatic cancer SW1990 cells by regulating the expressions of Bcl-2, Bax, and Caspase-3 proteins which promoted the preventions and utilizations of E. jolkinii in subalpine meadows of southwest China.
Author agreement
The manuscript is approved by all authors for publication. I would like to declare on behalf of my co-authors that the work described was original research that has not been published previously, and not under consideration for publication elsewhere, in whole or in part. All the authors listed have approved the manuscript that is enclosed.
CRediT authorship contribution statement
Xinglong Chen: Writing – review & editing, Writing – original draft, Formal analysis, Data curation. Hongbo Zhu: Methodology, Investigation. Haiying Zhang: Investigation. Tang Zhou: Investigation, Conceptualization. Xingxi Li: Investigation. Bo Hou: Investigation. Weiyan Hu: Writing – review & editing, Supervision. Rongping Zhang: Writing – review & editing, Visualization.
Acknowledgments
This study was financed by the Applied Basic Research Programs of Yunnan Province (No. 202201AU070166), the National Natural Science Foundation of China (No. 32160107), the Program of Yunling Scholarship (YNWR-YLXZ-2019-019), the Social Development Special Projects-Key Research and Development Plan of Science and Technology Department of Yunnan Province (No. 202303AC100025).
Declaration of competing interest
The authors declare that they have no known competing financial interests or personal relationships that could have appeared to influence the work reported in this paper.
References
- Bitter apricot ethanolic extract induces apoptosis through increasing expression of Bax/Bcl-2 ratio and caspase-3 in PANC-1 pancreatic cancer cells. Mol. Biol. Rep.. 2020;47:1895-1904.
- [Google Scholar]
- Isolation and characterization of 3-oxoatisane-l6α,17-diol from Euphorbia acaulis. J. Nat. Prod.. 1987;50:790-793.
- [Google Scholar]
- Cytotoxic terpenoids from Tripterygium hypoglaucum against human pancreatic cancer cells SW1990 by increasing the expression of Bax protein. J. Ethnopharmacol.. 2022;289:115010
- [Google Scholar]
- Analysis of secondary metabolites and study on allelopathic effects of main substances of Euphorbia jolkinii. Acta Agre. Sin. 2024
- [Google Scholar]
- The determinants of stream flow variability and variation in Three-River Source of China: climate change or ecological restoration? Environ. Earth Sci.. 2017;76:696.
- [Google Scholar]
- High nutrient uptake efficiency and high water use efficiency facilitate the spread of Stellera chamaejasme L. in degraded grasslands. BMC Ecol.. 2019;19(2):270-275.
- [Google Scholar]
- International trends in the incidence of cancer among adolescents and young adults. J. Natl. Cancer Inst.. 2020;112:1105-1117.
- [Google Scholar]
- Eight new diterpenoids from the roots of Euphorbia nematocypha. Helv. Chim. Acta. 2008;91:2139-2147.
- [Google Scholar]
- The Ca2+ channel inhibitor 2-APB reverses β-amyloid-induced LTP deficit in hippocampus by blocking BAX and caspase-3 hyperactivation. Br. J. Pharmacol.. 2015;172:2273-2285.
- [Google Scholar]
- Antifeedant and antiviral diterpenoids from the fresh roots of Euphorbia jolkinii. Nat. Prod. Bioprospect.. 2014;4:91-100.
- [Google Scholar]
- The use of biomarkers in early diagnostics of pancreatic cancer. Can. Gastroen. Hepatol.. 2018;201:5389820.
- [Google Scholar]
- Rare casbane diterpenoids from the hainan soft coral Sinularia depressa. J. Nat. Prod.. 2010;73:133-138.
- [Google Scholar]
- Response of vegetation succession to enclosure in Euphorbia jolkinii subalpine meadow. Chin. J. Grass.. 2021;43:10-16.
- [Google Scholar]
- Jolkinolide B induced neuroendo-crine differentitation of human prostate LNCaP cancer cell line. Biochem. Pharmacol.. 2002;63:951-957.
- [Google Scholar]
- Induction of apoptosis in K562 cells by jolkinolide B. Can. J. Physiol. Pharm.. 2006;84:959-965.
- [Google Scholar]
- Studies on circular dichroism of diterpenoids from Mallotus anomalus and sesquiterpenoid tussilagone. Acta Pharm. Sin.. 1993;28:105-109.
- [Google Scholar]
- Therapeutic developments in pancreatic cancer: current and future perspectives. Nat. Rev. Gastroen. Hepatol.. 2018;15(6):333-348.
- [Google Scholar]
- Study on the allelopathic effects of extracts from the roots of Euphorbia jolkinii on three high quality forages. Chin. J. Grass.. 2024;46:135-142.
- [Google Scholar]
- State Pharmacopoeia Commission of P.R. China, Pharmacopoeia of P.R. China, 1997. China Medical Science Press, Beijing, 44, 026.
- Four new diterpenoids from the roots of Euphorbia pekinensis. Chem. Biodivers.. 2016;13:1404-1409.
- [Google Scholar]
- Jolkinolide B induces apoptosis in MCF-7 cells through inhibition of the P13K/Akt/mTOR signaling pathway. Oncol. Rep.. 2013;29:212-218.
- [Google Scholar]
- Melatonin is involved in the apoptosis and necrosis of pancreatic cancer cell line SW-1990 via modulating of Bcl-2/Bax balance. Biomed. Pharmacother.. 2013;67:133-139.
- [Google Scholar]
- Antihyperlipidemic effect of Vaccinium dunalianum buds based on biological activity screening and LC-MS. J. Ethnopharmacol.. 2023;289:115010
- [Google Scholar]
- Remote-sensing monitoring of grassland degradation based on the GDI in Shangri-La, China. Remote Sens.. 2019;11(24):3030
- [Google Scholar]
- 8-chrysoeriol, as a potential Bcl-2 inhibitor triggers apoptosis of SW1990 pancreatic cancer cells. Bioorg. Chem.. 2018;77:478-484.
- [Google Scholar]
- Cytotoxic diterpenoids from the soft coral Sinularia microclavata. J. Nat. Prod.. 2005;68:1087-1089.
- [Google Scholar]
- Eurifoloids A-R, structurally diverse diterpenoids from Euphorbia neriifolia. J. Nat. Prod.. 2014;77:2224-2233.
- [Google Scholar]
- The impact of a native dominant plant, Euphorbia jolkinii, on plant-flower visitor networks and pollen deposition on stigmas of co-flowering species in sub-alpine meadows of Shangri-La, SW Chin. J. Ecol.. 2012;109:2107-2120.
- [Google Scholar]
- Study on the Caspase 3/Bax/Bcl-2 signal pathway mechanism of induction apoptosis effect of piperine in human pancreatic cancer PANC-1 Cell. Chin. J. Mod. App. Pharm.. 2020;37:1687-1691.
- [Google Scholar]
Appendix A
Supplementary material
1D and 2D NMR, HRESIMS, UV, and IR spectra of compounds 1–16 can be found Supplementary material. The manuscript is approved by all authors for publication. I would like to declare on behalf of my co-authors that the work described was original research that has not been published previously, and not under consideration for publication elsewhere, in whole or in part. All the authors listed have approved the manuscript that is enclosed. Supplementary data to this article can be found online at https://doi.org/10.1016/j.arabjc.2024.106012.
Appendix A
Supplementary material
The following are the Supplementary data to this article:Supplementary Data 1
Supplementary Data 1


