

Translate this page into:
Elucidating the formation mechanism of gardenia blue pigment from amino acid and genipin
⁎Corresponding author at: School of Chemical Engineering and Technology, State Key Laboratory of Chemical Engineering, Tianjin University, Tianjin 300072, China. wangyuefei@tju.edu.cn (Yuefei Wang),
⁎⁎Corresponding author at: State Key Laboratory of Chinese Medicine Modernization, State Key Laboratory of Component-based Chinese Medicine, Tianjin University of Traditional Chinese Medicine, Tianjin 301617, China chaix0622@tjutcm.edu.cn (Xin Chai),
⁎⁎⁎Corresponding author at: State Key Laboratory of Chinese Medicine Modernization, State Key Laboratory of Component-based Chinese Medicine, Tianjin University of Traditional Chinese Medicine, Tianjin 301617, China. wangyf0622@tjutcm.edu.cn (Yuefei Wang)
-
Received: ,
Accepted: ,
This article was originally published by Elsevier and was migrated to Scientific Scholar after the change of Publisher.
Abstract
Gardenia blue (GB), a natural active blue pigment, can be synthesized from iridoid glycosides and primary amino-containing compounds in vivo and in vitro. However, limited studies have reported about GB synthetic intermediates, leading to unawareness of the formation mechanism of GB. Here, we reported that GB could be detected in rats′ feces, whose formation was simulated by in vitro reaction of amino acid-rich feces extract from rats and genipin (GP) metabolized from geniposide (GE) through β-glucosidase. Firstly, we proved that 14 amino acids (AAs) detected in rats′ feces containing primary amino groups can react with GP to produce GB. Then, taking histidine (His) as example, we characterized the key intermediates during the reaction process, including basic units genihistidine A (GH-A) and dimers. As an active basic unit, GH-A underwent covalent polymerization to form dimer, which then self-assembled into supramolecular spherical nanoparticles through multiple noncovalent interactions, including hydrogen bonds, π-π interactions, and van der Waals interactions. Our study revealed the formation mechanism of GB and provided insights into the bioavailable form of GE from traditional Chinese medicine in vivo.
Keywords
Genipin
Amino acid
Gardenia blue pigment
genihistidine A
Supramolecular assemblies
Molecular dynamics simulation

- AAAs
-
acidic amino acids
- AAs
-
amino acids
- BAAs
-
basic amino acids
- Cryo-TEM
-
cryogenic transmission electron microscopy
- DFT
-
density functional theory
- FT-IR
-
Fourier transform infrared spectroscopy
- GB
-
gardenia blue
- GC–MS
-
gas chromatography-mass spectrometry
- GE
-
geniposide
- GG
-
geniglutamic
- GH-A
-
genihistidine A
- GH-B
-
genihistidine B
- GP
-
genipin
- GT
-
genithreonine
- His
-
histidine
- LC-MS/MS
-
liquid chromatography tandem mass spectrometry
- MA
-
methylamine
- MD
-
molecular dynamics
- MWCO
-
molecular weight cut off
- NAAs
-
neutral amino acids
- NMR
-
nuclear magnetic resonance
- PBS
-
phosphate buffer saline
- UPLC-PDA
-
ultra-performance liquid chromatography with photodiode array
- UV–vis
-
Ultraviolet–visible
Abbreviations
1 Introduction
Gardenia blue (GB) pigment, as a natural blue pigment, is produced by the spontaneous cross-linking coloring reaction between the primary amino-containing compounds and genipin (GP), the aglycone of geniposide (GE) in gardenia (He et al., 2022). GB has been utilized as a natural food additive in numerous countries, due to its remarkable properties, including high coloring capacity, excellent pH stability, environmental friendliness, nontoxicity, and a range of beneficial biological activities such as anti-inflammatory (Wang et al., 2012), antioxidant (Yin et al., 2014), and anti-depression effects (Li et al., 2019a), etc (Neves et al., 2022). Additionally, our previous studies revealed the presence of GB in the feces of rats, resulting from the spontaneous in vivo cross-linking of GE and methylamine (MA) after GE administration, which contributed to the modulation of intestinal flora (Chen et al., 2020; Zhang et al., 2023). While a diverse range of amino acids (AAs) is found in the large intestine (Chen et al., 2020), the underlying reaction mechanism of GB formed by GE and AAs has not been systematically elucidated.
As a type of supramolecular substance, the limited studies that reported the structure and synthesis of GB from GP and AAs were preliminarily performed by classical techniques, such as nuclear magnetic resonance (NMR), gas chromatography-mass spectrometry (GC–MS), etc. (Gao et al., 2021; Li et al., 2019b; Tsutsumiuchi et al., 2021). Meanwhile, it is difficult to decipher the formation mechanism of GB due to the trace-level of intermediates and rapid formation. With the advancement of molecular dynamics (MD) simulation, a more comprehensive understanding of supramolecular chemical structures of GB and its intermediates and reaction mechanisms could be provided (Rapaport, 2014). MD simulations can provide valuable insights into the supramolecular self-assembly mechanism, including size distribution, shape, and intermolecular interactions (Jiang et al., 2015; Xu et al., 2023).
Here, inspired by the observed formation of GB in feces of rats, we obtained GB produced from reaction between AAs detected in rat feces and GP metabolized from GE by β-glucosidase. The formation of GB is a complex process involving multiple reaction steps. In this work, we specifically elucidated the formation mechanism of GB from genihistidine A (GH-A) intermediate at the molecular level through NMR and liquid chromatography-tandem mass spectrometry (LC-MS/MS). The GH-A intermediate, as an active basic unit, was produced from GP and histidine (His). These GH-A units formed dimers through covalent bonding, then assembled into GB via intermolecular non-covalent interactions.
2 Materials and methods
2.1 Chemicals and reagents
Genipin (GP), geniposide (GE), alanine (Ala), arginine (Arg), aspartic acid (Asp), glutamic acid (Glu), glycine (Gly), histidine (His), isoleucine (Ile), leucine (Leu), lysine (Lys), methionine (Met), L-norleucine (Nle), proline (Pro), phenylalanine (Phe), serine (Ser), tyrosine (Tyr), threonine (Thr), and valine (Val) as reference standards were obtained from Shanghai Yuanye Bio-Technology Co., Ltd. (Shanghai, China). Phenyl isothiocyanate (PITC), triethylamine, and formic acid were supplied by Aladdin Bio-Chem Technology Co., Ltd. (Shanghai, China). Acetonitrile (HPLC grade) and methanol (HPLC grade) were purchased from Sigma-Aldrich Co., Ltd. (St. Louis, Missouri, USA). n-Hexane and phosphate buffer saline (PBS) were bought from Beijing Solarbio Science & Technology Co., Ltd. (Beijing, China). Anhydrous sodium acetate, glacial acetic acid, and borax were obtained from Tianjin Fengchuan chemical Reagent Technology Co., Ltd. (Tianjin, China). Water was purified by a Milli-Q water purification system (Millipore, USA). Potassium bromide (spectroscopic grade) was provided by Tianjin Guangfu Fine Chemical Research Institute (Tianjin, China). The purity of all reference standards was greater than 98 %. All other reagents were analytical grade and commercially available.
2.2 Rat feces samples
Rat feces were provided by male Sprague-Dawley (SD) rats (200 ± 20 g), which were purchased from Beijing Vital River Laboratory Animal Technology Co., Ltd. (Beijing, China). All collected feces were stored at − 80 °C before analysis. The animal study was performed according to the protocols approved by the Animal Ethics Committee of Tianjin University of Traditional Chinese Medicine (TCM-LAEC2022192).
2.3 Content determination of AAs in rat feces
2.3.1 Preparation of the feces sample solution
The stored feces were thawed and homogenized at room temperature. Then, the weighted sample (0.5 g) was suspended in 5 mL of 50 % methanol aqueous solution, which was extracted with ultrasonic assistance (144 W, 35 kHz) for 30 min. Then, the supernatant was centrifuged at 12700 rpm for 10 min, and the collected supernatant was the fecal extract.
A fecal extract of 600 μL was concentrated to dryness using vacuum centrifugation, and 300 μL of 0.1 M hydrochloric acid solution was added ultrasonically to dissolve. The mixture was centrifuged at 12700 rpm for 10 min, and the 200 μL of supernatant was collected and mixed with 20 μL of Nle (0.4 M) as internal standard, 100 μL of triethylamine (1.0 M, dissolved in acetonitrile solution), and phenyl isothiocyanate (0.4 M, dissolved in acetonitrile solution), respectively (Klikarova et al., 2021). The mixed solution was incubated at room temperature for 80 min, and 400 μL n-hexane was added to stand for 10 min after vortex oscillation. The separated lower layer solution was mixed with water at a ratio of 1:2, which was then centrifuged at 12700 rpm for 10 min to obtain the feces sample solution.
2.3.2 Preparation of the AAs standard solution
A mixed standard stock solution of Asp, Glu, Ser, Gly, His, Thr, Pro, Tyr, Val, Met, Ile, Leu, Phe, and Lys was prepared by dissolving in 0.1 M hydrochloric acid solution to give final concentrations at 3.37 μg/mL for Asp, 41.894 μg/mL for Glu, 5.55 μg/mL for Ser, 7.389 μg/mL for Gly, 5.212 μg/mL for His, 100.136 μg/mL for Thr, 4.87 μg/mL for Pro, 8.765 μg/mL for Tyr, 7.241 μg/mL for Val, 4.131 μg/mL for Met, 8.646 μg/mL for Ile, 9.681 μg/mL for Leu, 4.498 μg/mL for Phe, and 16.038 μg/mL for Lys, respectively. 200 μL of the standard stock solution was mixed with 20 μL of Nle (0.4 M) as internal standard, 100 μL of triethylamine (1.0 M, dissolved in acetonitrile solution), and phenyl isothiocyanate (0.4 M, dissolved in acetonitrile solution), respectively. The following steps were the same as the section “2.3.1”.
2.3.3 Preparation of blank solution
200 μL of 0.1 M hydrochloric acid solution was mixed with 20 μL of Nle (0.4 M) as internal standard, 100 μL of triethylamine (1.0 M, dissolved in acetonitrile solution), and phenyl isothiocyanate (0.4 M, dissolved in acetonitrile solution), respectively. The following steps were the same as the section “2.3.1”.
The feces sample solution, AAs standard solution, and blank solution were analyzed using Waters ACQUITY ultra-performance liquid chromatography with photodiode array (UPLC-PDA, Waters, Milford, USA), respectively. An ACQUITY UPLC® BEH C18 column (2.1 × 100 mm, 1.7 μm) at 52°C was performed for the chromatographic separation with the flow rate at 0.3 mL/min. The mobile phase consisted of 0.1 M sodium acetate buffer solution (A) and acetonitrile (B), and the gradient elution was undertaken as follows: 1 %–4% B in 0–2 min, 4 %–13 % B in 2–4 min, 13 %–18 % B in 4–5 min, 18 %–37 % B in 5–10 min, 37 %–1% B in 10–11 min, 1 % B in 11–15 min. The detection wavelength was set at 254 nm and the injection volume was 2 μL.
2.4 Preparation of reaction solution between GP/GE and fecal extract
GP/GE was dissolved in water to obtain a stock solution with a concentration at 1 mg/mL. Then, the GP/GE stock solution (500 μL) was incubated with the fecal extract (3.5 mL) prepared in section “2.3.1” for 12 h at 37°C. An Ultraviolet-visible (UV–vis) spectrometer was used to scan the spectra of the mixed solution in the range of 200∼800 nm.
2.5 UV–vis detection of reaction solution between GP/GE and 14 AAs detected in rat feces in vitro
GP/GE and Asp were dissolved in PBS (pH 7.35) to reach the final concentration both at 0.5 mM, which were reacted at 37°C for 12 h. The preparation method of reaction solution between GP/GE and other AAs (Glu, Ser, Gly, His, Thr, Pro, Tyr, Val, Met, Ile, Leu, Phe, and Lys) was consistent with that of Asp. The spectra of the reaction solutions were detected in the range from 200 to 800 nm.
2.6 Preparation and identification of basic units
2.6.1 Preparation of genihistidine A (GH-A) as the basic unit
GP and His were dissolved in PBS (pH 7.35) at 37 °C to obtain the final concentration both at 0.5 mM and reacted for 4 h. The reacted solution was then concentrated at 40 °C under reduced pressure. The concentrated sample solution was loaded on small pore resin (MCI-GEL, CHP20/P120), which was eluted by ethanol–water solvent system (0:100, 2:98, 5:95, 20:80, 40:60, 60:40, v/v, 150 mL per fraction). The eluate of ethanol–water (2:98) was collected and concentrated under reduced pressure, and then successively separated by preparative HPLC on a PrepHT XDB C18 column (21.2 × 250 mm, 7 μm) at 10 mL/min using 0.1 % formic acid aqueous solution-methanol (75:25, v/v) as the mobile phase to yield basic unit GH-A (tR = 7.5 ∼ 8.0 min), and the detection wavelength was set at 254 nm. The collected GH-A was lyophilized into powder for further experiments.
2.6.2 Preparation of basic unit genihistidine B (GH-B)
GP and His were dissolved in PBS (pH 7.35) to obtain the final concentration both at 0.5 mM, which were reacted for 60 h at 37 °C and concentrated at 40 °C under reduced pressure. According to the preparation protocol of GH-A, the eluate of ethanol–water (40:60) was collected for enriching GH-B and concentrated under reduced pressure. GH-B (tR = 12 ∼ 13 min) was purified using 0.1 % formic acid aqueous solution-methanol (50:50, v/v) as the mobile phase by the established preparative HPLC method. The collected GH-B was lyophilized into powder for further experiments.
2.6.3 Preparation of basic unit genithreonine (GT)
GP and Thr were dissolved in PBS (pH 7.35) at 37 °C to obtain the final concentration both at 0.5 mM, which were reacted for 36 h and concentrated at 40 °C under reduced pressure. According to the preparation protocol of GH-A, the following procedures were performed to collect the eluate of ethanol–water (10:90) for enriching GT and concentrated under reduced pressure. GT (tR = 10 ∼ 11 min) was obtained using 0.1 % formic acid aqueous solution-methanol (65:35, v/v) by the established preparative HPLC method. The collected GT was lyophilized into powder for further experiments.
2.6.4 Preparation of basic unit geniglutamic (GG)
GP and Glu were dissolved in PBS (pH 7.35) at 37 °C to obtain the final concentration both at 0.5 mM and reacted for 24 h, and concentrated at 40 °C under reduced pressure. According to the preparation protocol of GH-A, the following procedures were performed to collect the eluate of ethanol–water (0:100 ∼ 2:98) for enriching GG and concentrated under reduced pressure. GG (tR = 6.5 ∼ 7.5 min) was obtained using 0.1 % formic acid aqueous solution-methanol (45:55, v/v) by the established preparative HPLC method.
2.6.5 Identification of the basic units
2.6.5.1 LC-MS/MS analysis
The molecular weights of GH-A, GH-B, GT, and GG were determined using the UHPLC/Q Exactive Q-Orbitrap system. The chromatographic elution was performed on an ACQUITY UPLC® BEH C18 column (2.1 × 100 mm, 1.7 μm) at 50 °C in a gradient mode with a mobile phase consisting of 0.1 % formic acid aqueous solution (A) and acetonitrile (B), which was implemented at 0.3 mL/min as follows: 8 %–9% B in 0–0.5 min, 9 %–13.5 % B in 0.5–2 min, 13.5 %–21 % B in 2–7 min, 21 %–92 % B in 7–13 min, and 92 %–8% B in 13–14 min. The detection wavelengths were set at 254, 290, and 606 nm. The injection volume was 2 μL. The electrospray ion source of the Q-Orbitrap mass spectrometer was performed in positive ion mode with the following optimized MS parameters: spray voltage, 3.8 kV; auxiliary gas rate, 10 L/h; sheath gas rate, 35 L/h; capillary temperature, 320 °C; normalized collision energy, 20, 40, and 60 V; and the mass range, 200–1500 m/z. Data were analyzed and processed by Xcalibur V4.2 software (Thermo Fisher Scientific, USA).
2.6.5.2 NMR analysis
Bruker Avance III 600 MHz spectrometer equipped with a cryogenic probe (Bruker, Biospin, Germany) was performed to characterize the chemical structures of GH-A, GH-B, and GT, where GH-A and GH-B were dissolved in D2O, GT in DMSO-d6. NMR original data were processed by MestReNova 6.1.0 software (Mestrelab Research S.L, Spain).
2.7 Determination of basic units and GB in the reacted solution of GP and representative AAs (His, Glu, and Thr) in vitro under simulated gut environments
Glu, Thr, and His were selected as representative AAs from acidic, neutral, and basic AAs detected in rat feces, respectively, and their reaction mechanisms with GP were studied. By taking His for an example, GP and His were dissolved in PBS (pH 7.35) and acetic acid-sodium acetate buffer solution (pH 6.0) at 37 °C, respectively, to obtain the final concentration both at 0.5 mM. Then, the reacted solution was directly detected at 0, 3, 6, 9, and 12 h, respectively. The preparation method for the reacted solution between GP and Glu or Thr was the same as described above.
The basic units GH-A and GH-B produced by GP and His in the reacted solution, GT by GP and Thr, and GG by GP and Glu were determined by UPLC-PDA. The experimental procedures of UPLC were performed according to section “2.6.5”. UV–vis spectrometer was used to scan the spectra of the reacted solution in the range of 200∼800 nm.
2.8 Synthesis of dimer and GB from basic units GH-A and GH-B
The purified GH-A powder was separately dissolved in PBS (pH 7.35) and acetic acid-sodium acetate buffer solution (pH 6.0) at 37 °C to reach 0.13 mM, which was then incubated for 24 h. The GH-A, GH-B, and GB in the reacted solution were directly detected using UPLC-PDA and UV–vis every 2 h.
GH-B was employed to prepare the sample solution in PBS (pH 7.35) and acetic acid-sodium acetate buffer solution (pH 6.0) at 37 °C to reach 0.13 mM, respectively, and incubated for 24 h. GH-B and GB in the reacted solution were detected by UPLC-PDA and UV–vis every 2 h.
UPLC-PDA and UV–vis detection methods were performed according to sections “2.6.5” and “2.7”, respectively.
2.9 Study on dimer production from different reaction ratios of GP and His
GP and His were dissolved and mixed in PBS (pH 7.35) to give the final concentration both at 1.0 mM, in which the concentration ratio of GP and His was 1:1. Then, the solution was incubated for 60 h at 37 °C. The dimer formed in the reacted solution was detected at 0, 12, 24, 36, 48, and 60 h by UPLC-PDA, respectively.
The mixed sample solution of GP and His was prepared at a concentration ratio of 1:5 to reach 1 and 5 mM, respectively, which was also obtained at a concentration ratio of 5:1 by the established method.
UPLC-PDA detection method was employed as section “2.6.5”.
2.10 Preparation of dimer
GP and His were dissolved and mixed in PBS (pH 7.35) at 37 °C to reach 1 and 5 mM, respectively, which was incubated for 24 h and then concentrated at 50 °C under reduced pressure. The concentrated solution was successively separated on Waters SunFire® C18 OBD Prep column (10 × 250 mm, 5 μm) at 4 mL/min using 0.1 % formic acid aqueous solution-methanol as the mobile phase by preparative HPLC. The gradient elution was 40 %–95 % B in 0–20 min. The detection wavelengths were set at 254, 290, and 606 nm. A fraction between 9.0 and 10.5 min (tR) was collected to enrich the dimer.
2.11 Study on GB formation from dimer
The dimer solution obtained in section “2.10” was mixed with PBS (pH 7.35) and acetic acid-sodium acetate buffer solution (pH 6.0) at 37 °C in equal proportion, respectively, and then incubated for 60 h. The dimer and the absorbance of the reacted solution at 590 nm were detected at 0, 12, 24, 36, 48, and 60 h using UPLC-PDA and UV–vis, respectively.
UPLC-PDA and UV–vis detection methods were employed as sections “2.6.5” and “2.7”, respectively.
2.12 Identification of dimer
The dimer solution obtained in section “2.10” was analyzed by LC-MS/MS as described in section “2.6.5”.
2.13 Synthesis of GB
GP and His were dissolved and mixed in acetic acid-sodium acetate buffer solution (pH 6.0) to reach 1 and 5 mM and reacted for 24 h at 37 °C. Then, the reacted solution was dialyzed against deionized water for 48 h while the deionized water was replaced per 12 h (molecular weight cut off (MWCO), 3000 Da). The residue in the dialysis bag was centrifuged for 40 min at 3800 rpm using an ultracentrifugal filter (Merk Millipore, Germany) with MWCO 3000 Da to obtain GB solution, and then lyophilized to acquire GB powder.
2.14 Characterization of GB
Fourier transform infrared spectroscopy (FT-IR) analysis of GB. FT-IR spectrometer (Tensor II, Bruker, Germany) was employed to detect IR characteristic signals of GB, GP, and His in the range of 4000 to 400 cm−1 by the KBr method.
Solid-state NMR analysis of GB. GB was characterized by NMR (JNM-ECZ600R, JEOL) equipped with a 3.2 mm ID zirconia sample cell (rotation rate, 15 kHz; scan times, 2200). NMR original data were processed by MestReNova 6.1.0 software (Mestrelab Research S.L, Spain).
Powder X-ray diffraction analysis of GB. A D8 Focus powder X-ray diffractometer (Bruker, Germany) was used to characterize the crystal structure of GB. The tested conditions are as follows: Cu target at λ = 1.5418 Å, scanning range from 3° to 50°, and scanning rate at 8°·min−1.
Cryogenic transmission electron microscopy (Cryo-TEM) analysis of GB. Cryo-TEM images of GB solution obtained in section “2.13” were collected using FEI Talos F200C G2 electron microscope (Thermo Fisher Scientific, USA) at an accelerating voltage of 200 kV by Ceta 4 K × 4 K FEI Eagle CCD camera and HADDF, BF/DF direct electron detector (Thermo Fisher Scientific, USA).
Zeta potential analysis of GB. Zetasizer Nano-ZS (Malvern Instruments Ltd., U.K.) was used to detect the GB solution obtained in section “2.13”. Before measurement, the GB solution was diluted with water (v:v, 1:100).
2.15 Prediction of the maximal UV–vis absorption wavelength for dimer
Density functional theory (DFT) calculations were processed by the Gaussian 09C software package (Frisch et al., 2016). The probable molecular structures of the dimer were constructured using the pymol software (https://www.pymol.org), and then geometrically optimized under B3LYP functional (Stephens et al., 1994) and def2SVP basis (Weigend and Ahlrichs, 2005), with BJ damping empirical dispersion (Grimme et al., 2010). The maximal UV–vis absorption wavelength of the dimer was analyzed by Multiwfn (Lu and Chen, 2012) with the solvation model based on density (SMD) (Marenich et al., 2009) and illustrated by visual molecular dynamics (VMD) (Humphrey et al., 1996).
2.16 Molecular dynamics simulations
The assembly of GB from dimer was simulated by coarse-grained MD (CG-MD) with Gromacs 2023.2 software package (Abraham et al., 2015) under MARTINI version 2.2 force field (de Jong et al., 2013), which has been utilized in supramolecular self-assembly studies (Li et al., 2021; Zhang et al., 2023). The coarse-grained structure of the dimer was constructed with CG Builder web tools (jbarnoud.github.io/cgbuilder/), and the corresponding CG topology was built according to the force constant rules (Marrink et al., 2007). The atoms were coarse-grained into CG beads as partition mode. Then, for CG-MD simulations, 1000 molecules of dimer were randomly placed into a cubic box with a side length of 32 nm, and the box was consequently filled with polarized and unpolarized coarse-grained water molecules (at a molar ratio of 1:10). Then, the system was energy-minimized for 5000 steps using the steepest descendant algorithm and then underwent production simulations for 1000 ns with the NPT ensemble with a time interval at 25 fs. The temperature and pressure were maintained at 303 K and 1 bar, using velocity rescale (Bussi et al., 2007) and stochastic cell rescale (Bernetti and Bussi, 2020) method, separately. The CG-MD simulation trajectory was analyzed using Gromacs tools and VMD (Humphrey et al., 1996). The initial structure, topology, and MD parameters of the system were provided as supporting files.
After CG-MD, a particular dimer cluster from the trajectory was extracted by gmx clustsize utility with a cut-off length of 0.41 nm, and then converted into fine-grained atomistic structure using backward scripts (Wassenaar et al., 2014). The dimer topology was generated using ACPYPE script (Sousa da Silva and Vranken, 2012) under general amber force field (GAFF) (Wang et al., 2004). The cluster structure was then centered in a periodic boundary condition box with a side length of 10 nm and then filled with TIP3P water molecules (Jorgensen et al., 1983). Then the system underwent an energy minimization stage using the conjugate gradient method for 2000 steps and then went through the production simulation for 40 ns under NPT ensemble with a time interval of 2 fs. The temperature and pressure were maintained at 298.15 K and 1 bar, using velocity rescale (Bussi et al., 2007) and stochastic cell rescale (Bernetti and Bussi, 2020) method, separately. The snapshot of the dimer cluster was taken using VMD (Humphrey et al., 1996).
The interactions among dimer molecules were initially analyzed and sketched by LigPlot+ (Laskowski and Swindells, 2011). Then the molecular structure of dimer cluster was optimized with PM6 theoretical method with DFT-D3 dispersion (Grimme et al., 2010) using Gaussian 09C software package (Frisch et al., 2016). Then the interactions between the molecules were analyzed by the independent gradient model based on Hirshfeld partition (IGMH) method (Lu and Chen, 2022) using Multiwfn (Lu and Chen, 2012) and illustrated with VMD (Humphrey et al., 1996).
3 Results and discussions
3.1 Formation of GB by the reaction of GP and AAs in feces of rats in vitro
In the previous work (Zhang et al., 2023), we found that the color of rat feces is blue-purple after administration of GE, which was speculated that GP metabolized from GE may react with primary amino-containing compounds in the large intestine of rats by the cross-linking coloring reaction. In fact, we confirmed that GP transformed from GE by β-glucosidase can react with nitrogen-containing harmful metabolites such as methylamine in the intestine of rats into GB. However, there are abundant and diverse AAs in the large intestinal (Chen et al., 2020), which are also primary amino-containing compounds. Therefore, we speculated that the produced GP in the large intestine of rats can also react with AAs by cross-linking coloring reaction to form GB after administration of GE.
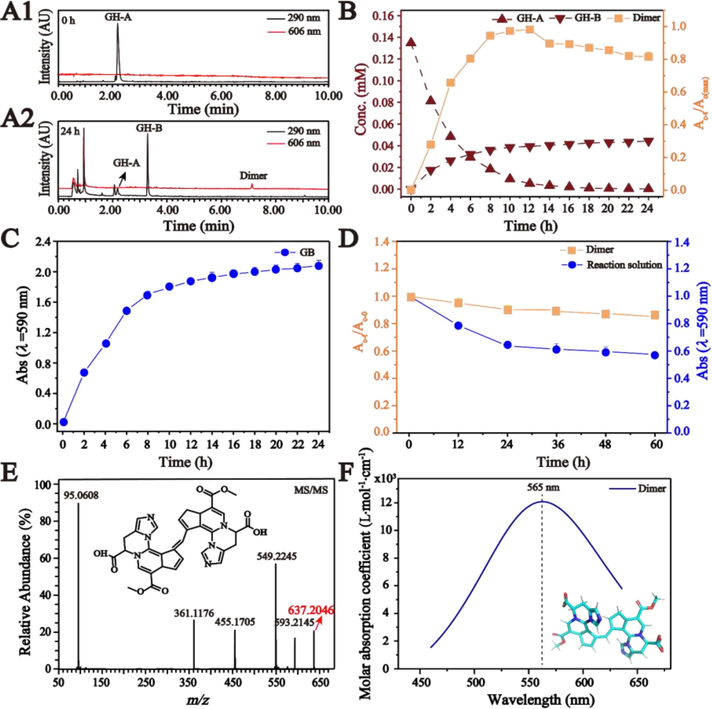
We systematically carried out a series of experiments on the determination of AAs in rat feces and the cross-linking coloring reaction between AAs in rat feces and GE or GP in vitro. The content of AAs in the feces of rats was detected using UPLC-PDA with pre-column derivatization of phenyl isothiocyanate. As shown in Fig. 1A1-A3, 14 AAs in the feces of rats (Fig. 1A3) were determined by comparison with blank (Fig. 1A1) and standard samples (Fig. 1A2). Their contents were distributed in Fig. 1B, which ranges from 28 to 1445 µg/g in feces. Then, the rat fecal extract was reacted with GE and GP, respectively. The results demonstrated that there was no change in the rat fecal extract after reacting with GE for 12 h, but the color of the reaction solution changed from yellow to blue-purple after reacting with GP (Fig. 1C), which had a strong absorption peak at 590 nm (Fig. 1D). Based on these results, we supposed that GP reacted with AAs in rat feces to form GB by cross-linking coloring reaction. To further verify this conjecture, these 14 AAs in rat feces were classified into acidic amino acids (AAAs), neutral amino acids (NAAs), and basic amino acids (BAAs), which were then respectively subjected to cross-linking coloring reaction with GE or GP in vitro. The results were summarized in Fig. 1E and Fig. S1. The color of the reacted solution noticeably varied in blue-purple (Fig. S1) after the reaction between GP and AAs except for Pro as a secondary amine. Furthermore, no change was found in the incubated solution of GE and AAs, which means that only its aglycone GP can react with AAs containing primary amino to produce GB by cross-linking coloring reaction.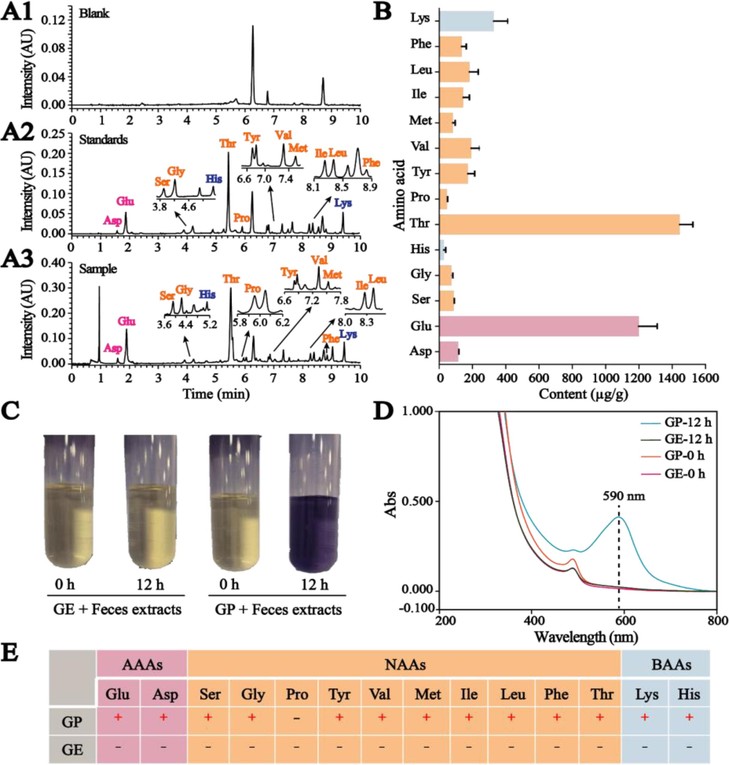
UPLC chromatograms of (A1) blank sample solution, (A2) AAs standard solution, and (A3) fecal sample solution. (B) Column diagram of AAs content in feces of rats. (C) Photographs of rat fecal extracts before and after reaction with GE/GP for 12 h. (D) UV–vis spectra of rat fecal extracts before and after reaction with GE/GP for 12 h. (E) Evaluation of the reactivity between GP or GE and 14 AAs in rat feces.
3.2 Basic units formation and analysis during the reaction of GP with representative AAs
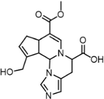
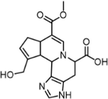
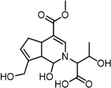
In the simulated intestinal environment (Nugent et al., 2001), Glu, Thr, and His were respectively selected from the AAAs, NAAs, and BAAs detected in rat feces to study the reaction mechanism of GB. During their reaction with GP in phosphate buffer saline (PBS, pH 7.35) and acetic acid-sodium acetate buffer solution (pH 6.0) at 37 °C for 12 h, the intermediates as basic units were detected by UPLC-PDA, which were purified and characterized according to section “2.6”. By LC-MS/MS and NMR, the chemical structures of basic units were identified. The quasi-molecular ions of genihistindine A (GH-A), genihistindine B (GH-B), genithreonine (GT), and geniglutamic (GG) as the basic units were detected by LC-MS/MS at m/z 346.16 [M + H]+, 346.16 [M + H]+, 310.13 [M + H–H2O]+, and 356.13 [M + H]+, whose formulae can be deduced as C17H19N3O5, C17H19N3O5, C15H21NO7, and C16H21NO8, respectively (Fig. 2A and Fig. S2). Shown in Fig. 2B, Fig. S3-S5, and Table 1 were NMR spectra and data of basic units GH-A, GH-B, and GT except for GG due to preference of GB formation. By taking GH-A as an example, the 1H NMR spectrum showed 15 proton resonance signals, including four olefinic protons at δH 7.44 (1H, s), 5.96 (1H, s), 8.01 (1H, s), and 6.93 (1H, s) (Fig. 2B). Seventeen carbon signals were demonstrated in the 13C NMR spectrum (Fig. S3A), from which the ester carbonyl at δC 170.5, carboxyl carbon at δC 176.5, and seven olefinic carbons at δC 146.3, 140.1, 133.9, 130.7, 126.6, 122.6, and 105.5 were observed. 1H–1H COSY suggested the existence of '–CH(9)–CH(8)–CH(4)–CH2(5)–CH(6)-' (Fig. S3B). The presence of twelve carbons, consisting of four olefinic and eight aliphatic carbons, was revealed by the HSQC spectrum (Fig. S3C). Among them, δC/δH at 51.4/3.66 (3H, s) and 58.6/4.17, 4.24 (each 1H, d, J = 13.8 Hz) indicated the existences of –OCH3 and –CH2OH moieties, respectively. In the HMBC spectrum (Fig. S3D), the correlations of H-9 (δH 5.59) with C-11 (δC 133.9) and C-4 (δC 33.3), H-16 (δH 4.28) with C-9 (δC 64.1), and H-2 (δH 7.44) with C-16 (δC 62.1) confirmed the connected position between GP and His was C-9 and N-10. Moreover, correlations were found involving the ester carbonyl (δC 170.5) with H-18 (δH 3.66) and C-13 (δC 122.6) with H-11 (δH 8.01) and H-15 (δH 3.32 and 3.22). The detailed NMR data of GH-A were shown in Table 1, which was identified as a new compound, named as Genihistidine A. Therefore, we understood the molecular structure of GH-A as shown in Fig. 2C. Similarly, GH-B and GT were also identified as new compounds and named as Genihistidine B and Genithreonine, respectively (Fig. S4-S5). δ in ppm, “−”: There was no hydrogen or carbon at that position.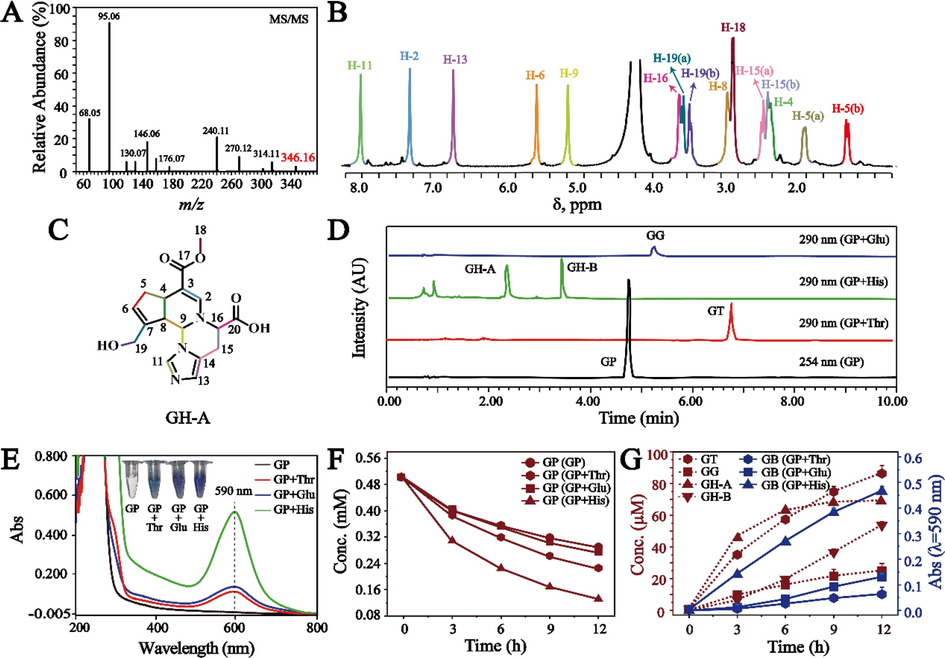
(A) MS/MS spectrum of GH-A. (B) 1H NMR spectrum of GH-A. (C) The chemical structure of GH-A. (D) UPLC chromatograms of basic units produced from the reaction between GP and representative AAs. (E) UV–vis spectra and photographs of the reacted solution between GP and representative AAs for 12 h. (F) Reaction kinetic curves of GP along with time in the reacted solution at pH 7.35. (G) Reaction kinetic curves of basic units and GB formed along with time in the reacted solution at pH 7.35.
Position
GH-A (Genihistidine A)
GH-B (Genihistidine B)
GT (Genithreonine)
δH (J in Hz)
δC
δH (J in Hz)
δC
δH (J in Hz)
δC
2
7.44 (1H, s)
146.3
7.69 (1H, s)
149.3
7.54 (1H, s)
139.7
3
−
105.5
−
99.5
−
99.6
4
3.25 (1H, m, overlapped)
33.3
3.08 (1H, dd, 7.2, 14.4)
37.9
3.09 (1H, dd, 8.4, 17.4)
37.2
5
2.82 (1H, d, 16.2)
2.33 (1H, d, 16.2)38.3
2.75 (1H, ddd, 2.4, 7.2, 16.2)
2.16 (1H, dd, 7.8, 16.2)38.6
2.70 (1H, dd, 8.4,15.6)
1.78 (1H, dd, 12.6, 12.6)39.0
6
5.96 (1H, s)
130.7
6.01 (1H, s)
131.8
5.71 (1H, s)
124.4
7
−
140.1
−
144.6
−
146.7
8
3.72 (1H, m)
45.7
2.62 (1H, dd, 7.2, 7.2)
46.9
2.09 (1H, dd, 8.4, 8.4)
45.0
9
5.59 (1H, s)
64.1
4.35 (1H, d, 7.8)
51.5
4.22 (1H, d, 8.4)
89.1
10
−
−
−
130.6
4.02 (1H, d, 6.6)
64.9
11
8.01 (1H, s)
133.9
−
−
−
171.2
12
−
−
7.71 (1H, s)
134.6
4.17 (1H, m)
76.9
13
6.93 (1H, s)
122.6
−
−
1.40 (3H, d, 6.0)
19.2
14
−
126.6
−
124.5
−
167.5
15
3.32 (1H, d, 16.2)
3.22 (1H, m, overlapped)22.8
3.19 (1H, d, 15.6)
2.99 (1H, ddd, 1.8, 6.0, 15.6)24.6
3.59 (3H, s)
50.3
16
4.28 (1H, s)
62.1
4.37 (1H, d, 4.8)
64.8
4.04 (1H, d, 15.0)
4.10 (1H, d, 15.0)59.6
17
−
170.5
−
171.7
−
−
18
3.66 (3H, s)
51.4
3.67 (3H, s)
51.1
−
−
19
4.17 (1H, d, 13.8)
4.24 (1H, d, 13.8)58.6
4.24 (2H, s)
59.8
−
−
20
−
176.5
−
177.3
−
−
(A1) UPLC chromatograms of GH-A in buffer solution at 0 h. (A2) UPLC chromatograms of dimer and GH-B produced from GH-A in buffer solution at 24 h. (B) Reaction kinetic curves of GH-A, GH-B, and dimer produced from the reacted solution of GH-A at pH 7.35 along with the time (Ac-t/Ac(max), the peak area of dimer divided by the maximum peak area at different reaction time; Ac-t, the peak area of dimer (c) at the different time (t)). (C) Reaction kinetic curves of GB produced from GH-A in buffer solution at pH 7.35 along with time. (D) Reaction kinetic curves of dimer and the absorbance of the reacted solution with pH 7.35 at 590 nm along with time (Ac-t/Ac-0, the peak area of dimer at different reaction time divided by that at 0 h; Ac-t, the peak area of the dimer (c) at the different time (t)). (E) LC-MS/MS analysis of the dimer. (F) UV–vis spectrum of the dimer calculated by DFT (The inset diagram is the structure of the dimer).
GH-A and GH-B as basic units were produced and monitored in the reacted solution of GP and His, GG in the reacted solution of GP and Glu, and GT in the reacted solution of GP and Thr (Fig. 2D). After these AAs were mixed with GP, the color of the reacted solution changed significantly from colorless to blue or purple, which were observed to have a strong absorption peak at 590 nm by UV–vis, implying the production of GB (Fig. 2E). In this process, the concentration of GP in the reacted solution gradually decreased with the prolongation of the reaction time, which was exacerbated after addition of the tested AAs, as shown in Fig. 2F and Fig. S6A. These results indicated that GP in reacted solution is not only involved in the cross-linking coloring reaction with AA to form GB, but is also susceptible to degradation. Moreover, the content of GH-A, GH-B, GT, GG, and GB produced in the solution increased along with time (Fig. 2G and Fig. S6B).
3.3 Dimer formation by the covalent polymerization from basic unit GH-A
By taking the GB produced by GP and His as an example, the cross-linking coloring mechanism between GP and AA was further studied. No sooner GH-A has been subjected to buffer solution than GH-A transforms into GH-B and dimer, which was shown in Fig. 3A1-A2. By employing UPLC-PDA and UV–vis, the concentration of GH-A gradually decreased to react exhaustively, which was accompanied by the formation of GH-B, dimer, and GB in the reacted solution at pH 7.35 (Fig. 3B-C and Fig. S7). The same phenomenon also happened in buffer solution at pH 6.0 (Fig. S8). However, when GH-B was exposed to the buffer solution, it remained stable over time and showed no reaction activity (Fig. S9), indicating that GH-B is not involved in the formation of the dimer or GB.
To obtain more dimers, we conducted research using different reaction ratios of GP and His. As shown in Fig. S10, the highest yield of dimers was obtained when the reaction ratio of GP and His was 1:5 and the reaction time was 24 h. Then, the produced dimers were purified and enriched by small-pore resin column chromatography and preparative HPLC. Subsequently, it was rapidly mixed with a buffer solution, and its relative content and absorbance of the reacted solution at 590 nm were determined as the reaction time extended. The result indicated a decrease in both relative content of dimer and absorbance (Fig. 3D and Fig. S11), which suggested that the dimers could potentially transform into GB through self-assembly (Rothenbuhler et al., 2018). Furthermore, LC-MS/MS detected quasi-molecular ion of the dimer at m/z 637.2046 in positive ion mode (Fig. S12), corresponding to [C33H29N6O8]+, whose fragmentation pathways were proposed to happen the successive loss of CO2 and the successive loss of C5H6N2 according to the observed fragmentation ions at m/z 593.2145, 549.2245, 455.1705, and 361.1176 (Fig. 3E and Fig. S13). Moreover, the ultraviolet absorption spectrum predicted by density functional theory (DFT) showed the maximum absorption wavelength of the dimer at 565 nm (Fig. 3F), which is basically consistent with the experimental results. Therefore, the chemical structure of the tested dimer produced from GP and His was proved, as shown in Fig. 3E.
3.4 Supramolecular structural characterization and coarse-grained molecular dynamics (CG-MD) simulations of GB
The structure of GB was analyzed by using Fourier transform infrared spectroscopy (FT-IR), NMR spectra, powder X-ray diffraction, and Cryogenic transmission electron microscopy (Cryo-TEM). Spectrograms from FT-IR measurements of GB, GP, and His were shown in Fig. 4A. The peaks at 3010 cm−1 (stretching vibration for N–H), 1634 cm−1 (in-plane bending vibration for N–H), and 1414 cm−1 (stretching vibration for C-N) in His disappeared in GB, suggesting that the –NH2 group in His reacted with GP (Li et al., 2014b). The absorption peaks at 3401 cm−1 and 3245 cm−1 in GP disappeared, which means that –OH might be replaced after reaction with His. The stretching vibration of C = O at 1682 cm−1 and C = C at 1622 cm−1 in GP red-shifted to the position of 1720 cm−1 and 1627 cm−1 in GB, respectively, which was responsible for the extension of the conjugate chain during the reaction (Gao et al., 2021). The presence of peaks at 769 cm−1 and 622 cm−1 corresponds to the in-plane bending vibration of C–H, suggesting the potential existence of aromatic structures in GB (Gao et al., 2021). Besides, the peak at 1138 cm−1 was attributed to the stretching vibration of C-N in GB. The broad and blunt peak was observed at 3434 cm−1, indicating the existence of hydrogen bond interactions in GB. As depicted in Fig. 4B, eight groups of carbon resonance signals were detected in the solid-state 13C NMR spectrum of GB. These signals were assigned to methylene carbon signal at ẟC 24.8 (h, –CH2-), methyne carbon signals at ẟC 31.5 (g, –CH) and 74.3 (e, –CH-N), methyl carbon signal at ẟC 53.8 (f, –OCH3), olefinic carbon signals at ẟC 120.2 (d) and 135.9 (c), and carbonyl carbon signals at ẟC 166.7 (b, –COOCH3) and 173.6 (a, –COOH), respectively (Raghu et al., 2008; Tsutsumiuchi et al., 2021). This information indicates that GB may be a supramolecular assembly with repeated dimers, whose carbon resonance signals matched with that of the dimer. Furthermore, the powder X-ray diffraction pattern gave that GB exhibited typical X-ray diffraction peaks, suggesting the formation of a crystal structure with high crystallinity (Fig. 4C). The peaks at 0.33 and 0.36 nm revealed that there may be π-π stacking in GB (Li et al., 2014a; Meredith and Sarna, 2006), while the peak at 0.28 nm may be attributed to the intermolecular hydrogen bonds in GB (Bella et al., 2021). Fig. 4D showed the Cryo-TEM image of GB, which demonstrated that GB was supramolecular nanoparticles with an average diameter of 2.17 nm. In addition, GB in water showed a strong negative charge with a zeta potential value centered at 15.6 mV.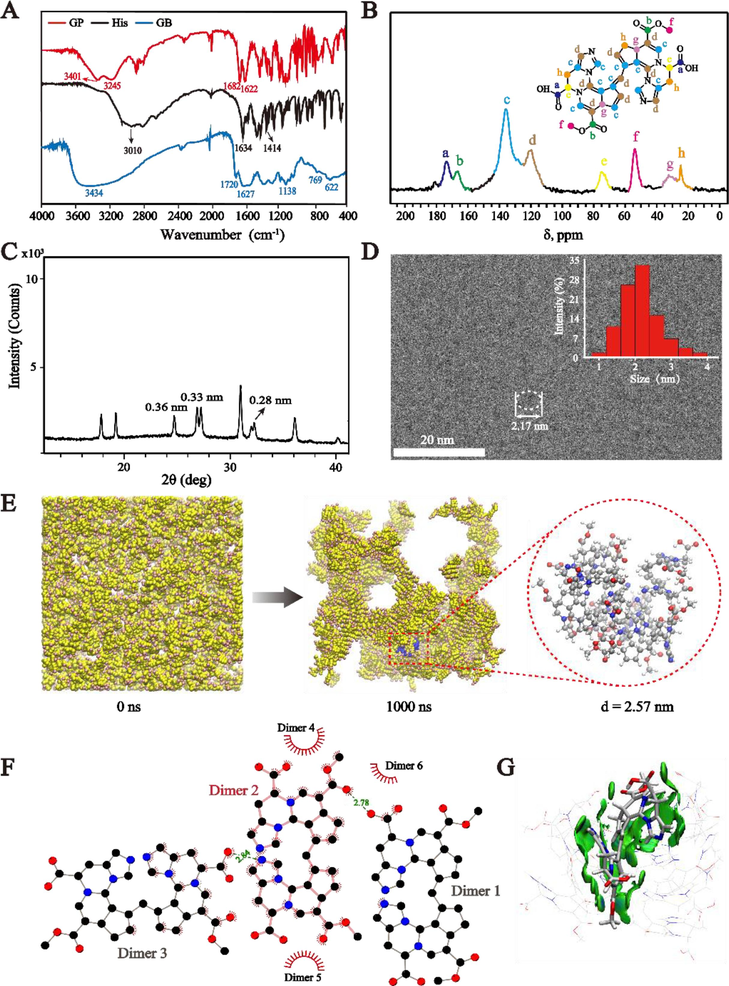
(A) FT-IR spectra of GP, His, and GB. (B) 13C NMR spectra of GB. (C) Powder X-ray diffraction spectrum analysis of GB. (D) Cryo-TEM image of GB (The inset diagram is the size distribution of GB particles). (E) Coarse-grained molecular dynamics of self-assembly process from dimers into GB. (F) Binding mode between dimers (The red spoked arcs represent the hydrophobic interactions, the green dashed lines represent the intermolecular hydrogen bonding. The atoms were color-coded as follows: C, black; O, red; N, blue.). (G) The detailed interactions between dimers within the GB (The blue area represents π-π interactions and hydrogen bonds and the green area represents van der Waals interactions). (For interpretation of the references to color in this figure legend, the reader is referred to the web version of this article.)
To gain insight into atomistic mechanism, CG-MD simulations were conducted to visualize the clusterization process and intermolecular interactions of dimers in GB. As shown in Fig. 4E and Fig. S14, the randomly placed dimer molecules aggregated to form connected spherical clusters after 1000 ns MD simulation. The typical cluster structure (colored blue) was then extracted and fine-grained into an atomistic structure and showed a stable spherical cluster structure during 40 ns MD simulation with a diameter of 2.57 nm, which is consistent with the results from Cryo-TEM (Fig. 4D), indicating that the established MD model is capable to describe the structure and formation process of GB derived from dimers. Then, the intermolecular interactions between dimers in GB were analyzed. The hydrogen bonds and hydrophobic interactions (including aromatic π-π stacking) were observed between adjacent dimers (Fig. 4F), composed of prominently van der Waals interactions and π-π interactions (colored in green) and hydrogen bonds (colored in blue) (Fig. 4G). The π-π interactions mainly derive from the contacts between the aromatic rings, and the hydrogen bonds were formed through the interactions between amide and carbonyl, carboxyl, hydroxyl groups, and nitrogen atoms.
3.5 The cross-linking coloring reaction mechanism of GB produced by GP and AAs
In summary, the reaction mechanism of GB formed by GP and His through cross-linking coloring reaction was concluded in Fig. 5. As the aglycone of GE, GP is obtained by deglycosylation in the presence of β-glucosidase (Li et al., 2019b). Due to the extremely unstable hemiacetal structure in GP, it readily undergoes spontaneous conversion into a dialdehyde structure that can react with His to produce basic units GH-A and GH-B through nucleophilic addition–elimination reaction (Tsutsumiuchi et al., 2021; Zhang et al., 2023). Interestingly, a series of chemical reactions happen to GH-A, such as covalent oxidative polymerization, resulting in the spontaneous formation of GH-B and dimer (Tsutsumiuchi et al., 2021). However, GH-B remains stable without reaction activity. Then, GB is formed from dimer by non-covalent self-assembly driven by hydrogen bonding, hydrophobic interactions, and van der Waals interactions.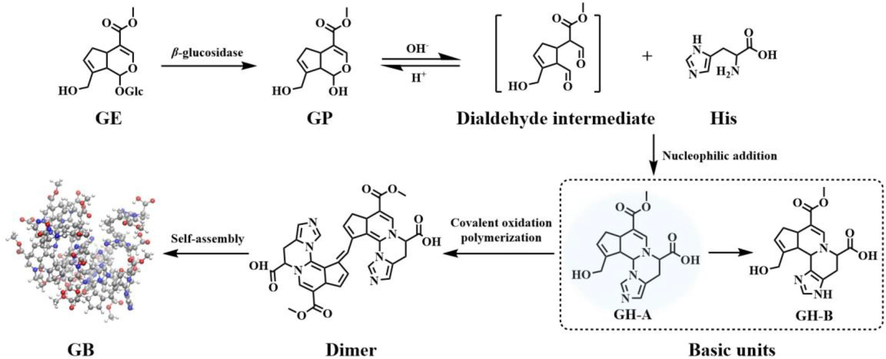
The cross-linking coloring reaction mechanism of GB formed by GP and His.
By introducing cross-linking coloring reaction between GP and His as an example, the mechanism of GB formation was basically clarified, which is important and meaningful for studying GB production by GP and AAs containing primary amino groups.
4 Conclusion
Based on the formation of GB in the feces of rats, we demonstrated that GP can react with AAs containing primary amino groups detected in rat feces to produce GB by cross-linking coloring reaction in vitro. By taking His as an example, we unveiled that GB formation underwent covalent polymerization to produce GH-A as the basic unit and form dimer, which subsequently self-assembles into supramolecular assemblies of spherical GB nanoparticles with an average diameter of 2.17 nm. Through MD simulation, intermolecular non-covalent interactions were found in GB, including hydrogen bonds, hydrophobic interactions, and van der Waals interactions. This study provides novel insights into the discovery of supramolecular self-assemblies formed by GP and AAs and the industrial preparation of natural blue pigment.
CRediT authorship contribution statement
Xiaoyu Zhang: Writing – original draft, Methodology, Investigation. Ruihu Zhang: Writing – original draft, Methodology, Investigation. Rui Li: Validation, Methodology. Jiaxing Zhang: Investigation, Conceptualization, Software. Yuefei Wang: Writing – review & editing, Supervision, Funding acquisition. Xin Chai: Writing – review & editing, Supervision, Funding acquisition.
Acknowledgments
This work was supported by the Science and Technology Project of Haihe Laboratory of Modern Chinese Medicine (22HHZYSS00007) and the Natural Science Foundation of China (81873192 & 22278306).
Declaration of Competing Interest
The authors declare that they have no known competing financial interests or personal relationships that could have appeared to influence the work reported in this paper.
References
- GROMACS: High performance molecular simulations through multi-level parallelism from laptops to supercomputers. SoftwareX. 2015;1–2:19-25.
- [Google Scholar]
- Intermolecular Forces Driving Hexamethylenetetramine Co-Crystal Formation, a DFT and XRD Analysis. Molecules. 2021;26:5746.
- [Google Scholar]
- Absorptive transport of amino acids by the rat colon. Am J Physiol-Gastr L. 2020;318:G189-G202.
- [Google Scholar]
- Improved Parameters for the Martini Coarse-Grained Protein Force Field. J Chem Theory Comput. 2013;9:687-697.
- [Google Scholar]
- Frisch, M.J., Trucks, G.W., Schlegel, H.B., Scuseria, G.E., Robb, M.A., Cheeseman, J.R., Scalmani, G., Barone, V., Petersson, G.A., Nakatsuji, H., Li, X., Caricato, M., Marenich, A., Bloino, J., Janesko, B.G., Gomperts, R., Mennucci, B., Hratchian, H.P., Ortiz, J.V., Izmaylov, A.F., Sonnenberg, J.L., Williams-Young, D., Ding, F., Lipparini, F., Egidi, F., Goings, J., Peng, B., Petrone, A., Henderson, T., Ranasinghe, D., Zakrzewski, V.G., Gao, J., Rega, N., Zheng, G., Liang, W., Hada, M., Ehara, M., Toyota, K., Fukuda, R., Hasegawa, J., Ishida, M., Nakajima, T., Honda, Y., Kitao, O., Nakai, H., Vreven, T., Throssell, K., Montgomery Jr., J.A., Peralta, J.E., Ogliaro, F., Bearpark, M., Heyd, J.J., Brothers, E., Kudin, K.N., Staroverov, V.N., Keith, T., Kobayashi, R., Normand, J., Raghavachari, K., Rendell, A., Burant, J.C., Iyengar, S.S., Tomasi, J., Cossi, M., Millam, J.M., Klene, M., Adamo, C., Cammi, R., Ochterski, J.W., Martin, R.L., Morokuma, K., Farkas, O., Foresman, J.B., Fox, D.J., 2016. Gaussian 09, Revision C.01 ed, Wallingford CT.
- Preparation and Characterization of Water-Insoluble Gardenia Blue Pigment. Materials (Basel). 2021;14:6594.
- [Google Scholar]
- A consistent and accurate ab initio parametrization of density functional dispersion correction (DFT-D) for the 94 elements H-Pu. J Chem Phys. 2010;132:154104
- [Google Scholar]
- Biochemical characterization of a novel glucose-tolerant GH3 β-glucosidase (Bgl1973) from Leifsonia sp. ZF2019. Appl. Microbiol. Biot.. 2022;106:5063-5079.
- [Google Scholar]
- Multiscale Approach to Investigate Self-Assembly of Telodendrimer Based Nanocarriers for Anticancer Drug Delivery. Langmuir. 2015;31:4270-4280.
- [Google Scholar]
- Comparison of simple potential functions for simulating liquid water. J Chem Phys. 1983;79:926-935.
- [Google Scholar]
- Rapid analysis of phenyl isothiocyanate derivatives of amino acids present in Czech meads. J Chromatogr A. 2021;1644:462134
- [Google Scholar]
- LigPlot+: Multiple Ligand-Protein Interaction Diagrams for Drug Discovery. J Chem Inf Model. 2011;51:2778-2786.
- [Google Scholar]
- Li, M., Duan, C., Liu, Z.G., Hu, Y.H., Wang, M.T., Wang, X.C., 2014b. Study on the synthesis of zinc histidine and its thermal stabilizing effect on PVC (in Chinese). China Plastics Industry 42, 93-96+126.
- Self-assembly mechanism of 1,3:2,4-di(3,4-dichlorobenzylidene)-D-sorbitol and control of the supramolecular chirality. Langmuir. 2014;30:13422-13429.
- [Google Scholar]
- Role of intestinal microbiota-mediated genipin dialdehyde intermediate formation in geniposide-induced hepatotoxicity in rats. Toxicol Appl Pharmacol. 2019;377:114624
- [Google Scholar]
- Antidepressant-like effects of dietary gardenia blue pigment derived from genipin and tyrosine. Food Funct. 2019;10:4533-4545.
- [Google Scholar]
- Self-Assembly of Peptide Hierarchical Helical Arrays with Sequence-Encoded Circularly Polarized Luminescence. Nano Lett. 2021;21:6406-6415.
- [Google Scholar]
- Independent gradient model based on Hirshfeld partition: A new method for visual study of interactions in chemical systems. J Comput Chem. 2022;43:539-555.
- [Google Scholar]
- Universal Solvation Model Based on Solute Electron Density and on a Continuum Model of the Solvent Defined by the Bulk Dielectric Constant and Atomic Surface Tensions. J Phys Chem B. 2009;113:6378-6396.
- [Google Scholar]
- The MARTINI Force Field: Coarse Grained Model for Biomolecular Simulations. The Journal of Physical Chemistry B. 2007;111:7812-7824.
- [Google Scholar]
- The physical and chemical properties of eumelanin. Pigment Cell Res. 2006;19:572-594.
- [Google Scholar]
- Study of the reaction between genipin and amino acids, dairy proteins, and milk to form a blue colorant ingredient. Food Res Int.. 2022;157:111240
- [Google Scholar]
- Intestinal luminal pH in inflammatory bowel disease: possible determinants and implications for therapy with aminosalicylates and other drugs. Gut. 2001;48:571-577.
- [Google Scholar]
- Synthesis and characterization of novel polyurethanes based on N1, N4-bis[(4-hydroxyphenyl)methylene]succinohydrazide hard segment†. J Appl Polym Sci.. 2008;110:2315-2320.
- [Google Scholar]
- Molecular dynamics simulation: a tool for exploration and discovery using simple models. J Phys Condens Matter. 2014;26:503104
- [Google Scholar]
- Self-assembly of a redox-active bolaamphiphile into supramolecular vesicles. Org Biomol Chem.. 2018;16:6886-6889.
- [Google Scholar]
- Ab Initio Calculation of Vibrational Absorption and Circular Dichroism Spectra Using Density Functional Force Fields. J Phys Chem. 1994;98:11623-11627.
- [Google Scholar]
- Molecular Structure of Gardenia Blue Pigments by Reaction of Genipin with Benzylamine and Amino Acids. J Agr Food Chem. 2021;69:3904-3911.
- [Google Scholar]
- Development and testing of a general amber force field. J Comput Chem. 2004;25:1157-1174.
- [Google Scholar]
- Dietary Blue Pigments Derived from Genipin, Attenuate Inflammation by Inhibiting LPS-Induced iNOS and COX-2 Expression via the NF-κB Inactivation. Plos One. 2012;7:e34122.
- [Google Scholar]
- Going Backward: A Flexible Geometric Approach to Reverse Transformation from Coarse Grained to Atomistic Models. J Chem Theory Comput.. 2014;10:676-690.
- [Google Scholar]
- Balanced basis sets of split valence, triple zeta valence and quadruple zeta valence quality for H to Rn: Design and assessment of accuracy. Phys. Chem. Chem. Phys.. 2005;7:3297-3305.
- [Google Scholar]
- Application of molecular dynamics simulation in self-assembled cancer nanomedicine. Biomater Res.. 2023;27:39.
- [Google Scholar]
- Study on the preparation of gardenia blue and its antioxidant activity (in Chinese) Journal of Yunnan Minzu University (natural Sciences Edition). 2014;23:243-247.
- [Google Scholar]
- Unraveling the mechanism of the supramolecular self-assembly during the in vivo metabolism of geniposide from Chinese medicine. Materials & Design. 2023;225:111546
- [Google Scholar]
Appendix A
Supplementary data
Supplementary data to this article can be found online at https://doi.org/10.1016/j.arabjc.2024.106048.
Appendix A
Supplementary data
The following are the Supplementary data to this article:Supplementary Data 1
Supplementary Data 1
Supplementary Data 2
Supplementary Data 2
Supplementary Data 3
Supplementary Data 3
Supplementary Data 4
Supplementary Data 4


