

Translate this page into:
A glucometer-colorimetric dual mode biosensor for point-of-care testing of cardiac troponin I
*Corresponding authors: E-mail addresses: 17800872@hebmu.edu.cn (L. Niu), kk900825@hebmu.edu.cn (Kang Kai)
-
Received: ,
Accepted: ,
Abstract
cTnI is considered the primary marker for the diagnosis of Acute myocardial infarction (AMI).. At present, cTnI relies on laboratory testing, which requires technical personnel and specialized equipment. This strategy proposes a dual-mode sensor based on a blood glucose meter and colorimetry to achieve portable, rapid, and accurate measurement of cTnI. The feasibility of this sensor was validated using UV spectrophotometry and polyacrylamide gel electrophoresis. Under optimal conditions, the linear ranges for the glucometer and colorimetric modes were 0.01 ngmL-1 to 20.0 ngmL-1 and 0.03 ngmL-1 to 15.0 ngmL-1, with detection limits of 0.001 ngmL-1 and 0.005 ngmL-1, respectively. The dual-mode sensor exhibits high sensitivity and selectivity, enabling rapid portable dual-mode detection. This method has been successfully applied for detecting cTnI in human serum, indicating significant potential for clinical applications.
Keywords
Cardiac troponin I (cTnI)
Catalytic hairpin assembly (CHA)
Dual mode
Point-of-care testing

1. Introduction
According to data from the World Health Organization, approximately 23.3 million people are expected to die from cardiovascular diseases by 2030 [1,2]. Among them, acute myocardial infarction (AMI), as the most common cardiovascular disease in China, is one of the significant public health issues, posing a serious threat to the health and life safety of the Chinese population. Electrocardiogram (ECG) is a widely used diagnostic tool for detecting heart attacks, but it lacks sensitivity for certain types of infarctions, leading to a high misdiagnosis rate [3–6]. The guidelines for AMI recommend the use of biomarkers for cardiac injury in diagnosis, among which the cardiac troponin family (cTns) serves as a marker for heart attacks, showing high specificity [7,8]. Currently, commonly used laboratory diagnostic biomarkers for AMI are cTnT and cTnI, with cTnI having a unique amino-terminal sequence and higher myocardial specificity. The concentration of cTnI in the blood of healthy individuals is minimal, but when myocardial cell damage occurs during a heart attack, cTnI is rapidly released into the blood and remains elevated for a long time, making it a the preferred important biomarker for diagnosing acute myocardial infarction (AMI) [9]. At present, cTnI primarily relies on laboratory detection methods such as enzyme-linked immunosorbent assay (ELISA) [10], dioimmunoassay, etc [11]. These techniques require complex sample pretreatment, dependence on skilled technical personnel, and high requirements for laboratory equipment. Therefore, the development of a simple, portable, highly specific, and sensitive biosensor is necessary and crucial [12, 13].
Portable device detection and colorimetric detection have garnered widespread attention due to their convenience in practical analytical applications, both falling under the category of point-of-care testing (POCT) for immediate detection. POCT has long been the focus of research in biosensor development. Under resource-limited conditions, utilizing portable and rapid devices for real-time monitoring of biomarkers, bacteria [14-16], and other substances is crucial for early disease detection, daily health monitoring, and management [17–20]. Glucometers are ubiquitous POCT devices known for their small size, portability, simplicity of use, and relatively low cost, providing accurate quantitative results [21,22]. Recent studies have innovatively utilized single-stranded DNA (ssDNA) functionalized enzyme conjugates to modify the traditional use of glucometers, successfully establishing relationships between targets and glucose for quantitative detection of protein biomarkers and small molecule toxins [23,24]. Colorimetric detection, employing 3,3,5,5-tetramethylbenzidine (TMB) as a common chromogenic substrate, produces visible blue changes upon reaction with oxidases [25], making it suitable for colorimetric detection and showing potential for POCT applications [26–30]. Despite the significant advantages of POCT in rapid on-site testing, single-mode POCT methods face challenges such as large result errors and the occurrence of false positives or negatives. Implementing dual-mode detection using two POCT methods to detect the same biomarker not only achieves ultra-sensitive detection but also offers potential solutions to the problem of inaccurate detection results. The prerequisite for constructing dual-mode detection sensors lies in the precise identification of biomarkers. While biological antibodies exhibit excellent specificity and efficiency, their strict storage conditions and high costs limit their application.
Nanomaterials possess advantages such as a large specific surface area and good biocompatibility, which make them widely used in the field of detection [31–34]. For instance, Murtaza Hasan et al. [33], were the first to achieve large-scale characterization of low-abundance proteins on Fe2C@C nanoparticles, providing significant evidence for the application of magnetic nanoparticles as biomedical markers and novel functional probes. Shu et al. [31], utilized surface-functionalized Fe2C nanoparticles with different functional groups to successfully extract low molecular weight proteins from cell supernatants, aiding in the identification of oncogenic biomarkers for early disease detection. Magnetic nanoparticles are nanomaterials composed of magnetic elements and their compounds, capable of rapidly and efficiently separating target substances such as cells, proteins, and nucleic acids. They can not only serve as enzyme carriers but also help to purify the detection system during reactions. Therefore, this paper applies magnetic nanobeads to the construction of sensors.
Aptamers, also known as “artificial antibodies” [35], are single-stranded DNA or RNA molecules capable of specific binding to target molecules, obtained through the Systematic Evolution of Ligands by Exponential Enrichment (SELEX) technology from synthetically generated combinatorial oligonucleotide libraries. Due to their small size, low molecular weight, and low cost, aptamers can be synthesized rapidly and in bulk, with simple and controllable preparation compared to antibodies. They can be modified with various probes as signal sources according to experimental needs [36–39].
The key to constructing a dual-mode detection sensor is to enhance sensitivity. Amplification of the detection signal is crucial for improving sensitivity, and catalytic hairpin assembly (CHA) is a commonly used method for signal amplification. CHA is a thermostatic, enzyme-free amplification technique that utilizes nucleic acid endonucleases to recognize and cleave specific DNA sequences containing certain base sequences [40], thereby achieving cyclic amplification of the signal. The challenge in constructing a dual-mode sensor lies in converting the detection signal. Glucometers quantify glucose concentration by measuring electrical current, while colorimetric sensors quantify biomarkers by assessing color intensity. Converting the concentration of cTnI into both glucose concentration and color intensity is the focus of this study. We propose to use endonucleases to cleave double-stranded DNA at specific recognition sites, releasing DNA-Invertase and DNA-horseradish peroxidase (HRP). The DNA-Invertase converts sucrose into glucose for rapid detection by the glucometer, while DNA-HRP induces 3,3’,5,5’-Tetramethylbenzidine (TMB) color change for colorimetric detection.
Building upon the methodologies described above, which encompass the specificity recognition of aptamers, catalytic hairpin assembly, signal amplification facilitated by endonucleases, and enzymatic signal conversion, we have engineered a dual-mode sensor utilizing glucometer-colorimetric detection for the precise quantification of cTnI. This sensor platform boasts straightforward operation, exceptional sensitivity, and the capacity for rapid, unlimited signal amplification. The integration of a glucometer-colorimetric dual mode enables detection of cTnI, offering distinct advantages such as portability, accuracy, and swiftness, thereby presenting promising avenues for extensive market applications.
2. Materials and Methods
2.1. Chemicals and instruments
Supporting information https://dx.doi.org/10.25259/AJC_178_2024 includes comprehensive details on chemicals and instruments. All synthetic DNA sequences used in the experiments were obtained from Sangon Biotechnology (Shanghai, China) and the sequences are listed in Table S1.
2.2. Synthesis of MNPs
In order to make the detection system purer and avoid by-products that interfere in the detection process, we use magnetic beads for separation. The amount of reaction system and reaction temperature will affect the particle size of magnetic beads and then affect the separation performance of magnetic beads, so we referred to the method described by Wang [41]. FeCl3·6H2O was employed as the sole source of iron, with 1,6-hexamethylenediamine acting as the ligand for the synthesis of Magnetic Nanoparticles (MNPs) with amino-functionalized Fe3O4 surfaces. This synthesis process yielded high-quality ammonia-functionalized magnetic microspheres with adjustable particle sizes. The detailed procedure is delineated as follows: Initially, 1.0 g of FeCl3·6H2O and 2.0 g of anhydrous sodium acetate were weighed and combined with 30.0 mL of ethylene glycol. The mixture was then stirred magnetically to ensure uniform dispersion, following which 2.5 g of 1,6-hexamethylenediamine was added, and stirring was continued magnetically for 15 mins at 50°C. Upon the formation of a brown-red transparent solution, the solution was transferred into a high-pressure reactor and maintained at a temperature of 198°C for 6 h. After the reaction, the black product was collected via magnetic separation, and the upper liquid phase was removed. Subsequently, the magnetic beads underwent three cycles of rinsing with hot, ultra-pure water, followed by cleaning with anhydrous ethanol before being dried under vacuum conditions at 50°C for 12 h. The resultant product obtained from this process is referred to as magnetic nano Fe3O4 or MNPs.
2.3. cTnI detection
The preparations of dual-mode signal probes are listed in the Supporting Information. Au@MNPs/DNA1 (20.0 μL) and DNA2 (20.0 μL) were obtained and incubated at 37°C for 1 h, followed by magnetic separation and purification to eliminate the unbound free DNA2. Subsequently, 20.0 μL of cTnI at a concentration of 0.1 ng mL-1 was added to the double-stranded Au@MNPs/DNA1-DNA2 dsDNA for a reaction period of 40 mins, where the competing DNA2 was isolated through magnetic separation, serving as the ‘switch’ to initiate the entire cycle amplification process. After adding 20.0 μL Hairpin 1 (H1), it was divided into two tubes for two modes of detection. In glucometer mode detection, Au@MNPs-H2-Invertase and 1 U of Nb.BbvCI enzyme were added to the mixture and incubated at 37°C for 80 mins. Subsequently, the supernatant was magnetically separated, followed by the addition of a sucrose solution in a volume of 20.0 μL for another 20 mins before dropping onto a blood glucose meter test strip for measurement using a glucometer. For colorimetric mode detection, Au@MNPs-H2-HRP and 1U Nb.BbvCI enzymes were added to the mixture, which underwent incubation at 37°C for 80 mins. Then, drops (5.0 μL) from this mixture were magnetically separated into a pre-prepared TMB color-developing system followed by capturing photos after 3 mins; finally, values were determined using colorimetric software (Image J).
2.4. Polypropylene gel electrophoresis
The 20% Polyacrylamide gel electrophoresis (PAGE) gel was prepared for electrophoresis analysis. Following the protocol, the glass plate was prepared by arranging a 20% separation gel and sealing it with 95% ethanol until solidified. Subsequently, the ethanol was poured away. A 4% separation gel was then added, and after solidification, the prepared gel was securely placed in the electrophoresis tank along with 1×tris-borate-EDTA buffer (TBE) buffer. Then, the loading sample was prepared by mixing 5 μL of the resulting solution and 1 μL of the 10×loading buffer. Subsequently, the electrophoresis experiments were carried out at 80 V for 90 mins in TBE buffer. After the electrophoresis is complete, the gel is stripped and silver-dyed according to the instructions.
3. Results and Discussion
3.1. Preparation of dual-mode sensor
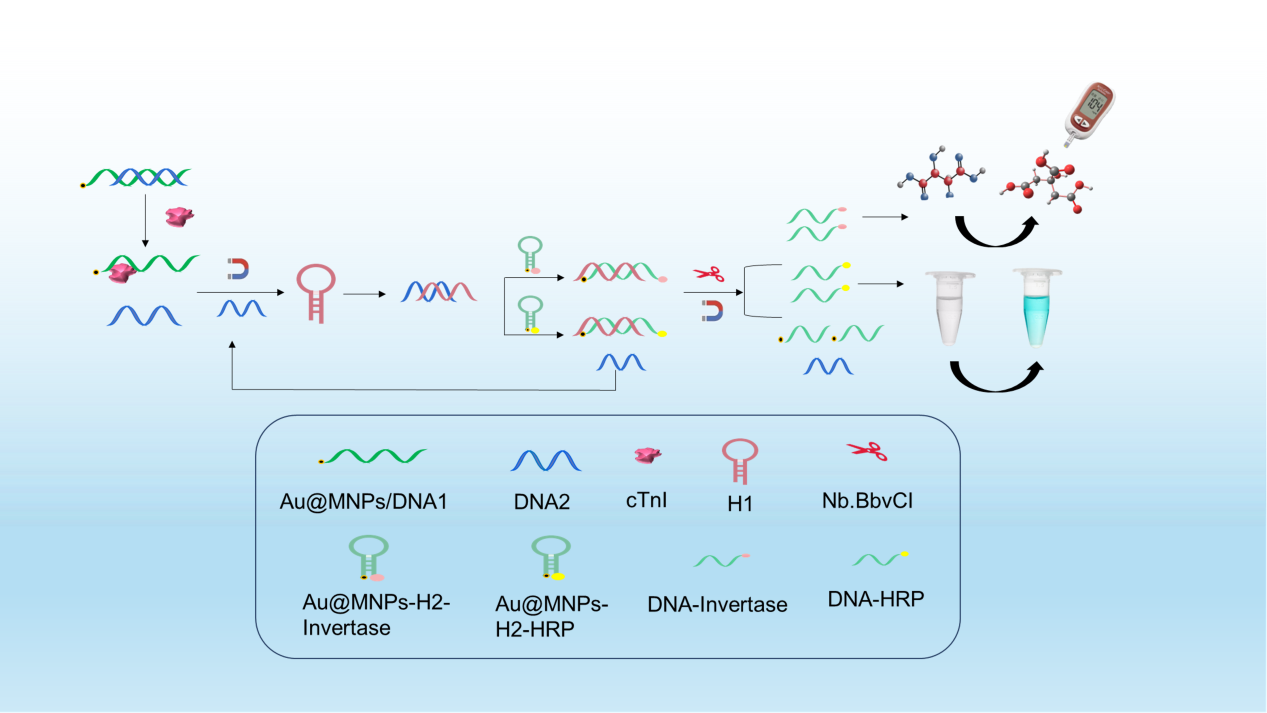
In this study, we developed an aptamer sensor based on a glucometer-colorimetric dual mode for the detection of cTnI. The signal probe was amplified using catalytic hairpin self-assembly and nucleic acid notch endonuclease. As illustrated in Scheme 1, two partially complementary DNA sequences were designed, with DNA1 serving as the specific aptamer for cTnI. Two types of signal probes were synthesized: Au@MNPs-H2-Invertase, where H2 was modified with nano-magnetic beads at one end and sucrose invertase at the other end for glucometer signal detection; and Au@MNPs-H2-HRP, where nanomagnetic beads were modified at one end of H2 sequence and horseradish peroxidase at the other end for colorimetric detection. Upon cTnI detection, DNA2 acted as a competitive “switch” to initiate catalytic hairpin assembly (CHA). DNA2 opened H1, which further opened H2, forming a dsDNA structure (H1-H2) with specific enzyme cleavage sites. The replaced DNA2 continued to participate in subsequent CHA cycles, resulting in the amplification of multiple H1-H2 dsDNA structures. Addition of an endonuclease recognized and cleaved the H1-H2 dsDNA structure, releasing multiple DNA probes carrying two enzymes: DNA-invertase and DNA-HRP. After magnetic separation, DNA-Invertase converted sucrose into glucose, enabling rapid detection using a glucose meter, while DNA-HRP induced color change in the TMB solution, facilitating colorimetric analysis. This approach enabled portable and rapid detection of cTnI through glucometer-colorimetric dual mode, offering simplicity in operation along with advantages such as low cost and miniaturization.
- The strategy for the construction of glucometer-colorimetric dual mode sensor.
3.2. Feasibility analysis
The feasibility of the designed DNA primers was verified using NUPACK software. As depicted in Figure S1, during the entire detection process, the presence of target cTnI in the system leads to the competitive displacement of DNA2, acting as a “switch” to initiate subsequent CHA reaction. DNA2 forms a complex with hairpin H1 by pairing with complementary bases at one end, resulting in the formation of H1-DNA2 complex and subsequent opening of hairpin H2 to generate H1-H2-DNA2 complex along with free DNA2. At this stage, specific enzyme cutting sites within the complementary base structure of H1-H2 dsDNA are recognized by endonuclease Nb.BbvCI for cleavage. In the absence of target cTnI, DNA2 is unable to participate in the cycle. While most hairpins H1 and H2 in the system remain independently stable structures, the presence of CHA may induce a minimal number of spontaneous reactions leading to the formation of H1-H2 dsDNA structures, resulting in potential background signals during subsequent experiments.
The feasibility of the sensor under different conditions was further investigated. As depicted in Figure 1, in the absence of target cTnI, DNA2 failed to compete, resulting in the inability to activate H1 and H2 in subsequent experiments and preventing the formation of the H1-H2 dsDNA structure with specific sites. Consequently, upon the addition of endonuclease, DNA2 could not be replaced by DNA-invertase or DNA-HRP cleavage enzymes. This resulted in lower values on both glucometer readings and colorimetric gray scale. In the absence of H, formation of the H1-H2 dsDNA structure was also hindered, resulting in reduced detection values on both glucometer readings and colorimetric gray scale. Similarly, without endonuclease present, no cleavage occurred for either DNA-Invertase or DNA-HRP, resulting in significantly diminished detection values on both glucometer readings and colorimetric gray scale. Only when all aforementioned sensing elements were simultaneously present within solution could high glycemometer signal values and colorimetric gray scale signals be generated for cTnI detection.
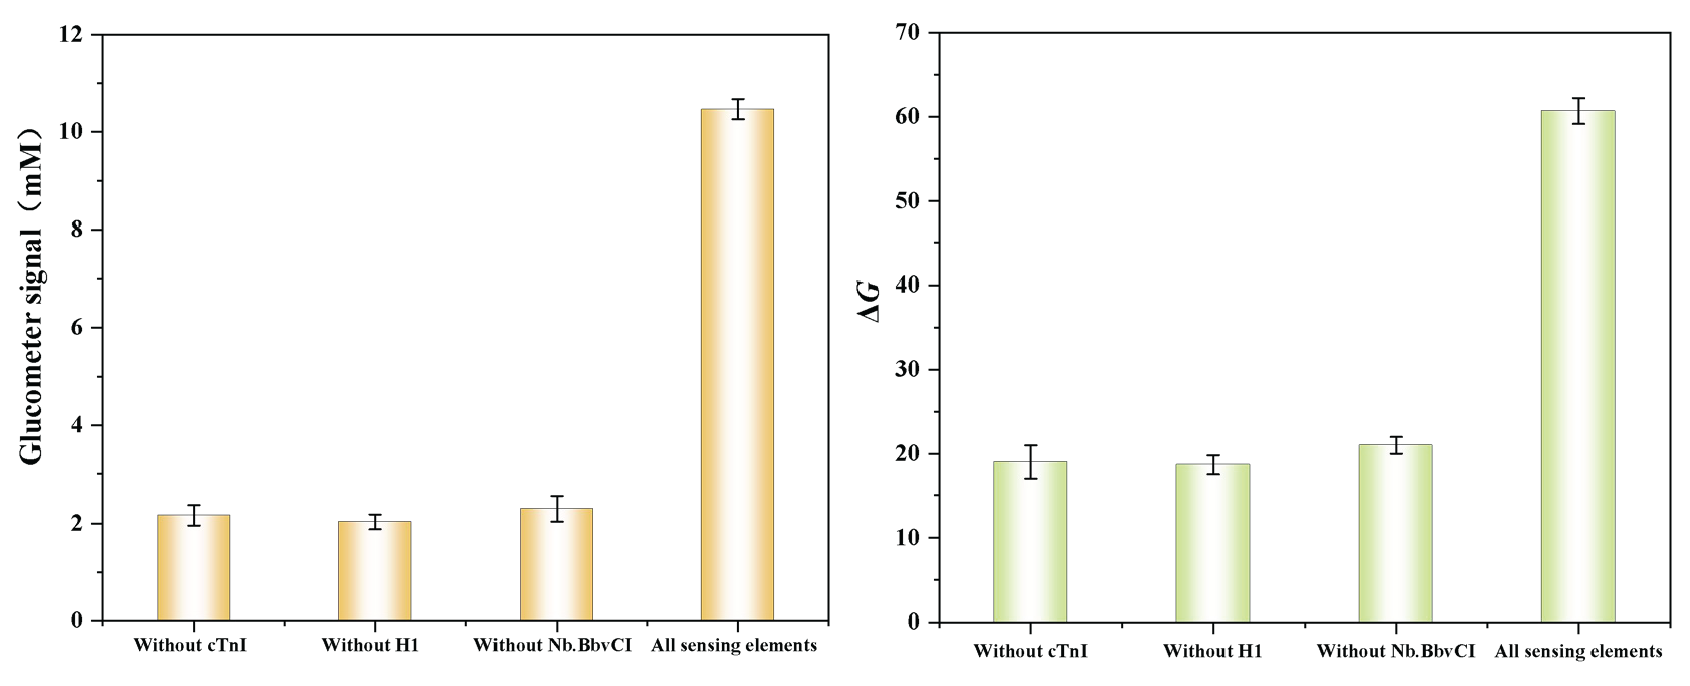
- Glucometer-colorimetric dual-model feasibility validation.
The magnetic nanoparticles were synthesized using 1,6-hexanediamine as a ligand through a one-pot synthesis method. Their morphology was characterized using Transmission Electron Microscopy (TEM), as shown in Figure 2. The magnetic nanoparticles have an approximate diameter of 50 nm and exhibit a uniformly dispersed spherical structure. Their surface is rich in amino groups, which can bind to the carboxyl groups of the aptamers, providing conditions for aptamer loading.
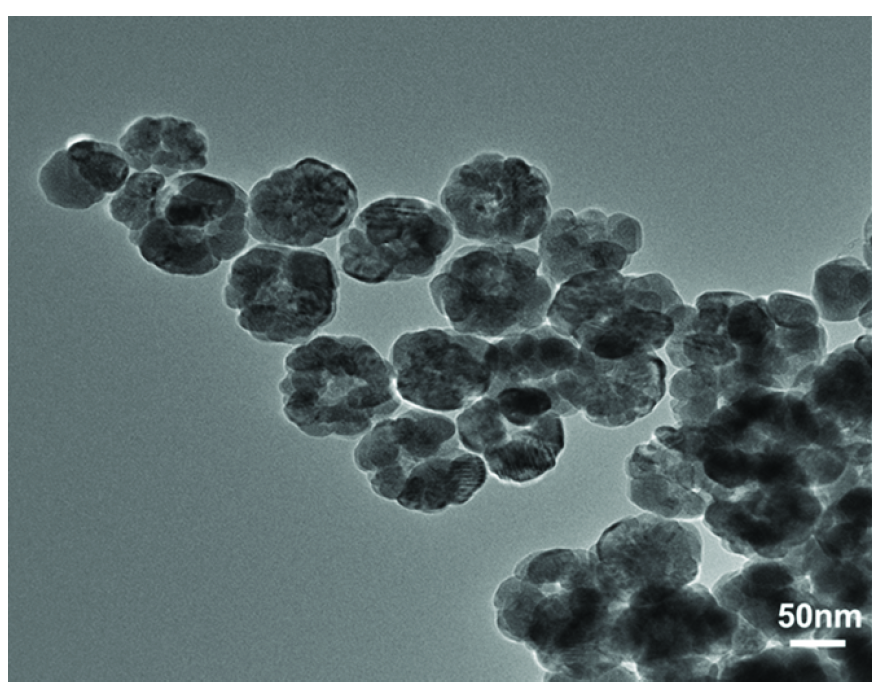
- Magnetic bead transmission electron microscope.
The combination of H2 with the enzymes Invertase and HRP was characterized using UV-visible spectrophotometry (UV-Vis). As shown in Figure 3(a), the wavelength of H2 is 260 nm, and the wavelength of invertase is 266 nm; after combination, the wavelength of H2-invertase is 261 nm. In Figure 3(b), the wavelength of H2 is 264 nm, and the wavelength of HRP is 278 nm; after combination, the wavelength of H2-HRP is 268 nm. The combined wavelengths exhibit a noticeable blue shift. This blue shift may be attributed to the formation of hydrogen bonds between H2 and the enzymes, leading to a reduction in bond length and an increase in vibration frequency. The comparison of UV spectra before and after the reaction confirms the successful synthesis of H2-Invertase and H2-HRP.

- (a) Ultraviolet absorption spectra of H2, Invertase, and H2-Invertase conjugates. (b) Ultraviolet absorption spectra of H2, HRP, and H2 -HRP conjugates.
The successful combination of H2-Invertase, H2-HRP, and Au@MNPs will directly impact the subsequent experiments. Therefore, X-ray photoelectron spectroscopy (XPS) was employed to further validate the integration of Au@MNPs-H2-Invertase and Au@MNPs-H2-HRP. Whether it is primer H2 or the two enzymes Invertase and HRP, proteins serve as the fundamental constituents encompassing C, N, O, S, and P. Based on the XPS results (Figure 4a and 4b), it can be observed that both Au@MNPs-H2-Invertase and Au@MNPs-H2-HRP exhibit characteristic absorption peaks corresponding to these aforementioned elements, thereby confirming their successful amalgamation.

- X-ray photon spectroscopy of (a) Au@MNPs-H2-Invertase and (b) Au@MNPs-H2-HRP.
Polypropylene gel electrophoresis was employed in order to validate the feasibility of enzyme digestion cycle amplification. As depicted in Figure 5, lanes 1, 2, 4, and 5 correspond to DNA1, DNA2, H1, and H2 strips, respectively. Lane 3 represents the band resulting from the combined reaction of DNA1 and DNA2. In lane 6, it is evident that upon the addition of cTnI, competition occurs between DNA2 and CHA, leading to the formation of an open H1-H2 complex. Subsequent introduction of Nb.BbvCI enables the identification of specific enzyme cleavage sites followed by the generation of new single-stranded DNA fragments through cutting action. Conversely, in lane 7, where cTnI is absent due to lack of competition from DNA2, CHA remains closed, preventing the formation of H1-H2 dsDNA complex, thereby impeding subsequent enzymatic cleavage by Nb.BbvCI resulting in the absence of new short chains. To summarize, validation of this methodology is demonstrated by the distinct bands observed across different lanes.
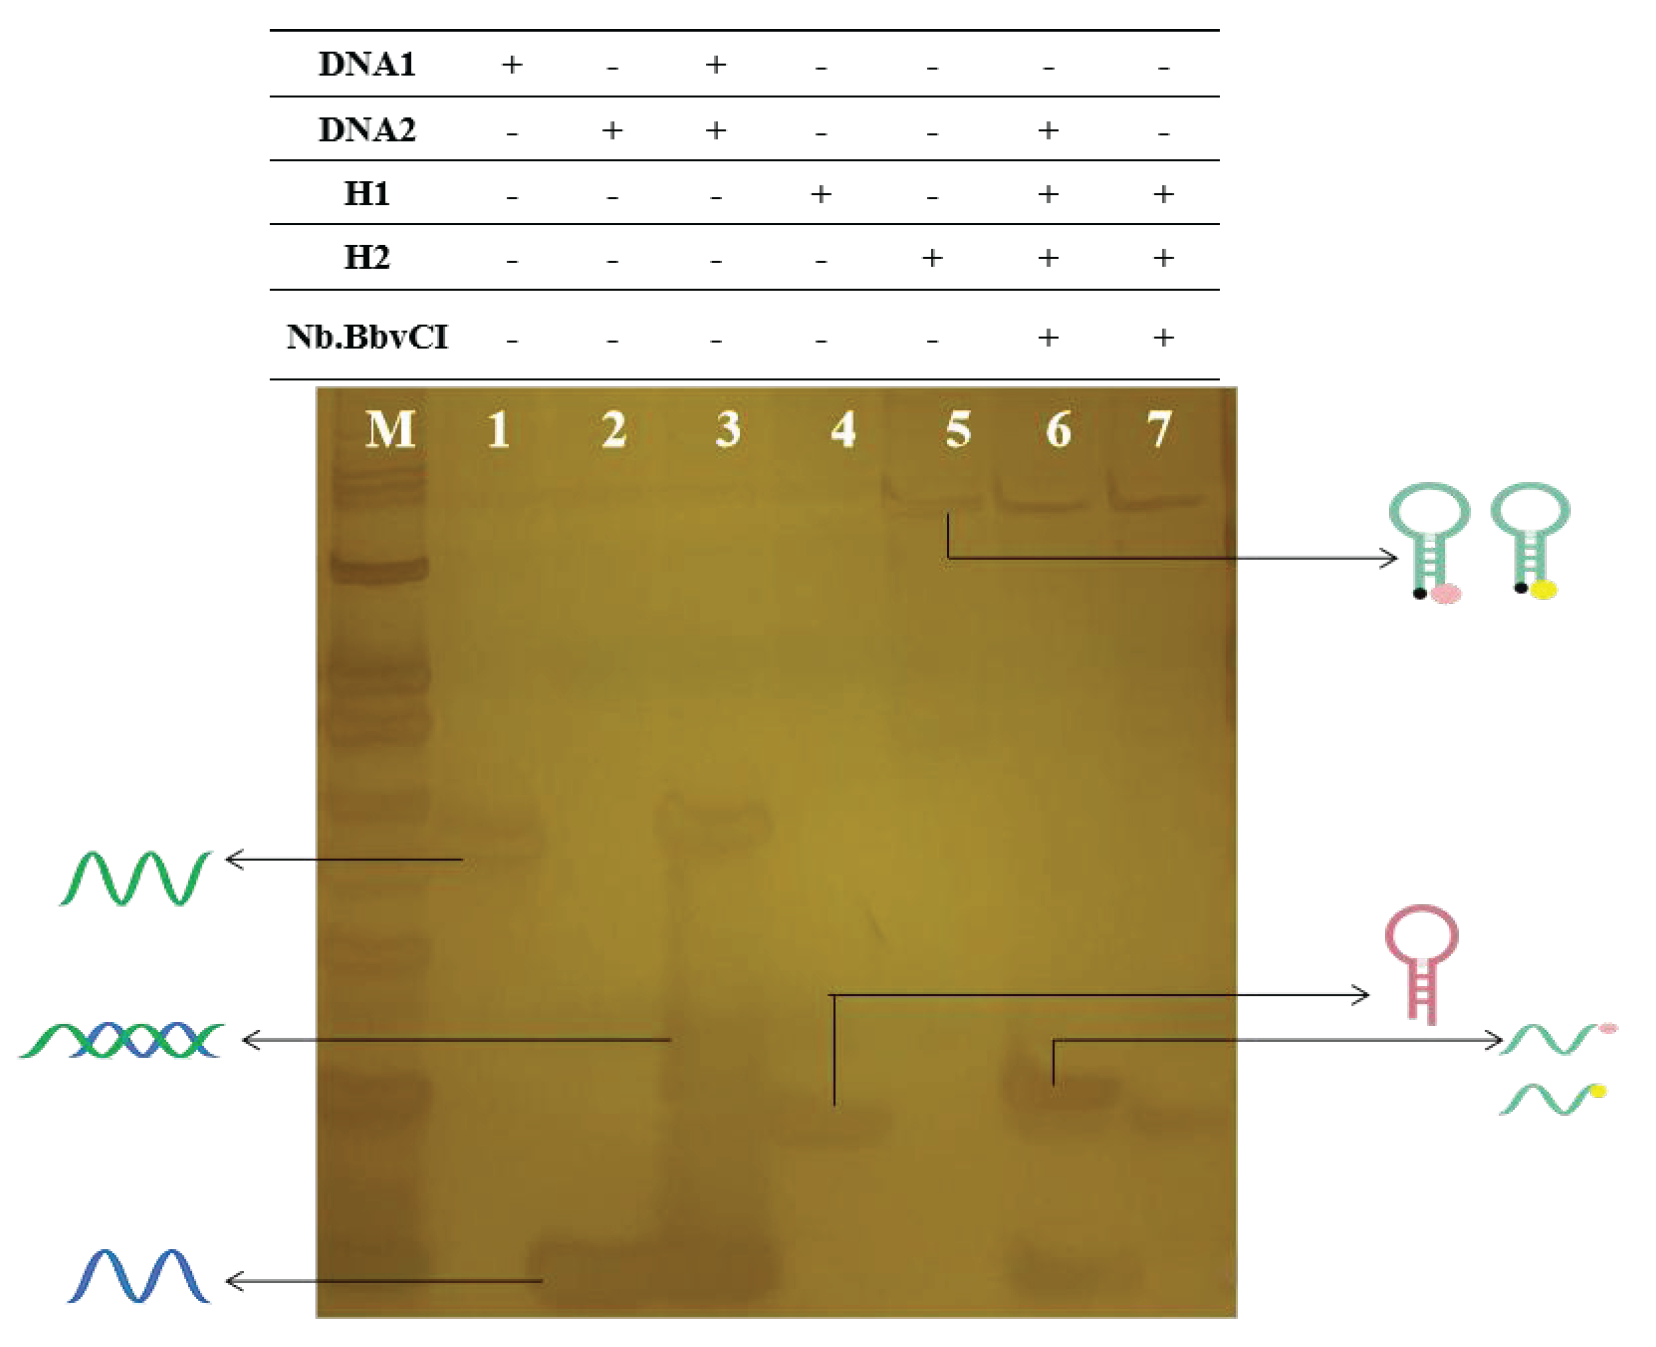
- Graph of the results of polyacrylamide gel electrophoresis experiments.
3.3. Optimization of glucometer mode conditions
In order to optimize the analysis performance of the sensor, key influencing factors in the experiment were fine-tuned, including optimizing DNA1 and DNA2 concentrations, H1 concentration, reaction temperature, incubation time of cTnI and aptamer, and enzyme concentration of Nb.BbvCI, enzyme reaction time, sucrose concentration, and reaction time for adding sucrose (Figure S2).
3.3.1. Optimization of the concentration of DNA
The appropriate concentration of DNA1 and DNA2 is a crucial factor influencing the smooth execution of subsequent experiments. Insufficient concentration may hinder the recognition of sufficient cTnI, thereby reducing sensor sensitivity. As the concentration gradually increases, DNA1 captures an ample amount of cTnI until saturation is reached. As both DNA1 and DNA2 concentrations increase, the measured value on the glucometer progressively rises. Upon reaching 300.0 nM, there is minimal change in the glucometer, indicating saturation and a stable trend in the figure. Consequently, for subsequent experiments, a concentration of 300.0 nM was selected as optimal for both DNA1 and DNA2.
3.3.2. Optimization of the concentration of H1
Varied concentrations of H1 can impact the ensuing CHA reaction, thereby influencing the sensor’s overall detection performance. When an adequate concentration of H1 is combined with DNA2, sufficient H2 can be opened to generate a satisfactory number of subsequent signal probes. As the concentration increases, at 200.0 nM, the glucometer value reaches its peak and thereafter stabilizes, indicating that H1 has reached saturation in its reaction with H2. Therefore, a concentration of 200.0 nM was selected as the optimal reaction concentration for subsequent experiments.
3.3.3. Optimization of the incubation time of cTnI
When cTnI is introduced into the system, DNA2 in DNA1-DNA2 can be displaced to form Au@MNPs/DNA1/cTnI and DNA2. The unbound DNA2 solution was collected through magnetic separation for subsequent experiments. Therefore, it is crucial to optimize the reaction time between cTnI and Au@MNPs/DNA1. If the binding time is too short, the interaction between cTnI and Au@MNPs/DNA1 will not be sufficient, resulting in incomplete displacement of DNA2 and a small amount of released DNA2, which could impact the subsequent detection sensitivity. With increasing binding time, the glucometer gradually increased until it reached its peak at 40 mins. Beyond 40 mins, the glucometer decreased, possibly due to the recombination of competing DNA2 with DNA1. Consequently, a binding time of 40 mins was selected as optimal in subsequent experiments.
3.3.4. Optimization of cycle amplification time
The exonuclease step is crucial in the cyclic amplification signaling process; thus, optimizing digestion time and enzyme dosage becomes necessary. Only with sufficient reaction time for cyclic amplification and an appropriate amount of enzyme can the Nb.BbvCI enzyme effectively cleaves the H1-H2 dsDNA chain, resulting in a significant increase in signal probes and consequently enhancing the glucose meter’s signal detection value. Following the addition of exonuclease, glucometer increased gradually and reached its peak at 80 mins. However, further prolonging the reaction time showed minimal changes in glucometer. Therefore, based on subsequent experiments, it was determined that the optimal reaction time for foreign and domestic enzymes was 80 mins.
3.3.5. Optimization of the concentration of Nb.BbvCI enzyme
The amount of exonuclease was further optimized. With an increase in the enzyme dosage, the glucometer gradually rose and eventually reached a stable state. This phenomenon can be attributed to the fact that a certain quantity of H1-H2 is generated. Consequently, when the enzyme dosage reaches a specific threshold, all H1-H2 molecules within the system are completely cleaved by the enzyme. As a result, saturation of H2-Invertase production occurs along with a corresponding saturation point for sucrose conversion into glucose. Further increasing the enzyme dosage does not significantly impact the glucometer. Therefore, 1U of Nb.BbvCI was determined as the optimal enzyme dosage.
3.3.6. Optimization of the reaction time of sucrose
The reaction time of sucrose and DNA-invertase significantly impacts the overall experiment. Adequate reaction time ensures the complete conversion of sucrose into glucose by the invertase in the system. Following the addition of sucrose, the glucometer increases proportionally with longer reaction times. Once the reaction time exceeds 20 mins, there is a tendency for the glucometer to stabilize, indicating that the conversion of sucrose into glucose has reached saturation. Therefore, 20 mins is determined as the optimal duration for adding sucrose in this reaction.
3.4. Optimization of colorimetric mode condition
The experiment of the color rendering system is conducted under the aforementioned optimized conditions, with a focus on optimizing potential influencing factors.
The concentration of TMB, as the substrate of the entire color development system, plays a pivotal role in influencing the overall color development reaction. As depicted in Figure S3, an increase in TMB concentration leads to a gradual deepening of the visually observable color from light blue until it reaches its maximum intensity at 25.0 mM. Through analysis using colorimetric software, it is observed that the gray value gradually decreases and reaches its minimum at 25.0 mM; hence 25.0 mM was selected as the optimal TMB concentration.
3.5. Linear range and sensitivity for cTnI detection
A good linear relationship between y (Glucometer signal) and cTnI concentration is in the range of 0.01 ng mL-1-20.0 ng mL-1 with a linear equation of y=8.5564log(CcTnI)+20.373, (R2=0.99), and the limit of detection (LOD) of 0.001 ng mL-1. Similarly, there is a good linear correlation between y (Grey scale) and cTnI concentration in the range of 0.03 ng mL-1-15.0 ng mL-1. The regression equation is y=-24.864log(CcTnI)+138.903 (R2=0.99) with the LOD of 0.005 ng mL-1. Compared with other methods for detecting cTnI (Table S2), the established method showed a wide linear range and preferable analytical performance (Figure 6).
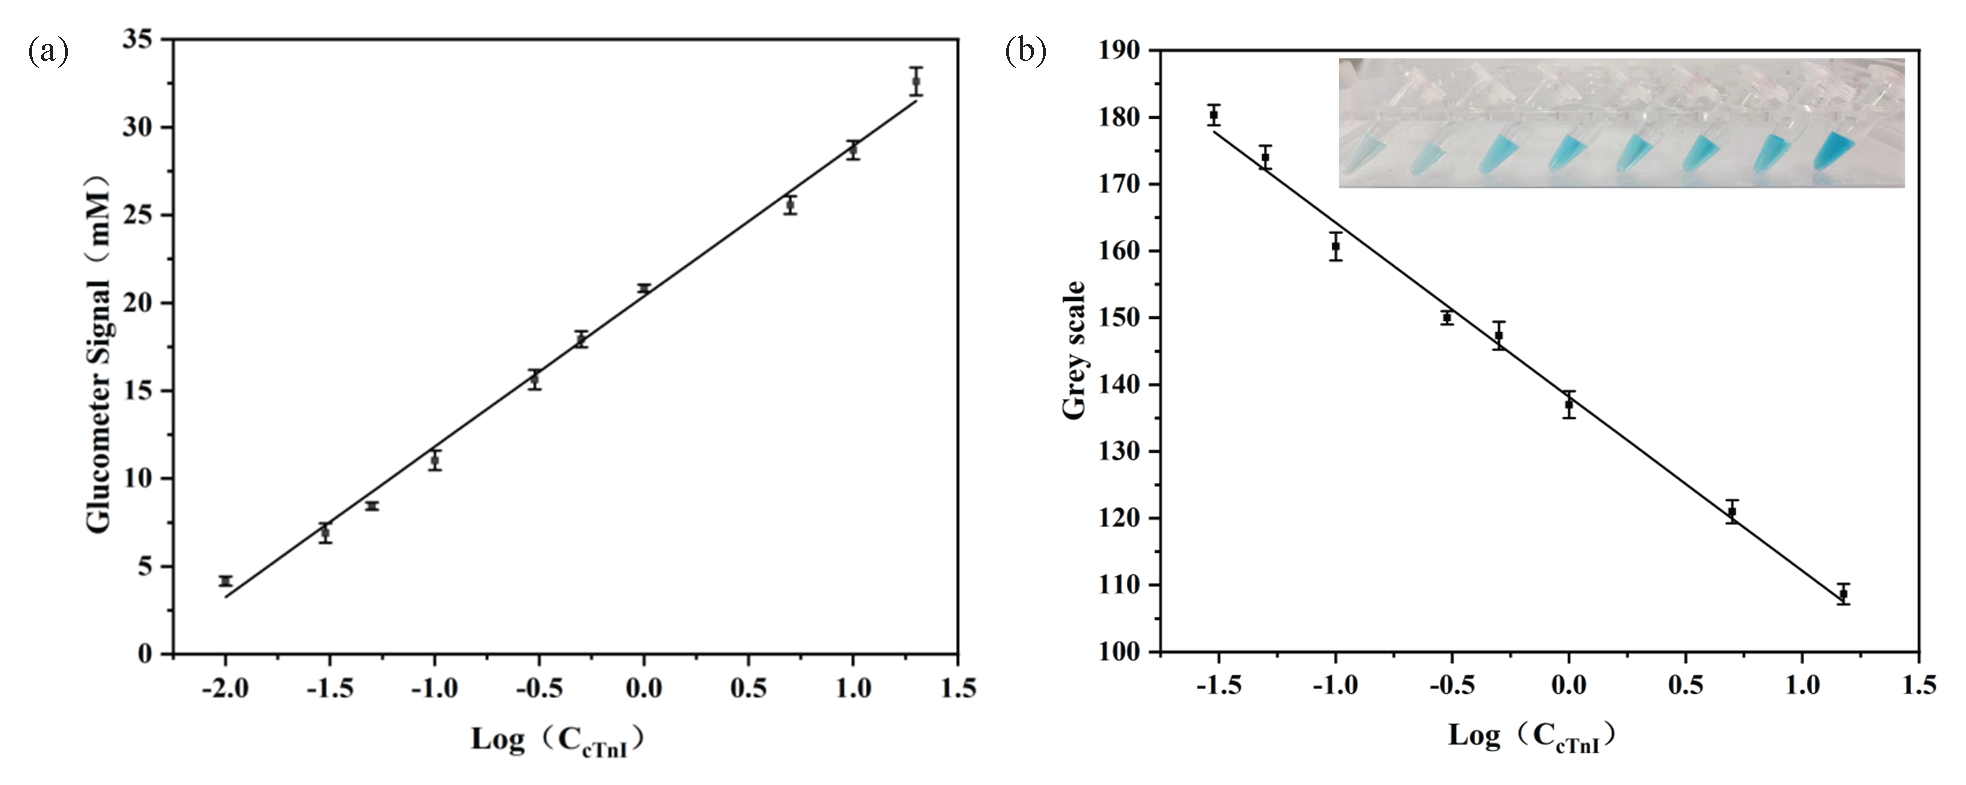
- Standard curve for cTnI detection by glucometer-colorimetric dual-modes sensor: (a) Standard curve detected by blood glucose meter sensor, (b) standard curve detected by the colorimetric sensor.
3.6. Assessment of specificity and reproducibility
Selectivity is an important parameter for the evaluation of biosensors. Different interferents that may exist in human serum, including cTnT, Mb, and CRP were used to explore the selectivity of the prepared biosensors. As shown in Figure 7(a), both the glucometer mode and the colorimetric mode have higher response values only for cTnI.
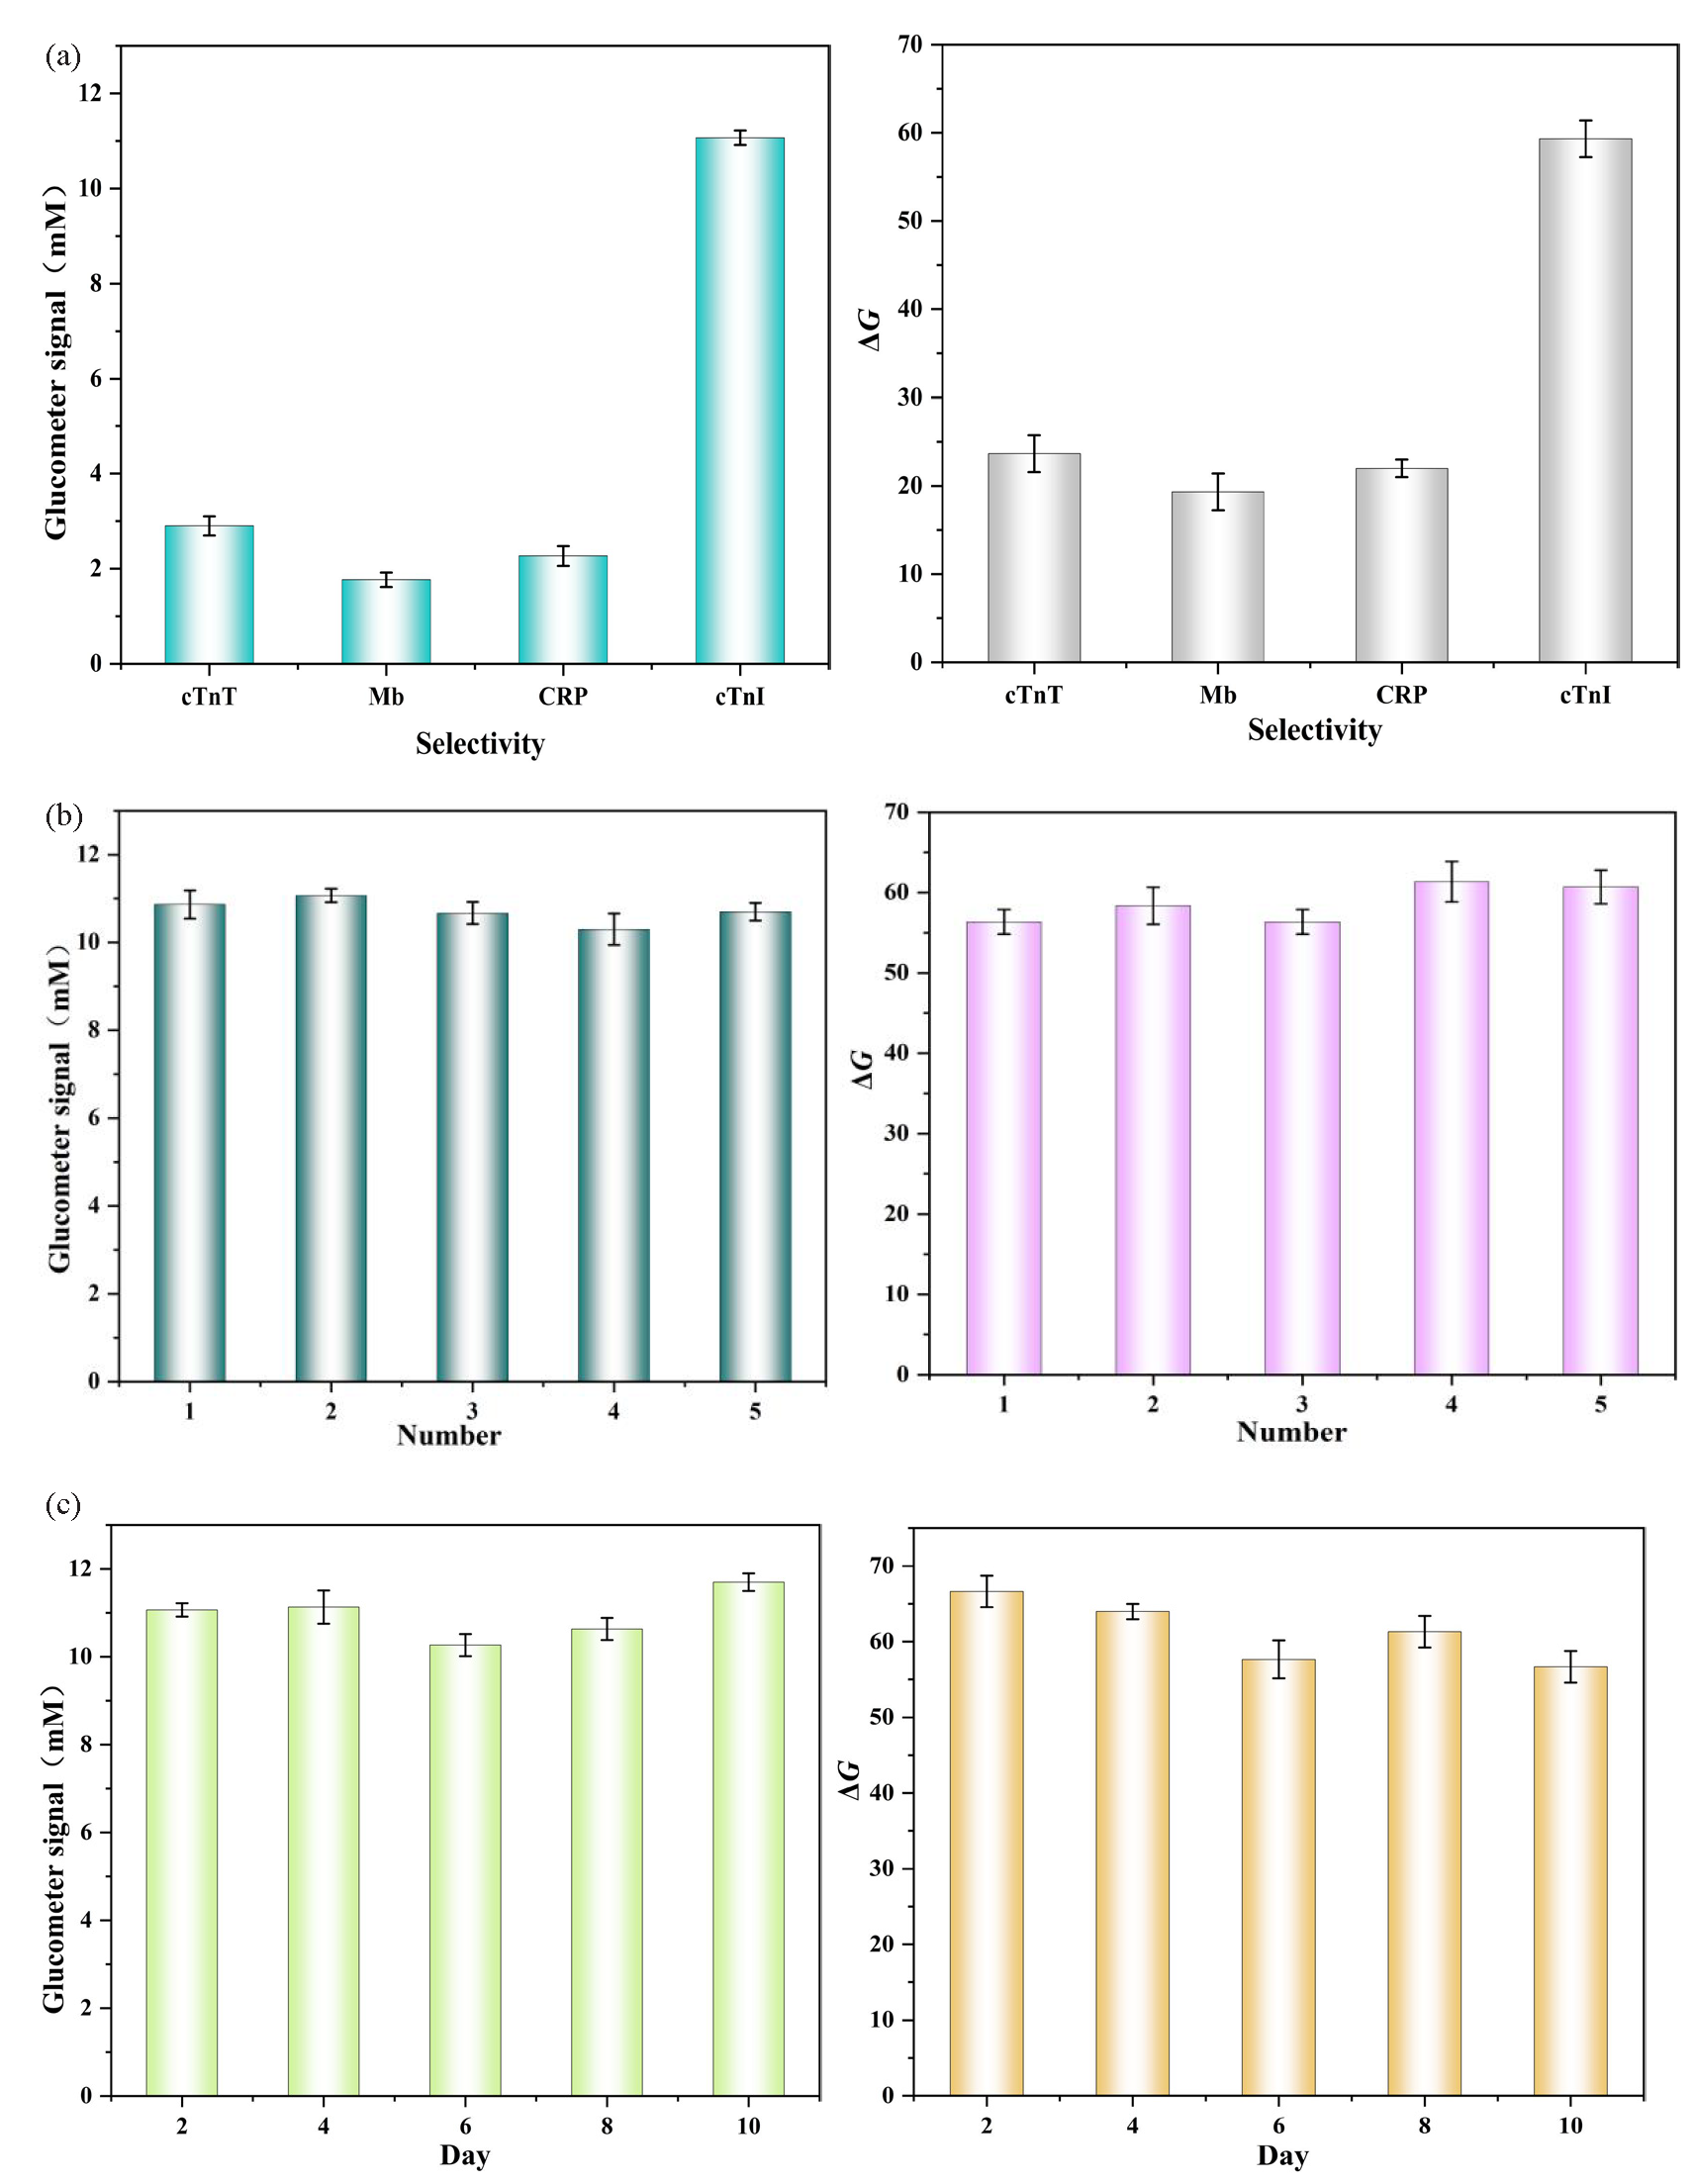
- (a) Selectivity of the glucometer-colorimetric dual mode sensors for 0.1 ng mL-1 cTnI from 1.0 ng mL-1 cTnT, 1.0 ng mL-1 Mb, and 1.0 ng mL-1 CRP. (b) Repeatability of the glucometer-colorimetric dual mode at the cTnI concentration of 0.1 ng mL-1 in five different sensors. (c) Stability of the glucometer-colorimetric dual mode sensor.
Reproducibility is another important parameter for the evaluation of biosensors. The reproducibility of both models has been demonstrated in Figure 7(b), with respective relative standard deviations (RSD) of 3.18% and 3.58%, indicating that the sensor exhibits good reproducibility.
To investigate whether sensor performance changes over storage time, we assessed its stability. As shown in Figure 7(c) within a 10-day period, the detection performance of the sensor in both modes remained essentially consistent. The relative standard deviation (RSD) were 4.374% and 3.761%, respectively, both of which are within acceptable limits. This demonstrates that the dual-mode sensor has good stability.
3.7. Detection in real human serum samples
To investigate the efficacy of the sensor in detecting cTnI in real samples, we conducted a study employing ELISA, a standard method for cTnI detection. The glucose-colorimetric dual-mode approach developed in this investigation was used to detect cTnI in human serum samples. Subsequently, the obtained results were compared and analyzed (Table S3). Statistical analysis was performed using the paired T-test method, revealing no significant difference between the two methods (PG=0.561>0.1; PC=0.649>0.1). To assess accuracy, standard recovery was implemented by adding different concentrations of cTnI to treated serum samples (Table S4). In glucometer mode, the RSD of standard samples ranged from 4.45% to 5.29%, with a recovery rate ranging from 96.2% to 104.6%. In colorimetric mode, labeled sample RSD ranged from 3.25% to 6.23%, with a recovery range of 93.8%-101.64%. These findings demonstrate that our designed strategy utilizing both glucometer-colorimetric dual mode can effectively detect cTnI in real samples while enabling rapid and portable detection, a promising prospect for broad applications.
4. Conclusions
The glucometer-colorimetric dual mode sensor established in this study exhibits high sensitivity and excellent selectivity. By incorporating catalytic hairpin mode and enzyme cycle amplification technology, the signals of the two probes can be infinitely amplified within a short period of time, enabling rapid detection in glucometer-colorimetric dual mode. This approach offers advantages such as low cost and miniaturization. Under optimal conditions, the sensor demonstrates an outstanding linear range (Glucometer mode: 0.01 ng mL-1 to 20.0 ng mL-1; Colorimetric mode: 0.03 ng mL-1 to 15.0 ng mL-1) with low detection limits of 0.001 ng mL-1 and 0.005 ng mL-1, respectively. The dual-mode strategy allows for portability and visualization, facilitating real-time detection. Moreover, this method has been successfully applied to detect cTnI in human serum, showing promising potential for early diagnosis and screening of acute myocardial infarction.
Acknowledgment
This work was supported by the National Natural Science Foundation of China (No. 82073601) and the National Natural Science Foundation of Hebei (No. H2024206344).
CRediT authorship contribution statement
Xi Ze: Manuscript preparation, Design, Experimental studies. Meng Jiang: Manuscript editing and review, Experimental studies, Data analysis. Huajie Li: Data acquisition, Literature search. Ruomu Chen: Data acquisition, Literature search. Wei Yuan: Statistical analysis, Definition of intellectual content. Yan Jin: Statistical analysis, Definition of intellectual content. Wen Yan: Statistical analysis, Definition of intellectual content. Kejia Xu: Statistical analysis, Data analysis. Jingyi Wang: Statistical analysis, Data analysis. Kai Kang: Concepts, Design. Lingmei Niu: Concepts, Design, Manuscript editing and review.
Declaration of competing interest
The authors declare that they have no known competing financial interests or personal relationships that could have appeared to influence the work reported in this paper.
Declaration of Generative AI and AI-assisted technologies in the writing process
The authors confirm that there was no use of artificial intelligence (AI)-assisted technology for assisting in the writing or editing of the manuscript and no images were manipulated using AI.
Supplementary data
Supplementary material to this article can be found online at https://dx.doi.org/10.25259/AJC_178_2024.
References
- Ultrasensitive label-free optical microfiber coupler biosensor for detection of cardiac troponin I based on interference turning point effect. Biosensors & Bioelectronics. 2018;106:99-104. https://doi.org/10.1016/j.bios.2018.01.061
- [Google Scholar]
- Diagnostics on acute myocardial infarction: Cardiac troponin biomarkers. Biosensors & Bioelectronics. 2015;70:209-220. https://doi.org/10.1016/j.bios.2015.03.037
- [Google Scholar]
- Prognostic value of cardiac troponin I measured with a highly sensitive assay in patients with stable coronary artery disease. Journal of the American College of Cardiology. 2013;61:1240-9. https://doi.org/10.1016/j.jacc.2012.12.026
- [Google Scholar]
- Troponin--past, present, and future. Current Problems in Cardiology. 2012;37:209-228. https://doi.org/10.1016/j.cpcardiol.2012.02.002
- [Google Scholar]
- Cardiac troponin: A critical review of the case for point-of-care testing in the ED. The American Journal of Emergency Medicine. 2012;30:1639-1649. https://doi.org/10.1016/j.ajem.2012.03.004
- [Google Scholar]
- Troponin elevation in conditions other than acute coronary syndromes. Vascular Health and Risk Management. 2011;7:597-603. https://doi.org/10.2147/VHRM.S24509
- [Google Scholar]
- Hollow gold nanoparticle-enhanced SPR based sandwich immunoassay for human cardiac troponin I. Microchimica Acta. 2017;184:2395-2402. https://doi.org/10.1007/s00604-017-2245-9
- [Google Scholar]
- Nanocomposites of gold nanoparticles and graphene oxide towards an stable label-free electrochemical immunosensor for detection of cardiac marker troponin-I. Analytica Chimica Acta. 2016;909:1-8. https://doi.org/10.1016/j.aca.2015.12.023
- [Google Scholar]
- Molecular implications of natriuretic peptides in the protection from hypertension and target organ damage development. International Journal of Molecular Sciences. 2019;20:798. https://doi.org/10.3390/ijms(2004)0798
- [Google Scholar]
- Nanodiamonds and hydrogen-substituted graphdiyne heteronanostructure for the sensitive impedimetric aptasensing of myocardial infarction and cardiac troponin I. Analytica Chimica Acta. 2021;1141:110-9. https://doi.org/10.1016/j.aca.2020.10.044
- [Google Scholar]
- Electrochemical aptamer-based biosensors for the detection of cardiac biomarkers. ACS Omega. 2018;3:12010-8. https://doi.org/10.1021/acsomega.8b01558
- [Google Scholar]
- Acute myocardial infarction biosensor: A review from bottom up. Current Problems in Cardiology. 2021;46:100739. https://doi.org/10.1016/j.cpcardiol.2020.100739
- [Google Scholar]
- Electrochemical biosensors for the determination of cardiovascular markers: A review. Electroanalysis. 2014;26:1132-1153. https://doi.org/10.1002/elan.201300597
- [Google Scholar]
- Point-of-care testing (POCT): Current techniques and future perspectives. Trends in Analytical Chemistry: TRAC. 2011;30:887-898. https://doi.org/10.1016/j.trac.2011.01.019
- [Google Scholar]
- Multiplexed point-of-care testing - xPOCT. Trends in Biotechnology. 2017;35:728-742. https://doi.org/10.1016/j.tibtech.2017.03.013
- [Google Scholar]
- Nanomaterial-based devices for point-of-care diagnostic applications. Chemical Society Reviews. 2018;47:4697-4709. https://doi.org/10.1039/c7cs00837f
- [Google Scholar]
- Wearable chemical sensors for biomarker discovery in the omics era. Nature Reviews. Chemistry. 2022;6:899-915. https://doi.org/10.1038/s41570-022-00439-w
- [Google Scholar]
- Wearable biosensors for healthcare monitoring. Nature Biotechnology. 2019;37:389-406. https://doi.org/10.1038/s41587-019-0045-y
- [Google Scholar]
- Disease detection with molecular biomarkers: From chemistry of body fluids to nature-inspired chemical sensors. Chemical Reviews. 2019;119:11761-11817. https://doi.org/10.1021/acs.chemrev.9b00437
- [Google Scholar]
- Drivers of biodiagnostic development. Nature. 2009;462:461-4. https://doi.org/10.1038/nature08605
- [Google Scholar]
- Home blood glucose biosensors: A commercial perspective. Biosensors and Bioelectronics. 2005;20:2435-2453. https://doi.org/10.1016/j.bios.2004.11.012
- [Google Scholar]
- Investigating pipeline and state of the art blood glucose biosensors to formulate next steps. Biosensors & Bioelectronics. 2015;74:243-262. https://doi.org/10.1016/j.bios.2015.05.071
- [Google Scholar]
- Glucometer-based biosensor for the determination of ractopamine in animal-derived foods using rolling circle amplification. Mikrochimica Acta. 2023;190:121. https://doi.org/10.1007/s00604-023-05715-0
- [Google Scholar]
- Using personal glucose meters and functional DNA sensors to quantify a variety of analytical targets. Nature Chemistry. 2011;3:697-703. https://doi.org/10.1038/nchem.1092
- [Google Scholar]
- Ultrahigh selective colorimetric quantification of chromium(VI) ions based on gold amalgam catalyst oxidoreductase-like activity in water. Analytical Chemistry. 2018;90:14309-14315. https://doi.org/10.1021/acs.analchem.8b03597
- [Google Scholar]
- Ag+ and cysteine quantitation based on g-quadruplex−Hemin DNAzymes disruption by Ag+. Analytical Chemistry. 2010;82:789-793. https://doi.org/10.1021/ac902421u
- [Google Scholar]
- Gold nanoparticles and the corresponding filter membrane as chemosensors and adsorbents for dual signal amplification detection and fast removal of mercury(ii) Nanoscale. 2017;9:3315-3321. https://doi.org/10.1039/c6nr09638g
- [Google Scholar]
- Photocatalysis-based nanoprobes using noble metal–Semiconductor heterostructure for visible light-driven in vivo detection of mercury. Analytical Chemistry. 2017;89:7649-7658. https://doi.org/10.1021/acs.analchem.7b01602
- [Google Scholar]
- High-resolution colorimetric assay for rapid visual readout of phosphatase activity based on gold/silver core/shell nanorod. ACS Applied Materials & Interfaces. 2014;6:18243-18250. https://doi.org/10.1021/am505342r
- [Google Scholar]
- Colorimetric detection of melamine during the formation of gold nanoparticles. Biosensors & Bioelectronics. 2011;26:2574-8. https://doi.org/10.1016/j.bios.2010.11.007
- [Google Scholar]
- Multiplexing surface anchored functionalized iron carbide nanoparticle: A low molecular weight proteome responsive nano-tracer. Colloids and Surfaces. B, Biointerfaces. 2021;203:111746. https://doi.org/10.1016/j.colsurfb.2021.111746
- [Google Scholar]
- Fractionation of biomolecules in withania coagulans extract for bioreductive nanoparticle synthesis, antifungal and biofilm activity. Molecules (Basel, Switzerland). 2020;25:3478. https://doi.org/10.3390/molecules25153478
- [Google Scholar]
- Quantitative proteomic analysis of heLa cells in response to biocompatible FE2C@C nanoparticles: 16O/18O-labelling & HPLC-ESI-orbit-trap profiling approach. Toxicology Research. 2018;7:84-92. https://doi.org/10.1039/c7tx00248c
- [Google Scholar]
- Biocompatibility of iron carbide and detection of metals ions signaling proteomic analysis via HPLC/ESI-orbitrap. Nano Research. 2017;10:1912-1923. https://doi.org/10.1007/s12274-016-1375-4
- [Google Scholar]
- Prospects in the use of aptamers for characterizing the structure and stability of bioactive proteins and peptides in food. Analytical and Bioanalytical Chemistry. 2018;410:297-306. https://doi.org/10.1007/s00216-017-0599-9
- [Google Scholar]
- Aptamer-based nanobiosensors. Biosensors & Bioelectronics. 2016;76:2-19. https://doi.org/10.1016/j.bios.2015.06.040
- [Google Scholar]
- Sensitivity programmable ratiometric electrochemical aptasensor based on signal engineering for the detection of aflatoxin B1 in peanut. Journal of Hazardous Materials. 2020;387:122001. https://doi.org/10.1016/j.jhazmat.2019.122001
- [Google Scholar]
- A low-background fluorescent aptasensor for acetamiprid detection based on DNA three-way junction-formed g-quadruplexes and graphene oxide. Analytical and Bioanalytical Chemistry. 2021;413:2071-9. https://doi.org/10.1007/s00216-020-03141-2
- [Google Scholar]
- Programming biomolecular self-assembly pathways. Nature. 2008;451:318-322. https://doi.org/10.1038/nature06451
- [Google Scholar]
- A sensitive electrochemical aptasensor for thrombin detection based on electroactive co-based metal–Organic frameworks with target-triggering NESA strategy. Analytical Chemistry. 2017;89:11636-11640. https://doi.org/10.1021/acs.analchem.7b03056
- [Google Scholar]
- One-pot synthesis and bioapplication of amine-functionalized magnetite nanoparticles and hollow nanospheres. Chemistry (Weinheim an der Bergstrasse, Germany). 2006;12:6341-7. https://doi.org/10.1002/chem.200501334
- [Google Scholar]


