

Translate this page into:
Removal of cibacron blue 3G-A (CB) dye from aqueous solution using chemo-physically activated biochar from oil palm empty fruit bunch fiber
⁎Corresponding author. jmjabar@futa.edu.ng (Jamiu Mosebolatan Jabar)
-
Received: ,
Accepted: ,
This article was originally published by Elsevier and was migrated to Scientific Scholar after the change of Publisher.
Peer review under responsibility of King Saud University.
Abstract
A novel biodegradable adsorbent called pyrolysed empty fruit bunch fibres (PEF) was prepared by chemo-physical activation of empty fruit bunch fibres (EFB) biochar for removal of cibacron blue 3G-A (CB) dye from aqueous solution. PEF was characterized using FTIR, SEM-EDX, XRD and BET techniques. The N2 adsorption-desorption isotherms indicated PEF’s surface area to be 362.84 m2g−1 and XRD attributed amorphous nature to PEF. After adsorption process, PEF has smoother surface morphology, increase in carbon by weight and shift in functional groups. The established adsorption optimum conditions were pH 10, 45 min contact time and 0.10 g/100 mL adsorbent dosage with 99.05% CB dye removal capacity at 343 K and initial dye concentration 100 mg/L. Desorption ratio >90% after seventh cycle of adsorption-desorption experiments confirmed high reusability (regeneration) of PEF. Pseudo second order kinetic and Freundlich were better fitted with kinetic and isotherm model respectively, while mechanism of adsorption was controlled by film diffusion (external mass transfer). Thermodynamic studied revealed ΔG, ΔS and ΔH to be −3.12 MJ/mol K, 9.11 kJ/mol K, 6.83 kJ/mol respectively at 343 K. The negative value of ΔG, positive values of ΔS and ΔH indicated spontaneity, feasibility and endothermic nature of CB dye adsorption from aqueous solution onto PEF.
Keywords
Adsorption
Biodegradable
Cibacron blue 3G-A
Empty fruit bunch fibres
Film diffusion

1 Introduction
Ever increasing human population has led to geometric increase in industrialization; this caused reduction in quantity and quality of available water for human, animals and plants survival (Al-Shaalan et al., 2019a, 2019b; Azari et al., 2015; Ali, 2012; Aksu, 2001). Many industries like textile, paper, cosmetic, food, pharmaceutical etc use dyes in coloring their products (Chukki et al., 2018; Mirzaei et al., 2017). Effluent from these industries (especially textile industry) contains more than ten percent (>10%) of dye used in their production processes (Etim et al., 2016). Inadequate treatment of this effluent before it is discharged into water body may obstruct penetration of sun light in water, disturb aquatic plants’ photosynthesis and poison aquatic animals (Ali et al., 2015, 2017, 2018a; Berizi et al., 2016; Lima et al., 2008). Resources from the affected water body may cause damage to kidney, liver, lung or may be mutagenic and carcinogenic (skin, brain and central nervous system) to human beings that use them for industrial, agricultural and/or domestic purpose(s) (Alharbi et al., 2018; Basheer and Ali, 2018; Basheer, 2017; Daneshvar et al., 2004). Based on effects of the effluent from textile and allied industries on ecosystem, effective dye removal from wastewater is essential for our environment to be secured for living (Baziar et al., 2017; Alpat et al., 2008). Biological, chemical and physical methods of wastewater treatment are known to water scientists for purification of domestic and industrial wastewater (Al-Rashed and Al-Gaid, 2012; Calvete et al., 2010; Ali et al., 2013; Dobaradaran et al., 2017; Karami et al., 2017). Cibacron blue 3G-A (CB) dye belongs to synthetic class of reactive dyes use by textile industry for coloring cotton yarns/fabrics. It has high resistance to degradation by biological method and not completely removed by chemical method (Mirzaei et al., 2017). Chemical treatment method may form sludge and/or other toxic matters as by-products instead of complete removal of CB dye from wastewater (Chukki et al., 2018). Adsorption process (a form of physical method), using carbon-based adsorbent is considered to be the best method for removal of this class of dye from wastewater (Mesdaghinia et al., 2017). This is due to its simplicity, effectiveness and ability to remove any class of dye from wastewater (Somasekharareddy et al., 2012). Adsorption capacity of carbon-based adsorbent can be enhanced through physical or/and chemical activation process (Kalantary et al., 2015). Good size distribution, large internal and external surface areas are some of the properties that made activated carbon an outstanding adsorbent for treatment of dye contaminated wastewater (Ali, 2018; Badi et al., 2018; Garg et al., 2004). Commercial activated carbon (CAC) was widely used for treatment of wastewater, due to its high dye removal efficiency. High cost of CAC made researchers to investigate dye removal ability of low cost agro-based wastes for treatment of wastewater (Mesdaghinia et al., 2017; Soccol et al., 2010). Several researchers have reported adsorption of dye from wastewater using different carbonaceous materials and found them to be efficient (Ali et al., 2018b, 2018c, 2018d, 2019a, 2019b; Garg et al., 2004). Some of these carbon-based materials used by researchers are rice husk, pineapple stem, sawdust, peanut shell, wheat shell, orange peels, coconut coir dust, coconut husk, groundnut shell, moringa seed coat to mention a few (Ali et al., 2019b, 2019c, 2019d; Al-Shaalan et al., 2019a, 2019b; Chukki et al., 2018; Etim et al., 2016; Ali et al., 2011; Hameed et al., 2009; Gupta et al., 2006; Ali and Aboul-Enein, 2002).
Nigeria, being one of the largest producers of palm oil in the whole world, records large quantity of empty fruit bunch fiber (EFB) as post harvest agro-waste from her oil palm industry annually (Muhamad et al., 2012). Bulk of these fibres ends up constituting environment nuisance and little quantity is used in the rural areas as source of domestic cooking fuel, which burns to enhance global warming (El-Sayed, 2011). Few researchers have used oil palm-based activated carbon for treatment of wastewater (Tan et al., 2008; Ofomaja, 2007). Conversion of EFB to activated carbon for removal of reactive dye (such as CB) from wastewater has not been reported to best of our knowledge. The use of PEF for removal of dye from wastewater will be an opportunity for Nigeria to convert waste to wealth, make environment clean and indirectly create job opportunity for unemployed youths (Suramaniam and Ponnusamy, 2015). In comparison with other agro-based adsorbents for treatment of wastewater, availability (virtually at no cost), eco-friendly, better adsorption capacity and reusability are some of the additional merits of PEF used in this study for removal of CB from aqueous solution. Unfortunately, study on the use of PEF for treatment of real life effluent from textile and allied industries may be a little difficult in Nigeria. This is because of unwilling attitude of textile and allied industries to allow researchers to take sample from their assumed effluent treatment plant for analysis, probably due to the fear of being indicted. The aim of this study was to investigate the efficiency of chemo-physically activated pyrolysed empty fruit bunch fibre (PEF) as adsorbent for the removal of CB dye from aqueous solution. The effect of pH, ionic strength, initial concentration, adsorbent dosage, contact time and temperature on CB adsorption was studied. Data obtained from the adsorption process were used to evaluate isotherm, kinetic and thermodynamic parameters of the process.
2 Experimental
2.1 Materials
Empty fruit bunch fibers (EFB) were obtained from a farm settlement at Itaoniyan, along old Akure-Ondo road, Akure South Local Government, Akure, Ondo State, Nigeria. EFB was authenticated at Department of Crop, Soil and Pest management, the Federal University of Technology, Akure, Nigeria. Cibacron blue 3G-A dye and all other chemical reagents used are analytical grade obtained from Sigma Aldrich.
2.2 Preparation of adsorbent
EFB was pretreated according to Bayuo et al. (2019) with little modification. EFB was boiled in 1% w/w detergent solution (liquor ratio 1:100) for 60 min with continual shaking to remove oil, dust and other related dirt. Detergent cleansed EFB was then rinsed with water and oven dried at 105 °C for 1 h. EFB was then carbonized at 400 °C under nitrogen atmosphere for 2 h at flow rate of 150 cm3/ min to form EFB biochar according to Jia et al. (2002). PEF was prepared from EFB biochar according to Regti et al. (2017) with little modification. EFB biochar was chemically activated by soaking in 72% H2SO4 for 5 h using liquor ratio 1:10. The chemically activated EFB biochar was refluxed for 2 h using water as solvent at liquor ratio 1:25. The refluxed biochar was allowed to cool to room temperature, filtered and soaked in 0.1 M KOH for 24 h at liquor ratio 1:10. It was then severally washed with water to pH 7.2. Chemically treated biochar was then dried in an oven at 105 °C for 1 h and then thermally activated at 600 °C under nitrogen atmosphere for 2 h to form chemo-physically activated pyrolysed empty fruit bunch fibre (PEF). PEF was then ground and sieved to mesh size between 50 µm and 90 µm. This was used as adsorbent in the adsorption experiment.
2.3 Characterization of adsorbent
Fourier transform infrared (FTIR) spectrometer (Perkin Elmer) was used to determine chemical functional groups in PEF before and after adsorption process by mixing the adsorbents with KBr in a ratio of 1:100 in a mortar pestle and placed in sample holder of the machine operated at spectral range between 4000 cm–1and 500 cm−1.
Scanning electron microscope (XL 20 Philips SEM) coupled with energy dispersive X-ray (EDX) was used to investigate PEF’s surface morphology and elemental composition. Surface of PEF (before and after adsorption) was coated with a 10 nm thick layer of gold and machine operated at 15.0 kV. EDX gives detail of elements in PEF.
X-ray diffractometer (Rigaku Dmax 7000) with Cu-Kα source radiation (ƛ = 1.541), operated at 30 kV and 30 mA was used to investigate PEF’s diffraction pattern. The adsorbent was examined at a maintained diffraction angle (2θ) range between 10° and 80° and a scanning speed 2°/min.
PEF was analyzed using Brunauer-Emmett-Teller (Micromeritics Autopore IV 9500, USA). Nitrogen (99.99%) adsorption–desorption at 77 K was used to determine specific surface area, pore volume and pore size distribution of the PEF from plot of volume adsorbed (cm3/g STP) Vs relative pressure (P/Po).
2.4 Preparation and standardization of adsorbate
The dye stock solution was prepared by dissolving 100 mg of CB dye in little quantity of water in a liter standard flask and made to a marked point with water. Absorption spectrum of aliquot of dye stock solution was run in UV–visible spectrophotometer (Pharmacia LKB Biochrome 4060) and ƛmax was found to be 637 nm. The working solutions were obtained through serial dilution of dye stock solution in accurate proportions (20 mg/L to 100 mg/L) and absorbance plotted against concentration to obtain a calibration curve (Fig. S1).
2.5 Adsorption studies
Batch equilibrium adsorption studies were carried out on CB dye aqueous solution (100 mg/L) using PEF as adsorbent in conical flask (250 mL).
Adsorption mechanism of CB dye onto PEF was deduced from variation of pH of the solution from 2 to 12 (using 0.1 M NaOH/HCl) and saline ionic strength (NaCl concentration) from 0.2 g/L to 1.0 g/L. Optimum percentage CB dye adsorbed (Eq. (1)) from aqueous solution was determined using fixed contact time (45 min), adsorption dosage (0.1 g/ 100 mL), temperature (301 K), agitation speed (100 rpm) and volume (100 mL) of dye solution in conical flask (250 mL).
Optimum contact time (Eq. (2)) of CB dye removal from aqueous solution was determined by varying adsorption contact time from 15 min to 75 min at 15 min interval using fixed adsorbent dosage (0.1 g/100 mL), temperature (301 K), pH 10, agitation speed (100 rpm) and volume (100 mL) of dye solution in conical flask (250 mL).
Effect of dye initial concentration on percentage CB dye adsorbed from aqueous solution was determined by varying CB dye concentration from 25 to 150 mg/L, using fixed adsorbent dosage (0.1 g/100 mL), temperature (301 K), pH 10, agitation speed (100 rpm) contact time (45 min) and volume (100 mL) of dye solution in conical flask (250 mL).
Optimum adsorption dosage (Eq. (3)) of PEF for removal of CB dye from aqueous solution was determined by varying adsorbent dosage from 0.025 to 0.125 g/100 mL at 0.025 g/ 100 mL interval using fixed contact time (45 min), temperature (301 K), pH 10, agitation speed (100 rpm) and volume (100 mL) of dye solution in conical flask (250 mL).
Effect of heat on CB dye adsorbed (Eq. (3)) from aqueous solution was determined by varying adsorption temperature from 301 K to 343 K using fixed contact time (45 min), adsorption dosage (0.1 g/100 mL), pH 10, agitation speed (100 rpm) and volume (100 mL) of dye solution in conical flask (250 mL).
Where Co is initial CB dye concentration, Ce is CB dye effluent concentration, v is volume of CB dye used, w is weight of PEF (adsorbent), R(%) is percentage CB dye removed, and are dye uptake of CB dye at time t and at equilibrium respectively.
After each of the adsorption processes, PEF was separated from supernatant CB dye solution by centrifugation at 4000 rpm for 10 min. Analyte was withdrawn with clinical syringe (1 mL) and absorbance read at 637 nm using UV–visible spectrophotometer. Absorbance of each of the effluents obtained on UV–visible spectrophotometer was interpolated from calibration curve to obtain corresponding concentration.
2.6 Adsorbent regeneration-reuse studies
Seven cycles of adsorption-desorption processes were carried out to investigate reusability of PEF as adsorbent for treatment of dye contaminated wastewater according to Ali et al. (2015) with little modification. Adsorption experiment was carried out using optimum parameters observed during adsorption process. CB adsorbed PEF (0.1 g/100 mL) was dispersed in 100 mL desorption solvent (0.3 M HCl) and stirred for 4 h at 301 K for desorption study. The desorbed CB dye was separated from PEF by centrifugation at 4000 rpm for 10 min and aliquot withdrawn with clinical syringe (1 mL) for UV–visible spectrophotometery analysis. PEF was thoroughly washed with water, dried at 105 °C for 2 h and reused for adsorption-desorption process. Ratio of desorbed CB concentration to adsorbed CB concentration was noted as desorption ratio.
3 Results and discussion
3.1 Characterization of adsorbent
The functional groups in PEF before and after adsorption process are shown in Fig. 1(a) and (b) respectively. The spectrum of PEF before adsorption process shows a number of absorption peaks ranging from broad band at 3394.83 cm−1, which indicated presence of hydroxyl (—OH) functional group to peak at 2929.97 cm−1 that confirmed alky vibration of —CH3. Others are absorption peaks at 1624.12 cm−1, 1519.96 cm−1, 1440.87 cm−1, 1377.22 cm−1, 1246.06 cm−1 and 1062.81 cm−1 showing presence of C⚌O, —C—N, C—C conjugate of aromatic, C—N, C—O carbonyl and C—O of primary alcohol respectively. After adsorption process, there was formation of twin peaks at 3429.55 and 3342.75 cm−1 indicating overlapping of C—N and —OH functional groups of 1° amine in CB dye adsorbed onto PEF and cellulosic alcohol on PEF respectively. Other peaks in PEF shifted after adsorption process. These observations confirmed involvement of functional groups in adsorption of CB dye onto PEF. These showed that adsorption process might be due to electrostatic attraction between CB dye and PEF according to Ahmad et al. (2009).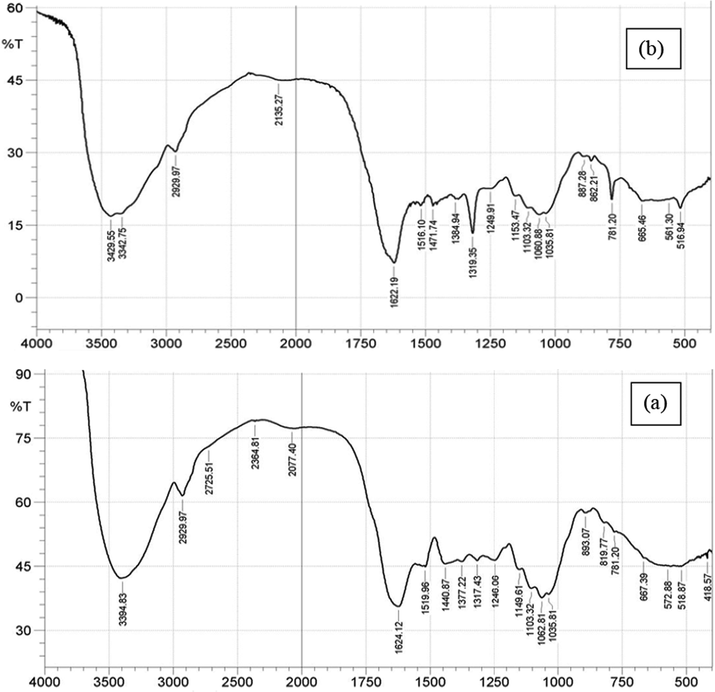
PEF FTIR spectra before (a) and after (b) adsorption process.
PEF surface morphology before and after adsorption process was studied using SEM. Micrograph of PEF before adsorption has rough surface (Fig. 2a) showing available pores or active sites for adsorption of CB dye onto PEF. After adsorption process, PEF micrograph surface became smooth (Fig. 2b) showing high reduction in active site and agglomeration of CB dye molecules on PEF. This observation indicated possibility of adsorption of CB dye onto PEF to be through physiosorption in agreement with the findings of Al-Ghouti et al. (2003).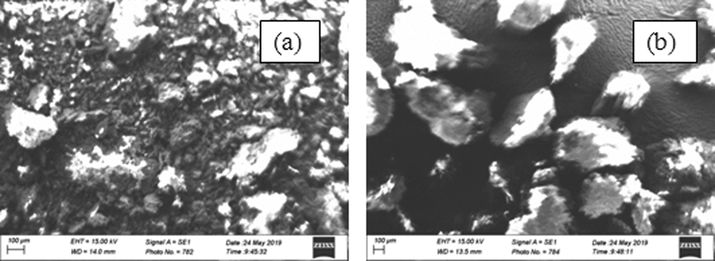
PEF micrograph before (a) and after (b) adsorption process.
Each of the EDX characteristic lines (Figs. S2 a–b) is proportional to the corresponding element (Table S1 a–b). The three major elements detected in PEF before adsorption process are carbon by weight (63.36%) and by atom (79.30%), oxygen by weight (7.95%) and by atom (7.44%) and Calcium by weight (13.85%) and by atom (5.21.30%) as shown in Table S1 a. Carbon and oxygen content in PEF increased slightly after adsorption. By weight and by atom, carbon increments are 3.71% and 1.78% respectively, while oxygen increments are 13.96% and 11.69% respectively. Calcium reductions by weight and by atom are 22.82% and 24.18% respectively. Nitrogen, among other elements in PEF increased slightly after adsorption process by weight (8.16%) and by atom (3.80%) as shown in Table S1 b. This observations established adsorption of CB dye onto PEF (Bello et al., 2017).Fig. S3 shows results of PEF N2 adsorption–desorption isotherms obtained at 77 K. It displays type II isotherm with increase in amount of N2 as relative pressure increased. The calculated surface area, pour volume and diameter are 362.84 m2/g, 48.22 cm3/g and 1.81 nm respectively. PEF high surface area suggests possibility of having good adsorption capacity for removal of CB dye from aqueous solution according to Pang et al. (2018a).
Structural features of PEF before and after adsorption process were studied using XRD diffraction patterns in Figs. S4 a and b respectively. The peaks at 9.8°, 19.6° and 28.9° in Fig. S3a were indexed to (0 0 2), (1 0 1) and (1 0 2) reflections respectively, indicating that PEF is in amorphous state (Kalantary et al., 2015). After adsorption process, there was a slight shift in diffraction peaks with another two emerged peaks at 32.4° and 52.8° which were characteristics of (1 0 5) reflection, indicating that CB dye species were successfully loaded on PEF as shown in Fig. S3b.
3.2 Adsorption mechanism
3.2.1 pH study
Removal of CB dye from aqueous solution is significantly pH dependent. CB dye decomposed in water to form CB dye cationic specie and chlorine anion (Scheme 1a). Effect of pH on adsorption of CB dye onto PEF can be said to have three parts according to Pang et al. (2018b). CB dye removal (%) increased rapidly in part I (pH between 2 and 8) as shown in Fig. 3a. This is because in the acidic medium, small amount of CB dye molecules were adsorbed due to the electrostatic repulsion between the protonated PEF surface and CB dye cationic species (Scheme 1b). As the pH value increased, protonation relaxed and repulsive force between the protonated PEF surface and CB dye cationic species reduced leading to increase in quantity of CB dye adsorbed onto PEF (Pang et al., 2019). Contrarily, in alkaline medium, there was electrostatic attraction between cationic CB dye species and PEF hydroxyl, carboxylic and/or carbonyl anionic surface (Scheme 1b), leading to increase in CB dye adsorbed onto PEF as pH increased according to (Pang et al., 2018a). A little increase in percentage CB dye removal was observed in part II (pH between 8 and 10). This might be due to weak competition between functional group(s) (—OH, C—O and/or C⚌O) on PEF and —OH of mild alkaline medium for cationic CB dye (Pang et al., 2018b). Increase in pH value from 10 to 12 led to slight reduction in quantity of CB dye removed from aqueous solution (part III). This observation might be as a result of strong competition between functional group(s) on PEF (leading to adsorption) and —OH of strong alkaline medium at pH > 10 (leading to desorption) for cationic CB dye (Yu et al., 2019). However, overwhelming concentration of PEF compared to hydroxyl ion of strong alkaline medium at pH > 10 made adsorption to predominate, leading to slight reduction in CB dye adsorbed onto PEF between pH 10 and 12 according to Popoola (2015).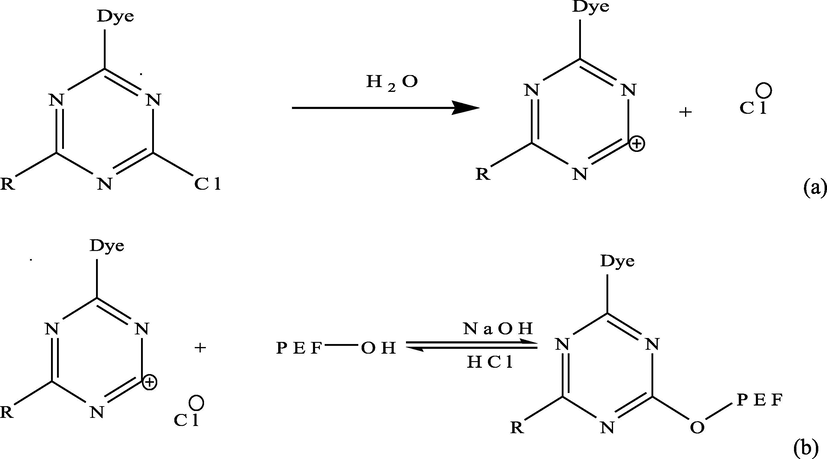
Decomposition of CB dye in water (a) and adsorption of CB dye onto PEF (b).
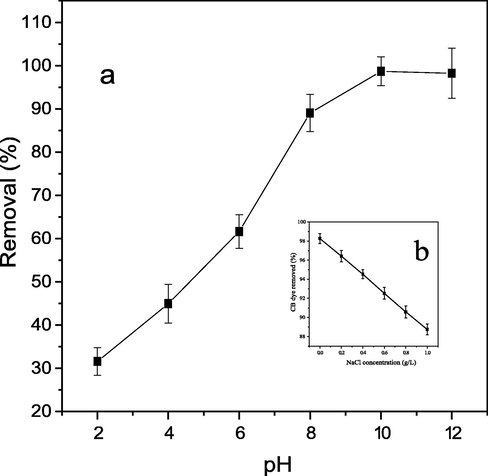
Effect of pH (a) and NaCl ionic strength (b) on percentage CB dye removal.
3.2.2 Salinity studies
Increase in NaCl ionic strength in CB dye aqueous solution led to decrease in percentage CB dye removed (Fig. 3b). This observation could be attributed to competition between Na+ and CB dye cationic species for being adsorbed onto limited active sites in PEF (El-Sayed, 2011).
Generally, the adsorption mechanism could be regarded as both inner-sphere (chemisorption) and outer-sphere (physiosorption) surface coordination, since the adsorption process is both pH and ionic strength dependent according to Pang et al. (2018a) in macroscopic and microscopic investigation of uranium elimination by Ca-Mg-Al-layered double hydroxide supported nanoscale zero valent iron.
3.3 Contact time and kinetic studies
The quantity of CB dye removed using PEF as adsorbent is time dependent as shown in Fig. 4. The percentage CB dye removed from aqueous solution is above 70% within the 15 min of adsorption process. Indicating that quantity of CB dye adsorbed on PEF increased rapidly as adsorption time increased. This might be as a result of high diffusion rate of CB dye molecules from aqueous solution onto available vacant active sites on the adsorbent Nethaji et al., 2013. After adsorption period of 45 min, insignificant increment in percentage CB dye removed from aqueous solution was noticed. This observation might probably due to reduction in active sites/pores on PEF as time increases above 45 min. These findings are in good agreement with Kannan and Sundaram (2001).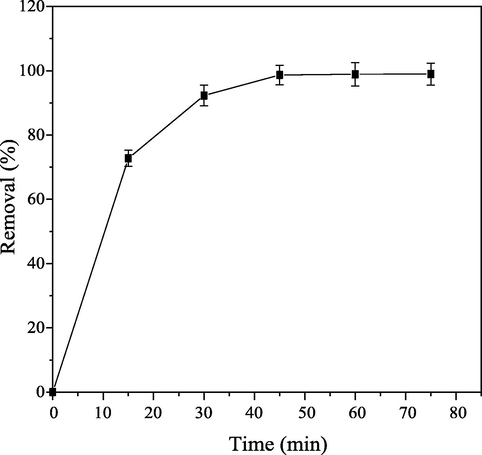
Influence of contact time on percentage CB dye removal.
Data obtained from effect of contact time on percentage CB dye removed from aqueous solution were used to investigate kinetic model of adsorption using pseudo first (Eq. (4)) and second-order kinetic model (Eq. (5)). These data were equally used in investigation of mechanism of adsorption of CB dye onto PEF by fitting them into intraparticle diffusion (Eq. (6)) and Boyd model (Eq. (7)).
Pseudo first-order plot is a negative linear graph obtained from plot of
against t (Fig. 5). Although, this model has good correlation coefficient, since R2 value is greater than 0.9 but the value of
is by far greater than
(Table 1). Therefore, this model does not fit with adsorption process according to Hamdaoui (2006). Pseudo second-order plot (Fig. 6) has correlation coefficient R2 value closer to unity and
approximately equal to value of
. These observations showed that pseudo second-order kinetic is better fitted with the kinetic model. This is not in conformity with the findings made by Feng et al. (2011). Calculated dye-uptake, rate constants and correlation coefficient are kinetic parameters obtained from the two models studied (Table 1).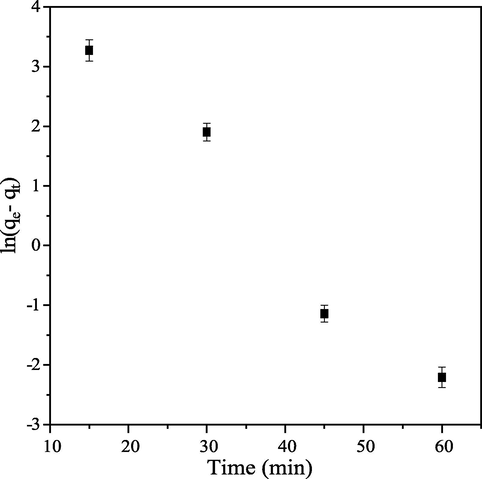
Pseudo first-order kinetic of CB dye onto PEF.
Parameter
Pseudo first-order kinetic
Pseudo second-order kinetic
99.00
99.00
205.41
107.53
0.9652
0.9965
1.30 × 10⁻¹
–
–
1.57 × 10⁻³
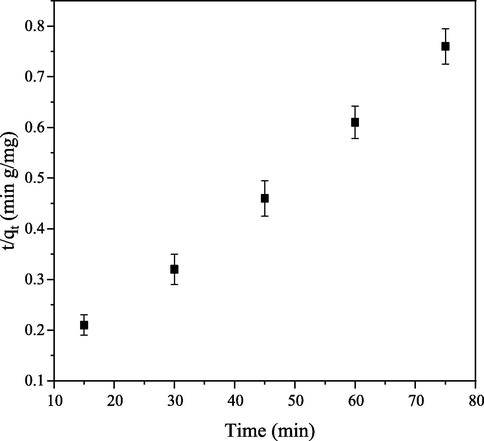
Pseudo second-order kinetic of CB dye onto PEF.
Diffusion mechanism of CB dye molecules onto PEF was investigated using intraparticule diffusion model. Bifacial nature and ability of non linear graph of
against time t1/2 (Fig. 7) not passing through the origin indicated that intraparticle diffusion is not controlling step of adsorption rate and confirmed involvement of other mechanisms (Darwisha et al., 2019).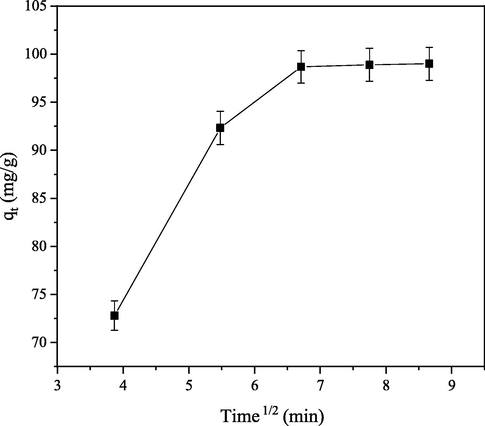
Intraparticule diffusion of CB dye molecules onto PEF.
The nature of other mechanisms involvement in adsorption process was investigated with Boyd kinetic. Boyd plot of Bt against time t (Fig. 8) not passing through the origin confirmed that adsorption mechanism is governed by film diffusion mechanism and not by pore diffusion mechanism. This confirmed that internal transport of CB dye molecules is less than external transport (Aravindhan et al., 2007). Adsorption mechanism parameters for adsorption of CB dye onto PEF are shown in Table 2.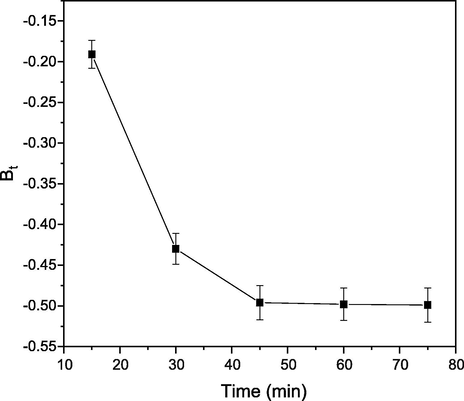
Boyd plot of CB dye molecules onto PEF.
Parameter
Intraparticule diffusion
Boyd kinetic
5.29
–
57.95
–
0.78
0.66
–
−4.60 × 10⁻³
–
−2.18 × 10⁻¹
3.4 Adsorption equilibrium and isotherm studies
Equilibrium experiments were done by varying adsorbent dosage at 0.025 g/100 mL interval, while other parameters were kept constant. It was observed that the percentage CB dye removed from aqueous solution increased, whereas the dye uptake reduced arithmetically as adsorbent dosage increased (Fig. 9). This might be as a result of increase in quantity and available PEF active pore sites for removal of CB dye from aqueous solution as adsorbent dosage increased from 0.025 g/100 mL to 0.100 g/100 mL. Adsorbent dosage above 0.100 g/100 mL resulted into insignificant increase and decrease in percentage dye removed and dye uptake respectively. This could be as a result of great reduction in diffusion rate of CB dye from aqueous solution onto PEF probably due to reduction in the quantity of CB dye molecules left in aqueous solution (Boulaiche et al., 2019).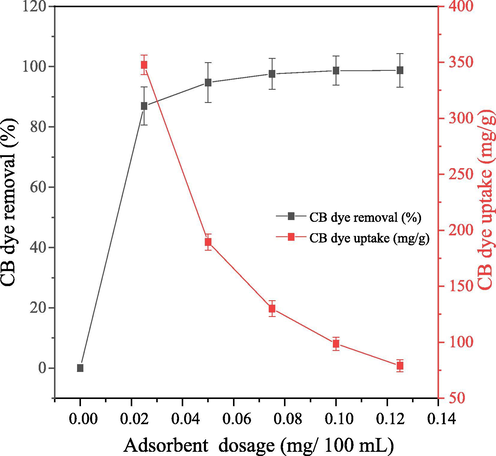
Effect of adsorbent dosage on percentage CB dye removed (%) and dye uptake (mg/g) at equilibrium.
Increase in initial CB dye concentration from 25 mg/L to 150 mg/L led to decrease in percentage CB dye adsorbed onto PEF. This might be as a result of adsorption sites of PEF getting saturated as initial CB dye concentration increased. In contrary, increase in initial CB dye concentration led to increase in CB dye-uptake onto PEF. This might be attributed to the increase in collision rate between CB dye molecule and PEF (Fig. 10). These observations agreed with (Igberase and Osifo, 2015).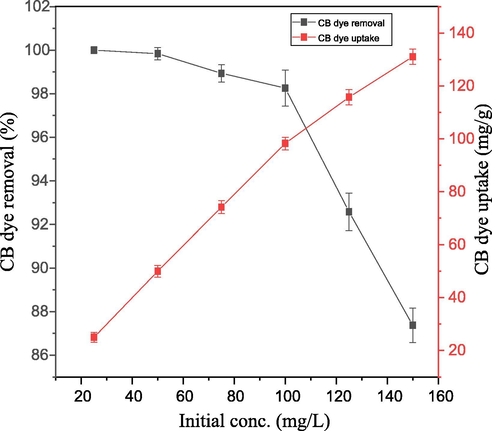
Effect of dye initial concentration on percentage CB dye removed (%) and dye uptake (mg/g) at equilibrium.
Affinity of CB dye molecule for PEF was investigated using adsorption isotherm models. The models used in the investigation were Freudlinch and Langmuir models.
Freundlich isotherm relates CB dye uptake to concentration of adsorbate left after adsorption process. Linearized form of Freundlich equation is shown in Eq. (8).
Langmuir isotherm describes distribution of CB dye molecules between particle (solid) phase and liquid phase. Linearized form of Langmuir equation is shown in Eq. (9).
Dimensionless separation factor
related to
(Eq. (10)) describes favorability of Langmuir isotherm called separation factor.
Plots of
Fig. 11) and
against
Fig. 12) are linear graphs of Freundlich and Langmuir isotherm respectively. Where
and
are intercept and slope of Freundlich graph and
and
are intercept and slope of Langmuir graph respectively.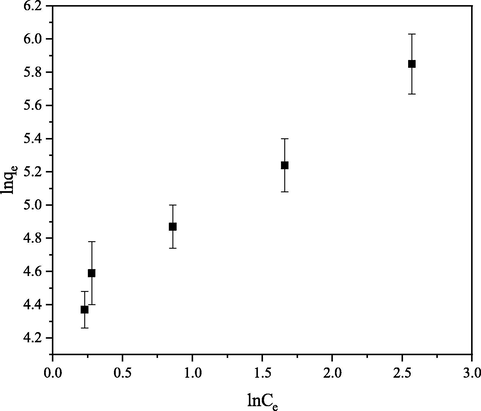
Freundlich linearized graph for the removal of CB dye from aqueous solution.
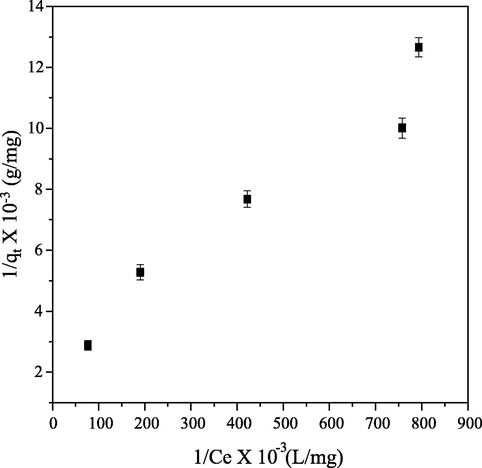
Langmuir linearized graph the removal of CB dye from aqueous solution.
Table 3 shows correlation coefficient (R2) of both models to be greater than 0.9. Langmuir dimensionless separation factor
greater than zero and less than one (0 <
< 1) is an indication of adsorption process’ feasibility. Equally, reciprocal of Freundlich adsorption intensity (
) greater than zero and less than one (0 <
< 1) is an indication of adsorption process’ favorability (Table 3). These observations are indicating good fit of the both models to adsorption of CB from aqueous solution. CB dye adsorption on PEF can be said to be better fitted with Freundlich isotherm, because of R2 value is greater than that of Langmuir. This confirmed that the surface of PEF is heterogeneous, adsorption of PEF on CB dye was multilayer and adsorption was through physical than chemical process. This observation disagreed with findings made by Jethave and Fegade, (2018).
Parameter
Langmuir isotherm
Freundlich isotherm
393.67
–
0.22
–
0.04
–
0.95
0.98
(
)
–
76.18
(
)
–
1.70
Evaluation of the performance of PEF as adsorbent in removal of CB dye from aqueous solution was done by comparing its adsorption capacity with those of other agro-based activated carbons used as adsorbents in other studies for removal of dyes from aqueous solution. The results presented in Table 4 shows that PEF is a better adsorbent for removal of dye from aqueous solution due to possession of the highest adsorption capacity. The higher adsorption capacity of PEF than those of other six activated carbons might be due to difference in its functional groups (O—H, —CN, —C⚌O, C—O) and surface area if compared to others.
Adsorbent
Dye
Adsorption capacity (mg/g)
Reference
Oil palm shell
Basic dye
243.90
Tan et al. (2008)
Oil palm fibre
Basic dye
277.78
Tan et al. (2007)
Palm kernel fibre
Methylene blue
217.95
Ofomaja (2007)
Sugar beet pulp
Remazol black B
80.00
Dursun et al. (2013)
Sisial fibre
Reactive orange 4
250.30
Senthilkumar et al. (2013)
Tapioca peel
Reactive brown C4R
121.40
Parvathi et al. (2010)
Oil palm empty fruit bunch
Cibacron blue 3G-A
393.67
This study
3.5 Adsorption thermodynamics
The role of temperature in adsorption of CB on PEF was investigated through variation of temperature from 301 K to 343 K, other parameters were kept constant. The quantity of CB dye removed from aqueous solution was noticed to increase slightly as temperature increased from 301 K to 343 K (Fig. 13). Therefore, one can say that adsorption process is endothermic in nature according to Atun et al. (2003).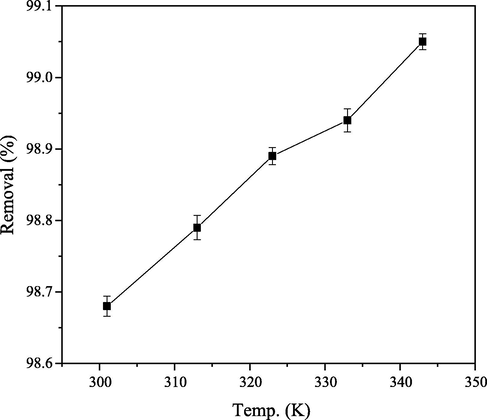
Percentage CB dye removed (%) at different temperature.
Information obtained from effect of temperature on adsorption process was investigated using van’t Hoff equation (Eq. (11)).
Plot of
against
is a linear graph of van’t Hoff (Fig. 14), where slope and intercept were used to evaluate entropy and enthalpy and subsequently Gibb’s free energy. The value of less than 40
kJ/mol and positive indicated that adsorption process was physiosorption and endothermic (Travlou et al., 2013). The positive value of ΔS assessed to be so large showed the increase of randomness state at the PEF/CB interface during adsorption (collision rate), while negative value of ΔG indicated that adsorption process was feasible and spontaneous (Table 5). These observations were in line with findings made by Darwisha et al. (2019).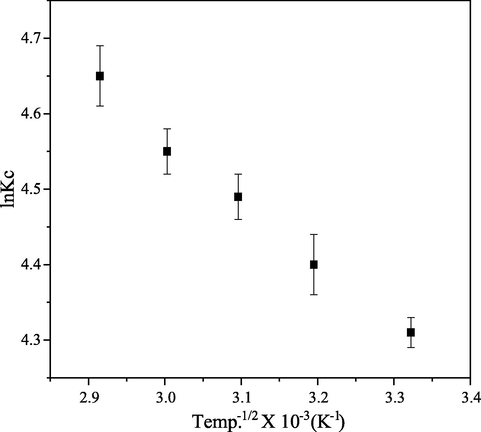
van’t Hoff plot on adsorption of CB dye onto PEF.
Temperature (K)
ΔH (kJ/mol)
ΔS (kJ/mol K)
ΔG (MJ/mol K)
301
6.83
9.11
−2.74
313
6.83
9.11
−2.85
323
6.83
9.11
−2.94
333
6.83
9.11
−3.03
343
6.83
9.11
−3.12
3.6 Desorption and regeneration studies
Seven cycles of adsorption–desorption studies were carried out to determine reusability of PEF as adsorbent for removing CB dye from aqueous solution. A little decrease in CB dye removal efficiency was observed from the first to the last regeneration cycle (Fig. 15b). The high desorption ratio (99.05–92.27%) (Fig. 15a) observed even after seventh cycle of adsorption–desorption process might be due to protonation of carbonyl and/or hydroxyl group(s) at the surface of PEF in acidic medium. The protonated PEF repelled CB dye cationic species and released them from the PEF surface into desorption solution. Regeneration of PEF from aqueous solution is economical as it can easily be revived from CB dye loaded PEF in acidic medium.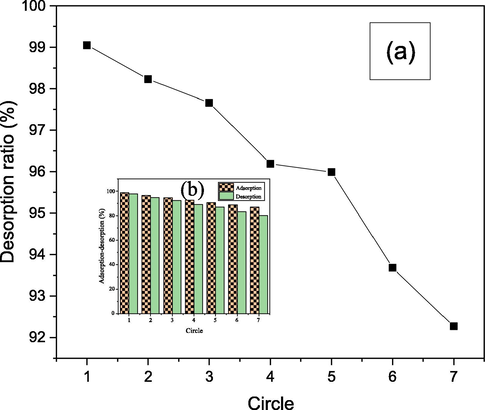
Regeneration of PEF using 0.3 M HCl as desorption solvent.
4 Conclusion
The adsorption experiments indicated that PEF was effective in removing greater than 99% of CB dye from aqueous solution within 45 min with high desorption ratio of 92.27% after seventh cycle of adsorption-desorption experiments. The kinetic of adsorption conformed to pseudo-second-order model indicating chemisorption adsorption process. Isotherm studies were well described by the Freundlich, confirming the multilayer, heterogeneous and physisorption adsorption process. External mass transfer was adsorption rate controlling step and entire process was endothermic. The adsorption mechanism could be regarded as both inner-sphere (chemisorption) and outer-sphere (physiosorption) surface coordination. Therefore, PEF is a low cost, eco-friendly and potential alternative adsorbent to high cost commercial adsorbents for treatment of dye contaminated wastewater.
Acknowledgement
The authors appreciate technical support of the staff members of the Polymer and Textile Laboratory of the Chemistry Department, the Federal University of Technology, Akure, Nigeria.
Declaration of Competing Interest
The authors declare that they have no known competing financial interests or personal relationships that could have appeared to influence the work reported in this paper.
References
- Scavenging behavior of meranti sawdust in removal of Methylene Blue from aqueous solution. J. Hazard. Mater.. 2009;170:357.
- [Google Scholar]
- Biosorption of reactive dyes by dried activated sludge: equilibrium and kinetic modelling. Biochem. Eng. J.. 2001;7:79-84.
- [Google Scholar]
- Al-Ghouti, Khraisheh, M.A.M., Allen, S.J., Ahmad, M.N., 2003. The removal of dyes from textile wastewater: a study of physical characteristics and adsorption mechanisms of diatomaceous earth. J. Environ. Manage. 69 (3), 229–238.
- Health and environmental effects of persistent organic pollutants. J. Mol. Liq.. 2018;263:442-453.
- [CrossRef] [Google Scholar]
- New generation adsorbents for water treatment. Chem. Rev.. 2012;112:5073-5091.
- [CrossRef] [Google Scholar]
- Microwave assisted economic synthesis of multi walled carbon nanotubes for arsenic species removal in water: batch and column operations. J. Mol. Liq.. 2018;271:677-682.
- [CrossRef] [Google Scholar]
- Speciation of arsenic and chromium metal ions by reversed phase high performance liquid chromatography. Chemosphere. 2002;48:275-278.
- [Google Scholar]
- Ali, I., Alharbi, O.M.L., ALOthman, Z.A., Alwarthan, A., 2018c. Facile and eco-friendly synthesis of functionalized iron nanoparticles for cyanazine removal in water. Colloids Surfaces B: Biointerfaces 171, 606–613. doi:10.1016/j.colsurfb.2018.07.071.
- Ali, I., Alharbi, O.M.L., ALOthman, Z.A., Badjah, A.Y., 2018d. Kinetics, Thermodynamics and Modelling of Amido Black Dye Photodegradation in Water Using Co/TiO2 Nanoparticles. Photochem. Photobio. 94, 935–941. doi: 10.1111/php.12937.
- Ali, I., Alharbi, O.M.L., ALOthman, Z.A., Al-Mohaimeed, A.M., Alwarthan, A., 2019b. Modeling of fenuron pesticide adsorption on CNTs for mechanistic insight and removal in water. Environ. Res. 170, 389–387. doi:10.1016/j.envres.2018.12.066
- Ali, I., Alharbi, O.M.L., ALOthman, Z.A., Alwarthan, A., Al-Mohaimeed, A.M., 2019c. Preparation of a carboxymethylcellulose-iron composite for uptake of atorvastatin in water. Int. J. Biol. Macromol. 132, 244–253. doi:10.1016/j.ijbiomac.2019.03.211.
- Artificial neural network modelling of amido black dye sorption on iron composite nano material: Kinetics and thermodynamics studies. J. Mol. Liq.. 2018;250:1-8.
- [CrossRef] [Google Scholar]
- Water treatment by new-generation graphene materials: hope for bright future. Environ. Sci. Pollut. Res.. 2018;25:7315-7329.
- [CrossRef] [Google Scholar]
- Removal of secbumeton herbicide from water on composite nanoadsorbent. Desal., Water Treat.. 2015;5:28.
- [CrossRef] [Google Scholar]
- Supra molecular mechanism of the removal of 17-β-estradiol endocrine disturbing pollutant from water on functionalized iron nano particles. J. Mol. Liq.. 2017;441:123-129.
- [CrossRef] [Google Scholar]
- Ali, I., Asim, M., Khan, T.A., 2013. Arsenite removal from water by electro- coagulation on zinc–zinc and copper–copper electrodes. Int. J. Environ. Sci. Technol. 10, 377–384. doi:10.1007/s13762-012-0113-z.
- Ali, I., Basheerc, A.A Mbianda, X.Y., Burakov, A., Galunin, E., Burakova, I., Mkrtchyan, E., Tkachev, A., Grachev, V., 2019a. Graphene based adsorbents for remediation of noxious pollutants from wastewater. Environ. Int. 127, 160–180. doi:10.1016/j.envint.2019.03.029.
- Ali, I., Burakov, A.E., Melezhik, A.V Babkin,A.V., Burakova, I.V., Neskomornaya, E.A., Galunin, E.V., Tkachev, A.G., Kuznetsov, D.V., 2019d. Removal of Copper(II) and Zinc(II) ions in water on a newly synthesized polyhydroquinone/graphene nanocomposite material: kinetics, thermodynamics and mechanism. Chem. Select. 4, 12708–12718. doi:10.1002/slct.201902657.
- Treatment and remediation methods for arsenic removal from the ground water. Int. J. Environ. Eng.. 2011;3(1):48-71.
- [Google Scholar]
- The adsorption kinetics and removal of cationic dye, Toluidine Blue O, from aqueous solution with Turkish zeolite. J. Hazard. Mater.. 2008;151:213-220.
- [Google Scholar]
- Kinetic and thermodynamic studies on the adsorption behavior of Rhodamine B dye on Duolite C-20 resin. J. Saudi Chem. Soc.. 2012;16:209-215.
- [Google Scholar]
- Al-Shaalan, N.H., Ali, I., ALOthman, Z.A., Al-Wahaibi, L.H., Alabdulmonem, H., 2019. High performance removal and simulation studies of diuron pesticide in water on MWCNTs. J. Mol. Liq. 289, 111039. doi:10.1016/j.molliq.2019.111039.
- Al-Shaalan, N.H., Ali, I., ALOthman, Z.A., Al-Wahaibi, L.H., Alabdulmonem, H., 2019. Application of composite nanomaterial to determine phenols in wastewater by solid phase micro membrane tip extraction and capillary electrophoresis. Molecules 24, 3443.
- Aravindhan, R., Rao, J.R., Nair, B.U., 2007. Removal of basic yellow dye from aqueous solution by sorption on green alga Caulerpa scalpelliformis. J. Hazard. Mater. 142 (1–2), 68–76.
- Adsorptive removal of methylene blue from colored effluents on fuller, s earth. J. Colloid. Interface Sci.. 2003;261:32-39.
- [Google Scholar]
- Evaluation of basic violet 16 adsorption from aqueous solution by magnetic zero valent iron-activated carbon nanocomposite using response surface method: Isotherm and kinetic studies. J. Mazandaran Univ. Med. Sci.. 2015;25(121):333-347.
- [Google Scholar]
- Badi, M.Y., Azari, A., Pasalari, H., Esrafili, A., Farzadkia, M., 2018. Modification of activated carbon with magnetic Fe3O4 nanoparticle composite for removal of ceftriaxone from aquatic solutions. J. Mol. Liq. doi:10.1016/j.molliq.2018.04.019.
- Chemical chiral pollution: Impact on the society and science and need of the regulations in the 21st century. Chirality. 2017;30:402-406.
- [CrossRef] [Google Scholar]
- Stereoselective uptake and degradation of (±)-o, p-DDD pesticide stereomers in water-sediment system. Chirality. 2018;30:1088-1095.
- [CrossRef] [Google Scholar]
- Adsorptive removal of chromium (VI) from aqueous solution unto groundnut shell. Appl. Water Sci.. 2019;9:107.
- [Google Scholar]
- Baziar, M., Azari, A., Karimaei, M., Gupta, V.K., Agarwal, S., Sharafi, K. Maroosi, M., Shariatifar, N., Dobaradaran, S., 2017. MWCNT-Fe3O4 as a superior adsorbent for Microcystins LR removal: investigation on the magnetic adsorption separation, artificial neural network modeling, and genetic algorithm optimization. J. Mol. Liq. doi:10.1016/j.molliq.2017.06.014.
- Bello, O.S., Adegoke, K.A., Akinyemi, O.O., 2017. Preparation and characterization of a novel adsorbent from Moringa olefera leaf.
- Berizi, Z., Hashemi, S.Y., Hadi, M., Azari, A., Mahvi, A.H., 2016. The study of non-linear kinetics and adsorption isotherm models for Acid Red 18 from aqueous solutions by magnetite nanoparticles and magnetite nanoparticles modified by sodium alginate. Water Sci. Tech. doi:10.2166/wst.2016.320.
- Removal of heavy metals by chitin: equilibrium, kinetic and thermodynamic studies. Appl. Water Sci.. 2019;9:39.
- [Google Scholar]
- Application of carbon adsorbents prepared from Brazilian-pine fruit shell for the removal of reactive orange 16 from aqueous solution: kinetic, equilibrium, and thermodynamic studies. J. Environ. Manage.. 2010;91:1695-1706.
- [Google Scholar]
- Chukki, J., Abinandan, S., Shanthakumar, S., 2018. Chrysanthemum indicum microparticles on removal of harzadous congo reddye using response surface methodology. Int’l. J. Ind. Chem. 9, 305–316.
- Decolorization of dye solution containing acid red 14 by electrocoagulation with a comparative investigation of different electrode connections. J. Hazard. Mater.. 2004;112:55-62.
- [Google Scholar]
- Darwisha, A.A.A., Rashad, M., AL-Aoh, H.A., 2019. Methyl orange adsorption comparison on nanoparticles: Isotherm, kinetics, and thermodynamic studies. Dyes Pigms. 160, 563–571.
- Dobaradaran, S., Nodehid, R.N., Yaghmaeian, K., Jaafari, J., Niari, M.,H., Bharti, A.K., Agarwal, S., Gupta, V.,K., Azari, A., Ahmadi, E., Shariatifar, N., 2017. Catalytic decompositionof 2-chlorophenol using an ultrasonic-assisted Fe3O4–TiO2@MWCNT system: influence factors, pathway and mechanism study. J. Colloid Interface Sci. doi:10.1016/j.jcis.2017.10.015.
- Kinetics of Remazol Black B adsorption onto carbon prepared from sugar beet pulp. Environ. Sci. Pollut. Res.. 2013;20:2472-2483.
- [CrossRef] [Google Scholar]
- Removal of methylene blue and crystal violet from aqueous solutions by palm kernel fiber. Desalination. 2011;272:25-232.
- [Google Scholar]
- Coconut coir dust as a low cost adsorbent for the removal of cationic dye from aqueous solution. J. Saudi Chem. Soc.. 2016;20:S67-S76.
- [Google Scholar]
- Feng, Guo, X., Liang, S., Zhu, Y., Liu, J., 2011. Biosorption of heavy metals from aqueous solutions by chemically modified orange peel. J. Hazard. Mater. 185, 49–54.
- Basic dye (Methylene Blue) removal from simulated wastewater by adsorption using Indian rosewood sawdust. Dyes Pigms.. 2004;63:243-250.
- [Google Scholar]
- Adsorption of Safranin-T from waste water using materialsactivated carbon and activated rice husk. J. Colloid. Interface Sci.. 2006;303:80-86.
- [Google Scholar]
- Batch study of liquid-phase adsorption of methylene blue using cedar sawdust and crushed brick. J. Hazard. Mater.. 2006;B135:264-273.
- [Google Scholar]
- A novel agricultural waste adsorbent for the removal of cationic dye from aqueous solutions. J. Hazard. Mater.. 2009;162:305-311.
- [Google Scholar]
- Equilibrium, kinetic, thermodynamic and desorption studies of cadmium and lead by polyaniline grafted cross-linked chitosan beads from aqueous solution. J. Ind. Engin. Chem.. 2015;26:340-347.
- [Google Scholar]
- Design and synthesis of Zn0.3Fe0.45O3 nanoparticle for efficient removal of congo red dye and its kinetic and isotherm investigation. Int’l. J. Ind. Chem.. 2018;9:85-97.
- [Google Scholar]
- Adsorption of metal ions on nitrogen surface functional groups in activated carbons. Langmuir. 2002;18:470-478.
- [Google Scholar]
- Kalantary, R.R., Dehghanifard, E., Mohseni-Bandpi, A., Rezaei, L., Esrafili, A., Kakavandi, B. Azari, A., 2015. Nitrate adsorption by synthetic activated carbon magnetic nanoparticles: kinetics, isotherms and thermodynamic studies, Desal. Water Treat. doi:10.1080/19443994.2015.1079251.
- Kinetics and mechanism of removal of methylene blue by adsorption on various carbons: a comparative study. Dyes Pigms.. 2001;51(1):25-40.
- [Google Scholar]
- Karami, A., Karimyan, K., Davoodi, R., Karimaei, M., Sharafie, K., Rahimi, S., Khosravi, T., Miri, M., Sharafi, H., Azari, A., 2017. Application of response surface methodology for statistical analysis, modeling, and optimization of malachite green removal from aqueous solutions by manganese-modified pumice adsorbent, Desal. Water Treat. doi:10.5004/dwt.2017.21366.
- Application of Brazilian-pine fruit coat as a biosorbent to removal of reactive red 194 textile dye from aqueous solution, kinetics and equilibrium study. J. Hazard. Mater.. 2008;155:536-550.
- [Google Scholar]
- Mesdaghinia, A, Azari, A., Nodehi, R.N., Yaghmaeian, K., Bharti, A.K., Agarwal, S., Vinod Gupta, V.K., Sharafi, K., 2017. Removal of phthalate esters (PAEs) by zeolite/Fe3O4: investigation on the magnetic adsorption separation, catalytic degradation and toxicity bioassay. J. Mol. Liq. doi:10.1016/j.molliq.2017.02.094.
- Mirzaei, N., Ghaffari, H.R., Sharafi, K., Velayati, A., Hoseindoost, G., Adabi, S., Mahvi, A.H., Azari, A., Dindarloo, K., 2017. Modified natural zeolite using ammonium quaternary based material for Acid red 18 removal from aqueous solution. J. Environ. Chem. Eng. doi:10.1016/j.jece.2017.06.008.
- Comparative study of different clean-up techniques for the determination of λ-cyhalothrin and cypermethrin in palm oil matrices by gas chromatography and cypermethrin in palm oil matrices by gas chromatography with electron capture detection. Food Chem.. 2012;134:2489-2496.
- [Google Scholar]
- Adsorption isotherms, kinetics and mechanism for the adsorption of cationic and anionic dyes onto carbonaceous particles prepared from Juglans regia shell biomass. Int’l. J. Environ. Sci. Technol.. 2013;10:231-242.
- [Google Scholar]
- Sorption dynamics and isotherm studies of methylene blue uptake onto palm kernel fibre. Chem. Eng. J.. 2007;126:35-43.
- [Google Scholar]
- Adsorptive and reductive removal of U(VI) by Dictyophora indusiate-derived biochar supported sulfide NZVI from wastewater. Chem. Eng. J.. 2019;366:368-377.
- [CrossRef] [Google Scholar]
- Efficient elimination of U(VI) by polyethyleneimine decorated fly Ash. Inorg. Chem.Front.. 2018;5:2399-2407.
- [CrossRef] [Google Scholar]
- Macroscopic and microscopic investigation of uranium elimination by Ca-Mg-Al-layered double hydroxide supported nanoscale zero valent iron. Inorg. Chem. Front.. 2018;5:2657-2665.
- [CrossRef] [Google Scholar]
- Role of tapioca peel activated carbon TPAC in decolourisation of Red Brown C4R reactive dye. Indian J. Sci. and Tech.. 2010;3(3):290-292.
- [Google Scholar]
- The Chemistry of Colours in Dyes and Pigments. Allen TX US) and Lagos (Nigeria): Wits Publishing Ltd; 2015.
- Removal of basic blue 41 dyes using Persea americana-activated carbon prepared by phosphoric acid action. Int. J. Ind. Chem.. 2017;8:187-195.
- [Google Scholar]
- Parameter optimization of activated carbon production from Agave sisalana and Punica granatum peel adsorbents for CI reactive orange 4 removal from aqueous solution. Clean. 2013;41(8):797-807.
- [CrossRef] [Google Scholar]
- Bioethanol from lignocelluloses: status and perspectives in Brazil. Bioresour. Technol.. 2010;101:4820-4825.
- [Google Scholar]
- The use of agricultural waste material, Jujuba seeds for the removal of anionic dye (Congo red) from aqueous medium. J. Hazard. Mater.. 2012;203–204:118-127.
- [Google Scholar]
- Novel adsorbent from agricultural waste (cashew NUT shell) for methylene blue dye removal: Optimization by response surface mehodology. Water Resour. Ind.. 2015;11:64-70.
- [Google Scholar]
- Adsorption of basic dye using activated carbon prepared from oil palm shell: batch and fixed bed studies. Desalination. 2008;225:13-28.
- [Google Scholar]
- Equilibrium and kinetic studies on basic dye adsorption by oil palm fibre activated carbon. Chem. Eng. J.. 2007;127:111-119.
- [Google Scholar]
- Graphite oxide/chitosan composite for reactive dye removal. Chem. Eng. J.. 2013;217:256-265.
- [Google Scholar]
- Three-dimensional graphene/titanium dioxide composite for enhanced U(VI) capture: insights from batch experiments, XPS spectroscopy and DFT calculation. Environ. Pollut.. 2019;251:975-983.
- [CrossRef] [Google Scholar]
Appendix A
Supplementary material
Supplementary data to this article can be found online at https://doi.org/10.1016/j.arabjc.2020.03.020.
Appendix A
Supplementary material
The following are the Supplementary data to this article:Supplementary data 1
Supplementary data 1


