

Translate this page into:
Photo induced antibacterial activity of CeO2/GO against wound pathogens
⁎Corresponding author at: Department of Nanotechnology, SRM Institute of Science and Technology, Kattankulathur 603 203, Chengalpattu District, Tamil Nadu, India. gdevanandvenkatasubbu@gmail.com (G. Devanand Venkatasubbu)
-
Received: ,
Accepted: ,
This article was originally published by Elsevier and was migrated to Scientific Scholar after the change of Publisher.
Peer review under responsibility of King Saud University.
Abstract
Infections are the main cause for delayed wound healing. Graphene oxide (GO) and cerium oxide nanoparticles are used for many biomedical applications because of their biocompatibility and therapeutic property. Cerium Oxide (CeO2)/Graphene Oxide (GO) nanocomposite was synthesized in this work. It shows good antimicrobial property against wound pathogens. The aggregation of CeO2 particles on GO results in the generation of reactive oxygen species (ROS) and inhibits microbial growth. The synthesized nanocomposites were analysed by X-ray diffraction, Transmission electron microscopy, Raman Spectroscopy, UV–vis diffuse reflectance spectroscopy and Fourier transformation-IR spectroscopy. The antimicrobial activity of CeO2/GO nanocomposite was tested against Escherichia coli (E. coli), Pseudomonas aeruginosa (P. aeruginosa) Staphylococcus aureus (S. aureus) and Salmonella typhi (S. typhi). Well diffusion method, growth curve studies, bio film inhibition studies and colony count studies were done in both presence and absence of visible light. The mechanistic investigation was done by the determination of reactive oxygen species (ROS), Lactate dehydrogenase leakage (LDH) assay and DNA fragmentation assay.
Keywords
CeO2/GO
Wound healing
Antibacterial activity
ROS
LDH

1 Introduction
Scientific advancements in medical field have discovered new methods and technologies to enhance the treatment efficiency. They create cost effective ways to treat various pathological and biological conditions worldwide. Nanotechnology is emerging as a promising field and nanomaterials are being utilized in various biomedical applications where these nanoscale materials show unique and distinguished properties (Venkatasubbu et al., 2011; Prasanna and Venkatasubbu, 2018). By using these properties novel drugs and delivery systems are being produced to enhance the treatment in medical as well as biological application (Rajendran et al., 2018).
The skin is the largest organ in human body which is safeguarding our body against external chemical, biological and physical damages. It acts as a protective barrier for our body against microorganisms (Morgado et al., 2014; Fayemi et al., 2018). The composition of skin consists of multiple flat layers which are responsible for its functions. But this protective barrier can be disrupted by injuries or wounds which may occur due to chemical, physical, thermal and microbial injury to the body which interne result in microbial infection in the wound (Aslam et al., 2017). These wounds are determined as the disruption of anatomical and cellular continuity of the tissue. Wounds also results in the disruption of epithelial continuity in the skin with or without the loss of underlying connective tissue. Wound infection is one of the major causes that delays the process of wound healing and turns the wound into chronic wounds. Bacterial infection in wounds are one of the major issues in wound therapy (Prakash et al., 2020). Contamination, colonization, local infection, spreading of invasive infection, and septicaemia are the different stages of wound infection (Niranjan et al., 2019). Biofilm formation is the key factor in wound infection. Biofilms are self-secreted extracellular polysaccharide matrices that provide protection for bacteria. Biofilm formation leads to increase in infection rate, resilience towards environmental stress and metabolic efficiency. The presence of biofilm can further complicate the interaction between the bacteria and dermal injury (Devanand Venkatasubbu and Anusuya, 2017; Niranjan et al., 2019; ThamaraiSelvi et al., 2018).
Natural derived materials such as chitosan, sodium alginate, cellulose, amniotic membrane are highly biocompatible but due to its pH instability, high production cost, low mechanical strength, requires additional transporter/carrier. Time required for the production lead to path for alternative materials (nanomaterials) (Ansari and Husain, 2012; Ali and Ahmed, 2018; Chibber et al., 2013; Salem et al., 2015). Thus, nonmaterial shows a promising way for solving these problems. It was found that the inorganic nonmaterial’s like metal and metal oxides are preferred compared to organic compounds due to their stability (Salem et al., 2015; Sawai, 2003). Metal oxide nanoparticles undergo rapid free radical generation. This leads to further generation of reactive oxygen species (ROS) which creates oxidative stress causing cell dysfunction in microorganism (Kaushik et al., 2019; Venkatasubbu et al., 2018; Shah et al., 2012). Over last few years research has been encouraged on the field of using metal oxide and carbon-based nanoparticle for antibacterial application (Matharu et al., 2020). Various metal oxide nanoparticles such as TiO2, ZnO, SnO2, Al2O3, MgO, ZrO2, AgO and carbon based materials like CNT, graphene, fullerene, quantum dot had been widely studies. However, research in carbon based metal oxide nanocomposites (CeO2/GO) against wound infection pathogen is inadequate (Matharu et al., 2018).
Graphene is a thin sheet of carbon atoms which are bonded by sp2 hybridization having a hexagonal configuration. It has allotropes like graphene oxide (GO) and reduced graphene oxide (rGO) (Priyadarsini et al., 2018; Matharu et al., 2018). GO has unique physical and chemical properties like high aspect ratio, thermal conductivity large surface area, electronic conductivity, ease to functionalize via different bonding, and better dispensability in water (Abdelhamid and Wu, 2013). Due to its distinguished property graphene oxide had been explored in various biological field such as drug delivery, anticancer, sensing and antibacterial application (Wu et al., 2014; Matharu et al., 2020). GO has more reactive groups that can interact strongly with cells and cell surfaces, showing higher affinity for bacteria and can produces an oxidative stress on its interaction that results in cell apoptosis intern high antibacterial property (Quinteros et al., 2016; Gao et al., 2017; Bassler et al., 2008; Hussein et al., 2019; Khan et al., 2015). GO individually shows photocatalytic activity. GO/metal oxide nanocomposite leads to increase in the photocatalytic activity, which further helps in anti-bacterial mechanism by increase rate of ROS production (Karthik et al., 2017; Cao et al., 2016). But GO shows concentration dependent activity which was reported elsewhere (Prakash et al., 2019).
Cerium oxide (CeO2) is a rare earth metal oxide having a cubic fluorite structure. It has extensive industrial applications in medical, optical and catalysis technology. In biomedical industry, CeO2 is gaining much attention because of its antioxidant, antibacterial, anticancer and biocompatibility property. (Farias et al., 2018; Pelletier et al., 2010; Abdelhamid et al., 2014). Various findings reveal that the size and agglomeration of CeO2 plays an important role in anti-microbial activity (Chen and Stephen, 2018). The antioxidant property of cerium nanoparticles (CNPs) is an noticeable activity, for the incidence of many chronic diseases which can be closely associated with oxidative stress (Farahmandjou et al., 2016). CeO2 shows good photo catalytic activity which further enhances the production of ROS against bacterial cells causing cell death via apoptosis pathway (Farias et al., 2018).
In this work we have prepared carbon material based metal oxide nanocomposites (CeO2/GO). The CeO2/GO nanocomposite was analyzed for its antibacterial activity and mechanism of inhibition against wound infection causing pathogens.
2 Materials and methods
2.1 Synthesis of cerium oxide nanoparticles
CeO2 nanoparticle was synthesized by co-precipitation method (Farahmandjou et al., 2016). 2.17 g Ce(NO3)3·6H2O was dissolved in 250 ml distilled water, and the concentration of Ce(NO3)3 solution was 0.02 M. 250 ml K2CO3 solution (0.03 M) was prepared. 50 ml Ce (NO3)3 solution and 20 ml K2CO3 solution was added to 100 ml of deionised water drop by drop under constant stirring. A white precipitate was formed at pH 6. Finally, after centrifugation and drying at 65 °C for 2 h, the precipitate was calcined at 600 °C for 3 h.
2.2 Synthesis of graphene oxide
Graphite powder (2 g) was added to concentrated H2SO4 (50 ml) under continuous stirring in ice bath. Under vigorous stirring, KMnO4 (6 g) was added slowly to the solution. The ice bath was removed after the addition of KMnO4 followed by stirring the mixture at 35 °C for 24 h till it became pasty brownish in colour. 100 ml distilled water was added slowly to dilute the solution. The temperature was increased to 98 °C and stirred for 15 min. The colour changes to dark brown. 200 ml of distilled water was added under continuous stirring. The resultant solution was further treated with H2O2 which changes the solution from dark brown to yellow colour that indicated the end of the reaction. It was sonicated for 30 min. The solution was centrifuged with 10% HCl and then with distilled water at 3000 rpm for 40 min. The precipitate obtained was dried at 80 °C for 24 h (Chen et al., 2013).
2.3 Synthesis of cerium oxide/graphene oxide nanocomposite
The CeO2/GO nanocomposites was synthesized by dropping GO solution (0.09 g in 100 ml of deionised water) into CeO2 aqueous solution (0.01 mol of Ce(NO3)3 under continuous stirring followed by addition of 0.03 M K2CO3 to attain pH 8. Afterwards the sample was kept for ageing and the product was separated by filtration followed by washing and drying at 60 °C for 12 h (Chen et al., 2011).
2.4 Anti-bacterial assay
The anti-bacterial activity was tested against four bacteria Escherichia coli (E.coli), Pseudomonas aeruginosa (P. aeruginosa) Staphylococcus aureus (S. aureus)and Salmonella typhi (S.typhi)using agar diffusion method at various concentrations (25 μg, 50 μg, 75 μg, 100 μg,). The nutrient agar plate was inoculated with the test organisms and was evenly spread out. The wells were made using a cork borer with a diameter of 6 mm. The samples were loaded in wells and the plates incubated at 37° C for 24 h with samples under both presence and absence of visible light. Illumination was carried out using a 220–240 Volt, 50 Hz, LED bulb of 5 W with a luminescence of 450 Lm. The distance between the bulb and the plate were fixed at 10 cm and same parameters were fixed for illumination in rest of all the experiment. The development of zone of inhibition around the well was measured and recorded (Baskar et al., 2017).
2.5 Growth curve analysis
To examine the bacterial growth in the presence of GO, CeO2 and CeO2/GO nanocomposite, the test organisms were cultured in Luria-Bertani medium (LB) along with different concentrations of the synthesized samples. They are kept in orbital shaking incubator at 180 rpm and incubated at 37 °C in both presence and absence of visible light. A control was maintained without addition of the sample. Spectrophotometer (Shimadzu UV-Spectrophotometer) was used to record the bacterial growth by taking the optical density at every 2 h (for 24 h) in presence and absence of visible light incubated sample. Illumination was carried out using a 5 W LED bulb of 220–240 V, 50 Hz, and 450Lm with a distance of 10 cm between the plates and bulb (same illumination parameters were carried out for the rest of all bacterial experiment) (Baskar et al., 2017).
2.6 Determining the MIC
The Minimum Inhibitory Concentration Assay (MIC) is the process of finding the lowest concentration of a given sample to inhibit particular bacteria by colony count analysis. Different concentrations of nanoparticles (NPs) and nanocomposite (NC) were added to medium having different bacteria E. coli, P. aeruginosa, S. aureus and S. typhi and were serial dilution and cultured in nutrient agar medium. For 24 h the plates were then incubated at 37 °C. After incubation the plates under both presence and absence of visible light showing the lowest visible growth for the bacteria in the lowest concentration are considered as final MIC of the sample (Venkataprasanna et al., 2020).
2.7 Determining the biofilm activity
A flat bottom polystyrene plates having individual 96-well were filled with 180 μl of single bacterial species and cultured for 24 h with MIC concentration of GO, CeO2 and CeO2/GO. The plates were incubated for 4 h at 37° in both presence and absence of visible light. After incubation, the wells were washed with 200 μl distilled water to remove excess bacterial medium. After drying the wells, 0.1% of crystal violet solution was added with distilled water in the well (200 μl per). Removal of excess stain on the wells was carried out by washing it with 300 μl of distilled water. In the end solubilisation of adherent cells was done with 200 μl of ethanol. The absorbance of these wells was then checked by a florescent microscope. The absorbance difference between control and treated wells was considered as an index of bacterial adherence to the surface and thus shows the antibiofilm activity. The percentage of inhibition was calculating using formula (Prema et al., 2020).
2.8 Lactate dehydrogenase leakage assay
The integrity of the bacterial cell membrane treated with NPs was assessed using lactate dehydrogenase assay kit (TOX-7 Siga). Bacterial cells were cultured for 6 h with MIC values of given NPs and NC. After incubation, the medium was centrifuged, after which the LDH assay was done in accordance to the manufacturer’s protocol. Cells treated with 1% Triton X 100 were used as positive control and untreated cells were used as negative control. The samples were incubated under presence and absence of visible light. An absorbance analysis was done at 490 and 690 nm with spectrophotometer ((Shimadzu UV-Spectrophotometer). The release percentage was calculated using a formula: where A = LDH content present in the sample; B = LDH content present in the culture medium; C = maximal LDH content left after cell lysis (Baskar et al., 2017).
2.9 Cellular interaction of CeO2/GO nanocomposite
Cellular interaction of nanocomposite was analysed using Transmission Electron Microscope (JEOL 2000 Fx-II, Tokyo, Japan). The given bacterial cultures were treated and incubated with NC for 24 h at 37 °C and the control group was maintained in the absence of NPs with samples being incubated separately under both presence and absence of visible light. The culture was centrifuged and the obtained cell pellet was observed (Baskar et al., 2017).
2.10 Determining the reactive oxygen species (ROS)
Estimation of intracellular superoxide was done using fluorimeter process by using DCF-DA which is fluorescence sensitive. The cells were seeded in 96- Orifice plate where DCF-DA was added to each well and incubated for 30 min. Later PBS solution was used to remove additional DCF-DA after which a culture medium was added. Cells were seeded with NPs at their MIC concentration and incubated in absence and presence of visible light for 24 h. The excited and emitted fluorescence intensity was read on a fluorescence spectrophotometer at wavelength of 485 nm (Kumari et al., 2014).
2.11 DNA fragmentation assay
The bacteria were incubated for 24 h with MIC values of NPs and NCs where 40 μl of SDS with proteinase K of 5 μl mixture was used. TEG buffer (50 mM Glucose, 25 mM Tris HC1 and 10 mM EDTA, pH 8.0) of 200 μl was later put in to extract DNA in a suspended cell pellet form. Keep the pellet for incubation at 56 °C for an hour. Add phenol/ isoamylalcohol/ chloroform of equalratiosand centrifuge the resultant sample at 4 °C. RNase of 800 μl was added with absolute ethanol and 400 μl of 0.1 M sodium acetate that results in DNA precipitation. The DNA was cleaned and air dried before dissolving it in 1 ml of TE (Tris EDTA) buffer solution. The pattern of DNA was observed by running it in 30 ml of agarose gel with Ethidium bromide (EtBr) (Baskar et al., 2017).
2.12 Statistical analysis
All the experiments were carried out in triplicates (n = 3) and the data were obtained as mean ± S.D. The p-value of < 0.05 was considered to be statistically significant and the statistical analysis was done by using one-way ANOVA.
3 Results
Fig. 1 shows the XRD patterns of GO, CeO2 and CeO2 /GO. The XRD pattern of graphene oxide shows a wide peak at 2θ = 11.6° with (0 0 1) crystal plane. This confirms the XRD pattern profile as graphene oxide. The d spacing calculated for it is 0.386 nm (Siburian et al., 2018). The XRD image confirms the polycrystalline nature of CeO2 NPs. The peaks at 2θ = 28.56°, 33.1°, 47.55°, 56.43° with respect to the (1 1 1), (2 0 0), (2 2 0), (3 1 1), (2 2 2) crystal plane are in well accordance to JCPDS number 65-5923. The XRD profiling of CeO2/GO is similar to CeO2.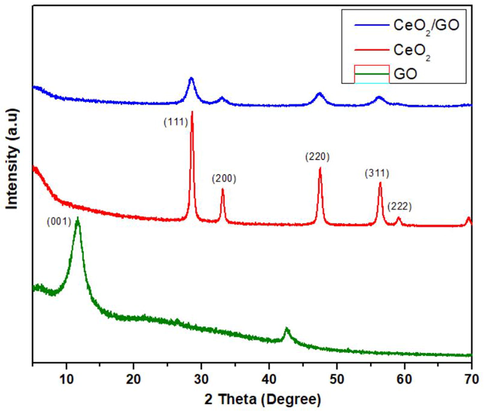
XRD image of GO, CeO2, CeO2/GO nanocomposite.
FTIR spectrum of GO, CeO2 and CeO2/GO nanocomposite was shown in Fig. 2. For spectrum of GO, the absorption peaks at 1103 cm−1, 1384 cm−1 corresponds to the stretching and vibration of C—O and C⚌O bond. Absorption peak of CO2 is observed at 1732 cm−1 and the asymmetric stretching of 2359 cm−1. The presence of OH, C—H bond and vibration is seen at 3442 cm−1 and 2923 cm−1 respectively (Kumar et al., 2013). In FTIR CeO2 NPs the FTIR intense peak was shown at 484 cm−1 corresponding to the Ce—O—Ce stretching mode which is ant symmetric in nature (Kannan and Sundrarajan, 2014). All spectra showed bands around the 400–680 cm−1. These absorption peaks are attributed to vibration mode of the CeO2. The weak absorption peaks at 2354 cm−1 results in bending vibration of C—H band. In addition to this a large band at 3435 cm−1 is present, which is associated with the vibration of OH group corresponding to the residual water and/or hydroxyl groups (Prabaharan et al., 2016; Calvache-Muñoz et al., 2017). The FTIR stretching spectrum of CeO2 /GO NC share identical peaks with CeO2 and GO. The FTIR spectrum of CeO2 /GO NC shows peak at 484 cm−1 including the bands at 2354 cm−1 and 3435 cm−1 of C—H and OH respectively. The absorption peak at 1103 cm−1, 1384 cm−1 and 2359 cm−1 represents C—O, C⚌O bond and CO2 respectively. This confirms the presence of both CeO2 and GO NPs in the CeO2/GO nanocomposite.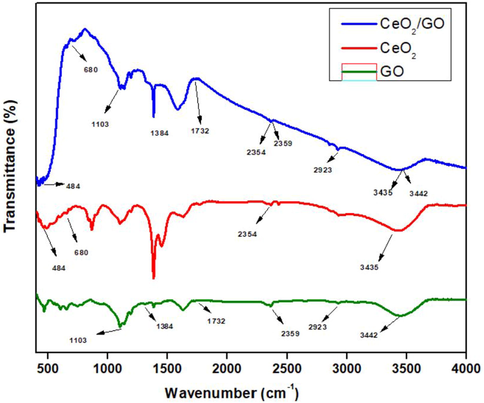
FTIR analysis of GO, CeO2 and CeO2/GO nanocomposite.
Supporting Fig. 1 shows the Raman spectrum of GO, CeO2and CeO2 /GO nanocomposite. The Raman spectrum of GO (Fig. 3a) shows 2 strong bands, which are G band and D band at 1605 cm−1 and 1354 cm−1 respectively. The ID/IG value of graphene oxide is found to be 0.86 (Chen et al., 2013). CeO2 (Fig. 3b) have a single Raman mode at 467 cm−1. The Raman spectrum of CeO2 /GO nanocomposite (Fig. 3c) shows the intense peak of CeO2 at 454 cm−1 resulted due to the blue shift of the F2g band from 467 cm−1 to 454 cm−1.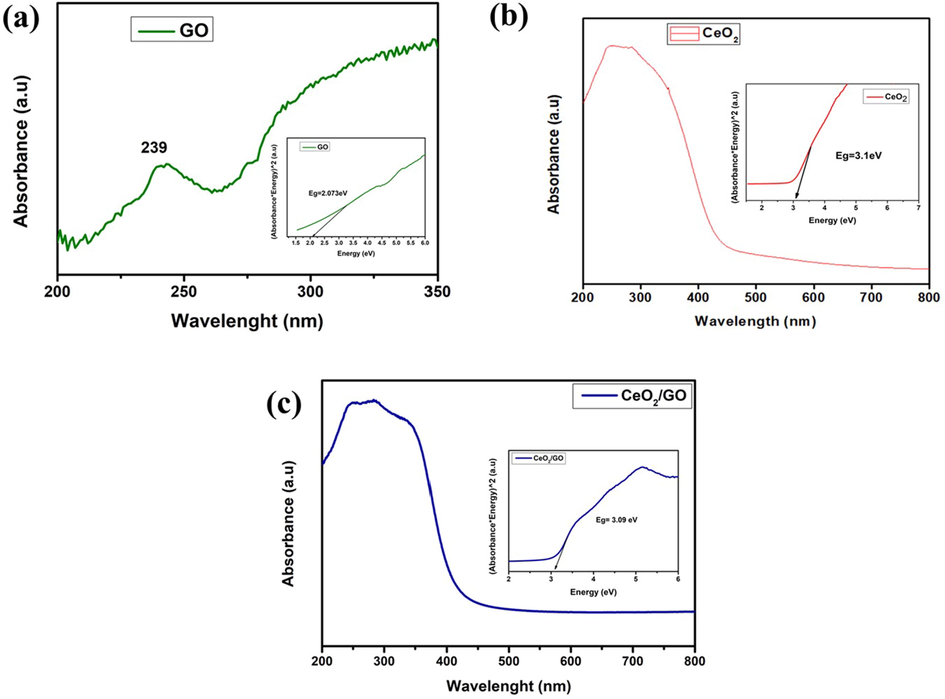
UV–Visible spectroscopy analysis of nanocomposite of (a) GO, (b) CeO2 and (c) CeO2/GO nanocomposite with Tauc plot.
Fig. 3 shows the UV–vis spectra for GO, CeO2 and CeO2 /GO nanocomposite. GO (Fig. 3a) shows an absorption value at 239 nm and has a shoulder peak at ∼290 nm. CeO2 (Fig. 3b) shows a UV–visible absorption value at 349 nm. The energy band gap of CeO2 and CeO2 /GO was observed at 3.1 eV and 3.09 eV respectively.
Fig. 4 represents the TEM image of GO, CeO2 and CeO2 /GO nanocomposite. It shows the shape, size and morphology of the samples. (Fig. 4a) shows the layered nano sheet structure of GO. (Fig. 4b) shows the CeO2 agglomerated nanoparticles. The estimated size of particles was 10–25 nm. Further by observing (Fig. 4c) it is evident that the CeO2 nanoparticles were anchored on the GO nanosheet structure. The red arrow indicates the cerium oxide nanoparticles whereas the yellow arrow indicates the graphene oxide sheet. EDX analysis (Fig. 4d) confirms the presence of CeO2 and GO in the nanocomposite.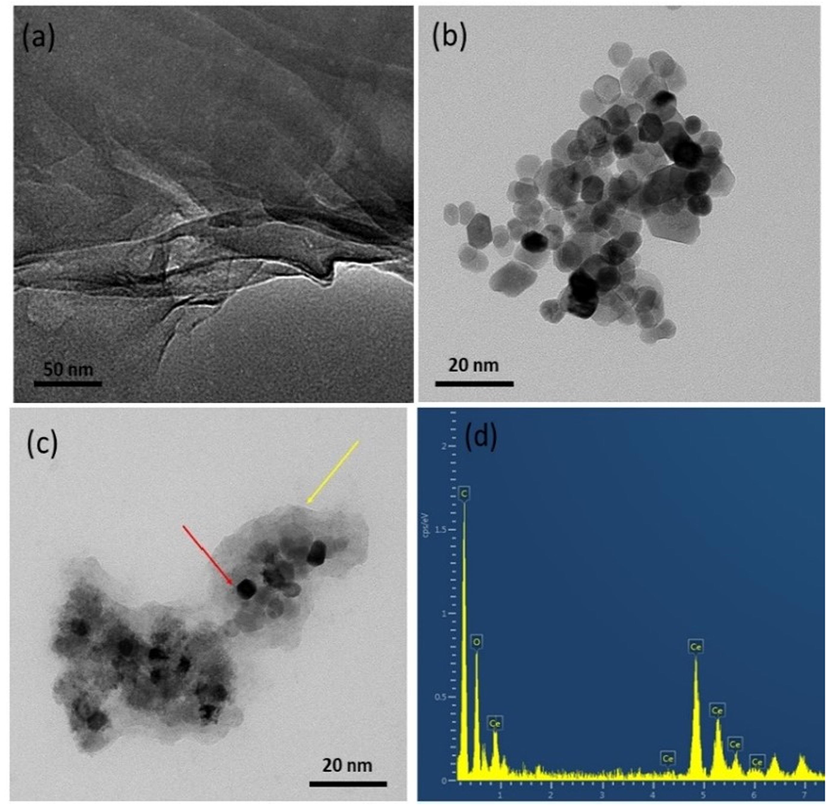
TEM image of nanocomposites (a) GO, (b) CeO2, (c) CeO2/GO, (d) EDX analysis of CeO2/GO.
The inhibitory activity of the samples were studied for different concentrations on different bacteria like E. coli (gram-negative), P. aeruginosa (gram-negative) S. aureus (gram-positive) and S. typhi (gram-negative) by agar diffusion method. The concentrations used were (25 μg/ml, 50 μg/ml, 75 μg/ml, and 100 μg/ml). (Fig. 5) shows the antibacterial activity of GO, CeO2and CeO2 /GO. Gives the zone of inhibition of GO, CeO2 and CeO2 /GO. The inhibitory activity of the samples were studied for different concentrations on different bacteria like E. coli (gram-negative), P. aeruginosa (gram-negative) S. aureus (gram-positive) and S. typhi (gram-negative) by agar diffusion method. The concentrations used were (25 μg/ml, 50 μg/ml, 75 μg/ml, and 100 μg/ml). Shows the antibacterial activity of GO, CeO2 and CeO2 /GO. In the zone of inhibition of GO, CeO2 and CeO2 /GO. GO shows an distinct antibacterial property in both gram-positive and gram negative bacteria showing a value of 6.1 mm at 25 μg/ml, 7 mm at 50 μg/ml, 7.5 mm at 75 μg/ml and 8.2 mm at 100 μg/ml for an E. coli (gram negative). In P. aeruginosa 6.5 mm at 25 μg/ml, 6.9 mm at 50 μg/ml, 7.5 mm at 75 μg/ml and 8.2 mm at 100 μg/ml. For S. typhi the inhibition was 6.8 mm at 25 μg/ml, 7.2 mm at 50 μg/ml, 7.8 mm at 75 μg/ml and 8.7 mm at 100 μg/ml. S. aureus (gram-positive) shows 6.5 mm at 25 μg/ml, 8.3 mm at 50 μg/ml, 8.9 mm at 75 μg/ml and 9.5 mm at 100 μg/ml inhibition zone against S. typhi in absence of visible light. Whereas CeO2also shows zone of inhibition of 6.5 mm at 25 μg/ml, 8.6 mm at 50 μg/ml, 9.1 mm at 75 μg/ml and 10.2 mm at 100 μg/ml for E.coli. For P. aeruginosa the zone of inhibition was 6.4 mm at 25 μg/ml, 9.1 mm at 50 μg/ml, 10 mm at 75 μg/ml and 11.1 mm at 100 μg/ml. A slight increase in the inhibition activity was observed when compared to E. coli (gram-negative). Similarly inhibition of 7.2 mm at 25 μg/ml, 8.5 mm at 50 μg/ml, 9.5 mm at 75 μg/ml and 10.7 mm at 100 μg/ml was shown for S. typhi. S. aureus (gram-positive) shows inhibition of 6.2 mm at 25 μg/ml, 8.3 mm at 50 μg/ml, 9.1 mm at 75 μg/ml and 10 mm at 100 μg/ml in absence of light. The CeO2/GO nanocomposite shows an inhibition zone of 6.4 mm at 25 μg/ml, 9 mm at 50 μg/ml, 9.6 mm at 75 μg/ml and 10.7 mm at 100 μg/ml against E. coli (gram negative). Against P. aeruginosa it shows an inhibition of 6.7 mm at 25 μg/ml, 8.9 mm at 50 μg/ml, 10.5 mm at 75 μg/ml and 11.4 mm at 100 μg/ml. Similarly against S. typhi we observe an inhibition of 8 mm at 25 μg/ml, 8.8 mm at 50 μg/ml, 10 mm at 75 μg/ml and 11.3 mm at 100 μg/ml. S. aureus shows inhibition of 7 mm at 25 μg/ml, 8.4 mm at 50 μg/ml, 9.7 mm at 75 μg/ml and 10.6 mm at 100 μg/ml in absence of visible light. Further antibacterial activity of CeO2/GO, CeO2 and GO nanoparticles in presence of visible light shows an increase in the zone of inhibition. GO NPs showed an inhibition of 6.3 mm at 25 μg/ml, 7.2 mm at 50 μg/ml, 7.6 mm at 75 μg/ml and 8.4 mm at 100 μg/ml for E.coli whereas for P. aeruginosa inhibition of 6 mm at 25 μg/ml, 7.2 mm at 50 μg/ml, 7.6 mm at 75 μg/ml and 8.4 mm at 100 μg/ml was observed. For S. typhi inhibition was 7 mm at 25 μg/ml, 7.4 mm at 50 μg/ml, 7.8 mm at 75 μg/ml and 8.7 mm at 100 μg/ml. S. aureus shows inhibition zone of 6.8 mm at 25 μg/ml, 8.3 mm at 50 μg/ml, 9.3 mm at 75 μg/ml and 9.7 mm at 100 μg/ml which also shows a sharp rise in inhibition zone. SimilarlyCeO2 NP show an inhibition of 6.8 mm at 25 μg/ml, 9.1 mm at 50 μg/ml, 9.7 mm at 75 μg/ml and 10.8 mm at 100 μg/ml against E. coli. For P. aeruginosa the inhibition was 6.2 mm at 25 μg/ml, 9.7 mm at 50 μg/ml, 10.6 mm at 75 μg/ml and 11.4 mm at 100 μg/ml. S. typhi showed an inhibition of 8.8 mm at 25 μg/ml, 8.7 mm at 50 μg/ml, 9.7 mm at 75 μg/ml and 11.1 mm at 100 μg/ml. S. aureus here shows an inhibition zone of 7 mm at 25 μg/ml, 8.6 mm at 50 μg/ml, 9.4 mm at 75 μg/ml and 10.6 mm at 100 μg/ml which shows a sharp rise in inhibition zone suggesting that the antibacterial activity of CeO2 NP increases. CeO2/GO showed the highest inhibition of 6.8 mm at 25 μg/ml, 9.3 mm at 50 μg/ml, 10.3 mm at 75 μg/ml and 11.5 mm at 100 μg/ml respectively in E. coli whereas for P. aeruginosa inhibition of 6.6 mm at 25 μg/ml, 9.1 mm at 50 μg/ml, 10.7 mm at 75 μg/ml and 11.7 mm at 100 μg/ml. S. typhi shows inhibition of 9.2 mm at 25 μg/ml, 9.7 mm at 50 μg/ml, 10.6 mm at 75 μg/ml and 12.1 mm at 100 μg/ml. For S. aureus the values of inhibition shown were 7.5 mm at 25 μg/ml, 8.3 mm at 50 μg/ml, 10.2 mm at 75 μg/ml and 11 mm at 100 μg/ml.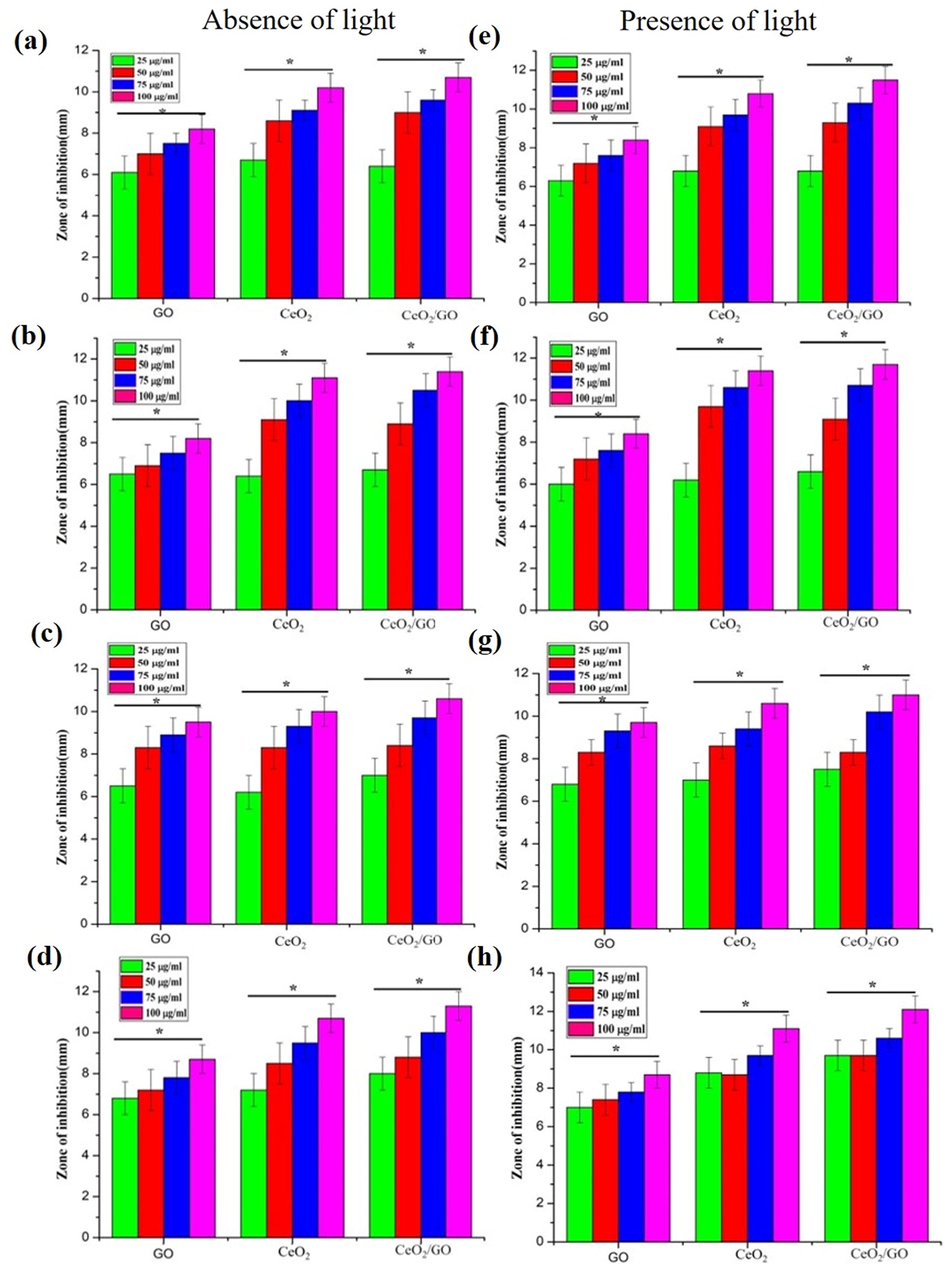
Antibacterial activity of GO, CeO2 and CeO2/GO nanocomposites (a and e) Escherichia coli, (b and f) Pseudomonas aeruginosa, (c and g) Staphylococcus aureus and (d and h) S. typhi in the absence (a, b, c and d) and presence (e, f, g, and h) of light. * Indicates a significant increase compared to GO (p < 0.05).
The growth curve analysis of the bacteria with NPs and NC were examined at a regular interval (up to 24 h) by measuring OD at 600 nm under both presence and absence of visible light. Fig. 6 Shows the bacterial growth curve of GO, CeO2 and CeO2/GO. In general, the growth curve of a bacteria consists of different growth phases: lag, log, exponential and ends at death phase. By observing the growth inhibition in Fig. 6 under the normal condition bacterial cells reached an exponential phase rapidly between 10 and 14 h margin. In presence of nanoparticles at 50 μg, 75 μg, 100 μg concentration for CeO2/GO, GO and CeO2there was a gradual shortening in the log phase. The growth phase of bacterial organisms is different for all control and appears at different time. For E. coli and S. typhi the growth appears after 20th hour (h), whereas for S. aureus it appears at 21th h and for P. aeruginosa it appears after 23th h.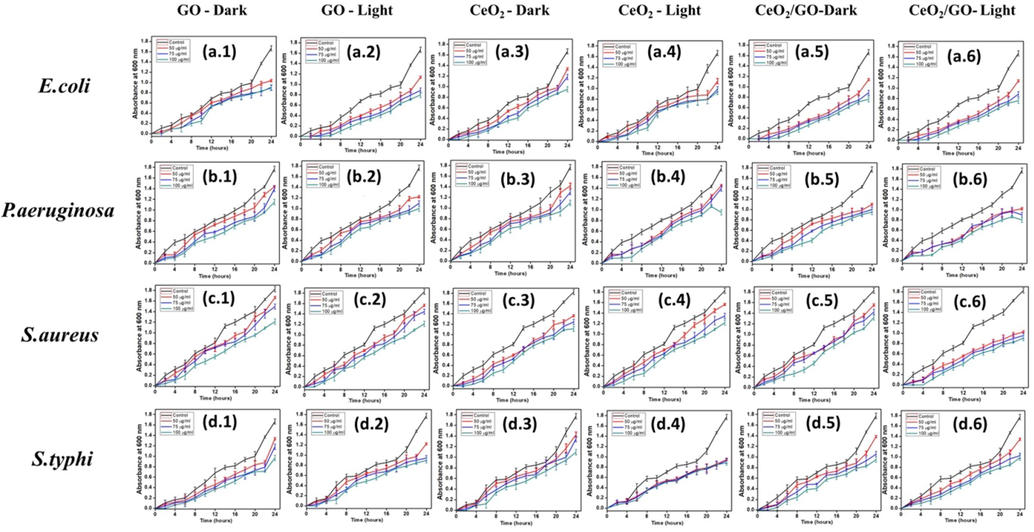
Growth curve of GO (a.1, a.2, b.1, b.2, c.1, c.2, d.1 and d.2), CeO2 (a.3, a.4, b.3, b.4, c.3, c.4, d.3 and d.4) and CeO2/GO(a.5, a.6, b.5, b.6, c.5, c.6, d.5 and d.6) with concentrations of 50 μg, 75 μg, 100 μg treated with E. coli, S. typhi, S. aureus and P. aeruginosa under absence and presence of visible light respectively.
E. coli in absence of visible light treated with CeO2 (Fig. 6 (a.3) shows an abrupt decrease in growth at 16th h of 10.4% at 50 μg whereas growth inhibition increased to 13.7% and 15.1% for 75 μg and 100 μg respectively. At 24th h bacterial mortality decreased by 24.3%, 28.2% and 36.5% for 50 μg, 75 μg and 100 μg respectively. GO (Fig. 6 (a.1) shows a linear growth whereas at 14th h 50 μg and 75 μg shows 14% to 18% growth inhibition whereas at 100 μg inhibition increases to 10.2%. At 24th h the increase in inhibition were 22%, 25.2% and 34.5% for 50 μg, 75 μg and 100 μg respectively. For CeO2/GO (Fig. 6 (a.5) shows a constant retardation in cell mortality is observed where the death rate rises from 15% to 18% from 16th to 18th h for 75 μg and 100 μg. For 24th h an overall decrease in growth inhibition of 29%, 32.2% and 39.3% for 50 μg, 75 μg and 100 μg respectively. E. coli treated with CeO2 (Fig. 6 (a.4) in presence of visible light shows a constant but intense growth inhibition with a restricted growth phase of 2–4 h initially, whereas at 22nd h there is an overall drop in growth by 32.3% and 38% for 75 μg and 100 μg respectively and for 50 μg it shows an overall 24.3% of inhibition. For 24th h cell mortality decrease by 34.4%, 39.2% and 45.3% for 50 μg, 75 μg and 100 μg respectively. Treatment with GO (Fig. 6 (a.2) showed a linear growth inhibition pattern and a restricted phase for growth at 0–2 h, but an increase in percentage of inhibition was observed in presence of visible light compared to the absence where at 24th h 100 μg showed a particularly strong increase in growth inhibition of 37% followed by 29.7% and 23.6% at 75 μg and 50 μg respectively. For CeO2/GO (Fig. 6 (a.6) a restricted phase for growth at 2–4 h at all concentration it shows a higher inhibition rate in visible light on interaction with E.coli where at 24th h the cell mortality rate decreased to 31.4%, 36.5% and 45% for 50 μg, 75 μg and 100 μg respectively showing more growth inhibition activity for E.coli in presence of visible light than in absence which was observed for CeO2 and GO NPs also.
P. aeruginosa was treated with CeO2 (Fig. 6 (b.3)in absence of light where at 8th h an intense drop was observed in 75 μg and 100 μg at 18% and 21% and a faint but constant drop was observed for 50 μg at 11%. At 24th hour the inhibition rate changes and only 100 μg shows an overall stronger inhibition rate with 45.4% whereas 50 μg and 75 μg show a growth inhibition of 35% and 38.4% respectively. When treated with GO (Fig. 6 (b.1) shows a stable and increased inhibition rate at 24th h of 33.6%, 36.5% and 42.4% for 50 μg, 75 μg and 100 μg respectively. CeO2/GO (Fig. 6 (b.5) shows a linear growth inhibition compared to control. At concentration of 50 μg, 75 μg and 100 μg show a progressive increase at 24th h it shows inhibition percentage of 33.8%, 38.5% and 45% respectively. Influence of visible light was checked on the growth inhibition of P. aeruginosa when treated with CeO2 (Fig. 6 (b.4). At 8th h a high cell mortality was seen in 50 μg for 13% whereas 75 μg and 100 μg showed high inhibition at 22.5% and 24% respectively. At 24th h the inhibition rate observed was 36.8%, 40% and 47.4% for 50 μg, 75 μg and 100 μg respectively. For GO (Fig. 6 (b.2)) at 14th hour the percentage of inhibition at 100 μg is 25% than 50 μg and 75 μg with 16.5% and 18% further showing a good inhibition in the progression. For CeO2/GO (Fig. 6 (b.6)) a high rate of growth inhibition was observed. 50 μg and 75 μg showed a similar rate of inhibition whereas 100 μg a stronger inhibition rate. At 24th h a rise in inhibition was seen showing an overall rate of 38%, 41% and 46.1% for 50 μg, 75 μg and 100 μg respectively. Overall a good inhibition percentage was observed in presence of visible light than in dark condition.
S. aureus was treated with CeO2 (Fig. 6 (c.3)) in absence of light. 50 μg and 75 μg show a stepwise increase in bacterial growth inhibition whereas for 100 μg a constant increase in inhibition rate was observed. At 10th h the growth inhibition rate was 12%, 15.4% and 21.2% and at 12th h 13.2%, 15.3% and 19.8% for 50 μg, 75 μg and 100 μg respectively. This shows a constant and the step wise inhibition of growth. GO (Fig. 6 (c.1)) shows a similar trend of growth inhibition as CeO2. At 10th h 11.3%, 12.6%, 19.6% growth inhibition for 50 μg, 75 μg and 100 μg respectively. At 24th h the percentage of decrease in cell mortality was 23%, 28%, 33%. At 24th h CeO2/GO (Fig. 6 (c.5)) shows an overall progressive growth inhibition at of 26.3%, 31.4% and 36.6% for 50 μg, 75 μg and 100 μg respectively. Interaction with visible light showed a slight increase in the growth inhibition rate when S. aureus was treated with CeO2 (Fig. 6 (c.4)). Growth inhibition rate at 12th h was 15%, 18.3% and 23.5% whereas at 24th h the rate increased to 32%, 36.5% and 39.3% for 50 μg, 75 μg and 100 μg respectively. For GO (Fig. 6 (c.2)) similar increase was seen. At 10th h growth inhibition of 12%, 17.8% and 21.4% whereas at 24th h we observe 31.5%, 33.3% and 38.8% at 50 μg, 75 μg and 100 μg respectively where 75 μg and 100 μg show a closer inhibition trend than 50 μg. For CeO2/GO (Fig. 6 (c.6)) the rate of inhibition shows intense change compared to CeO2 and GO NPs. At 14th h the growth inhibition was 17%, 19.5% and 24.4% whereas at 24th h we observe 29.3%, 35.5% and 40.5% for 50 μg, 75 μg and 100 μg respectively.
S. typhi in absence of light treated with CeO2 (Fig. 6 (d.3) shows a step wise decrease in growth at 50 μg and 75 μg showing a sharp change at 16th and 22th h with 21% and 22% for 50 μg and 26% and 32.4% for 75 μg respectively. GO (Fig. 6 (d.1) at 22th h showed an increase bacterial cell growth inhibition with 19.8%, 24% and 35.4% for 50 μg, 75 μg and 100 μg respectively. CeO2/GO (Fig. 6 (d.5) shows the maximum inhibition with 28.3%, 34.4% and 38.6% for 50 μg, 75 μg and 100 μg respectively at 24th h. In presence of visible light an overall change in the cell mortality of S. typhi was observed. For CeO2 (Fig. 6 (d.4) a restricted growth phase was observed for 0–4 h. So at 6th h decrease in cell mortality was seen at 14%, 18.4% and 26.3%, also at 14th h similar trend was observed with 19%, 24% and 31.8% for 50 μg, 75 μg and 100 μg respectively. Here we can observe 100 μg showing better growth inhibition than 50 μg and 75 μg. For GO (Fig. 6 (d.2) a constant growth inhibition was seen where a restricted phase for growth at 0–2 h was initially observed. At 24th h the overall inhibition rate observed was 23.8%, 27.2% and 39.4% for 50 μg, 75 μg and 100 μg respectively. CeO2/GO (Fig. 6 (d.6) at 24th h the cell mortality rate was 31.7%, 40.5% and 48% for 50 μg, 75 μg and 100 μg respectively, where 50 μg shows less inhibition rate compared to 75 μg and 100 μg. Overall CeO2, GO and CeO2/GO show an increase in inhibition rate in the presence of visible light for S. typhi at all concentration.
The colony count assay was carried out for CeO2/GO. Supporting Fig. 2 Shows serial dilution carried out for CeO2/GO in presence and absence of visible light for E.coli, P. aeruginosa, S. aureus and S. typhi. Table 1 represents the MIC values for NPs where the particles exhibit a good inhibition in presence of light than absence. MIC values of GO are 18 μg/ml and 16 μg/ml for E.coli (Gram-negative) in absence and presence of visible light whereas the MIC values for S. aureus (Gram-positive) are 22 μg/ml and 21 μg/ml in absence and presence of light showing higher MIC than CeO2. The CeO2 NPs against E.coli shows a MIC value of 16 μg/ml in absence of visible light whereas in presence of light it showed 14 μg/ml showing a decrease in MIC under the influence of visible light. For S. aureus, CeO2 NPs showed a MIC of 18 μg/ml and 20 μg/ml under absence and presence of visible light respectively which can be due the gram positive nature of the bacteria showing a change in cell membrane structure and composition of cell wall which can affect the interaction of NPs with the bacterial cell (Madigan Michael et al., 1997). The MIC value of P. aeruginosa for CeO2 NPs is 17 μg/ml and 15 μg/ml whereas for S. typhi were 18 μg/ml and 17 μg/ml under absence and presence of light respectively. The MIC of CeO2/GO nanocomposite expressed a lower value and higher inhibition concentration compared to GO and CeO2. For E.coli (Gram-negative) the values are 16 μg/ml and 13 μg/ml under absence and presence of visible light. MIC of S. aureus (Gram-positive) are 16 μg/ml and 14 μg/ml under absence and presence of visible light which still showed a lower value and higher inhibition concentration compared to GO and CeO2which evidently shows the high inhibition activity of the NC. The MIC value for P. aeruginosa are 16 μg/ml and 13 μg/ml whereas for S. typhi were 15 μg/ml and 12 μg/ml under absence and presence of light respectively.
Escherichia coli
Pseudomonas aeruginosa
Staphylococcus aureus
Salmonella typhi
Dark
Light
Dark
Light
Dark
Light
Dark
Light
MIC of GO (µg/ml)
18
16
20
17
22
21
20
18
MIC of CeO2 (µg/ml)
16
14
17
15
18
20
18
17
MIC of CeO2/GO (µg/ml)
16
13
16
13
16
14
15
12
The Biofilm inhibition activity of GO, CeO2 and CeO2/GO nanocomposite was examined using the MIC values in the absence and presence of light. (Fig. 7a) shows the bio film inhibition activity in absence of visible light in which the percentage of inhibition by GO NPs showed 37.2%, 32.3%, 27% and 30.1% for E. coli, P. aeruginosa, S. aureus and S. typhi respectively. SimilarlyCeO2 NPs for the four bacterial strain E. coli, P. aeruginosa, S. aureus and S. typhi were observed to be 38%, 38.8%, 30.1% and 33.3% respectively. Biofilm inhibition of CeO2/GO nanocomposite in turn had maximum activity showing a sharp increase in the inhibition. It was 38.2%, 39.6%, 30.9% and 35% for E. coli, P. aeruginosa, S. aureus and S. typhi respectively showing increased reactive species production which helps in overall biofilm inhibition. Fig. 7b gives the biofilm inhibition activity in presence of visible light for the GO, CeO2NPs and CeO2/GO NCs. GO shows an inhibitory concentration of 39.2%, 34.2%, 30.1% and 32.2%whereas CeO2 shows an inhibitory concentration of 42.2%, 44.9%, 38.1% and 40.4% for E. coli, P. aeruginosa, S. aureus and S. typhi respectively. Similarly CeO2/GO nanocomposite shows a high inhibition percentage in presence of light with inhibition percentage of 44%, 48.1%, 39% and 41.9% for the bacterial strains E. coli, P. aeruginosa, S. aureus and S. typhi respectively.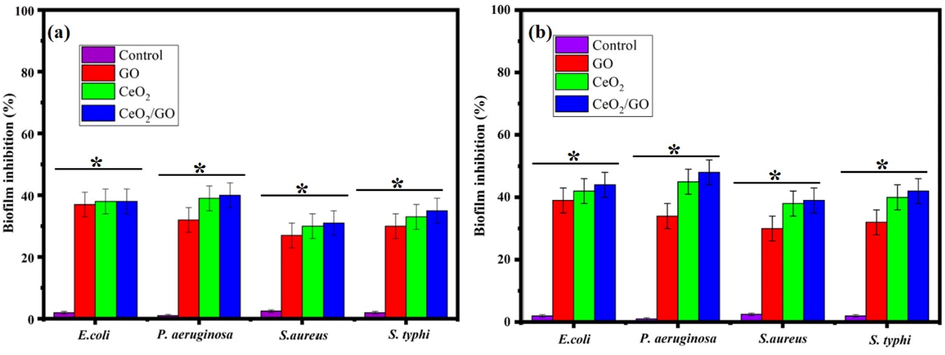
Biofilm inhibition percentage of GO, CeO2 and CeO2/GO nanocomposite (a) Absence of visible light (b) Presence of visible light* indicates a significant increase compared to the respective control (p < 0.05).
Fig. 8 shows the generation of reactive oxygen species by GO, CeO2 and CeO2/GO nanocomposite were examined using the MIC value in presence and absence of light on four bacteria’s E. coli, P. aeruginosa, S. aureus, and S. typhi. Similarly, in presence of light, we can observe a similar but an increased production of reactive oxygen species in all bacterial strains when treated with GO, CeO2 and CeO2/GO where the highest increase is seen for CeO2/GO.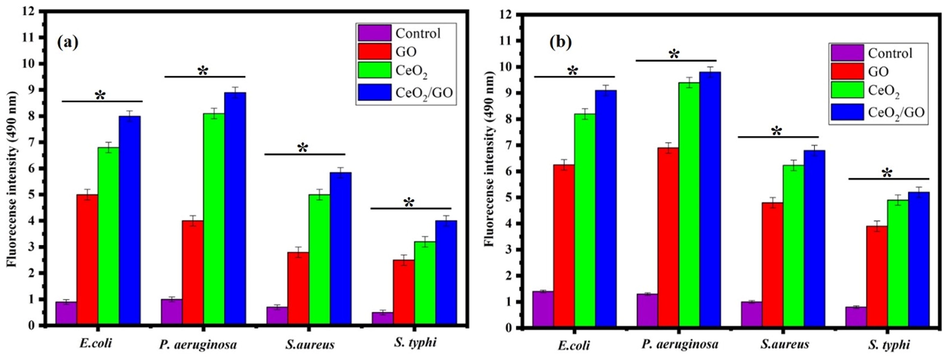
ROS of analysis of GO, CeO2 and CeO2/GO nanocomposite against E. coli, P. aeruginosa, S. aureus and S. typhi, * indicates a significant increase compared to the respectively control (p < 0.05) (a) Absence of visible light (b) Presence of visible light.
As the membrane integrity of the cell gets lost the Lactate dehydrogenase enzyme leaks out and its level is risen in extracellular matrix. It is described as the enzyme that helps in the respiration activity of cell which is found in cytosol. LDH helps in catalysis of lactate into pyruvate conversion. In this study by taking the MIC values the level of Lactate dehydrogenase is used as an indicator for membrane integrity. Fig. 9a and (Fig. 9b) shows the results of LDH assay for GO, CeO2 and CeO2/GO nanocomposites in absence presence of visible light respectively. LDH released by the bacterial cells treated by GO, CeO2 and CeO2/GO nanocomposites are higher than the untreated cells (control). CeO2/GO shows the highest values. The percentage LDH leakage in presence of CeO2 is 20.1%, 18.12% 11.99% and 15% for E. coli, P. aeruginosa, S. aureus, and S. typhi respectively in absence of light. The percentage LDH leakage in presence of visible light increase to 26.04%, 29.02% 21.9% and 18% for E. coli, P. aeruginosa, S. aureus, and S. typhi respectively. The percentage of LDH release observed for GO was very less in comparison with CeO2 where the release was seen as 3.62%, 3.01%, 3.01% and 2.42% for E. coli, P. aeruginosa, S. aureus, and S. typhi respectively in absence of light and the percentage of LDH leakage in presence of visible light had a slight increase of 3.99%, 3.49% 3.2% and 2.48% for E.coli, P. aeruginosa, S. aureus, and S. typhi respectively. The LDH leakage in CeO2/GO has increased to 26.37%, 24.56% 18.55% and 19.33% for E. coli, P. aeruginosa, S. aureus, and S. typhi respectively in absence of light. Similarly in presence of light it was 28.91%, 30% 27.11% and 20% for E. coli, P. aeruginosa, S. aureus, and S. typhi respectively. This indicates a high leakage percentage in comparison to GO and CeO2.Fig. 10.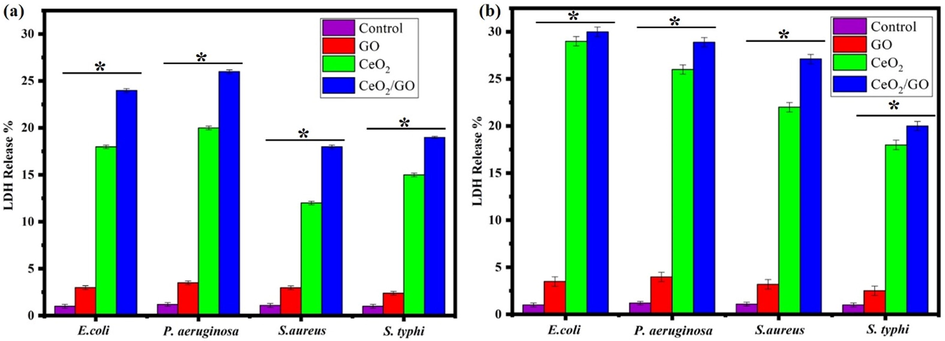
LDH release assay of GO, CeO2 and CeO2/GO nanocomposite against E. coli, P. aeruginosa, S. aureus and S. typhi, * indicates a significant increase compared to the respectively control (p < 0.05) (a) Absence of visible light (b) Presence of visible light.
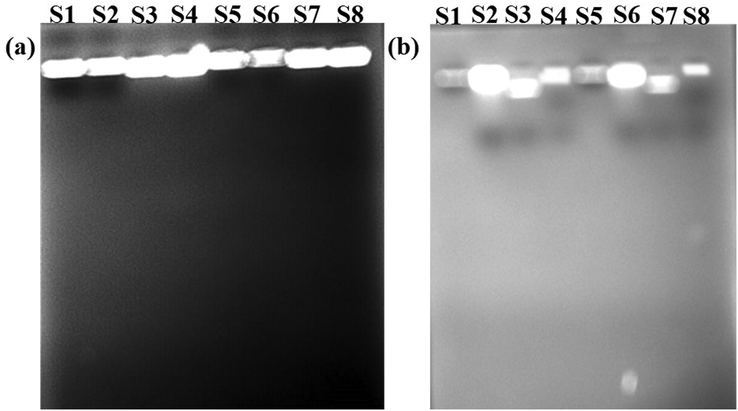
DNA fragmentation analysis of nanocomposite, (a) Absence of light (b) Presence of light (S1, S2) E. coli, (S3, S4) Pseudomonas aeruginosa, (S5, S6) Staphylococcus aureus and (S7, S8) S. typhi. S1, S3, S5 and S7 are bacteria control DNA and S2, S4, S6 and S8 are bacteria DNA treated with synthesised samples.
The Fig. 10 Shows the DNA fragmentation of bacteria with and without treatment with CeO2/GO nanocomposite under the absence and presence of visible light. DNA was isolated from the bacteria after interaction with CeO2/GO nanocomposite. No DNA fragmentation was observed in the test organisms treated with GO, CeO2 and CeO2/GO nanocomposite in both absence and presence of visible light. The DNA of the test bacterium is not damaged by the samples. There is no DNA fragmentation observed in both presence and absence of light.
The Transmission Electron Micrograph of CeO2/GO nanocomposite treated and untreated E. coli, P. aeruginosa, S. aureus, and S. typhi are shown in Fig. 11. Here Fig. 11 (a.1, b.1, c.1 and d.1) shows the image of bacterial cell treated with CeO2/GO nanocomposites in absence of light whereas Fig. 11 (a.2, b.2, c.2 and d.2) shows the image of bacterial cell treated with CeO2/GO nanocomposites in presence of light. TEM image shows the surface morphology of untreated native cells having intact, smooth and not damaged. The TEM image of bacterial membrane treated with CeO2/GO nanocomposites in absence of light showed an absorption of nanocomposites in the cellular matrix of bacterial cell. TEM image of bacteria in presence of visible light we observe disintegration and fragmentation of cell membrane caused by CeO2/GO nanocomposites. Additionally, clusters of particles were observed near and inside bacterial cell. The red markers in the image indicate the particles that were present inside the cell membrane whereas the green markers indicate the rupture in bacterial cell after the treatment with the CeO2/GO nanocomposites. Similarly the blue markers indicate the aggregation the particles near the bacterial cell wall.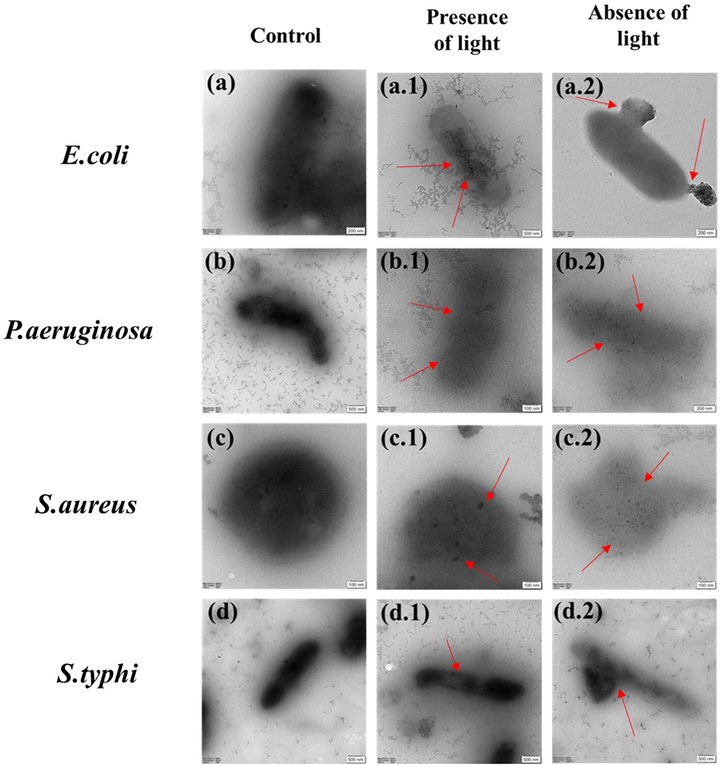
Cellular interaction of CeO2 /GO with E. coli, P. aeruginosa, S. aureus and S. typhi under absence and presence of visible light.
4 Discussion
In Fig. 1 we observed the disappearance of (0 0 1) peak of graphene oxide in the XRD pattern of CeO2/GO nanocomposite. This could be due to the intercalation of CeO2 NPs which damages the structure of graphene oxide having regular stacks (Zhong and Yun, 2015). This proves that the cerium oxide and graphene oxide forms a composite. For Fig. 2 the FTIR shows different vibration modes of the given functional group of GO, CeO2 and CeO2/GO at the different given peaks which confirms the overall presence the nanoparticles. In nanocomposites CeO2 nanoparticles are decisively bonded to the graphene oxide sheet by coordinating with oxygen in C—OH and forming a bidentate complex with carboxyl. Moreover, the shift in the absorption peak of OH deformation and stretching, appearance of peak at 2923 cm−1 are due to the influence of coordination between oxygen and Cerium on the surface of GO. Supporting Fig. 1 represents the Raman spectroscopy of GO, CeO2 and CeO2 /GO nanocomposite. For GO Supporting Fig. 1a the G band represents the presence of graphitic carbon and D band is associated with the partial disorientation in graphitic domains or structural defects. Also the ID/IG ratio was calculated that provides the intensity ratios of D to G (ID/IG) band that is used to estimate the size of sp2 graphitic region. Here Supporting Fig. 1b peak confirms the cubic nature of CeO2. Supporting Fig. 1c shows a blue shift of the F2g band which can be explained due to the charge transfer from GO sheets to CeO2 nanoparticles. This results in the increase in the concentration of Ce3+ in CeO2 /GO nanocomposite. This explains the an1choring of CeO2 nanoparticles in GO sheets (Jiang et al., 2012). In Fig. 3 we observe the UV–vis spectra for GO, CeO2 and CeO2 /GO nanocomposite. Where for GO (Fig. 3b) the peak here represent the transition (ð-ð) of C—C interaction and transitions (n-ð) for C⚌O group respectively (Siburian et al., 2018). In CeO2 /GO nanocomposite (Fig. 3c) show a red shift in the absorption value but no significant change is observed in the shoulder peak. This red shift indicates the interaction between GO and CeO2NPs. The energy band gap of CeO2 and CeO2 /GO indicates the absorption of light in the visible region. Hence, the absorption ability of the given GO and CeO2is improved by its interaction where CeO2 /GO will have more absorption and photocatalytic activity than CeO2 individually. In Fig. 5 the antimicrobial effect of graphene oxide under absence of light can be due to the influence of two factors: mechanical damage to the bacterial cell membrane by the sharp ends of GO and by the initiation of oxidative cell death (Verma and Samdarshi, 2016). Under presence of visible light there is a sharp rise in inhibition zone. This is due to photo catalytic activity of GO and CeO2which increases on the interaction with light (Egorova et al., 2018). The antimicrobial activity of CeO2 NPs under absence of light is concentration dependent. When the concentration of the nanoparticles was increased we can see an increase in the zone of inhibition. It also produces an oxidative stress on bacterial membrane due to the conversion of Ce4+ to Ce3+. By electrostatic interaction CeO2 NPs gets attached to the bacterial cell membrane. They undergo an oxidative stress by gain of electrons from conversion of Ce4+ to Ce3+. Due to this reason the gram-negative bacteria are more susceptible to antibacterial activity than gram-positive due to the presence of thick cell wall made of peptidoglycan containing linear polysaccharides which is difficult to penetrate (Sawai, 2003). Following this CeO2/GO showed the highest inhibition due to increased photocatalytic activity of cerium oxide and graphene oxide. The light excites the cerium nanoparticles anchored on graphene sheets which helps in transfer of photo radicals on the graphene oxide. The equilibrium between adsorption and desorption was broken and transfer of more charged particles can easily occur through the molecular matrix. Also layer-structured GO helped in the distribution of nanoparticles evenly, which could lead to an enhanced photocatalytic activity (Egorova et al., 2018; Cao et al., 2016). Overall a good inhibition percentage was observed in presence of visible light than in dark condition against all strains which can be observed at every point from Fig. 6. The results in Fig. 7 Shows good biofilm inhibition activity against E. coli, P. aeruginosa, S. aureus and S. typhi in which the highest inhibition percentage was observed for CeO2/GO. Comparing the inhibition percentage of GO and CeO2 NPs we can clearly observe GO causes oxidative stress on the biofilm (Liu et al., 2011), though CeO2 also exhibits higher inhibition due its high efficiency of ROS generation (Chen et al., 2018). In presence of visible light a sharp increase in inhibition activity for CeO2/GO can be observed due to the photocatalytic property of CeO2 NPs which shows an increased production of oxidative stress due to the presence of oxygen vacancy which promotes the catalytic activity (Liu et al., 2011; Chen et al., 2018; García et al., 2012). We also observe inhibition activity on Gram-negative bacteria’s (E. coli, P. aeruginosa and S. typhi) was more than the Gram-positive bacteria (S. aureus) due to the presence of thick cell wall that is made of peptidoglycan containing linear polysaccharides which is difficult to penetrate. Fig. 8 Shows the production of reactive oxygen species. CeO2/GO composite shows the highest production of ROS in the absence of light (Fig. 8a) and in the presence of presence light (Fig. 8b). The production of reactive oxygen species by CeO2 can be due to redox cycles of cerium oxide between Ce3+ and Ce4+ which produces an oxidative stress on bacterial cells causing cell proliferation to stop and can even cause cell death by apoptotic or necrosis pathway (Kumari et al., 2014; Lin and Huang, 2006). An increase in ROS generation was observed in CeO2 due to its photocatalytic properties. GO on other hand showed a very less production of ROS in absence of visible light but the production in turn increases in presence of light which can be due to the two-dimensional planar structure of GO that could facilitate the rapid transport of charge carriers, hence leading to an effective charge separation and production of ROS (Siburian et al., 2018). Similarly the high production of ROS is seen in CeO2/GO in presence of visible light due to the redox and photocatalytic properties of CeO2. GO is also an excellent acceptor of the electrons generated by CeO2. This could suppress the charge recombination and make more charge carriers to produce ROS (Zhang and Blewett, 2018; Li et al., 2014). In the LDH assay of Fig. 9 in absence of visible light We can observe that GO NPs though shows antibacterial activity and ROS generation still graphene oxide doesn’t show much change in cell integrity and viability. In the CeO2 NPs induces cytotoxicity in bacterial cell due to which an increase in LDH is observed which was influenced by changing the cell integrity and in the end causing cell death (Kumari et al., 2014). In presence of visible light the increase can be explained due to the photo activity of CeO2 where the cationic part of CeO2 like Ce4+ are produced due to photo activation which later interacts with the negatively charged area and penetrates the bacterial cell that causes change in cell integrity, LDH leakage and ultimately cell death (Magdalane et al., 2017; Zuchowska et al., 2017). CeO2/GO shows the highest values this confirms that the interaction of GO and CeO2NPs as a nanocomposite enhances the antibacterial activity. In Fig. 10 there was no fragmentation of DNA observed in both presence and absence of light. The mechanism of bacterial inhibition is not by DNA fragmentation which directly induces a bacterial cell apoptosis (Hashem et al., 2015; Kumar et al., 2011; Roos and Kaina, 2013). For Fig. 11 we observe disintegration and fragmentation of cell membrane also the results suggests the adsorption of nanoparticles to the bacterial cell walls accounts for their toxic effects (Pelletier et al., 2010).
5 Conclusion
In this work, GO, CeO2 and CeO2/GO were prepared and characterized. The prepared CeO2/GO composites confirm the antibacterial activity against wound infection pathogens in both presence and absence of visible light condition. It shows a higher antibacterial activity in presence of visible light. The mechanism of inhibition is observed through the generation of ROS and damage in membrane integrity. DNA fragmentation is not observed in the bacterial cells. The rate of biofilm inhibition by the nanocomposite is higher when compare to nanoparticles. Thus the synthesized CeO2/GO nanocomposites proves that the incorporation of CeO2 NPs into GO enhances the overall antibacterial activity of the sample against bacterial species present in the wound and shows a potential application in wound infection.
Acknowledgement
The authors Garvit Sharma and Dr. G. Devanand venkatasubbu thanks SRM Research institute for Raman, UV –Vis and TEM analysis.
Declaration of Competing Interest
The authors declare that they have no known competing financial interests or personal relationships that could have appeared to influence the work reported in this paper.
References
- Multifunctional graphene magnetic nanosheet decorated with chitosan for highly sensitive detection of pathogenic bacteria. J. Mater. Chem. B. 2013;1(32):3950-3961.
- [Google Scholar]
- Ceria nanocubic-ultrasonication assisted dispersive liquid–liquid microextraction coupled with matrix assisted laser desorption/ionization mass spectrometry for pathogenic bacteria analysis. Talanta. 2014;1(120):208-217.
- [Google Scholar]
- A review on chitosan and its nanocomposites in drug delivery. Int. J. Biol. Macromol.. 2018;1(109):273-286.
- [Google Scholar]
- Potential applications of enzymes immobilized on/in nano materials: A review. Biotechnol. Adv.. 2012;30(3):512-523.
- [Google Scholar]
- Application of graphene, grapheneoxide and their derivatives as wound healing: A brief review. Adv. Environ. Biol.. 2017;11(5):1-6.
- [Google Scholar]
- Mechanistic investigation on microbial toxicity of nano hydroxyapatite on implant associated pathogens. Mater. Sci. Eng., C. 2017;73:8-14.
- [Google Scholar]
- Early stopping of randomized clinical trials for overt efficacy is problematic. J. Clin. Epidemiol.. 2008;61(3):241-246.
- [Google Scholar]
- Cerium oxide nanoparticles: Synthesis, characterization and tentative mechanism of particle formation. Colloids Surf. A. 2017;529:146-159.
- [Google Scholar]
- Visible light activated photocatalytic degradation of tetracycline by a magnetically separable composite photocatalyst: graphene oxide/magnetite/cerium-doped titania. J. Colloid Interface Sci.. 2016;467:129-139.
- [Google Scholar]
- Visible light activated photocatalytic degradation of tetracycline by a magnetically separable composite photocatalyst: graphene oxide/magnetite/cerium-doped titania. J. Colloid Interface Sci.. 2016;1(467):129-139.
- [Google Scholar]
- Zinc oxide/reduced graphene oxide composites and electrochemical capacitance enhanced by homogeneous incorporation of reduced graphene oxide sheets in zinc oxide matrix. J. Phys. Chem. C. 2011;115(5):2563-2571.
- [Google Scholar]
- Various physicochemical and surface properties controlling the bioactivity of cerium oxide nanoparticles. Crit. Rev. Biotechnol.. 2018;38(7):1003-1024.
- [Google Scholar]
- Enzyme mimicry for combating bacteria and biofilms. Acc. Chem. Res.. 2018;51(3):789-799.
- [Google Scholar]
- An improved Hummers method for eco-friendly synthesis of graphene oxide. Carbon. 2013;64:225-229.
- [Google Scholar]
- New vision to CuO, ZnO, and TiO 2 nanoparticles: their outcome and effects. J. Nanopart. Res.. 2013;15(4):1492.
- [Google Scholar]
- Investigation on Curcumin nanocomposite for wound dressing. Int. J. Biol. Macromol.. 2017;98:366-378.
- [Google Scholar]
- Egorova, M.N., Tarasova, L.A., Vasilieva, F.D., Akhremenko, Y.A., Smagulova, S.A., 2018. Antimicrobial activity of graphene oxide sheets. AIP Conf. Proc. 2018. Vol. 2041. No. 1.
- Synthesis of Cerium Oxide (CeO2) nanoparticles using simple CO-precipitation method. Rev. Mex. Fis.. 2016;62(5):496-499.
- [Google Scholar]
- Farias, I.A.P., Santos, C.C.L.D., Sampaio, F.C., 2018. Antimicrobial activity of cerium oxide nanoparticles on opportunistic microorganisms: a systematic review. Biomed Res. Int.
- Antimicrobial and wound healing properties of polyacrylonitrile-moringa extract nanofibers. ACS Omega. 2018;3(5):4791-4797.
- [Google Scholar]
- Impact of graphene oxide on the antibacterial activity of antibiotics against bacteria. Environ. Sci. Nano. 2017;4(5):1016-1024.
- [Google Scholar]
- Effect of cerium dioxide, titanium dioxide, silver, and gold nanoparticles on the activity of microbial communities intended in wastewater treatment. J. Hazard. Mater.. 2012;199:64-72.
- [Google Scholar]
- Cerium oxide nanoparticles alleviate oxidative stress and decreases Nrf-2/HO-1 in D-GALN/LPS induced hepatotoxicity. Biomed. Pharmacother.. 2015;73:80-86.
- [Google Scholar]
- Ultrasonicated graphene oxide enhances bone and skin wound regeneration. Mater. Sci. Eng., C. 2019;1(94):484-492.
- [Google Scholar]
- Controlled synthesis of CeO2/graphene nanocomposites with highly enhanced optical and catalytic properties. J. Phys. Chem. C. 2012;116(21):11741-11745.
- [Google Scholar]
- A green approach for the synthesis of a cerium oxide nanoparticle: characterization and antibacterial activity. Int. J. Nanosci.. 2014;13(03):1450018.
- [Google Scholar]
- A study of electrocatalytic and photocatalytic activity of cerium molybdatenanocubesdecorated graphene oxide for the sensing and degradation of antibiotic drug chloramphenicol. ACS Appl. Mater. Interfaces. 2017;9(7):6547-6559.
- [Google Scholar]
- Investigations on the antimicrobial activity and wound healing potential of ZnO nanoparticles. Appl. Surf. Sci.. 2019;479:1169-1177.
- [Google Scholar]
- Near infrared (NIR) laser mediated surface activation of graphene oxide nanoflakes for efficient antibacterial, antifungal and wound healing treatment. Colloids Surf., B. 2015;1(127):281-291.
- [Google Scholar]
- Effect of graphene oxide doping on superconducting properties of bulk MgB2. Supercond. Sci. Technol.. 2013;26(9):095008
- [Google Scholar]
- Engineered ZnO and TiO2 nanoparticles induce oxidative stress and DNA damage leading to reduced viability of Escherichia coli. Free Radical Biol. Med.. 2011;51(10):1872-1881.
- [Google Scholar]
- Toxicity study of cerium oxide nanoparticles in human neuroblastoma cells. Int. J. Toxicol.. 2014;33(2):86-97.
- [Google Scholar]
- Comparison of TiO2 nanoparticle and graphene–TiO2 nanoparticle composite phototoxicity to Daphnia magna and Oryziaslatipes. Chemosphere. 2014;112:62-69.
- [Google Scholar]
- Toxicity of cerium oxide nanoparticles in human lung cancer cells. Int. J. Toxicol.. 2006;25(6):451-457.
- [Google Scholar]
- Antibacterial activity of graphite, graphite oxide, graphene oxide, and reduced graphene oxide: membrane and oxidative stress. ACS Nano. 2011;5(9):6971-6980.
- [Google Scholar]
- Madigan, Michael T., John, M. Martinko, Jack Parker Brock, 1997. Biology of microorganisms, vol. 11. Prentice Hall, Upper Saddle River, NJ.
- Facile synthesis of heterostructured cerium oxide/yttrium oxide nanocomposite in UV light induced photocatalytic degradation and catalytic reduction: synergistic effect of antimicrobial studies. J. Photochem. Photobiol., B. 2017;173:23-34.
- [Google Scholar]
- The effect of graphene–poly (methyl methacrylate) fibres on microbial growth. Interface Focus.. 2018;8(3):20170058.
- [Google Scholar]
- Nanocomposites: Suitable alternatives as antimicrobial agents. Nanotechnology. 2018;29(28):282001
- [Google Scholar]
- Comparative study of the antimicrobial effects of Tungsten nanoparticles and Tungsten nanocomposite fibres on hospital acquired bacterial and viral pathogens. Nanomaterials.. 2020;10(6):1017.
- [Google Scholar]
- Poly (vinyl alcohol)/chitosan asymmetrical membranes: Highly controlled morphology toward the ideal wound dressing. J. Membr. Sci.. 2014;469:262-271.
- [Google Scholar]
- Niranjan, R., Kaushik, M., Prakash, J., Venkataprasanna, K.S., Arpana, C., Balashanmugam, P., Venkatasubbu, G.D., 2019. Enhanced wound healing by PVA/Chitosan/Curcumin patches: In vitro and in vivo study. Colloids Surf. B 182, 110339.
- PVA/SA/TiO2-CUR patch for enhanced wound healing application. Int. J. Biol. Macromol.. 2019;138:704-717.
- [Google Scholar]
- Effects of engineered cerium oxide nanoparticles on bacterial growth and viability. Appl. Environ. Microbiol.. 2010;76(24):7981-7989.
- [Google Scholar]
- Structural, optical, morphological and dielectric properties of cerium oxide nanoparticles. Mater. Res.. 2016;19(2):478-482.
- [Google Scholar]
- Investigations on the in-vivo toxicity analysis of reduced graphene oxide/TiO2 nanocomposite in zebrafish embryo and larvae (Danio rerio) Appl. Surf. Sci.. 2019;481:1360-1369.
- [Google Scholar]
- Investigation on photo-induced mechanistic activity of GO/TiO2 hybrid nanocomposite against wound pathogens. Toxicol. Mech. Methods. 2020;30(7):508-525.
- [Google Scholar]
- Sustained release of amoxicillin from hydroxyapatite nanocomposite for bone infections. Prog. Biomater.. 2018;7(4):289-296.
- [Google Scholar]
- Mechanism of inhibition of graphene oxide/zinc oxide nanocomposite against wound infection causing pathogens. Appl. Nanosci 2020:1-23.
- [Google Scholar]
- Graphene and graphene oxide as nanomaterials for medicine and biology application. J. Nanostruct. Chem. 2018:1-15.
- [Google Scholar]
- Oxidative stress generation of silver nanoparticles in three bacterial genera and its relationship with the antimicrobial activity. Toxicol. In Vitro. 2016;36:216-223.
- [Google Scholar]
- A review on nanoparticle based treatment for wound healing. J. Drug Deliv. Sci. Technol.. 2018;44:421-430.
- [Google Scholar]
- DNA damage-induced cell death: from specific DNA lesions to the DNA damage response and apoptosis. Cancer Lett.. 2013;332(2):237-248.
- [Google Scholar]
- Antibacterial activity of silver and zinc nanoparticles against Vibrio cholerae and enterotoxic Escherichia coli. Int. J. Med. Microbiol.. 2015;305(1):85-95.
- [Google Scholar]
- Quantitative evaluation of antibacterial activities of metallic oxide powders (ZnO, MgO and CaO) by conductimetric assay. J. Microbiol. Methods. 2003;54(2):177-182.
- [Google Scholar]
- Antibacterial activity of polymer coated cerium oxide nanoparticle. PLoS One. 2012;7(10):e47827
- [Google Scholar]
- New route to synthesize of graphene nano sheets. Orient. J. Chem.. 2018;34(1):182-187.
- [Google Scholar]
- Metal oxide curcumin incorporated polymer patches for wound healing. Appl. Surf. Sci.. 2018;449:603-609.
- [Google Scholar]
- Fabrication of Chitosan/PVA/GO/CuO patch for potential wound healing application. Int. J. Biol. Macromol 2020
- [Google Scholar]
- Investigations on zinc doped nanocrystalline hydroxyapatite. Int. J. Nanosci. Nanotechnol.. 2011;2(1):1-23.
- [Google Scholar]
- TiO2 nanocomposite for the controlled release of drugs against pathogens causing wound infections. Mater. Res. Exp. 2018;5(2):024003
- [Google Scholar]
- In situ decorated optimized CeO2 on reduced graphene oxide with enhanced adsorptivity and visible light photocatalytic stability and reusability. J. Phys. Chem. C. 2016;120(39):22281-22290.
- [Google Scholar]
- Synthesis and antibacterial activities of graphene decorated with stannous dioxide. RSC Adv.. 2014;4(8):3722-3731.
- [Google Scholar]
- UV-induced toxicity of cerium oxide nanoparticles (CeO 2 NPs) and the protective properties of natural organic matter (NOM) from the Rio Negro Amazon River. Environ. Sci. Nano. 2018;5(2):476-486.
- [Google Scholar]
- Graphene oxide-modified ZnO particles: synthesis, characterization, and antibacterial properties. Int. J. Nanomed.. 2015;10(Spec Iss):79.
- [Google Scholar]
- Graphene as a new material in anticancer therapy-in vitro studies. Sens. Actuators, B. 2017;243:152-165.
- [Google Scholar]
Appendix A
Supplementary material
Supplementary data to this article can be found online at https://doi.org/10.1016/j.arabjc.2020.09.004.
Appendix A
Supplementary material
The following are the Supplementary data to this article:Supplementary data 1
Supplementary data 1


