

Translate this page into:
Preparation and certification of three new aluminum alloy reference materials using inter-laboratory comparison approach
⁎Corresponding author. randa.yamani@nis.sci.eg (Randa N. Yamani)
-
Received: ,
Accepted: ,
This article was originally published by Elsevier and was migrated to Scientific Scholar after the change of Publisher.
Abstract
Accuracy and comparability of measurement results are vital to guarantee correct controlled measurement process and operational conditions. All of these require reliable measurements based on reference materials whose certified values must be gotten by dependable metrological approaches agreeing to the requirements of ISO/ICE 17034 and ISO guide 35 (ISO, 2016; Guide, 2017).
The metrological characteristics of certified reference materials (CRMs), especially the uncertainty of their properties, and the position within the traceability hierarchy are items of interest for quality assurance. CRMs play a key role in the quality control, precision studies, verification and validation of test methods. Comparability and the accuracy of the measurement results depend strongly on the availability of certified reference materials appropriate for a specific application. Within the present work, different aluminum alloys reference materials were produced by the National Institute of Standards (NIS), Egypt. Homogeneity of the produced reference materials (RMs) was studied by spark emission spectrometer (AES) and therefore, the results revealed that the produced RMs were homogeneous to disseminate the traceability through the calibration process. Also, they are useful to be used as internal quality control samples to evolve that different products meet required specification. The characterization process of the produced reference materials composition was performed by different independent analytical methods; XRF, Atomic emission spectrometer, inductively coupled plasma- optical emission spectrometer and atomic absorption spectrometry in several laboratories. The statistical data processing, and the data combining in the characterization step is the most important step of reference materials production process. Several methods are used to assign the certified value and its uncertainty such as the robust mean, the weighted mean approaches. The use of inter-laboratory comparison results for reference material certification is very common. In the present study, the assigned values of the mass fractions of the varied elements of the alloys and their uncertainty were calculated by applying the weighted mean approach to inter-laboratory comparison results collected.
Keywords
Aluminum alloys
Homogeneity
Certified reference materials
Weighted mean approach
Traceability
Uncertainty

1 Introduction
Aluminum is considered as a well-established modern lightweight engineering and functional material with a singular combination of specific properties like strength, formability, durability, conductivity, corrosion resistance, etc. It is present in many intelligent solutions in established markets like building, transporting, packaging, printing, and many others, in our fast-moving modern society. Various types of aluminum alloys are often processed efficiently in large quantities by conventional fabrication routes, as well as in special sophisticated forms and material combinations for highly innovative High-Tec solutions and applications. The unique combinations of properties of aluminum and its alloys make aluminum one among the foremost versatile, economical, and attractive metallic materials for a broad range of uses from soft, highly ductile wrapping foil to the foremost demanding engineering applications. Aluminum features a density of 2.7 g/cm3, approximately one-third as much as steel (7.83 g/cm3) (Singh, 2006). The addition of certain elements to the pure aluminum greatly enhances its properties and usefulness. The main alloying elements added to pure aluminum are copper (Cu), manganese (Mn), silicon (Si), magnesium (Mg), and zinc (Zn). The entire amount of those elements can constitute up to 10% of the alloy composition. Also, impurity elements are present, but their total percentage is typically about 0.15% in aluminum alloys or less Beddoes and Bibby, 1999. Aluminum alloys are economical in many applications they're utilized in the automotive industry, aerospace industry, in machines construction, appliances, and structures, as cooking utensils (Ashby and Jones, 2013).
Product quality is a continuous variable, and it is a function of both the product’s integrity and its characteristics to ensure that the products will meet customer’s specification requirements and perform satisfactorily in commission. Many analytical techniques are used to determine the chemical composition of aluminum alloys like X-ray fluorescence spectrometry (XRF), optical emission spectrometry (OES), atomic absorption spectrometry (AAS) and inductivity coupled plasma techniques (ICP). Certified reference materials are vital to verify the accuracy of the measurements process. Also, they play a key role in the quality assurance and internal control programs. Also, they are vital to establish the traceability within the framework of internationally agreed standards. This work aims to supply aluminum alloys certified reference materials with different compositions of Silicon, Manganese, Chromium, Nickel, Iron, Lead, Tin, Zinc, Magnesium, and copper using different independent analytical methods in several laboratories. The obtained data from different laboratories were statistically tested to assure that the data can be combined. Certified values and their expanded uncertainties were calculated for the measured elements within the different compositions (Epstein, 1991; Schilier and Eberhadt, 1991; Schiller, 1996; Shehata et al., 2019).
2 Materials and methods
2.1 Raw materials and aluminum alloy production
Different compositions of aluminum alloys were initially designed to be within the chemical composition in Table 1.
Element
Mn
Si
Cu
Ni
Cr
Fe
Mg
Zn
Min. Conc.
0.080
0.030
0.500
0.002
0.030
0.100
0.010
0.010
Max. Conc.
1.000
0.900
2.500
0.030
0.200
2.000
2.500
5.500
The manufacturing process was conducted at Central Metallurgical Research and Development Institute (CMRDI) experimental foundry, (El Tabeen-Egypt) using a medium frequency electric induction furnace with movable crucible. Raw materials used in the manufacturing process were presented in Table 2. Pure aluminum was melted at 800 °C. During the melting process, the alloying elements were added to modify the properties of the produced alloy. After the addition of the desired elements, the furnace temperature was adjusted to 750 °C for 15 min. The hot liquid was cast into certain molds. The production technology is developed to guarantee that the produced aluminum alloys are homogenous enough to be used as control samples.
Raw materials
Purity (%)
Commercial pure aluminum
99.9
Metallic zinc
99.5
Pure nickel
99.9
metallic copper
99.5
Metallic magnesium
99.9
Commercial aluminum iron alloy
Aluminum content 70% and iron content 30%
Commercial chromium aluminum alloy
Aluminum content 25% and chromium content 75%
Commercial aluminum silicon alloy
Aluminum content 50% and silicon content 50%
Commercial manganese aluminum alloy
Aluminum content 10% and manganese content 90%
Step
1
2
Temperature. °C
175
50
Max. Pressure (bar)
35
35
Ramp time (min.)
1
1
Hold time (min.)
20
10
Power (%)
90
0
2.2 Chemicals and reagents for sample preparation
Chemicals and reagents used were of analytical grade. Ultrapure water with a resistivity of 18.2 MΩ cm was obtained through a Milli-Q system from Millipore, USA. Triton X-100 from Alfa Aesar, Germany. Nitric acid with purity 69%, Merck, Germany. Hydrochloric acid with purity 37%, Merck, Germany. Hydrogen peroxide with purity 30%, International Co, Egypt.
2.3 Instruments
Wavelength dispersive X-ray Fluorescence Spectrometer, Axios, Panalytical, Elmelo, Netherlands, with Rhodium target. V = 60kv and A = 160 mA, Optical Emission Spectrometer, Analytical Instrument, Thermo Electron, USA., Inductively Coupled Plasma Optical Emission Spectrometer (ICP-OES), ICPS-7500, Dual view, Shimadzu, Japan. Atomic absorption spectrometer (ZEEnit 700, Analytik Jena, Germany), hollow cathode lamps of each element were used as a radiation source with their characteristic current and an automatic deuterium background-correction is used for flame atomizer measurement. All equipment was used for the quantitative determination of elemental constituents of alloys. Microwave digestion system, TOP wave, Analytic Jena, Germany, with a maximum power of 1450 W, maximum pressure of 100 bars, and maximum temperature 300 °C were used for sample preparation.
2.4 Sample preparation
2.4.1 Microwave digestion preparation
150 mg of the sample was weighed into the digestion vessel then 3.0 mL of HNO3 and 5.0 mL of HCl were added with careful continuous mixing. The sample was left for 10 min before closing the vessel PerkinElmer Publication, 1996. The microwave was heated according to the program presented in Table 3: The vessels were left to cool down to room temperature then the solution was transferred to a 100 mL measuring flask and diluted with deionized water.
2.4.2 Wet preparation
500 mg of sample was weighed and transferred to a glass beaker. 20 mL of (1 + 1) HCl was added cautiously. Due to the presence of copper, 30% H2O2 was added drop-wise with gentle heating to dissolve the sample. The samples were boiled at low temperatures till complete dissolution. The sample solution was transferred to a 100-mL volumetric flask and diluted to the ultimate volume with deionized water. A blank sample was prepared with the same quantities of all the reagents. Various SRMs from the National Institute of Standards and Technology (NIST), USA were prepared with equivalent procedure to verify the accuracy of the measurements and also to calibrate both AAS, and ICP-OES techniques PerkinElmer Publication, 1996.
2.5 Homogeneity study
Three different compositions of aluminum alloys were produced. To ascertain the homogeneity of the produced samples, they were divided into groups of the same size and every group was identified before the preparation process. An entire of 10% was selected using stratified random sampling from each group to assure the sample representation. The chosen samples were measured five times by atomic emission spectrometer (AES). Certified reference materials from MBH company were used as control samples to measure the accuracy of AES during measurements. The set-up of the homogeneity study experiment is shown in Fig. 1.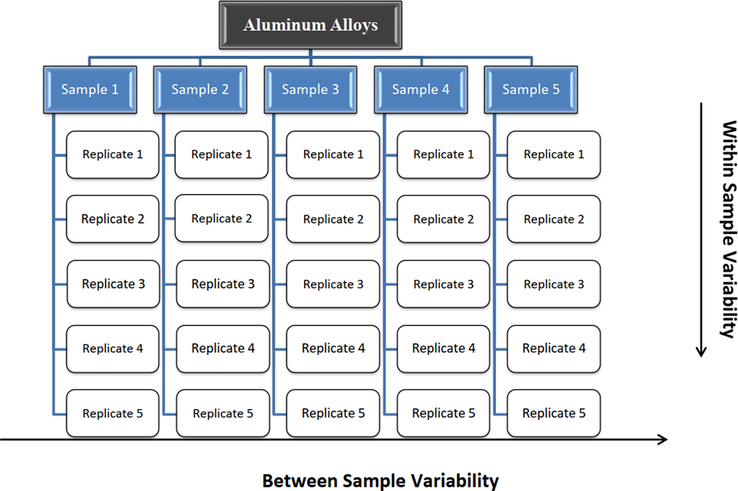
The set-up of the homogeneity study experiment.
One-way analysis of variance (ANOVA) was chosen to assess the homogeneity of the produced RM samples through the within samples variability and between samples variability determination and to estimate uncertainty because of the heterogeneity (Guide, 2017; van der Veen and Pauwels, 2000; Tahoun et al., 2019).
2.6 Sample packing and storage
The produced aluminum alloy RMs were cast in form of bars of a diameter of 40 mm. The bars are cut into disk form with a thickness of 30 mm. The sample surface was subjected to polishing process to get a flat, smooth surface and free from any contaminants. 50 pieces of each composition were produced, packed in plastic containers and stored in a clean and dry place.
3 Results and discussion
3.1 Characterization and measurements
Three produced different compositions of aluminum alloys identified as NIS-CRM067, NIS-CRM 068 &NIS-CRM 069. Different methods as X-ray fluorescence spectrometer (XRF), Atomic emission spectrometer (AES), Atomic absorption spectrometer (AAS) and inductively coupled plasma atomic emission spectrometer (ICP-OES) were used in several laboratories to determine the chemical composition of the produced aluminum alloys. The contributing laboratories were identified by numbers and listed according to the analytical method used as in Fig. 3.
Laboratories measurement results of aluminum alloys reference materials NIS-CRM067 are presented in Fig. 2.
The participants results for different elements in aluminum alloys.

The participants results for different elements in aluminum alloys.

Experimental layout of CRM characterization process in different laboratories.
3.1.1 Calibration and traceability
3.1.1.1 Traceability of measurement results
Metrological traceability of the measurement result is defined as a property of a measurement result whereby the result can be related to a reference through a documented unbroken chain of calibrations, each contributing to the measurement uncertainty (BIPM, 2008). Traceability of the measurement results was established through the calibration of measuring instruments used in the analysis in different laboratories by the use of known calibrants (CRMs) whose traceability to the SI units was guaranteed by the producers. It will be illustrated for each method as follows.
3.1.1.1.1 XRF and AES calibration
The calibration was done using a set of MBH certified reference materials for aluminum alloys (55X G900J1E, 55X G900J5 E, 59X G77J1 F, 511X G05H1 H) and NIST standard reference materials 1258- I and 1259. They were used to grantee the traceability of the measurement results to SI units. each standard was measured and the net response of each element was corrected for line overlaps, background and matrix interferences. XRF lines and AES emission lines of every element were selected to guarantee the maximum sensitivity and resolution.
3.1.1.1.2 AAS and ICP-OES calibration
Flame atomic absorption spectrometer (FAAS) was calibrated by external calibration using NIST matrix-matched standard reference materials no. 85B & 87A for iron, nickel, copper, zinc, magnesium, manganese and chromium measurements. Line overlaps and matrix interferences were removed. A series of calibration solutions were prepared by serial dilution of elemental solution CRMs (1000 mg/L) in deionized water mixed with 1% (v/v) HNO3 for calibration of ICP-OES. The concentration levels were 0.1, 0.2, 0.4, 0.8, 1.6, 3.2, 6.4, and 12.8 mg/L for Fe, Mn, Ni, Zn, Cu, Cr, Mg, Pb and Si.
3.1.1.2 Calibration uncertainty
The uncertainty of the calibration process was calculated by combining the contribution from the calibration curve regression line, random variations of measurements results and SRMs certificates. Meanwhile, the uncertainty contribution due to the sample preparation variation was also added EURACHEM/CITAC Guide CG 4, 2000; Solaguren-Beascoa Fernández et al., 2014.
3.2 Homogeneity assessment study
The homogeneity assessment study was planned so that the between-and the within-sample variability are considered. Five samples were arbitrarily chosen from each group and AES technique were used to carry out the measurements. Each sample was measured five times, and all the results obtained were analyzed by one-way analysis of variance (ANOVA).
Tables 4, 5 & 6 shows the homogeneity results of aluminum alloy patches. It can be seen that the values of F calculated are smaller than those of F critical at approximately 95% confidence interval. As a result, the produced aluminum alloys are homogenous enough to be used as control samples. The uncertainty due to material homogeneity was calculated using the equation:
Analyte
MSWithin
MSBetween
FCalculated
P value
Fcritical
σh (%)
Fe
0.000666
0.001174
1.76212
0.17611
2.8681
0.0101
Ni
9.322E−05
0.000103
1.10945
0.37957
2.8660
0.0014
Mn
8.660E−06
1.008E−05
1.16450
0.35601
2.8660
0.0005
Cu
0.0012210
0.0006321
0.51769
0.72365
2.8660
0.0108
Zn
0.000241
0.000132
0.54807
0.70252
2.8660
0.0046
Cr
2.53E−07
1.81E−07
0.71699
0.59020
2.8660
0.0001
Mg
0.000295
0.000127
0.43017
0.78514
2.8660
0.0058
Si
0.000826
0.001211
1.46532
0.24996
2.8660
0.0083
Pb
7.408E−07
1.332E−06
1.79755
0.16896
2.8660
0.0003
Analyte
MSWithin
MSBetween
FCalculated
P value
Fcritical
σh (%)
Fe
0.000384
6.45E−05
0.16778
0.95228
2.8660
0.0079
Ni
2.14E−05
1.04E−05
0.48719
0.74502
2.8660
0.0015.
Mn
7.44E−05
4.12E−05
0.55406
0.69838
2.8660
0.0026
Cu
0.000381
0.000245
0.64349
0.63779
2.8660
0.0052
Zn
3.18E−06
1.43E−06
0.45014
0.77108
2.8660
0.0006
Cr
0.000191
0.000152
0.79551
0.54201
2.8660
0.0027
Mg
1.45E−06
3.04E−06
2.09394
0.11956
2.8660
0.0005
Si
0.000416
0.000136
0.32668
0.85672
2.8660
0.0074
Pb
1.27E−07
1.17E−07
0.92417
0.46953
2.8660
4.38E−05
Analyte
MSWithin
MSBetween
FCalculated
P value
Fcritical
σh (%)
Fe
3.51E−06
2.9E−06
0.82685
0.52360
2.8660
0.0003
Mn
7.8E−08
8.94E−08
1.14615
0.36371
2.8660
0.0001
Cu
8.21E−05
8.22E−05
1.00158
0.42989
2.8660
0.0069
Zn
0.000629
0.000577
0.91710
0.47329
2.8660
0.0102
Cr
2.07E−07
1.24E−07
0.59845
0.66799
2.8660
0.0001
Mg
0.000326
0.000257
0.78982
0.54541
2.86608
0.0037
Si
1.56E−05
1.08E−05
0.69201
0.60612
2.8660
0.0009
3.3 Statistical evaluation process of measurement results
The measurement results collected from all methods were examined for normality, outliers using Grubbs' test, equality of means and homogeneity of variances at confidence level 95% Fangmeyer et al., 1977; Davis, 2002; Engineering Statistics Handbook NIST 2003-(3044S), 2003; Meier and Zund, 2000 using Statistical package Minitab 17. Bartllet’s and Levene’s tests to assess the equality of means and variances homogeneity at 95% confidence level.
The normal probability plot is a graphical technique for assessing whether or not a data set is approximately normally distributed. The data are plotted against a theoretical normal distribution in such a way that the points should form an approximate straight line. Departures from this straight line indicate departures from normality. P-value which is the smallest level of significance that would lead to rejection of the hypothesis that the data is belonged to normal distribution is used as indicator to prove the normal behavior of the measurement results Montgomery, 2019.
Also, Empirical Distribution Function (CDF) is used as a sensible estimator for the underlying distribution function which defined as: where 1 is the indicator function, namely 1{Xi ≤ x} is one if Xi ≤ x and zero.
Fig. 4 showed the normal behavior of the measurement results of some elements in the produced alloys based on the probability plots (the left-hand side of the figure) with P-values > 0.05 at 95% confidence interval. Empirical CDF also proved the normal behavior of the data (the right-hand side of the figure).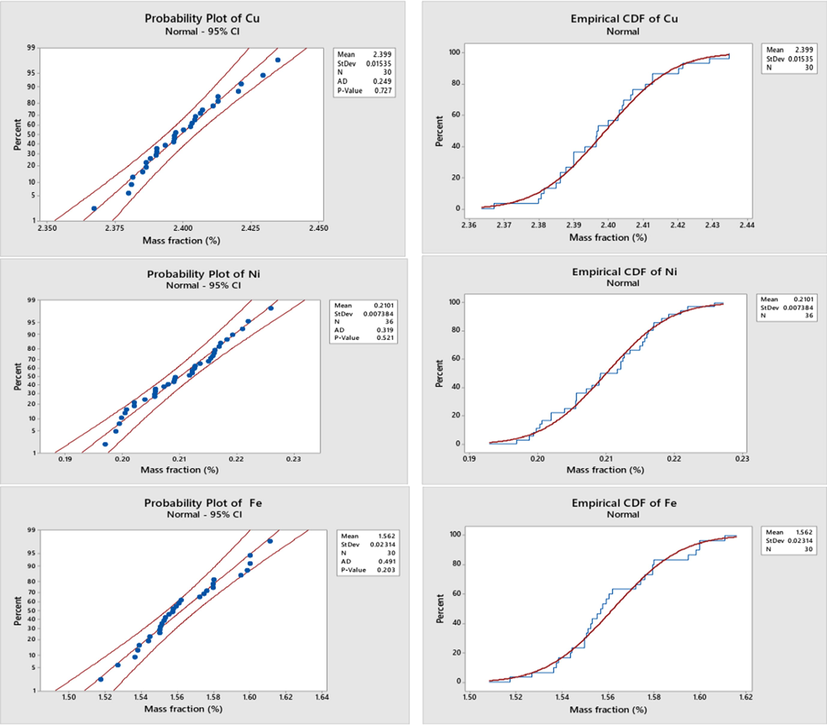
Probability plots and CDF of some elements in the produced aluminum alloys. *The red line in the graph represents the theorical true function of the normal distribution. The blue line represents the measurement results of aluminum alloy sample drawn from that distribution.
3.4 Value assignment and its uncertainty
Characterization measurements of the produced aluminum alloys reference materials are performed at different laboratories using different methods of analysis as XRF, AES, ICP-OES and AAS techniques as shown in Fig. 3. Randomly selected Samples were analyzed three times by each technique at the collaborating laboratories. The mean and variance of each set of measurements were calculated. Paule and Mandel statistical model (Schiller, 1996; Shehata et al., 2019) was used to combine the data obtained by different techniques. According to this model, the weight of the mean of each measurement method and the average weighted mean were calculated. The weighted uncertainty associated with the average weighted mean is a combination of four sources: the uncertainty of the method means, the between-method variance, material variability and the bias allowance.
3.5 Uncertainty of each measurement method
Since many analytical methods are combined to calculate the certified value, the variability of the mean of each method must be evaluated accurately. The standard uncertainty of the mean was estimated using two- way analysis of variance (two-way ANOVA) to determine which factors affect significantly the measurements (Guide, 2017).
Type A uncertainty of each of the method means was calculated using Eq. (2).
3.5.1 Between method variance, and weight of methods
The measured values of each method are demonstrated as the sum of the true value, method bias and random error according to Eq. (3).
Method weights are derived by assuming that the random variations (eij) are independent, having a mean of 0, and a different variance of each method (σi2). The variance σb2 may be estimated from the between method difference. So, the variance of the average of ni measurements from the ith method is estimated as:
To combine the averages of the analytical methods for each element, a weighted average of the method means was estimated according to the Paule and Mandel weighting algorithm for multi-method CRMs certification (Schiller, 1996; Shehata et al., 2019) application. Each method weight, Wi is inversely proportional to the sum of the combined standard uncertainty of the mean, S2i and the between- method variance, σb2 . The method weights are defined using the following equation:
The weighing factor is
And
the weighted average of the
s
From the above equations, the method weights, the weighted means and the average weighted mean of the different methods for each element were calculated. *Values in bold are information values which are non-certified values that are the best estimates of the true values and they considered to be a value that will be of use to the CRM user, but insufficient information is available to assess the uncertainty associated with the value.
Batches Analyte
NIS-CRM067
NIS-CRM068
NIS-CRM069
Fe
Certified Value (%)
1.5636
0.5760
0.1235
Uexp (%)
0.0565
0.0445
0.0157
Ni
Certified Value (%)
0.2126
0.1489
0.0053
Uexp (%)
0.0144
0.0081
–
Mn
Certified Value (%)
0.4044
0.8444
0.0834
Uexp (%)
0.0291
0.0266
0.0068
Cu
Certified Value (%)
2.3967
0.5941
1.5513
Uexp (%)
0.0800
0.0421
0.0377
Zn
Certified Value (%)
2.2338
0.0300
5.3048
Uexp (%)
0.0397
0.0038
0.0948
Cr
Certified Value (%)
0.0569
0.3004
0.1500
Uexp (%)
0.0062
0.0324
0.0080
Mg
Certified Value (%)
0.7126
0.0150
2.1738
Uexp (%)
0.0380
0.0024
0.0547
Si
Certified Value (%)
0.7660
0.4876
0.0428
Uexp (%)
0.0591
0.0463
–
Pb
Certified Value (%)
0.0269
0.0037
–
Uexp (%)
–
–
–
3.5.2 Combined standard uncertainty calculation
The combined standard uncertainty of the weighted mean is the root sum of squares of the combined standard uncertainties for the methods multiplied by the weighing factor according to:
The estimation of variance S2 does not include the between method variance. The variance of the mean illustrates random errors in the mean. It is more practical to incorporate the bias allowance or the systematic error due to the difference in the measurement methods. It is taken as the maximum absolute deviation of any analytical method mean from the weighted mean:
To calculate an appropriate interval for the certified, the effective degree of freedom of the total variance is assessed according to Satter Thwatte formula which is:
The overall expanded uncertainty associated with the certified values was estimated according to:
The certified values and their expanded uncertainties at 95% confidence interval for each element in all compositions are presented in Table 7.
4 Conclusion
In this study, the development of several certified reference materials of aluminum alloys was presented. The produced aluminum alloys were homogeneous to be used as control samples. Characterization, within-sample and between-samples homogeneity were assessed in full compliance with the international standards for CRM production and certification. The produced samples were measured for chemical composition using different techniques. Measurement results were statistically evaluated and the certified values for of Silicon, Manganese, Chromium, Nickel, Iron, Lead, Tin, Zinc, Magnesium and copper were calculated with their associated uncertainties. The produced CRMs will be useful for improving the quality of manufacturing and testing processes. Also they can be used to validate the analytical methods and to disseminate the traceability of the measurement results of aluminum alloys to the SI units.
Declaration of Competing Interest
The authors declare that they have no known competing financial interests or personal relationships that could have appeared to influence the work reported in this paper.
References
- Ashby, M.F., Jones, D. R.H., 2013. Engineering Materials 2. An Introduction to Microstructures and Processing, Elsevier Ltd.
- Beddoes, J., Bibby, M., 1999. Principles of metal manufacturing processes.
- BIPM, IEC, IFCC, ILAC, ISO, IUPAC, IUPAP and OIML, 2008. The international vocabulary of metrology—basic and general concepts and associated terms (VIM), 3rd ed. JCGM.
- Davis, C.S., 2002. Statistical Methods for the Analysis of Repeated Measurements. Springer-Verlag New York, Inc.
- Engineering Statistics Handbook NIST 2003-(3044S) http://www.itl.nist.gov/div898/handbook/toolaids/pff/e-handbook.pdf
- the independent method concept for certifying chemical composition reference materials. Spectrochim. Acta. 1991;468
- [Google Scholar]
- EURACHEM/CITAC Guide CG 4, 2000. Quantifying uncertainty in analytical measurement, 2nd edn.
- ISO Guide 35:2017 Reference materials—guidance for characterization and assessment of homogeneity and stability. International Organization for Standardization (ISO), Geneva.
- ISO 17034:2016 General requirements for the competence of reference material producers. International Organization for Standardization (ISO), Geneva.
- Meier, P.C., Zund, R.E., 2000. Statistical Methods in Analytical Chemistry, Second Edition, John Wiley &Sons, Inc.
- Montgomery, Douglas C., 2019. Introduction to Statistical Quality Control, 8th Edition, Wiley, ISBN: 978-1-119-39930-8 (2019), www.wiley.com/college/montgomery
- PerkinElmer Publication, 1996. Reference Notebook of Microwave Applications.
- PerkinElmer Publication, 1996. Analytical Methods for Atomic Absorption Spectroscopy, Perkin-Elmer Corporation, USA.
- Statistical approach for collaborative tests, reference material certification procedures (EUR--5621) Commission of the European Communities (CEC) 1977
- [Google Scholar]
- Combining data from independent chemical analysis methods. Spectrochim. Acta. 1991;46B:1607-1613.
- [Google Scholar]
- Schiller, S.B., 1996. Standard Reference Materials: Statistical Aspects of the Certification of Chemical Batch SRMs, NIST Special Publication, pp. 260–125.
- Shehata, A.B., Yamani, R.N., Tahoun, I.F., 2019. Intra- and Interlaboratory Approach for Certification of Reference Materials for Assuring Quality of Low-Alloy Steel Measurement Results, MAPAN-J. Metrol. Soc. India.
- Preparation and certification of a fish oil natural matrix reference material for organochlorine pesticides. Accred. Qual. Assur.. 2010;15:563-568.
- [Google Scholar]
- Development of two reference materials for all trans-retinol, retinyl palmitate, a- and c- tocopherol in milk powder and infant formula. J. Food Drug Anal.. 2015;23:82-92.
- [Google Scholar]
- Singh, R., 2006. Introduction to basic manufacturing processes and workshop technology.
- Solaguren-Beascoa Fernández, M., Ortega López, V., Serrano López, R, 2014. On the uncertainty evaluation for repeated measurements, MAPAN-J. Metrol. Soc. India, 29(1), 19–28.
- Preparation of matrix reference material for quality assurance and control of pesticides analysis in olive oil. Accreditation Qual. Assurance 2019
- [Google Scholar]
- Uncertainty calculations in the certification of reference materials. 1. Principles of analysis of variance. Accred. Qual. Assur.. 2000;5:464-469.
- [Google Scholar]


