Translate this page into:
Evaluation on bioactivities of triterpenes from Bergenia emeiensis
⁎Corresponding author. dcb@sicau.edu.cn (Chunbang Ding)
-
Received: ,
Accepted: ,
This article was originally published by Elsevier and was migrated to Scientific Scholar after the change of Publisher.
Abstract
Bergenia emeiensis is a traditional folk medicine in China. Most studies are focusing on the bioactivity of bergenin, neglecting other compounds. Therefore, in this present work, the antioxidant, antibacterial and anticancer abilities of triterpenes from B. emeiensis rhizomes (TBE) were comprehensively evaluated. The results showed that TBE could well scavenge DPPH with a lower EC50 of 0.29 mg/mL and could improve the cell viability of CHO cells against H2O2 induced cell death. Additionally, TBE also enhanced the resistance of C. elegans under thermal stress, exhibiting a strong antioxidant potential in vivo. Moreover, TBE showed a certain antibacterial ability on five kind strains such as Pseudomonas aeruginosa while TBE could not significantly inhibit the growth of plant pathogenic fungi. Furthermore, TBE possessed an excellent suppression ability on the proliferation of cancer cells especially Hela and Hep G2 cells with an IC50 of 41.79 μg/mL and 48.62 μg/mL at 48 h, respectively. After fractionally extracted with petroleum ether, ethyl acetate and ethanol, ethanol phase (EP) contained the most triterpenes, followed by ethyl acetate phase (EAP) and petroleum ether phase (PEP). Besides, EP and EAP exhibited a strong antioxidant capacity and also inhibited the proliferation of Hela and Hep G2 cells with the effect of pro-oxidation by inducing a high level of ROS and decreasing mitochondrial membrane potential, thus causing oxidative stress then inducing cell apoptosis. Therefore, these outcomes indicated the triterpenes from B. emeiensis possessed a strong antioxidant ability and an anticancer effect, thus making B. emeiensis become a promising potential alternative in pharmacological field.
Keywords
Bergenia emeiensis
Triterpenes
Antioxidant ability
Anticancer ability
Antibacterial ability

1 Introduction
Bergenia (family, Saxifragaceae) is commonly used as a folk medicine in Asia especially in India and the Himalayan region (Shikov et al., 2012). Many reports appeared for treating diabetes, fever, pulmonary and kidney stones (Uniyal et al., 2006; Ballabh et al., 2008). And it is well known as Pashanabheba used in indigenous system of medicine (Gurav and Gurav 2014). There are 10 kinds in Bergenia, and B. ciliata, B. ligulate, B. crassifolia and B. ligulat are the most frequently applied in treatment (Chernetsova et al., 2012). Among these, B. emeiensis is a special species in China. In the area of Mountain Emei, the rhizomes of B. emeiensis are a kind of specific drug on curing respiratory diseases. But the literature on the pharmacological activity of B. emeiensis is rarely documented.
The methanolic and aqueous extracts of B. ciliate rhizome exhibited a strong antioxidant ability on scavenging DPPH and hydroxyl radicals and also prevented lipid peroxidation (Maregesi et al., 2009). The crude aqueous-methanolic extract of B. ligulata rhizome could inhibit calcium oxalate crystal aggregation as well as crystal formation in the metastable solutions showing a strong antiurolithic effect (Bashir and Gilani, 2009). B. ciliata as a Nepalese medicinal herb exhibited an inhibition on α-glucosidase and α-amylase making it as a potential drug to treat diabetes (Bhandari et al., 2008). In our previous work, the triterpenes extract from the leaves of B. emeiensis could well suppress the proliferation of Hela cells via cell apoptosis (Luo et al., 2020b). And the triterpenes from the rhizomes of B. emeiensis showed a strong antioxidant ability on protecting CHO cells against H2O2 damage (Luo et al., 2020a). But whether the triterpenes from B. emeiensis show other bioactivities is still unknown.
B. emeiensis as an important medicinal plant in the region of southwest of China has not been reported on its utilization. Comprehensive acquaintance of the bioactivities of B. emeiensis is still unknown. There were many substances in the rhizomes of B. emeiensis, and a comprehensive component pre-test of B. emeiensis could help to get a better understanding on the individual components of B. emeiensis so as to better separate those compounds. Therefore, in this present work, the antioxidant, antibacterial and anticancer abilities of the total triterpenes B. emeiensis were assessed. Then, different polar solvents used to fractionally extract total triterpenes from B. emeiensis, and subsequently three phases were obtained to assess the antioxidant and anti-cancer effect so as to get a better understanding on the triterpenes compounds from B. emeiensis for further pharmacological activities analysis and other industrial applications.
2 Materials and methods
2.1 Materials and chemicals
B. emeiensis was picked up on the Mount Emei, Sichuan, China at the altitude of 1300–1500 m. The rhizomes were washed with distilled water and then naturally air-dried. After grounded into fine powder, the rhizome powder was kept at −20 °C for following experiments.
2,2-Diphenyl-1-picryl-hydrazyl (DPPH), nitrio blue tetrazolium (NBT), phenazine methosulfate (PMS) and nicotinamide adenine dinucleotide (NADH) were purchased from Sigma Chemical Co. (St. Louis, MO, USA). Ethanol, perchloric acid, acetic acid, ferric chloride, and vanillin were purchased from the Chengdu Kelong Chemical Factory (Chengdu, China). Reactive Oxygen Species Assay Kit (ROS) kit was purchased from Beyotime Biotechnology (Shanghai, China). The total protein assay kit (with standard: BCA method) was bought from Nanjing Jiancheng Bioengineering Institute (Nanjing, China). Fetal bovine serum (FBS) was obtained from Gibco. Dulbecco's modified eagle medium (DMEM), Roswell Park Memorial Institute (RPMI) 1640 medium, PBS, digestive enzyme and Penicillin-Streptomycin solution (10X) were purchased from Hyclone (USA). Agar powder, phosphate buffer solution (PBS) (0.2 M), trypsin, 4′,6-diamidino-2-phenylindole (DAPI), Rhodamine 123 and Hoechst 33,258 were obtained from Beijing Solarbio Science & Technology Co., Ltd. (Beijing, China). Yeast extract and tryptone were purchased from English OXOID Co., Ltd. (UK). All chemicals were analytical grade.
2.2 Extraction of Triterpenes from Bergenia emeiensis (TBE)
0.5 kg rhizome powder was resolved in 3 L 85% ethanol with the assistance of ultrasound for 40 min at 45 °C. The extract solution was filtered twice by a buchner funnel then the filtrate was dried in a vacuum freeze drying machine for 4 days. Then the dried-objection was resolved in ethanol to remove impurities including those that did not dissolve to ethanol. After filtered again, the filtrate was dried to obtain triterpenes from Bergenia emeiensis (TBE). The content of triterpenes in TBE was higher than 75%.
2.3 Fractionation extraction of total triterpenes from B. emeiensis
TBE was packed in a filter paper. Then petroleum ether, ethyl acetate and ethanol were used to fractional extract the total triterpenes from sample, respectively. Each extracted solution was concentrated and lyophilized to obtained petroleum ether phase (PEP), ethyl acetate phase (EAP) and ethanol phase (EP).
2.4 Determination of total triterpense content
The total triterpenes content was determined by vanillin-perchloric acid method (Zhou et al., 2020). Briefly, 50 μL sample solution was mixed with 100 μL 5% vanillin-acetic acid (w/v) and 200 μL perchloric acid, then the mixture was placed at 60 °C for 15 min before adding 650 μL acetic acid. After standing in dark for 5 min, the absorbance of reaction solution was measured at 550 nm. The content of total triterpenes was calculated according to standard curve made with ursolic acid as reference. The content of total triterpenes was expressed as milligram ursolic acid equivalent per gram (mg GAE/g) of dry sample.
2.5 Spectroscopical analysis
Ethyl acetate phase (EAP) and ethanol phase (EP) were resolved in ethanol and added into quartz colorimetric utensils to measure the ultraviolet spectra from 200 to 400 nm taking ethanol as reference (UV-1800 ultraviolet spectrophotometer, Shimadzu Company, Japan). The fourier transform infrared (FT-IR) spectroscopy was determined with KBr pellet. 5 mg dry-samples were mixed with 500 mg KBr then grinded into fine powder and pressed to a slice. The range of infrared scanning and signal acquisition is 400–4000 cm−1 (Nicolet-380 fourier transform infrared spectroscopy, Thermo Fisher Company, USA).
2.6 The Ultra Performance Liquid Chromatography analysis (UPLC)
EP was resolved in ethanol and the chemical compositions were identified with UPLC (Waters ACQUITY UPLC + Waters XEVO G2-S QTOF). The chromatographic condition was shown in Table 1. And the mass spectrometer (Xevo G2-S QTof MS) conditions were as collection quality range: 50–1500 Da; scanning time: 0.1 s; collection mode: ESI resolution mode; MSE Lock mass: leucine enkephalin (LE) 1 ppm (0.3 s scan, interval: 15 s); capillary voltage: 2.5 KV (ESI-); taper voltage: 40 V; collision energy (eV): low CE: 6/High CE: 20–40; ionization source temperature: 120 °C; desolventization temperature: 500 °C; air flow rate of cone hole: 30 L/h; desolventized gas flow rate: 1000 L/h; data acquisition time: 20 min.
Chromatographic column: Waters BEH C18 (2.1 * 100 mm, 1.5 μm)
Time (min)
Flow (mL/min)
A (0.1%HCOOH)
B (Methanol)
Curve
Initial
0.2
90.0
10.0
Initial
0.5
0.2
90.0
10.0
6
15.0
0.2
0.0
100.0
6
19.5
0.2
0.0
100.0
1
20.0
0.0
90.0
10.0
1
2.7 Antioxidant assays in vitro
2.7.1 Determination of scavenging ability on DPPH radicals
The clearance ability on DPPH free radicals was conducted according to previous method with some modifications (Luo et al., 2019). TBE was resolved in ethanol to different concentrations. 30 μL sample solution was mixed with 170 μL DPPH ethanol solution (0.8 mM) at dark for 15 min. Then the absorbance of the reaction solution was read at 517 nm. Ascorbic acid was used as the positive control. The clearance rate was calculated according to the following formula: Clearance rate (%) = 1 − A1/A0 where the A1 was the absorbance of the group with TBE and A0 was the absorbance of the group with ethanol instead of sample.
2.7.2 Determination of scavenging ability on superoxide anion radicals
The scavenging ability on superoxide anion free radicals was measured by the previous method with some modifications (Zhishen et al., 1999). Briefly, 0.2 mL sample solution was added into 0.2 mL NBT (156 μmol/L), 0.2 mL PMS (60 μmol/L) and 0.4 mL NADH (470 μmol/L). The reaction solution was placed at 37 °C for 20 min. Then absorbance of the solution was read at 540 nm. Ascorbic acid was used as the positive control. The clearance rate was calculated according to the following formula: Clearance rate (%) = 1 − A1/A0 where the A1 was the absorbance of the group with TBE and A0 was the absorbance of the group with ethanol instead of sample.
2.7.3 Determination of total reducing power
The reducing power was associated with the antioxidant ability. Therefore, the total reducing power of TBE was determined by the previous method with some modifications (Zeng et al., 2020). 0.2 mL TBE sample solution was mixed with 0.5 mL K3[Fe(CN6)] (1% w/v) and 0.5 mL phosphate buffer (0.2 M). The mixture was cooled at 0 °C after placed at 50 °C for 20 min. Subsequently 0.5 mL TCA (10% w/v) was added into for 5 min. Then, 0.1 mL aliquot of supernatant fluid was mixed with 0.5 mL distilled water and 0.1 mL FeCl3 (0.1% w/v). The absorbance of the reaction solution was read at 700 nm. An ascending absorbance meant an increasing total reducing power.
2.7.4 The cell culture
Chinese hamster ovary cells (CHO cells) were kindly obtained from the Biotechnology Center of Sichuan University (Sichuan, China). CHO cells were cultured in DMEM containing 10% FBS at 37 °C in a 5% CO2 atmosphere. When the density of CHO was about 80–90%, cells were digested from the flask and washed by PBS for 2 twice. Then the cell suspension was transferred into microplates for following experiments.
2.7.5 The protection of TEB on CHO cells
TBE resolved in DMSO and the finally concentration of DMSO was lower than 0.5%. CHO cells suspension at the concentration of 105 cells/mL was transferred into microplates for 12 h. Then TBE sample was added into each well for another 48 h at 37 °C. Subsequently, H2O2 was put into each well after removing the old medium for 5 h. Then new medium containing 10% CCK-8 kit replaced the solution and the plates was placed at 37 °C for 30 min. The cell viability was calculated according to the following formula: Cell viability (%) = A1/A0 where the A1 was the absorbance of the group with TBE and A0 was the absorbance of the group with PBS instead of sample.
2.7.6 Determination of ROS
Cells were adjusted to the concentration of 105 cells/mL with DMEM medium. 1.8 mL cell suspension was added into 6-wells microplate for 24 h. Then TBE sample was transferred into each well. After 48 h incubation, all solution was removed and H2O2 was added into the plate for 5 h. Subsequently, PBS was used to wash the cell for twice before ROS assay kit was added into the plate for 20 min. Then the dying solution was removed and the cells were washed by PBS for twice. The fluorescence of each well was read by a microplate reader.
2.8 Antioxidant assays in vivo
2.8.1 The strains and the culture
Wild-type N2 Caenorhabditis elegans (C. elegans) and Escherichia coli OP50 strain were kindly provided from the Caenorhabditis Genetics Center (CGC). C. elegans was cultured on nematode growth medium (NGM) agar plates, with a layer of E. coli OP50 as food sources and maintained at 20 °C. The synchronized worms were obtained by the sodium hypochlorite method (Porta-de-la-Riva et al., 2012).
2.8.2 Food clearance assay
Synchronized worms were placed on NGM plate for 48 h then transferred into a 96-well plate (20–30 worms/well) containing different concentrations of TBE (DMSO < 0.5%), OP50 (dead) and 5-fluorouracil (25 µM). The plate was kept at 20 °C and the absorbance was read at 600 nm every day.
2.8.3 Thermal stress assay
The synchronized eggs were placed on the NGM plate with the presence and absence of TBE for 48 h. Then the worms were transferred to a new NGM plate keeping at 35 °C for 5 h and subsequently the survival was counted as the dead worm was identified with no response to gentle touch of platinum.
2.9 Anti-cancer assays
2.9.1 The cell culture conditions
Hela, A549 and Hep G2 cancer cells were kindly provided by the Biotechnology Center of Sichuan University (Sichuan, China). S180 cells were bought from Stem Cell Bank, Chinese Academy of Sciences. Hela and Hep G2 cells were maintained in DMEM medium. S180 and A549 cells were cultured in RPMI 1640 medium.
2.9.2 Determination of inhibition effect
When the cell density was about 70–80%, the cells were digested from the flask and washed with PBS for twice. Then the cell was suspended with fresh medium to the concentration of 105 cells/mL. 90 μL cell solution was added in a 96-well microplate with edge filled by 100 μL PBS. After 12 h incubation, 10 μL sample solution was transferred into each well and 25 μg/mL of 5-fluorouracil (5-Fu) was used as the control group. Then the solution was removed and new medium containing 10% CCK-8 kit was added. The absorbance of each well was read at 450 nm after 30 min. The inhibition rate was calculated according to the following formula: Inhibition rate (%) = 1 − A1/A0 where the A1 was the absorbance of trial group with sample treatment and A0 was the absorbance of blank group.
2.9.3 DAPI and Hoechst 33258 dyeing methods to observe apoptosis
The cell apoptosis was observed with DAPI and Hoechst 33,258 staining methods. Briefly, cancer cells (106 cells/mL) were seeded in 6-well plates for 12 h at 37 °C. Then sample solution was transferred into the plate for 48 h, and paraformaldehyde (4%) was used to fixed the cells for 30 min at 4 °C. Then, the fixation fluid was removed and cells were washed twice with PBS. DAPI and Hoechst 33,258 working solution were added into to cover the cells for 10 min. Subsequently, the dyeing solution was removed and PBS adopted to wash cells again for twice before the plate was observed with a fluorescence microscope (Olympas-BX51TRF, Japan)
2.9.4 Determination of ROS level and MMP
Cell suspension was adjusted to the density of 106 cells/mL then transferred into 6-well plate for 12 h. After incubation, sample solution was added into each well for another 24 h. Subsequently, the solution was removed and paraformaldehyde (4%) was used to fixed the cells for 30 min at 4 °C. Then the cells were washed with PBS for 3 times to remove paraformaldehyde. Then ROS kits and Rhodamine 123 (10 μM) were used to stain cell for 30 min, respectively. Finally, the dyeing liquor was removed and PBS was used to wash 2 times before the cells were observed with a fluorescence microscope (Olympas-BX51TRF, Japan).
2.10 Anti-microbial assays
2.10.1 The test-strains
Salmonella typhimuriumI, Bacillus subtilis, Pseudomonas aeruginosa, Bacillus cereus, Enterococcus, Pneumoniae, Staphylococcus aureus and Escherichia coli were obtained from College of Life Sciences, Sichuan Agricultural University. All bacteria strains were cultured in LB medium. Colletotrichum gloeosporioides, Fusarium graminearum (Schw.) Petch, Fusarium oxyspoyum f. sp. niveu and Colletotrichum acutatum were kindly given by College of Agronomy, Sichuan Agricultural University. All fungal was cultivated in potato medium (PDA).
2.10.2 Determination of inhibition zones
The antibacterial ability was determined by the oxford cup method (Diao et al., 2014). Briefly, TBE was resolved in DMSO and the concentration of DMSO was lower than 0.5% finally. The strains were adjusted to the concentration of 105 CFU. 1 mL suspension was spread on the LB plate until the solution was dried in the super-clean worktable. Then an oxford cup was placed on the plate with 200 μL sample solution in the hole. The plate was transferred to an incubator at 37 °C for 24 h. The inhibition zones were determined by crossing method.
2.10.3 Anti-fungal assay
The antifungal ability of TBE was determined by using plate growth rate method (Zhou et al., 2016). The strains were cultivated on the PDA medium at 25 °C. When the mycelium reached on wall of the plate, a block of strain was transferred on a new plate which was spread with a layer of sample solution. Then the plate was placed at the incubator. The diameter of mycelium was determined daily by crossing method.
2.11 Statistical analyses
The data obtained in this study were analyzed statistically by ANOVA (GraphPad Prism 8.0) (GraphPad Software, Inc., La Jolla, CA, USA). All experimental results were expressed as mean ± standard deviation (SD). P < 0.05 was considered to be significantly different.
3 Results
3.1 Antioxidant ability in vitro
Extracts from Bergenia had been pronounced to show an excellent antioxidant ability (Zafar et al., 2019; Kraujalienė et al., 2016). But relative researches about B. emeiensis were rarely reported. This work could help to get a better understanding on the antioxidant ability of B. emeiensis. As shown in Fig. 1A, TBE could well clear DPPH free radicals within the concentrations of 0.2–1.0 mg/mL. And the clearance rate was equivalent with Vc when the concentration was higher than 0.8 mg/mL with an EC50 of 0.29 mg/mL. A lower EC50 meant a strong antioxidant property (Arya et al., 2012; Andriani et al., 2015). Meanwhile, at the lowest concentration of 0.2 mg/mL, the clearance rate on superoxide anion was over 50% and the rate tended to be stable when the concentration was higher than 0.4 mg/mL (Fig. 1B). An ascending absorbance meant an increasing total reducing power which was associated with the antioxidant capacity to some degree. As shown in Fig. 1C, the absorbance of TBE at 700 nm was rising with the ascending concentration. Hence TBE possessed a strong total reducing power as well as a great antioxidant ability.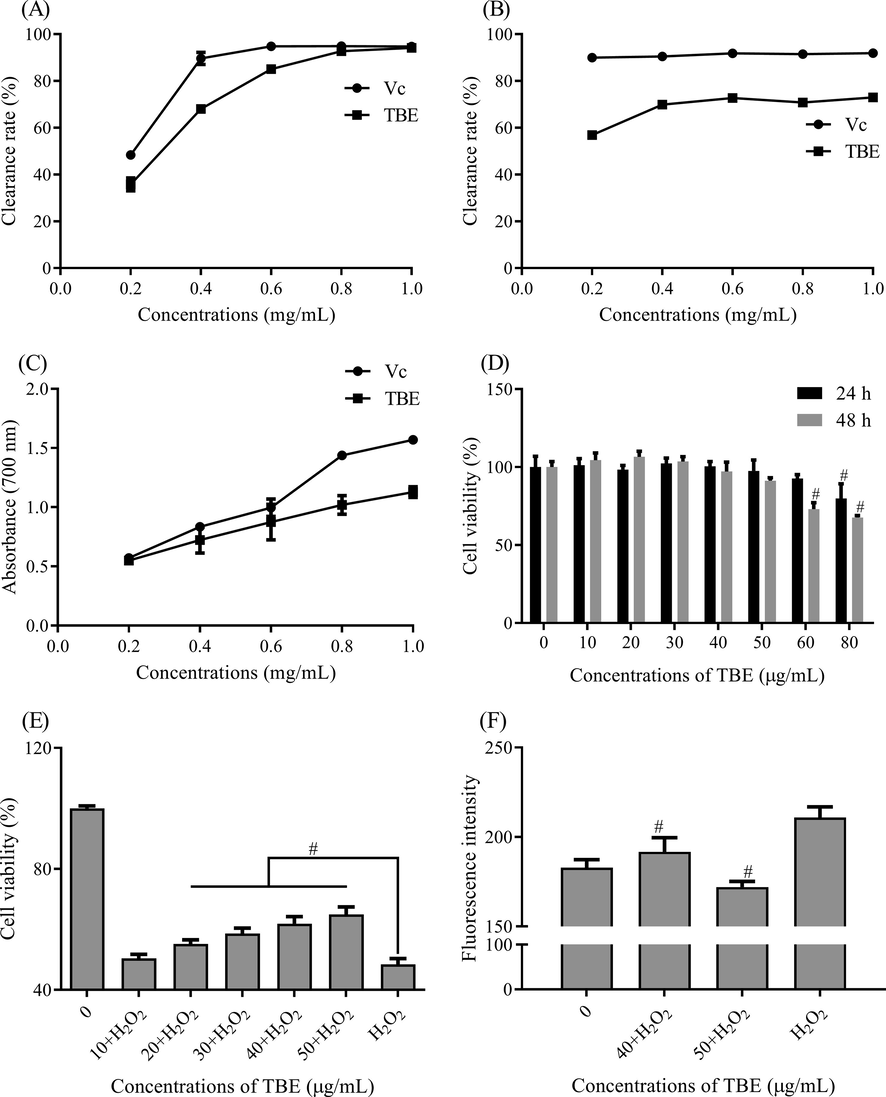
The antioxidant ability of TBE in vitro. (A) the clearance ability on DPPH radicals (B) the scavenging ability on superoxide anion radicals and (C) the total reducing ability. After treated with TBE, (D) the cell viability of CHO cells. Under the oxidative stress, (E) the protective effect of TBE on CHO cells and (F) the ROS level in CHO cells. Notes: # means p < 0.001.
3.2 Protection on CHO cells against oxidative stress
3.2.1 The toxicity of TBE on CHO cells
When the concentration of drugs was high, the cell viability would be affected by osmotic pressure of cell or other negative factors. Hence a non-toxic concentration of TBE on CHO cells should be found. As shown in Fig. 1D, after treated with TBE for 24 h, the cell viability was significantly reduced when the concentration was over 80 μg/mL. And after 48 h treatment, the growth of CHO cells was obviously inhibited when the concentration of TBE was higher than 60 μg/mL. Therefore, for following experiments, the concentration of TBE was control under 50 μg/mL so as to avoid the negative effect of TBE on CHO cells.
3.2.2 The protective effect of TBE on CHO cells
When the cells were under the condition of H2O2, the cell viability was reduced (Fig. 1E). After treated with 0–50 μg/mL of TBE for 48 h, the cell viability was promoted as the increasing concentration of TBE compared with the injury group. Among them, 50 μg/mL of TBE could enhance the cell viability to the highest showing the strongest protection (Fig. 1E). Therefore, 40 and 50 μg/mL of TBE were selected for the following experiment.
3.2.3 The ROS level under oxidative stress
H2O2 is a trigger for ROS. CHO cells were in the environment of H2O2, the inner level of ROS was increased (Fig. 1F). A high level of ROS lead to the cell death. Hence the injury group survived less (Fig. 1E). To evaluate the effect of TBE on the ROS level, CHO cells were treated with different concentration of TBE for 48 h and then determined the content of ROS. The results showed that the ROS level in trial group was significantly lower than that in injury group. And 50 μg/mL of TBE could even make the ROS content lower than blank control (Fig. 1F). Thereby, TBE could reduce the increasing ROS level in CHO cells under oxidative stress.
3.3 Antioxidant ability in vivo
But the inner environment is complex. Whether TBE still exhibited a strong antioxidant ability in vivo? The model organism C. elegans was applied to evaluate the antioxidant capacity of TBE in vivo. First, food clearance assay was performed to select a suitable concentration of TBE on C. elegans. In a limited environment, the worms could consume the food OP50 quickly, hence as shown in Fig. 2A, 0.2 and 0.4 mg/mL TBE had a negative effect on the intake of C. elegans on OP50, while 0–0.1 mg/mL of TBE showed no significant effect on the intake. Hence, 0–0.1 mg/mL of TBE was used as the no-toxic concentration for following assays. When the worms were shifted to a higher temperature, C. elegans would undergo a stress and only the part of the worms could survive. As shown in Fig. 2B, after pretreated with TBE for 48 h, 0.05 mg/mL of TBE obviously promoted the survival of C. elegans to 5.91% while 0.1 mg/mL TBE exhibited no positive effect on increasing the resistance of C. elegans (p > 0.05). Therefore, TBE also exhibited a strong antioxidant capacity in vivo.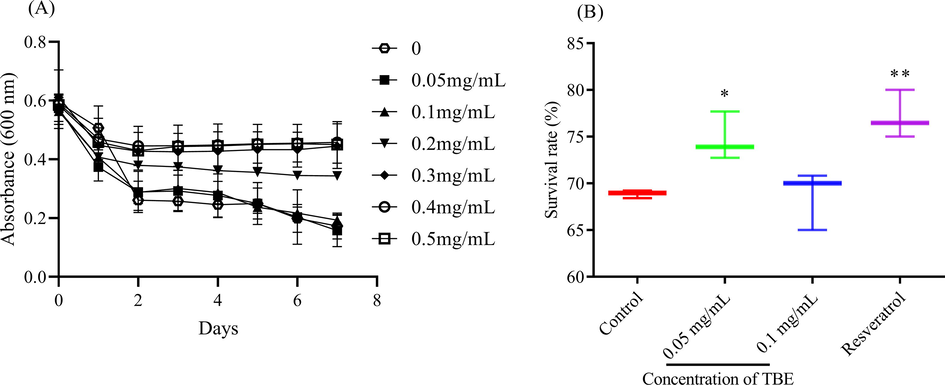
The antioxidant potential of TBE in vivo. (A) the effect of TBE on the intake ability of C. elegans and (B) the survival of C. elegans under thermal condition. Note: * means p < 0.05 and ** means p < 0.01.
3.4 Antibacterial ability
Bergenia had been pronounced to possess a certain bacteriostatic ability (Singh et al., 2017; Żbikowska et al., 2017). Salmonella typhimurium and Escherichia coli were gram-negative bacteria and Bacillus cereus was gram-positive bacteria. As shown in Table 2, the inhibition zones of Salmonella typhimurium, Bacillus cereus and Escherichia coli were 8.00 ± 0.00 mm indicating TBE exhibited no negative effect on the above three strains. With the increasing concentration of TBE, the diameter of zones was largening for the other five strains. Among them, the inhibition zones of Pseudomonas Aeruginosa were the largest 16.00 ± 1.22 mm at 10 mg/mL of TBE. TBE could well inhibit the growth of both gram-negative and gram-positive bacteria, and vice versa. Therefore, the antibacterial motive of TBE was not against a class of bacteria.
Strains
Inhibition zones (mm)
100 μg/mL Ampicillin Sodium
2.5 mg/mL TBE
5 mg/mL TBE
10 mg/mL TBE
Blank Control
Salmonella typhimurium
14.75 ± 0.43
8.00 ± 0.00
8.00 ± 0.00
8.00 ± 0.00
8.00 ± 0.00
Bacillus subtilis
16.25 ± 1.09
10.75 ± 0.43
12.25 ± 0.43
14.00 ± 0.71
Pseudomonas aeruginosa
16.75 ± 2.95
11.88 ± 1.34
13.75 ± 1.30
16.00 ± 1.22
Bacillus cereus
24.25 ± 0.83
8.00 ± 0.00
8.00 ± 0.00
8.00 ± 0.00
Enterococcus
16.50 ± 0.50
11.25 ± 1.30
12.75 ± 0.83
14.25 ± 1.30
Pneumoniae
15.75 ± 0.43
10.38 ± 1.56
12.75 ± 1.92
14.00 ± 1.73
Staphylococcus aureus
17.50 ± 1.12
11.25 ± 0.83
12.63 ± 0.82
14.50 ± 0.87
Escherichia coli
14.63 ± 1.98
8.00 ± 0.00
8.00 ± 0.00
8.00 ± 0.00
3.5 Antifungal ability
Although TBE could well inhibit the growth of some bacteria, the effect on pathogenic fungi was quite different (Fig. 3). The inhibition rates on Colletotrichum gloeosporioides and Colletotrichum acutatum were lower than 20% showing a weak suppression ability (Fig. 3A and D). On the first day, TBE could restrain the growth of Fusarium oxyspoyum to about 40%, but on the next and third day, the inhibition rate was reduced continuously (Fig. 3C). 5 mg/mL of TBE showed no obvious inhibition on Botrytis cinerea (Fig. 3B). Nevertheless, 10 mg/mL of TBE could significantly suppressed Botrytis cinerea to about 50% on the third day (Fig. 3B). Therefore, TBE exhibited an efficient inhibitory on Botrytis cinerea but except other three strains.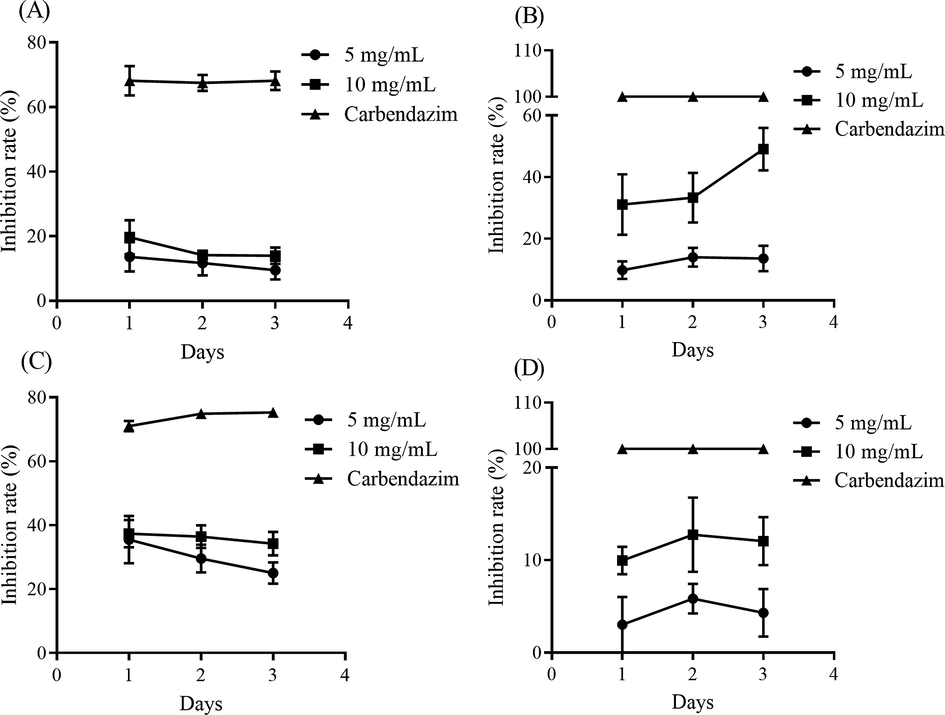
The effect of different concentrations of TBE on the growth of (A) Colletotrichum gloeosporioides, (B) Botrytis cinerea, (C) Fusarium oxyspoyum and (D) Colletotrichum acutatum.
3.6 Anticancer ability
Based on the outcomes of the toxicity on CHO cells, the appropriate concentration of TBE used on cells was lower than 50 μg/mL. So different concentrations of TBE were added to treat four cancer cells. As shown in Fig. 4A, the proliferation of A549 cells was declined with the increasing concentration of TBE. And the maximum inhibition rate was 32.7% at 50 μg/mL of TBE for 48 h. When TBE was higher than 10 μg/mL, the growth of Hela cells was obviously restrained. And the inhibition ability of 50 μg/mL was close to the positive group (Fig. 4B). The IC50 was 44.19 μg/mL and 41.79 μg/mL for 24 and 48 h, respectively. Although with the increasing concentration of TBE, the inhibition rate on S180 was also ascending, the maximum inhibition rate was pretty low 17.50% (Fig. 4C). So, TBE might have no significantly negative effect on the growth of S180. As shown in Fig. 4D, the proliferative capacity of Hep G2 cells was suppressing as the concentration of TBE was increasing. The maximum inhibition rate was 51.87 μg/mL with the IC50 of 51.09 μg/mL and 48.62 μg/mL for 24 and 48 h, respectively. Therefore, TBE exhibited a strong inhibition ability on selected cancer cells likewise Hela and Hep G2 cells, which was in accordance with our previous report (Luo et al., 2020b)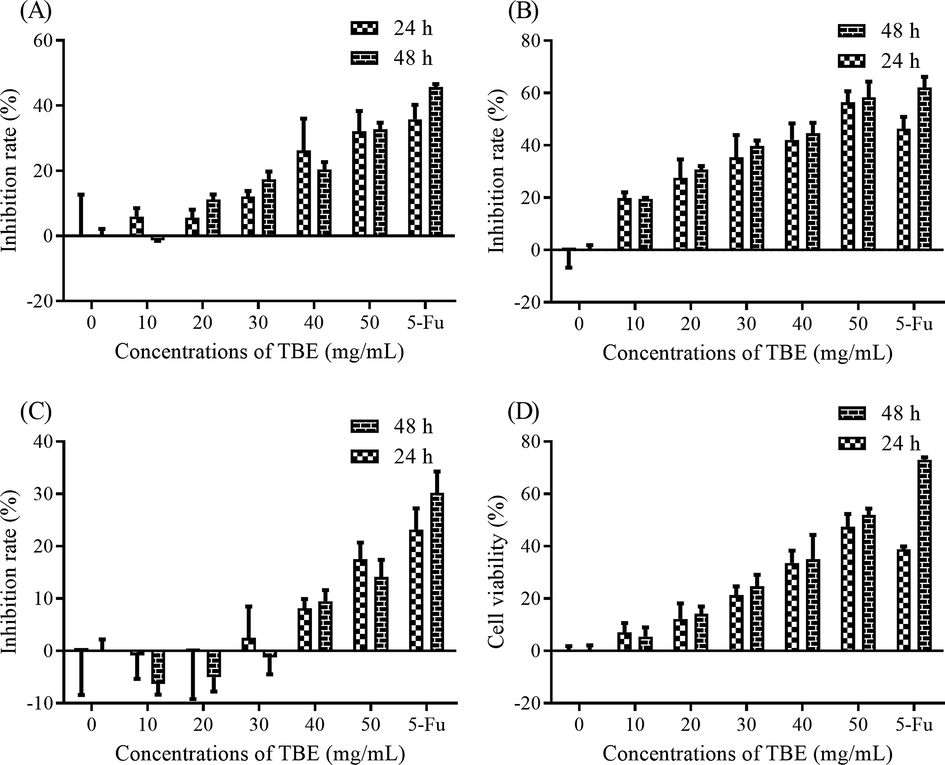
The anticancer abilities of TBE on (A) A549 cells (B) Hela cells (C) S180 cells and (D) Hep G2 cells.
3.7 The content and charicteristic of total triterpenes content in different extraction phases
Since TBE showed a strong antioxidant ability in vitro, thereby, fractionally extraction was applied to further explore the substance with antioxidant capacity. As shown in Table 3, the ethanol extraction phase (EP) contained the highest level of total triterpenes (743.02 ± 23.48 mg/g) while petroleum ether phase (PEP) had the lowest (22.57 ± 9.48 mg/g). Therefore, total triterpenes were highly existed in Bergenia emeiensis and were tending to a large polarity. Bergenin and other phenolic compounds were found in Bergenia plants (Singh et al., 2017). Nevertheless, this was the first time to report the presence of total triterpenes in Bergenia. The Fei et al. also used ethanol, petroleum and ethyl acetate to extract total triterpenes from Pyrus ussuriensis, respectively. And the content ranged from 66.01 to 256.33 mg/g, which was much lower than that in this work (Peng et al., 2020). The optimal yield of total triterpenoids from Jujube (Ziziphus jujuba) was 19.21 mg/g (Song et al., 2020). Chen et al. used five extraction methods to extract total triterpenes from Ganoderma atrum and the yields ranged from 1.51 to 5.11% (Chen et al., 2007). But those results were quite lower than that in the rhizomes of B. emeiensis. Hence, B. emeiensis contained a high level of triterpenes than other natural plants, and could be an abundant resource for triterpenes.
Components
Contents (mg/g)
Petroleum ether phase
22.57 ± 9.48
Ethyl acetate phase
391.38 ± 12.36
Ethanol phase
743.02 ± 23.48
To further confirm the existence of total triterpenes in ethyl acetate (EAP) and ethanol phases, the UV and FT-IR scanning spectrum were conducted. Petroleum ether phase was viscous materials and contained the least triterpenes. Hence, the UV and FT-IR scanning spectrums were only applied to investigate the functional groups in ethyl acetate and ethanol phases. As shown in Fig. 5A, both phases had a strong absorbance at 215–220 nm, indicating there was a strong presence of conjugated dienes. And a faint peak at 270–280 meant the existence of ketones in EAP and EP. As shown in Fig. 5B, there were some O-H stretching absorbance at 3700–3500 cm−1, meaning there existed more hydrogen bonded hydroxy groups in EAP and EP. And the peaks from 3100 to 2800 cm−1 was ascribed the stretching vibration of C-H. EP had stronger and more absorbance peaks at 1850–1660 cm-1 than EAP, indicating more carbonyl groups in EP. Therefore, the substances in EP and EAP were quite different, meaning EA and EAP might exhibit a different bioactivities.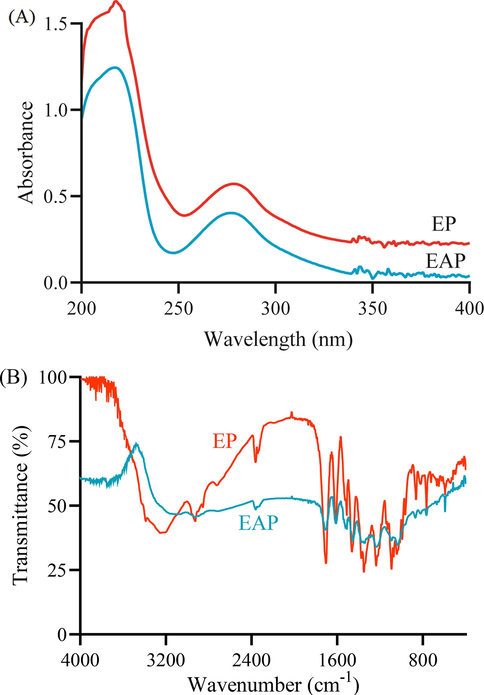
The spectroscopical analysis of ethyl acetate phase and ethanol phase (A) the ultraviolet absorption spectrum (B) infrared absorption spectrum.
3.8 The antioxidant ability of different extraction phases
Since the content of total triterpenes differently existed in three phases, the bioactivity could be different. As shown in Fig. 6A, PEP could hardly clear DPPH radicals, while EAP and EP could well scavenge DPPH. The clearacne rate of EP was tended to be flat and close to Vc when the concentration was higher than 0.4 mg/mL. And the concentration of EAP was over 0.8 mg/mL, the scavenging capacity was close to Vc. The EC50 of EAP and EP was 0.31 mg/mL and 0.37 mg/mL, respectively. Hence, EP exhibited a greater DPPH radical scavenging ability, followed by EAP and PEP. As the increasing concentration, the total reducing power of three phases was also promoting, of which EP and EAP were colse to Vc (Fig. 6B). Total triterpenoids from Jatropha curcas leaves could scavenge 79.51% DPPH free radicals at 3.2 mg/mL and for ABTS radical, the percentage inhibition was 65.25% with the concentration of 1.6 mg/mL (Wei et al., 2015). The EC50 of total triterpenoids from Poria cocos on DPPH radical was 0.79 mg/mL (Wang et al., 2017). The clearance was much lower than EAP and EP. Mariagrazia et al. found the crude extract from Bergenia cordifolia also showed a strong antioidant ability while the specifically compounds were still unknown (Roselli et al., 2011). In this present work, the total triterpenes in EP and EAP were in a high level, maybe the total triterpenes was a main bioactivity constituents in B. emeiensis. Since EP contained more carbonyl than EAP (Fig. 6 B), maybe this is the reason for EP showed a stronger antioxidant ability (Liang et al., 2008). Hence, total triterpenes from B. emeiensis exhibited an excellent antioxidant capacity.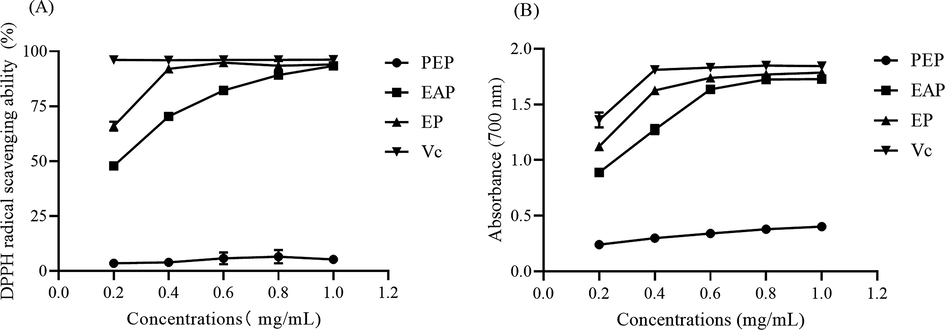
The antioxidant ability of three phases (A) DPPH free radicals scavenging ability and (B) the total reducing power.
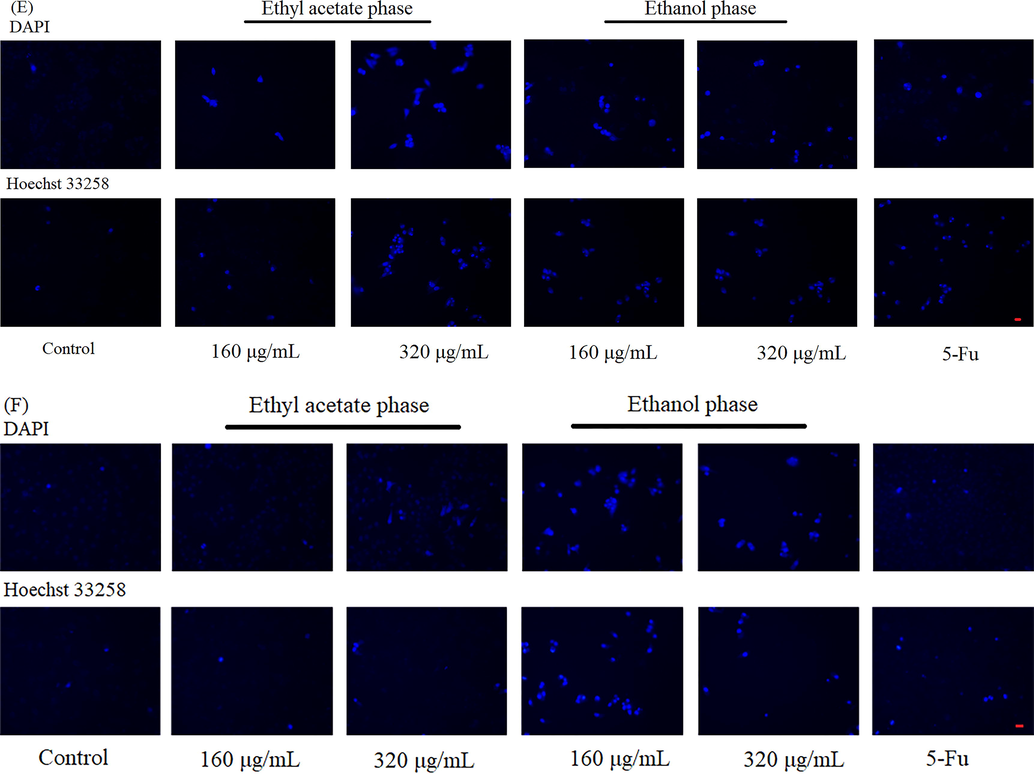
3.9 The anticancer effect of different extraction phases on Hela and Hep G2 cells
Triterpenes has been proved to have a selective toxic effect on cancer cells showing a strong anti-tumor effect (Lei et al., 2014). Based on the results of anticancer assays (Fig. 4), in this work, TBE showed a strong inhibition effect on Hela and Hep G2 cells. Therefore, the toxic effect of three phases from B. emeiensis was evaluated by determined the cell viability and cell apoptosis of Hela and Hep G2 cells. As shown in Fig. 7A and B, PEP had no positive or negative effect on Hela and Hep G2 cells. While as prolonging the time of treatment, EP and EAP greatly inhibited the growth of Hela cells, and the effect of EP was better than EAP and the positive control. Nevertheless, EAP could not suppressed the proliferation of Hep G2 cells. Yet, EP still exhibited a significant inhibitory ability (Fig. 7C and D). To further explore the reason for low cell viability, two dyeing methods were applied to observe cell apoptosis. As shown in Fig. 7E, Hela cells pretreated with EAP and EP were less than control group and the bright blue was more in cells, meaning EAP and EP induced the cells apoptosis in Hela cells. Since EAP showed a weak inhibition on Hep G2 cells, the apoptosis cells were less than the group treated with EP (Fig. 7F). And the number of cells had decreased after treated with EP. Other total triterpenes could also restrain the proliferation of cancer cells. Total triterpenes from Ganoderma lucidum could induce cells apoptosis in MCF-7 by down-regulating Bcl-2, Bcl-xL and up-regulating the levels of Bax and caspase-9 (Smina et al., 2017). Triterpenoid saponins from the Anemone flaccida also induced apoptosis via COX-2/PGE2 pathway on Hela and Hep G2 cells (Han et al., 2013). Hence, total triterpenes from B. emeiensis (EAP and EP) could significantly depress the growth of Hela and Hep G2 cells by inducing cell apoptosis.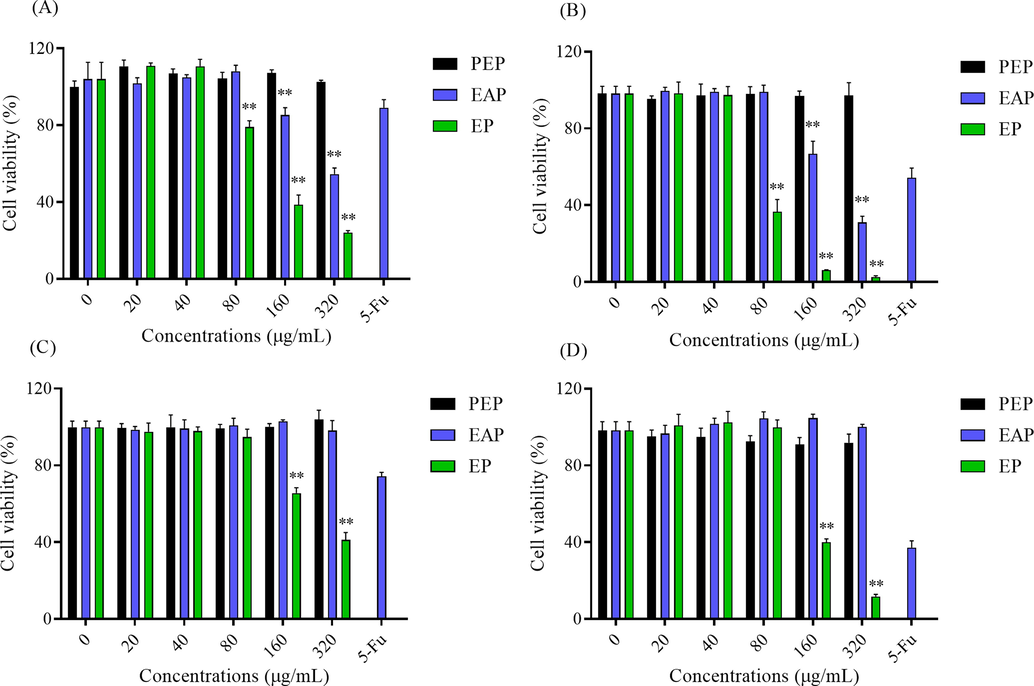
The anticancer effect of two phases on Hela and Hep G2 cells. The cell viability of Hela cells treated with samples for (A) 24 h and (B) 48 h. The cell viability of Hep G2 treated with samples for (C) 24 h and (D) 48 h. The apoptotic bodies were stained by DAPI and Hoechst 33258 in (E) Hela cells and (F) Hep G2 cells. The apoptosis cells were dyed in bright blue. Red bar meant 50 μm. Note: ** meant p < 0.01.
The anticancer effect of two phases on Hela and Hep G2 cells. The cell viability of Hela cells treated with samples for (A) 24 h and (B) 48 h. The cell viability of Hep G2 treated with samples for (C) 24 h and (D) 48 h. The apoptotic bodies were stained by DAPI and Hoechst 33258 in (E) Hela cells and (F) Hep G2 cells. The apoptosis cells were dyed in bright blue. Red bar meant 50 μm. Note: ** meant p < 0.01.
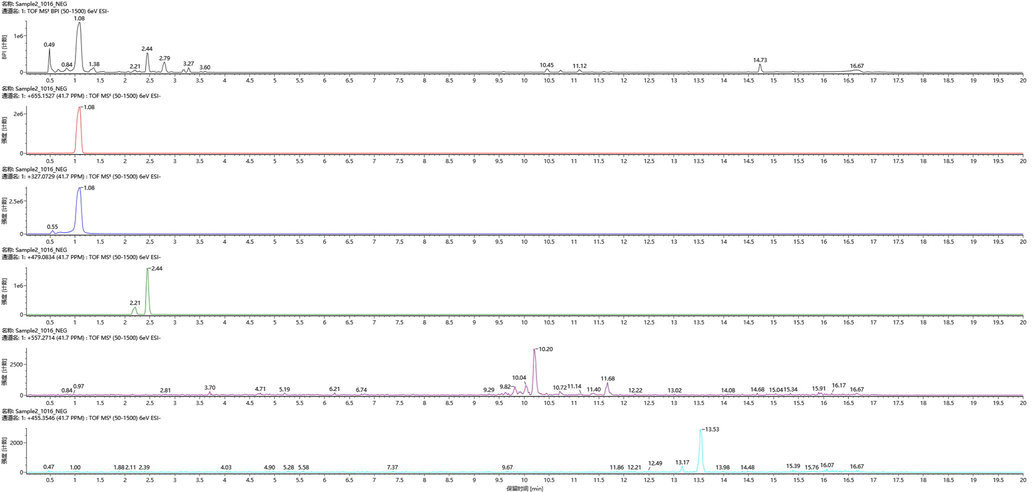
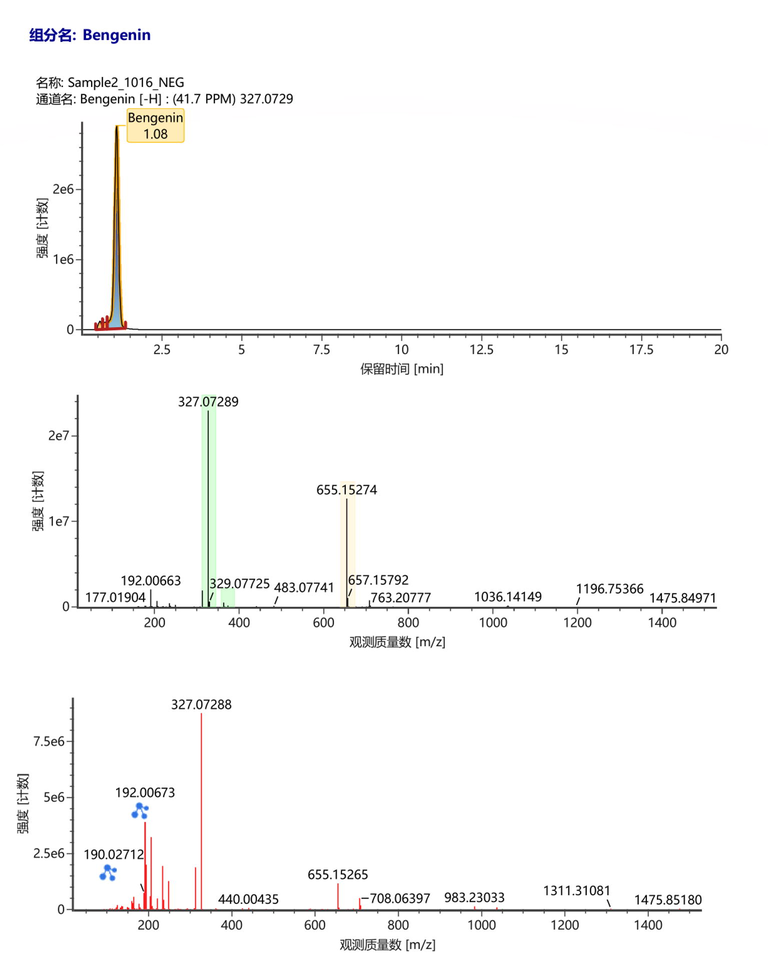
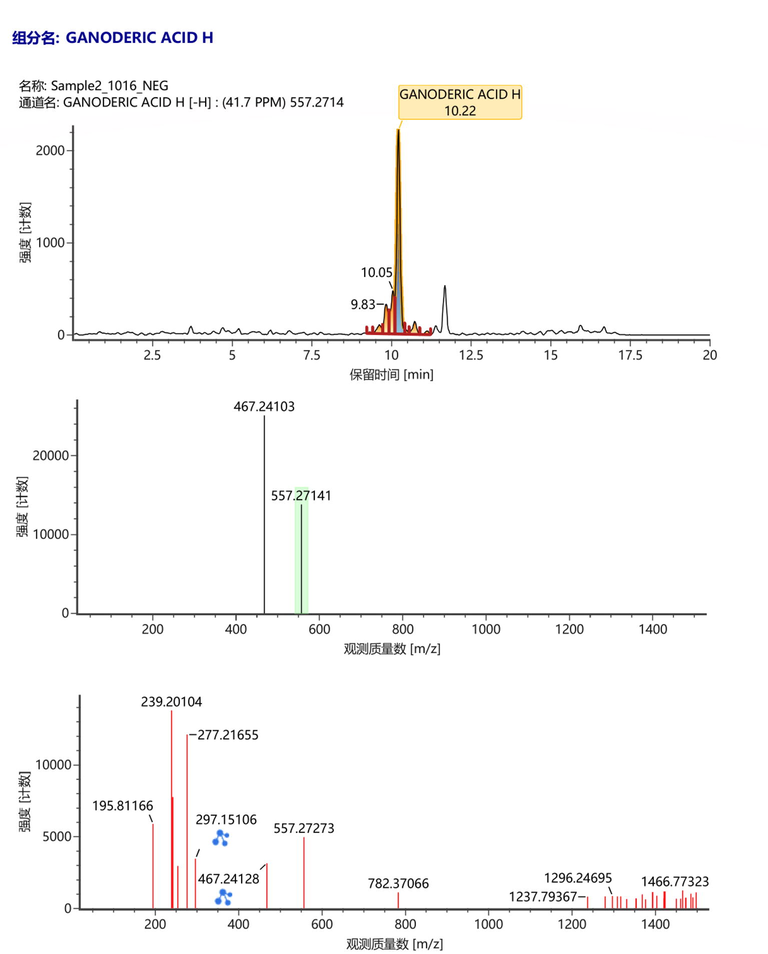
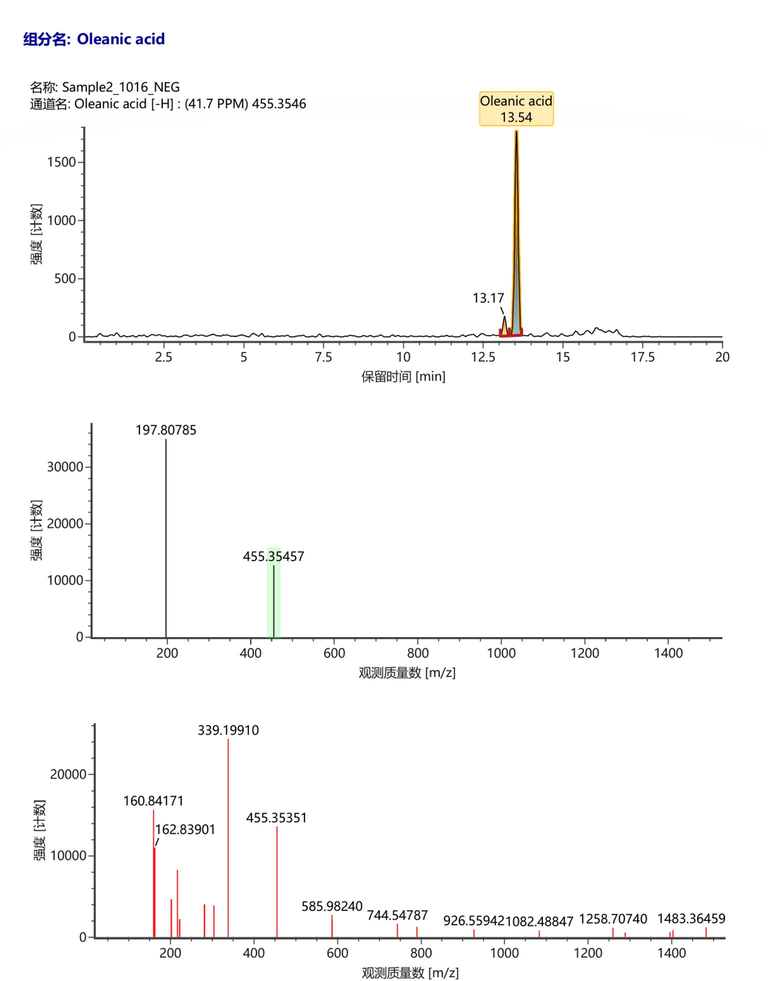
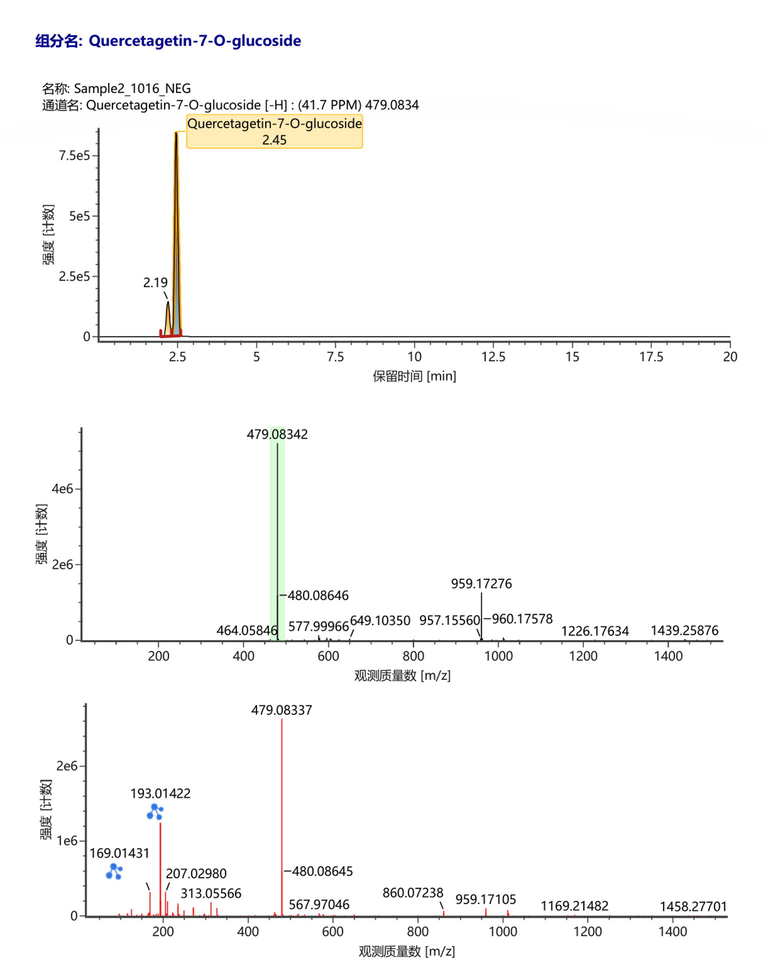
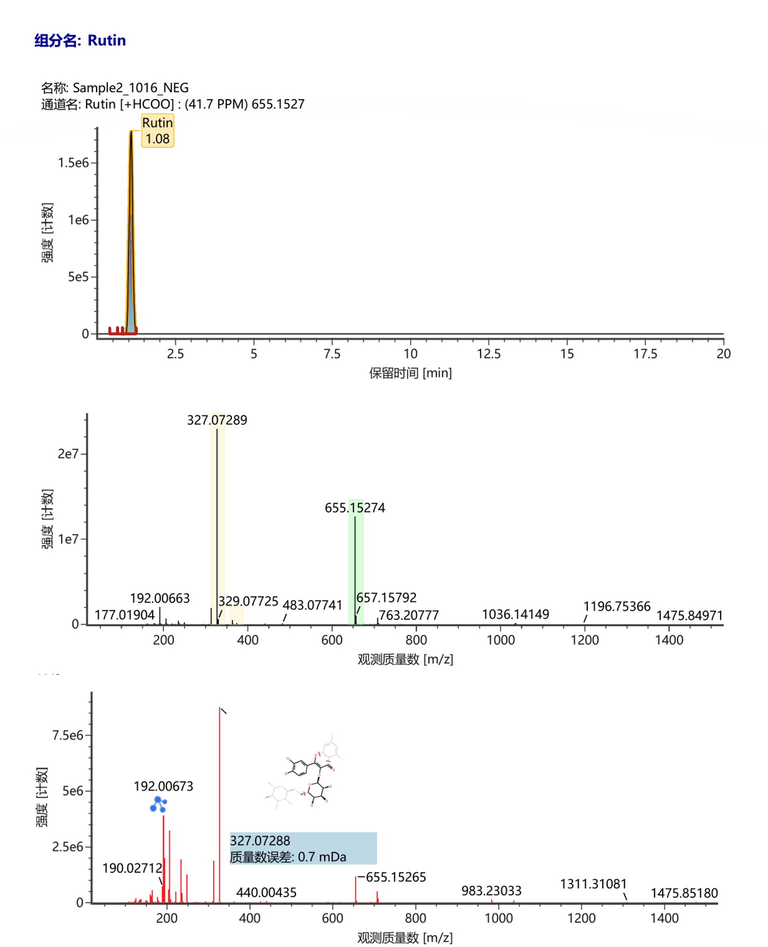
EP showed a strong anticancer ability. Therefore, UPLC was used to analysize the chemical components in EP. As shown in Table 4, six compositions were identified, among those, (−)-Catechin gallate, Ganoderic acid H and Oleanic acid were identified. (−)-Catechin gallate belonged to the bioactive polyphenols in green tea, and those polyphenols had exhibited an excellent inhibition effect on hepatic epithelial cells (Uesato et al., 2001; Lu and Hwang, 2008). Ganoderic acid was proved to be a promising anticancer agent (Upadhyay et al., 2014). Hence, we could assume that the suppression on the proliferation of cancer cells of EP might be results of the synergetic effect among those notably components. But, more further investigations should be carried out to elucidate the tumor suppression mechanism. Notes: the total ion chromatogram image and MS for each chemical composition was provided as Supplemental files 1–7.
Chemical compositions
Chemical formula
(−)-Catechin gallate
C22H18O10
Bengenin
C14H16O9
Ganoderic acid H
C31H42O9
Oleanic acid
C30H48O3
Quercetagetin-7-O-glucoside
C21H20O13
Rutin
C27H30O16
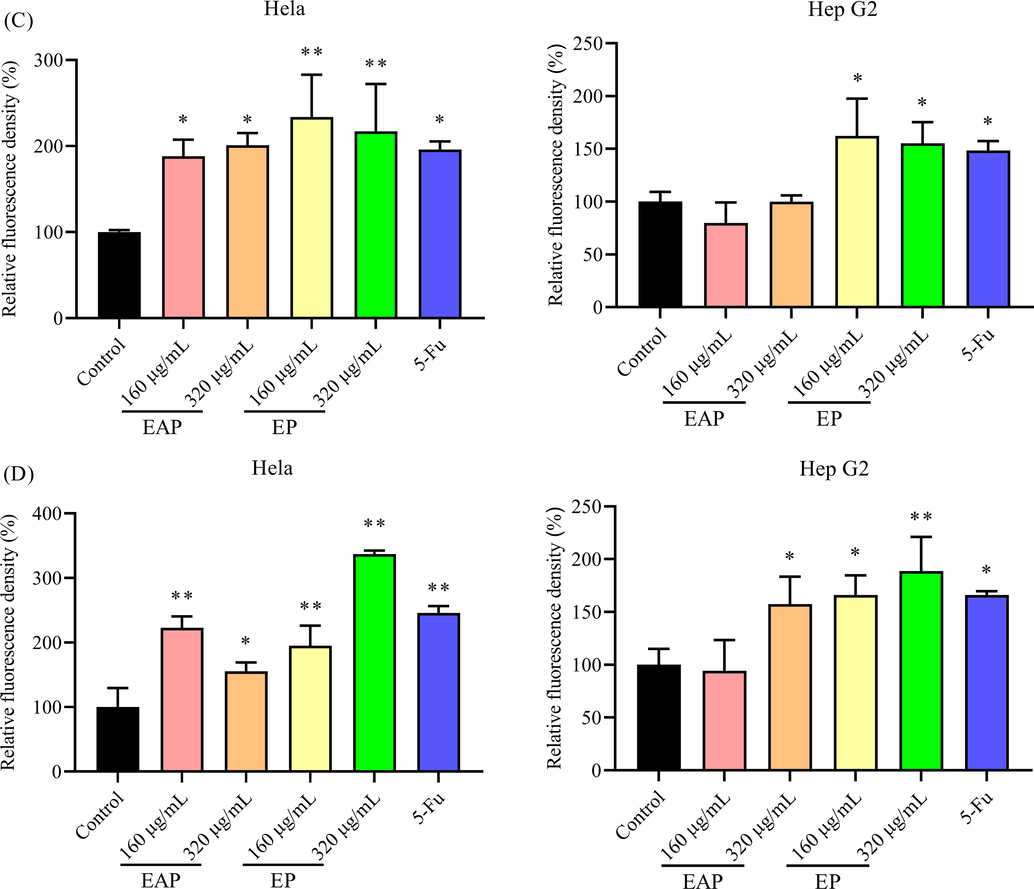
3.10 The ROS level and the mitochondrial membrane potential of Hela and Hep G2 cells
On the cancer therapy, anticancer agents will induce a high level of ROS in cells then cause cell apoptosis owing to the pro-oxidation effect of anticancer agents, such as camptothecins and alkylating agents (Ozben, 2007; Conklin, 2004). Extra ROS in cells is proved to bring permanent damage to mitochondrial membrane then induce cell apoptosis (Kroemer et al., 2007). Therefore, to further explore the inhibition effect of total triterpenes from B. emeiensis, the ROS level and mitochondrial membrane potential were determined. As shown in Fig. 8A, the ROS level in cancer cells treated with triterpenes from B. emeiensis increased compared with the control group. And an increasing concentration of agents induced more ROS in cells (Fig. 8C).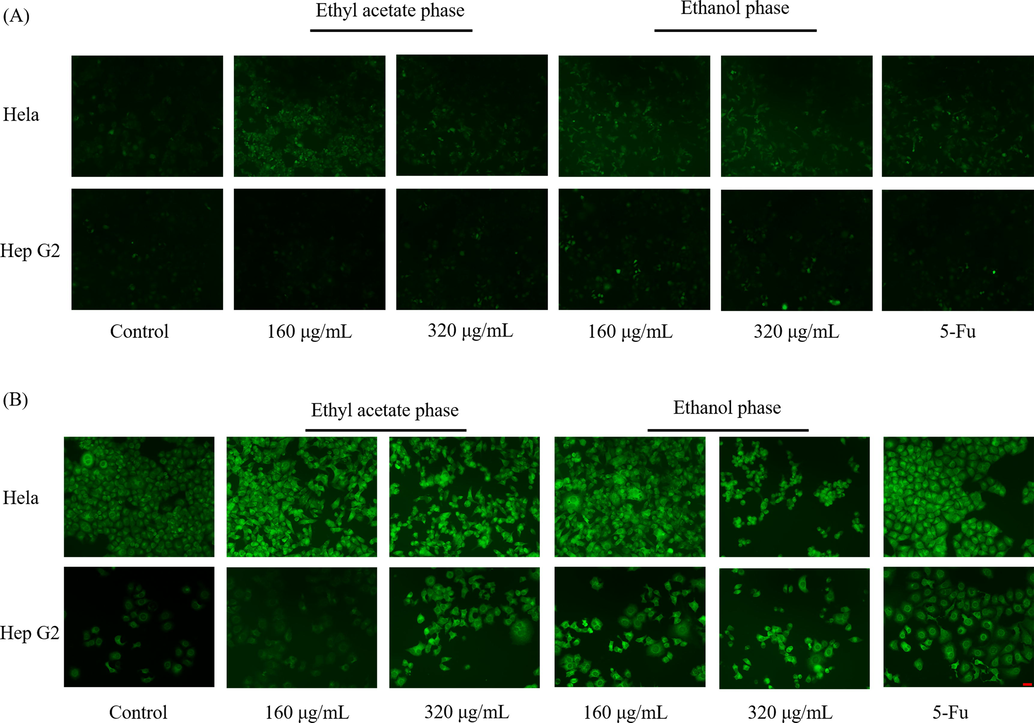
The effect of two phases on (A and C) the ROS level and (B and D) the mitochondrial membrane potential. The relative fluorescence density was calculated based on the density of blank control group. Notes: * meant p < 0.05.** meant p < 0.01. Red bar meant 50 µm.
The effect of two phases on (A and C) the ROS level and (B and D) the mitochondrial membrane potential. The relative fluorescence density was calculated based on the density of blank control group. Notes: * meant p < 0.05.** meant p < 0.01. Red bar meant 50 µm.
When the cells undergo apoptosis, the integrity of the mitochondrial membrane is destroyed, and the mitochondrial membrane permeability transfer hole opens, causing the breakdown of the mitochondrial transmembrane potential, and Rh123 re-releases from mitochondria, thus emitting strong yellow-green fluorescence. A high fluorescence density hence means a decreasing mitochondrial membrane potential (MMP) The fluorescence images demonstrated the MMP in Hela and Hep G2 cells treated with triterpenes was changed (Fig. 8B). Since EAP could not suppress the proliferation of Hep G2 cells, the ROS and MMP were not significantly changed (Fig. 8D) while 320 μg/mL of EAP could significantly change the MMP of Hep G2 cells. Antrodia salmonea, a traditional Chinese medicine was also proved to increase the ROS level in human promyelocytic leukemia cells and then induce cell apoptosis (Hseu et al., 2014). Therefore, it could be presumed that the anticancer effect of total triterpenes from B. emeiensis was mediated via increasing ROS level and decreasing MMP.
4 Discussions
Extracts from Bergenia had been proved to possess an antioxidant ability. 70% Ethanol extracts from Bergenia crassifolia was a typical acceptor of peroxy radicals (Shilova et al., 2006). But those researches were rarely reported and only focused on the antioxidant ability on free radicals in vitro. More importantly, the components responsible for the antioxidant capacity were not still identified yet. In this work, the antioxidant of total triterpenes from B. emeiensis was evaluated in vitro and in vivo. The high clearance rates on DPPH and superoxide anion radicals showed that TBE could well scavenge free radicals. And in cellular level, TBE reduced the ROS level in CHO cells under oxidative stress. Hence the survival of treated cells was enhanced. Both in vitro assays demonstrated TBE could clear free radical and alleviate the oxidative damage, thus exhibiting a strong antioxidant ability in vitro in accordance with the previous report (Pozharitskaya et al., 2007). But the environment in vivo was complex, hence, C. elegans was applied to further investigate the effect of TBE in a whole organism. As shown in Fig. 2, TBE could enhance the resistance of C. elegans under thermal stress, reflecting a great antioxidant in vivo. In our previous work, the triterpenes extract from B. emeiensis also showed a strong antioxidant ability that the suitable concentration of extract on C. elegans was 0.1 mg/mL (Luo et al., 2020a). While in this work, 0.05 mg/mL could extend the survival of C. elegans. In the previous work, the content of triterpenes was about 40–45%, but the content of triterpenes in TBE was 75–80%. Hence, it was easily concluded that a high content of triterpenes might cause a certain toxicity on a whole organism, therefore, the suitable concentration decreased. As the content of triterpenes increased in this work, the antioxidant ability was stronger than our previous work, indicating the triterpenes in TBE might contribute to the excellent antioxidant capacity.
The antimicrobial ability of Bergenia was also reported in previous researches. The ethanol extract from Bergenia crassifolia showed a bacteriostatic ability on five bacteria with the IC50 ranging from 15.63 to 62.50 mg/mL and the rhizome extract exhibited a better capacity than that of Aerial part (Kokoska et al., 2002). Extract from Bergenia ligulata also exhibited antimicrobial activity against six bacteria with the zone of inhibition ranging from 2.17 to 4.78 mm (Agnihotri et al., 2014). And in this study, we found TBE from B. emeiensis also showed a certain antimicrobial capacity against five bacteria except for Bacillus cereus, Escherichia coli and Salmonella typhimurium. However, Bergenia was found to inhibit Bacillus cereus and Escherichia coli at the minimum inhibitory concentration of 62.50 mg/mL while in this work the concentration of TBE was lower than 10.00 mg/mL (Rossing et al., 2003). Hence, maybe the concentration of drug was not enough to suppress the two strains. Moreover, B. ligulata leaf extracts showed some certain inhibition effect on fungal such as Aspergillus niger, Fusarium oxysporum, Penicillium citrinum, Trichoderma viride and Trametes hirsute with weak inhibition zones (Agnihotri et al., 2014). In this present work, TBE only could suppress the growth of Botrytis cinerea but exhibited no obviously positive or negative effect on Colletotrichum gloeosporioides, Fusarium oxyspoyum and Colletotrichum acutatum, showing a weak anti-fungal capacity. This result was in accordance with the previous report (Agnihotri et al., 2014). In this work, the concentration of triterpenes was higher than 75%, hence we used a low dose to conduct the antibacterial and antifungal experiments. But the results showed the antibacterial and antifungal capacity of TBE were weak. Therefore, we assumed that the antibacterial and antifungal effects of plants from Bergenia was connected with a higher concentration and other compounds expect triterpenes.
Although Bergenia was pronounced to possess the property of antiviral (Dulta et al., 2020), the anticancer capacity was rare reported. Bergenia ciliate rhizome extract showed a remarkable selective cytotoxicity against the Human Cervical cancer (HeLa) and Human colon cancer (HT-29) cell lines (Molnar et al., 2006). TBE could well inhibit the growth of Hela and Hep G2 cancer cells and also showed a certain negative effect on the proliferation of S180 and A549 cells in vitro. Natural triterpenes from plants had been proved to exhibit a strong inhibition on cancer cells (Tundis et al., 2014; Fang et al., 2010). Cycloartane triterpenoids deriving from Cimicifuga yunnanensis induced the apoptosis of MCF7 cancer cells via p53-dependent mitochondrial pathway (Peng et al., 2020). Other triterpenoids also could inhibit cancer cells such as Prostate ADPC, PC3 and so on by inducing apoptosis (Fang et al., 2010. In our previous work, the triterpenes from the leaves of B. emeiensis could inhibit the growth of Hela cells via mitochondrial signaling pathway then induce cell apoptosis (Luo et al., 2020b). In this work, after fractionally extraction, EP showed a strong suppression on the growth of Hep G2 and Hela cells via causing pro-oxidation and activating cell apoptosis. Hence, the triterpense from B. emeiensis rhizomes might become a promising anticancer agent.
Some antioxidants lead to cell apoptosis during cancer therapy (Tomris, 2007). In this work, TBE showed a strong antioxidant ability both in vitro and in vivo. additionally, TBE exhibited a strong inhibition effect on the growth of Hela and Hep G2 cells via causing a high content of ROS. In previous work, antioxidant may enhance the effects of chemotherapy, while preventing free-radical-induced side effects (Lamson and Brignall, 1999). And considerable existing data show increased effectiveness of many chemotherapeutic agents, as well as a decrease in toxic adverse effects, when given concurrently with antioxidants (Drisko et al., 2003; Lamson and Brignall, 2000). As TBE showed a certain antibacterial ability, which might be the reason why the local people in rural area of Asia mashed the fresh of Bergenia to prevent wound infection. Therefore, TBE is a promising agent in treating cancer cells for a low toxicity and a low ability of infection.
5 Conclusion
B. emeiensis as a common medicine in the area of southwest of China, was rarely assessed its bioactivity. Hence, in this work, the antioxidant, antibacterial and anticancer abilities of triterpenes from B. emeiensis were thoroughly evaluated. The results demonstrated TBE could well scavenge free radicals and showed a strong protection on CHO cells against H2O2 damage. In addition, TBE also enhanced the resistance of C. elegans under thermal stress. More evidence suggested TBE possessed a certain antibacterial capacity against selective strains such as Pseudomonas Aeruginosa. While TBE could not inhibit the growth of plant pathogenic fungi. Furthermore, TBE showed a strong anticancer effect on Hela, Hep G2 cells. After fractionally extraction, the triterpenes were highly existed in B. emeiensis, and the ethanol phase (EP) contained the most, followed by ethyl acetate phase (EAP) and petroleum ether phase (PEP). EP could well inhibit the growth of Hela and Hep G2 cells while EAP only suppressed the cell viability of Hela cells and PEP showed no anticancer effect. In addition, EP and EAP could induce cell apoptosis to restrain the proliferation of Hela and Hep G2 cells via increasing ROS level and decreasing MMP. Therefore, the total triterpenes from B. emeiensis exhibited an excellent antioxidant capacity and anticancer effect, indicating B. emeiensis could become a potential candidate for an alternatively natural antioxidant and anticarcinogen. And it was promising to further isolate triterpenes from B. emeiensis for a potential anticancer agent.
Declaration of Competing Interest
The authors declare that they have no known competing financial interests or personal relationships that could have appeared to influence the work reported in this paper.
References
- Antimicrobial and antioxidant phytochemicals in leaf extracts of Bergenia ligulata: a Himalayan herb of medicinal value. Nat. Prod. Res.. 2014;29:1074-1077.
- [CrossRef] [Google Scholar]
- Phytochemical analysis, antioxidant, antibacterial and cytotoxicity properties of keys and cores part of Pandanus tectorius fruits. Arabian J. Chem.. 2015;12:3555-3564.
- [CrossRef] [Google Scholar]
- Antioxidant and hypoglycemic activities of leaf extracts of three popular terminalia species. E-J. Chem.. 2012;9:883-892.
- [CrossRef] [Google Scholar]
- Traditional medicinal plants of cold desert Ladakh-Used against kidney and urinary disorders. J. Ethnopharmacol.. 2008;118:331-339.
- [CrossRef] [Google Scholar]
- Antiurolithic effect of Bergenia ligulata rhizome: an explanation of the underlying mechanisms. J. Ethnopharmacol.. 2009;122:106-116.
- [CrossRef] [Google Scholar]
- α-glucosidase and α-amylase inhibitory activities of Nepalese medicinal herb Pakhanbhed (Bergenia ciliata, Haw.) Food Chem.. 2008;106:247-252.
- [CrossRef] [Google Scholar]
- Microwave-assisted extraction used for the isolation of total triterpenoid saponins from Ganoderma atrum. J. Food Eng.. 2007;81:162-170.
- [CrossRef] [Google Scholar]
- ID-CUBE direct analysis in real time high-resolution mass spectrometry and its capabilities in the identification of phenolic components from the green leaves of Bergenia crassifolia L. Rapid Commun. Mass Spectrom.. 2012;26:1329-1337.
- [CrossRef] [Google Scholar]
- Chemotherapy-associated oxidative stress: impact on chemotherapeutic effectiveness. Integrative Cancer Therapies. 2004;3:294-300.
- [CrossRef] [Google Scholar]
- Chemical composition, antibacterial activity, and mechanism of action of the essential oil from Amomum kravanh. J. Food Prot.. 2014;77:1740-1746.
- [CrossRef] [Google Scholar]
- The use of antioxidant therapies during chemotherapy. Gynecol. Oncol.. 2003;88(3):434-439.
- [CrossRef] [Google Scholar]
- A Novel Approach of synthesis zinc oxide nanoparticles by Bergenia ciliata rhizome extract: antibacterial and anticancer potential. J. Inorg. Organomet. Polym. Mater. 2020 (in press)
- [CrossRef] [Google Scholar]
- Cycloartane triterpenoids from Cimicifuga yunnanensis induce apoptosis of breast cancer cells (MCF7) via p53-dependent mitochondrial signaling pathway. Phytother. Res.. 2010;25:17-24.
- [CrossRef] [Google Scholar]
- Comprehensive review: Bergenia ligulate wall-controversial clinical candidate. Int. J. Pharmaceut. Sci. Res.. 2014;5:1630-1642.
- [CrossRef] [Google Scholar]
- The antitumor effects of triterpenoid saponins from the Anemone flaccida and the underlying mechanism. Evidence-based Complement. Alternat. Med.. 2013;2013:1-8.
- [CrossRef] [Google Scholar]
- The anti-tumor activity of Antrodia salmonea in human promyelocytic leukemia (HL-60) cells is mediated via the induction of G1 cell-cycle arrest and apoptosis in vitro or in vivo. J. Ethnopharmacol.. 2014;153:499-510.
- [CrossRef] [Google Scholar]
- Screening of some Siberian medicinal plants for antimicrobial activity. J. Ethnopharmacol.. 2002;82:51-53.
- [CrossRef] [Google Scholar]
- Biorefining of Bergenia crassifolia L. roots and leaves by high pressure extraction methods and evaluation of antioxidant properties and main phytochemicals in extracts and plant material. Ind. Crops Prod.. 2016;89:390-398.
- [CrossRef] [Google Scholar]
- Mitochondrial membrane permeabilization in cell death. Physiol. Rev.. 2007;87:99-163.
- [CrossRef] [Google Scholar]
- Antioxidants in cancer therapy; their actions and interactions with oncologic therapies. Alternative Med. Rev.. 1999;4(5):304-329. PMID: 10559547
- [Google Scholar]
- Antioxidants and cancer therapy II: quick reference guide. Alternative Med. Rev. J. Clin. Therapeut.. 2000;5(2):152-163. PMID: 10767670
- [Google Scholar]
- Review on anti-tumor effect of triterpene acid compounds. J. Cancer Res. Ther.. 2014;10:14.
- [CrossRef] [Google Scholar]
- Synthesis and anti-bacterial properties of mono-carbonyl analogues of curcumin. Chem. Pharm. Bull.. 2008;56:162-167.
- [CrossRef] [Google Scholar]
- Polyphenol contents of Pu-Erh teas and their abilities to inhibit cholesterol biosynthesis in Hep G2 cell line. Food Chem.. 2008;111:67-71.
- [CrossRef] [Google Scholar]
- In vivo and in vitro antioxidant activities of methanol extracts from olive leaves on Caenorhabditis elegans. Molecules. 2019;24:704.
- [CrossRef] [Google Scholar]
- Effects of ultrasonic-assisted extraction on the yield and the antioxidative potential of Bergenia emeiensis triterpenes. Molecules. 2020;25:4159.
- [CrossRef] [Google Scholar]
- Optimization of ultrasound-assisted extraction of triterpenes from Bergenia emeiensis leaves and inhibition effect on the growth of Hela cells. J. Appl. Res. Med. Aromat. Plants. 2020;18:100266.
- [Google Scholar]
- Screening of Tanzanian Medicinal Plants against Plasmodium falciparum and human immunodeficiency virus. Planta Med.. 2009;76:195-201.
- [CrossRef] [Google Scholar]
- Inhibition of multidrug resistance of cancer cells by natural diterpenes, triterpenes and carotenoids. Curr. Pharm. Des.. 2006;12:287-311.
- [CrossRef] [Google Scholar]
- Oxidative stress and apoptosis: Impact on cancer therapy. J. Pharm. Sci.. 2007;96:2181-2196.
- [CrossRef] [Google Scholar]
- Compositional characterization of Pyrus ussuriensis Maxim and their antioxidant activities and induction of apoptosis in Bel-7402 cell. J. Food Biochem.. 2020;44:e13222.
- [CrossRef] [Google Scholar]
- Basic Caenorhabditis elegans methods: synchronization and observation. J. Visual. Exp.. 2012;64:e4019.
- [CrossRef] [Google Scholar]
- Separation and evaluation of free radical-scavenging activity of phenol components of green, brown, and black leaves of Bergenia crassifolia by using HPTLC-DPPH•method. J. Sep. Sci.. 2007;30:2447-2451.
- [CrossRef] [Google Scholar]
- Phytochemical, antioxidant and anti-α-glucosidase activity evaluations of Bergenia cordifolia. Phytother. Res.. 2011;26:908-914.
- [CrossRef] [Google Scholar]
- Pharmaceutical care in Denmark: perceived importance of medicine-related problems and participation in postgraduate training. Pharm. World Sci.. 2003;25:73-78.
- [CrossRef] [Google Scholar]
- Effect of Bergenia crassifolia L. extracts on weight gain and feeding behavior of rats with high-caloric diet-induced obesity. Phytomedicine. 2012;19:1250-1255.
- [CrossRef] [Google Scholar]
- Antioxidant properties of Bergenia crassifolia extract. Pharm. Chem. J.. 2006;40:620-623.
- [CrossRef] [Google Scholar]
- Antioxidant, antimicrobial activity and bioactive compounds of Bergenia ciliata Sternb.: A valuable medicinal herb of Sikkim Himalaya. J. Traditional Complement. Med.. 2017;7:152-157.
- [CrossRef] [Google Scholar]
- Ganoderma lucidum total triterpenes induce apoptosis in MCF-7 cells and attenuate DMBA induced mammary and skin carcinomas in experimental animals. Mutation Res./Genetic Toxicol. Environ. Mutagenesis. 2017;813:45-51.
- [CrossRef] [Google Scholar]
- Optimized extraction of total triterpenoids from Jujube (Ziziphus jujuba Mill.) and comprehensive analysis of triterpenic acids in different cultivars. Plants. 2020;9:412.
- [CrossRef] [Google Scholar]
- Oxidative stress and apoptosis: Impact on cancer therapy. J. Pharm. Sci.. 2007;96(9):2181-2196.
- [CrossRef] [Google Scholar]
- Recent insights into the emerging role of triterpenoids in cancer therapy. Stud. Nat. Prod. Chem.. 2014;40:1-32.
- [CrossRef] [Google Scholar]
- Inhibition of green tea catechins against the growth of cancerous human colon and hepatic epithelial cells. Cancer Lett.. 2001;170:41-44.
- [CrossRef] [Google Scholar]
- Traditional use of medicinal plants among the tribal communities of Chhota Bhangal, Western Himalaya. J. Ethnobiol. Ethnomed.. 2006;2:14.
- [CrossRef] [Google Scholar]
- Production of ganoderic acid by Ganoderma lucidum RCKB-2010 and its therapeutic potential. Ann. Microbiol.. 2014;64:839-846.
- [CrossRef] [Google Scholar]
- Hepatoprotective and antioxidant effects of total triterpenoids from Poria cocos. Eur. J. Med. Plants. 2017;21:1-9.
- [CrossRef] [Google Scholar]
- Extraction optimization of total triterpenoids from Jatropha curcas leaves using response surface methodology and evaluations of their antimicrobial and antioxidant capacities. Electron. J. Biotechnol.. 2015;18:88-95.
- [CrossRef] [Google Scholar]
- Isolation of bioactive compounds from Bergenia ciliata (haw.) Sternb rhizome and their antioxidant and anticholinesterase activities. BMC Complement. Alternative Med.. 2019;19:296.
- [CrossRef] [Google Scholar]
- Antimicrobial and antiradical activity of extracts obtained from leaves of five species of the genus Bergenia: identification of antimicrobial compounds. Microbial Drug Resistance. 2017;23:771-780.
- [CrossRef] [Google Scholar]
- Phenolic Composition, Antioxidant and anticancer potentials of extracts from Rosa banksiae Ait. flowers. Molecules. 2020;25:3068.
- [CrossRef] [Google Scholar]
- The determination of flavonoid contents in mulberry and their scavenging effects on superoxide radicals. Food Chem.. 1999;64:555-559.
- [CrossRef] [Google Scholar]
- Simultaneous optimization of extraction and antioxidant activity from Blumea laciniata and the protective effect on Hela cells against oxidative damage. Arabian J. Chem.. 2020;13:9231-9242.
- [CrossRef] [Google Scholar]
- Antifungal activity of Eucalyptus oil against rice blast fungi and the possible mechanism of gene expression pattern. Molecules. 2016;21:621.
- [CrossRef] [Google Scholar]
Appendix A
Supplementary material
Supplementary data to this article can be found online at https://doi.org/10.1016/j.arabjc.2021.103225.
Appendix A
Supplementary material
The following are the Supplementary data to this article: