

Translate this page into:
Chemical variability and antioxidant activity of Cedrus atlantica Manetti essential oils isolated from wood tar and sawdust
⁎Corresponding author at: Department of Chemistry, Ibn Tofail University, Faculty of Sciences, Laboratory of Organic Chemistry, Catalysis and Environment, B.P.:133, Kenitra, Morocco. jaouadi.imane@gmail.com (Imane Jaouadi)
-
Received: ,
Accepted: ,
This article was originally published by Elsevier and was migrated to Scientific Scholar after the change of Publisher.
Abstract
The present research was devoted to evaluating the effect of provenance and wood pyrolysis process on the phytochemical and antioxidant activity of essential oils extracted from sawdust and tar of Cedrus atlantica Manetti of Morocco. The essential oils were obtained by hydro-distillation from Cedar wood growing in two geographical locations of the Middle Atlas of Morocco (Senoual and Itzer forests) using a Clevenger-type apparatus and analyzed by Gas Chromatography-Mass spectrometry (GC/MS). Seventy compounds were approximately identified for each essential oil, accounting for 94% of the total oil’s composition, with the predominance of sesquiterpene hydrocarbons, where, α-himachalene (13.75%, 1.15%, 12.2%, and 16.69%) and β-himachalene (24.05%, 24.25%, 27.67%, and 44.23%) represented the major constituents in the four essential oils obtained. Multivariate analysis was used to discriminate the essential oils using principal component analysis (PCA) and Hierarchical Clustering Analysis (HCA). In addition, heatmap for dendrogram was used to investigate any correlation between the chemical profiles of each essential oil. Moreover, the antioxidant properties of the essential oils were studied using DPPH scavenging and Ferric Ion Reducing Power (FRAP). The results indicate that the essential oils from wood tar of Cedrus atlantica possess a strong antioxidant activity (IC50 = 0.126 mg/mL and 0.143 mg/mL) in comparison with those from sawdust (IC50 = 15.6 mg/mL and 16.3 mg/mL).
Keywords
Essential oil
Wood tar
Sawdust
Cedrus atlantica
Chemical composition
Antioxidant activity

1 Introduction
Since antiquity, medicinal and aromatic plants have been extensively used by civilizations to treat a large range of diseases (Ait-Sidi-Brahim et al., 2018). During decades, these plants have been the basis of all drugs discoveries around the world, of which, the secondary metabolites isolated from these plants have a significant biological activities necessary for health (Brooks and Brooks, 2014). Essential oils (EOs) are the volatile components of plants that are responsible for their aroma, and attracting more interest from different parts of the industry, due to their biological actions, including antimicrobial (Mahmoudi et al., 2013, Abers et al., 2021), antioxidant (Pateiro et al., 2018), anti-inflammatory (Ribeiro et al., 2018), anticancer (Fitsiou and Pappa, 2019), and anti-parasitic (Mancianti and Virginia Ebani, 2020) activities.
Morocco, by its biogeographical position, possesses a very rich ecological and floristic diversity, constituting a true plant genetic reserve, with a high level of endemic plants belonging to different botanical families (Zaher et al., 2018), with a very rich flora, which contains a large number of rare, endemic, or very remarkable species (Najem et al., 2019). In the context of this work, we have been interested in the species Cedrus atlantica Manetti an important forest tree species distributed in northern Africa, which is one of the most economically and ecologically important species in Morocco’s Mediterranean mountains belonging to the Pinaceae family (Moukrim et al., 2020). C. atlantica, also known as Atlas cedar, has been investigated in several studies in regard to different bio-functions including anti-inflammatory (Shinde et al., 1999), anticancer (Huang et al., 2020; Hung et al., 2020), antioxidant (Belkacem et al., 2021), antimicrobial (Zrira and Ghanmi, 2016), insecticidal (Ainane et al., 2019) activities, as well as analgesic effect (Emer et al., 2018).
Antioxidants are widely used in food and pharmaceutical sciences against the pathologic processes caused by oxidative stress, which increase the intracellular levels of free radicals (Gulcin, 2020; Guo et al., 2020). Oxidative stress is defined as an imbalance between production and accumulation of oxygen and nitrogen reactive species (ROS/RNS) in cells, and the capacity of the antioxidant defense system to act contrary to their action (Pizzino et al., 2017), that lead to some chronic and degenerative diseases. The application of antioxidants acting as free radical scavengers, singlet oxygen inhibitors and reducing agents, is therefore a rational curative strategy that could ameliorate the damage caused by oxidative stress by inhibiting the initiation or propagation of the oxidative chain reaction (Li et al., 2015; Xu et al., 2017). Antioxidants can be synthetic or natural, however, due to undesirable side effects of synthetic antioxidants, increasing attention has been directed to natural resources (Lourenço et al., 2019). Most natural antioxidants are entirely obtained from natural sources (food and medicinal plants) and have a great potential to replace the synthetic ones due to their rich contents of phenolic compounds, vitamins and carotenoids (Manessis et al., 2020; Xu et al., 2017).
From the perspective of the valorization of the Moroccan forest heritage, and to elaborate new products, we were particularly interested in the essential oils obtained from the wood and wood tar of C. atlantica. Wood represents an abundant renewable source of readily available energy on combustion, of which, thermal decomposition reactions in the absence of oxygen enable the recovery of solid and liquid fuels as well as valuables fine chemical by-products (Gonçalves et al., 2019). Wood dry distillation (pyrolysis) is the process in which the wood is heated (unburned) to form coal and vapors, these vapors are condensed to form a brownish liquid, this liquid is called wood tar, and it is a complex and unstable mixture of many compounds including phenols (Burri, 2010; Jindal and Jha, 2016). Coniferous wood tars have been used since prehistoric times for their adhesive, water-repellent, and medicinal properties, these tars have been used to treat people and animals in countries such as Morocco and Turkey (Julin, 2008). Paradoxically, the tars used by the populations have been little researched. Thus, this work comes to fill this gap by proposing a systemic analysis of medicinal tars, by studying their chemical compositions, and by evaluating their bioactivity (Hennius, 2018; Burri et al., 2019).
The valorization of essential oils derived from Cedar Wood has been the subject of various studies. In order to perfect our knowledge of extractable from C. atlantica wood, we have proposed to analyze samples of wood tar essential oils from the same cedar traditionally prepared in Morocco, whose characterization has not been the subject of any study in Morocco.
2 Materials and methods
2.1 Plant material
The Cedar Wood was collected in the Atlas Mountain of Ifrane region-Morocco (Itzer and Senoual forests), in the month of April 2018. The authentication of the plant material was done by Dr. Guedira Abdelhamid, a botanist at the Forest Research Center of Morocco, and voucher of specimens (CA0418) was added to the herbarium of the Botany Department.
A part of each tree's wood stump was selected and dried at room temperature in the dark. Sawdust was obtained by grinding the parts obtained from the cedar stumps, while the Cedar tar is obtained by carbonization of the stump parts of the tree (the young trunk and branches do not give an oil) using “double pot” process. Although certified since ancient times, the “double pot” process is the most common, in which the wood for distillation is introduced into a pot with a pierced bottom, equipped with a lid, then placed over the opening of another pot, and all the joints are then fought. The whole thing is then placed in a pit; the upper pot must rise above the surface of the ground, around which a fire is lit. Under the effect of heat (final temperature of about 500 °C) and the absence of oxygen, the material to be distilled exudes and the distillate flows inside the lower pot: this is the vegetable tar (Burri, 2010).
2.2 Isolation of essential oils by hydro-distillation
To obtain the essential oil, 200 g of each sample (sawdust and tar) were immersed in 1 L of distilled water, and subjected to a hydrodistillation for about 4 hours using a Clevenger type apparatus (IsoLab Laborgerate, GmbH, Wertheim, Germany) according to the European Pharmacopeia method (European Pharmacopeia, Council of Europe. Strasbourg, 3rd ed. (1997) 121). The EOs extracted were dried under anhydrous sodium sulfate, filtered and finally stored in sealed vials at 4 °C. The yield of EOs (%, v/w) was determined and expressed on a dry weight basis using the following formula:
2.3 Gas chromatography-mass spectrometry (GC - MS) analysis
The chromatographic analysis was performed at Hassan-II Agronomic and Veterinary Institute of Morocco. The GC–MS analysis was carried out with a Hewlett-Packard Gas Chromatographer (HP 6890) and a mass spectrometer (HP5973 series), equipped with an HP-5MS (5% phenyl-methyl siloxane) capillary column (30 m × 0.25 mm, film thickness: 0.25 m). The column was used at an injector temperature of 250 °C with the oven temperature programming ranges from 50 to 250 °C, for 5 min, with a gradient of 4° C/min, and then finally kept isothermal for 10 min. Nitrogen was used as the carrier gas at a rate of 1.7 mL/min. Essential oil (1 µl) was injected in a split mode ratio of 1:50. Mass spectra were obtained by electron ionization (EI) at an ionization energy of 70 eV, using a spectral scan range of 40–450 m/z. The ChemStation data analysis software was used to acquire mass spectra and total ions gas chromatography (GC-TIC) profiles. The components characterization was established by determination of their Kovats retention indices (KI) according to Van Den Dool equation (Van Den Dool and Kratz, 1963), and by matching the recorded spectra with a computed data library (Wiley 09, Nist 2011), according to a homologous series of n-alkanes (C7-C30) (Jaber et al., 2021). This characterization is completed by comparing the fragmentation patterns of mass spectra with those reported in the literature (Adams, 2007).
2.4 Antioxidant activities
2.4.1 DPPH radical scavenging activity
Radical scavenging activity of EO against the stable 1,1 diphenyl-1-picrylhydrazyl (DPPH) was evaluated according to the method described by (Lopes-Lutz et al., 2008). EO was dissolved in methanol and a series of different concentrations solutions were prepared ([0.02–1] mg/mL and [1–45] mg/mL). The reaction mixture contained 2.5 mL of diluted EO and 1 mL of the methanolic DPPH solution [0.3 mM] was shaken vigorously, incubated at room temperature in the dark for 30 min, and the absorbance was measured with a spectrophotometer at 517 nm. The obtained data were used to determine the concentration of the sample required to scavenge 50% of the DPPH free radicals (IC50). Ascorbic acid was used as the antioxidant standard and all measurements were done in triplicate. The values are expressed as the percentages of radical inhibition absorbance (% I) concerning the control value, as calculated by the following equation: where A0 is the absorbance of the negative control, and A1 is the absorbance of the tested compound.
2.4.2 Ferric ion reducing antioxidant power (FRAP) assay
The ferric reducing antioxidant power assay was conducted according to the method described by (Nabavi et al., 2009) with slight modifications. Briefly, 1 mL of various concentrations of the essential oils diluted in methanol ([0.05–5] mg/mL and [1–12] mg/mL) was added to 2.5 mL of phosphate buffer (200 mM, pH 6.6) and 2.5 mL of Potassium Ferricyanide [K3Fe(CN)6] of 1%. The mixture was incubated in a water bath at 50 °C for 20 min, thereafter 2.5 mL of 10% Trichloroacetic acid (CCl3COOH) was added to it to stop the reaction before it was centrifuged for 10 min at 3000 rpm. Then 2.5 mL of the supernatant was taken and mixed with 2.5 mL of distilled water and 0.5 mL of ferric chloride (FeCl3) of 0.1%. Finally, the absorbance was determined at 700 nm using a spectrophotometer. An increase in absorbance indicates a higher reducing power capacity of the essential oil. All the assays were carried out in triplicate and the data are presented as mean values ± standard deviations. The essential oil concentration providing 0.5 of absorbance (EC50) was calculated from the graph of the absorbance against essential oil concentration. Ascorbic acid was used as a standard.
2.5 Statistical analysis
Three replicates of each sample were used for statistical analysis, and the results are expressed as mean ± significant difference (±SD). One-way ANOVA and least significant difference (LSD) post hoc Tukeys honest significance test were used for comparing the antioxidant effects of different samples (p < 0.05). The data obtained were subjected to statistical analysis performed with SPSS Statistics 25 software. The Principal Components Analysis, the Hierarchical Clustering Analysis, the Heatmap (realized by ORIGINPRO 2020), was used to comprehend the similarity between the essential oils and different components.
3 Results and discussion
3.1 Essential oils yield
The EO yield of 8.6% and 11% was obtained from the C. atlantica wood tar collected respectively in the Itzer and Senoual forests, which is noticeably higher than that obtained from sawdust of C. atlantica from the same origin with a yield of 3.51% and 5.98% (Table 1). Several studies in the literature have investigated to analyze the cedar wood EO, in which the yields vary greatly depending on the forest source, and the part of the tree used. Indeed, the study reported by Fidah et al. (2016) showed an average yield of sawdust essential oil of 3.4%, which is in accordance with the result of our study. However, no information is available on the characterization of the essential oil obtained from C. atlantica wood tar, except a few studies reported by Nam et al. (2015) and Kılıç et al. (2017), that analyzed tar oil obtained by dry distillation of species of stumps. EO.Tar.IT = Essential oil from Tar (Itzer Forest); EO.Tar.SN = Essential oil from Tar (Senoual Forest); EO.Saw.IT = Essential oil from Sawdust (Itzer Forest); EO.Saw.SN = Essential oil from Sawdust (Senoual Forest).
Sites
Samples
Latitude
Longitude
Attitude
Climate
Yield (%)
Itzer Forest
EO.Tar.IT- EO.Saw.IT
32°52′51″North
5°03′5″South
1240 m
Humid
8.60–3.51
Senoual Forest
EO.Tar.SN - EO.Saw.SN
32°58′12″North
5°12′0″South
2195 m
Humid
11.0–5.98
The variation in essential oils yield could be attributed to various factors such as the geographical origin and the time of harvest. In fact, photochemistry is considerably affected by the number of hours of light and sunshine that influence the accumulation of some compounds over a specific period of time in response to environmental conditions (Houicher et al., 2018). In addition to these environmental factors, the mechanism of essential oil production, which occurs via secondary metabolism, undergoes variation according to the plant’s genetic constitution (da Silva de Souza et al., 2017). Indeed, the yield of EOs extracted from tars is higher than that of oils extracted from sawdust; this variation can be related to the influence of pyrolysis process parameters such as temperature, heating rate and particle size on the products yield (Crespo et al., 2017). Reactions involved during the pyrolysis process produces condensable vapors and gaseous products, further condensation of these vapors produces bio-oil (Tar). The study reported by Varma et al. (2019) revealed that with increasing reaction temperature (temperature range and/or heating rate), vapor formation increases, therefore, vapor condensation also increases, which result to high bio-oil yield.
3.2 Chemical composition of essential oils tested
Gas chromatography-mass spectrometry analysis of the EOs derived from wood tar and sawdust of C. atlantica revealed the identification of almost 71 compounds. These components respectively represent 95.52%, 94.20%, 89.52% and 95.75% of the total chromatographic peaks. They are mainly composed of sesquiterpenes (24%, 26%, 45.5%, and 42%) and the oxygenated hydrocarbons (24%, 26%, 13.63%, and 9.7%) (Fig. 1) with the predominance of the sesquiterpene hydrocarbon β-himachalene (24–44%) in the different essential oils studied. Table 2 depicts the identified compounds and their relative abundance as well as their Kovats Indices values. EO obtained from the cedar wood (sawdust) (Itzer and Senoual forests) present a good concentration of β-himachalene (27.67–44.23%), the other important compounds were α-himachalene (12.2–16.69%), trans-Cadina-1(6),4-diene (11.27–8.45%), 6-camphenol (4.54–3.16%), cedryl acetate (8.54–4.19%), 11α H-Himachal-4-en-1β-ol (9.42–1.32%). While samples coming from the cedar wood tar in the same forests mainly contain the β-himachalene (24.25–24.05%), α-himachalene (13.76–1.15%), trans-cadina-1(6), 4-diene (7.65–7.87%), 6-camphenol (7.44–8.76%), cis-sabinene hydrate (6.17–5.92%), and methyl-1, 4 cyclohexadiene (9.06–13.56%). A comparative study of the phytochemical profiling of the four essential oils shows a similarity between the different compounds obtained from the wood of C. atlantica. On the other hand, there is heterogeneity between the chemical compounds of these essential oils and those obtained after the thermal conversion of the wood. Sawdust EO from Senoual forest showed almost a two-time higher content of β-himachalene in comparison to other EOs. α-himachalene was lower in wood tar essential oil from Senoual forest followed by three other EOs. In fact, cedryl acetate, 11α H-Himachal-4-en-1β-ol was found only in two EO from sawdust. Cis-Sabinene hydrate was identified only in the essential oils of wood tar. These results were in agreement with previous reports on EOs obtained from Moroccan Cedar Wood (Chalchat et al., 1994; Aberchane et al., 2004; Uehara et al., 2017), which identified approximately forty compounds strongly dominated by α-himachalene (12.74%, 11.6%, 16.92%) and β-himachalene (33.45%, 33.8%, 43.18%). Several reports investigated the chemical composition of cedar wood EO in different countries, including Lebanon (Saab et al., 2005), France (Paoli et al., 2011), Morocco (Uehara et al., 2017), and Algeria (Boudarene et al., 2004), significant chemical variations have been observed in these studies. The chemical composition of the samples from Lebanon and France, in which himachalol and α-pinene have been found as major components, was quite different from those of Moroccan and Algerian sawdust essential oils containing mostly himachalene isomers. It has been reported that the chemical profile of essential oils might vary with the orientation of biosynthesis towards the preferential formation of specific products under the influence of the seasons, the phonologic stages of the plant, the composition of the soil, the time of collection and the geographical origin (Vasconcelos et al., 2020). This qualitative and quantitative variability can be attributed to the genetic properties of the plant, which regulate the biosynthesis of secondary metabolites in correlation with the genetic, epigenetic and genomic properties of the plant's genes or their surrounding regions. This chemical variability is also attributed to the organ used to extract the essential oil, as well as to the reactions involved in the thermal decomposition of the wood, in which important parameters such as reaction temperature, heating rate, and reaction pressure have a significant influence on the compositions of pyrolysis products. (Urbizu-González et al., 2017; Efika et al., 2018; Elhidar et al., 2019; Magris et al., 2019; Rezgui et al., 2020). The study reported by (Chen et al., 2021) revealed that changes in the composition of wood tar in response to increased temperature of the pyrolysis process promoted diversity of some chemical compounds. - Rt: Retention time. - KILit: Kovats retention index on HP-5MS column in reference to n-alkanes. - KIExp: Experimental Kovats retention index. - Relative abundance (%): The percentage composition of EOs computed from GC peak areas without correction factors. - The identification of EO components was established depending upon mass spectral data of compounds (MS), and Kovats indices (KI) with those of Wiley spectral library collection and NIST library databases (-) = Not detected. - EO.Tar.IT = Essential oil from Tar (Itzer Forest), EO.Tar.SN = Essential oil from Tar (Senoual Forest), EO.Saw.IT = Essential oil from Sawdust (Itzer Forest), EO.Saw.SN = Essential oil from Sawdust (Senoual Forest).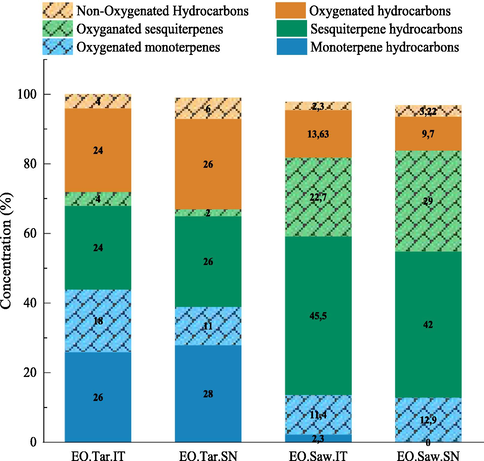
Percentage of various classes of the chemical compounds of EOs.
No
Compounds
Rt
KIExp
KILit
Rel. abundance (%)
EO.Tar.IT
EO.Tar.SN
EO.Saw.IT
EO.Saw.SN
Monoterpene hydrocarbons
1
α- Thujene
15.097
937
930
2.01
0.90
–
–
2
α-Pinene
16.406
964
939
3.73
0.10
–
–
3
Thuja-2,4(10)-diene
17.203
981
960
0.09
0.06
0.07
–
4
Sabinene
17.862
995
970
0.88
1.32
–
–
5
β-Pinene
18.039
998
973
2.42
2.80
–
–
6
δ-2-Carene
19.269
1025
1000
0.13
2.52
–
–
7
α-Phellandrene
19.515
1031
1002
0.83
0.79
–
–
8
Limonene
19.515
1047
1029
0.07
0.42
–
–
9
(Z)-β-Ocimene
20.542
1053
1037
0.02
0.08
–
–
10
γ-Terpinene
20.258
1047
1049
0.07
0.07
–
–
11
Cis-Sabinene hydrate
22.217
1090
1070
6.17
5.92
–
–
12
Longicyclene
34.305
1396
1374
–
–
0.49
0.15
Oxygenated Monoterpenes
13
6- Camphenol
24.075
1134
1113
7.44
8.76
3.16
4.54
14
α-campholenal
24.622
1148
1126
0.01
–
–
–
15
1- Terpineol
24.904
1154
1133
0.05
0.34
0.55
0.53
16
Trans-dihydro-β-Terpineol
25.139
1160
1138
0.02
–
–
–
17
δ-Terpineol
26.294
1187
1166
0.06
0.08
0.39
0.17
18
Pinocampheol
26.451
1192
1170
0.2
–
–
–
19
Terpinene-4-ol
26,610
1196
1177
2.19
0.16
0.06
–
20
Trans-Sabinene hydrate acetate
30.099
1283
1256
0.06
0.68
–
–
21
Iso-3-thujanol acetate
30.358
1290
1270
–
–
–
0.12
22
Neo-iso-3-Thujanol acetate
30.890
1303
1283
0.05
–
–
–
Sesquiterpene hydrocarbons
23
δ-Elemene
33.146
1364
1338
–
–
0.06
–
24
Longicyclene
34.305
1396
1374
–
–
0.49
0.15
25
β-Elemene
35.044
1417
1390
0.09
0.11
1.84
0.94
26
β-Longipinene
35.340
1425
1400
0.04
0.11
0.41
0.54
27
α-Cedrene
35.567
1432
1411
0.03
–
–
–
28
β-Cedrene
35.839
1440
1420
0.02
0.08
0.48
0.55
29
β-Copaene
36.286
1452
1432
0.07
0.06
1.2
0.49
30
α-Himachalene
36.919
1471
1451
13.76
1.15
12.2
16.69
31
Allo-aromadendrene
37.297
1481
1460
–
–
0.49
–
32
Cis-Cadina-1 (6),4-diene
37.571
1489
1463
–
0.02
0.33
0.26
33
Trans-Cadina-1 (6), 4 diene
37.838
1497
1476
7.65
7.37
8.45
11.27
34
γ-Himachalene
38.205
1508
1482
–
–
0.34
–
35
β-Himachalene
38.605
1520
1500
24.05
24.25
27.67
44.23
36
Germacrene A
39.048
1534
1509
0.03
0.14
1.28
2.82
37
α-dehydro-ar-Himachalene
39.120
1536
1517
0.13
0.03
–
–
38
γ-Cadinene
39.153
1538
1513
–
–
3.73
–
39
δ-Cadinene
39.412
1546
1523
0.04
0.11
2.78
1.78
40
γ-dehydro-ar-Himachalene
39.641
1553
1532
0.04
0.09
0.51
0.68
41
α-Cadinene
40.014
1564
1538
–
–
0.6
0.24
42
Germacrene B
40.665
1585
1561
–
–
0.18
–
Oxygenated sesquiterpenes
43
(Z)-β-Damascenone
33.852
1384
1364
0.05
0.05
0.19
–
44
(E)-β-Damascenone
34.635
1405
1384
–
–
0.15
0.24
45
Cedranoxide,8,4
40.089
1567
1542
–
–
0.21
–
46
Cis-cadinene ether
40.373
1575
1553
–
–
0.23
0.22
47
α-cedrene epoxide
40.937
1593
1575
–
–
0.41
0.38
48
Allo-Cedrol
41.504
1611
1589
–
–
0.26
–
49
Cedrol
41.952
1625
1600
–
–
0.93
0.28
50
β-himachalene oxide
42.213
1634
1616
–
–
1.93
1.23
51
-cedrene epoxide
42.630
1647
1622
–
–
3.72
1.01
52
1.7-di-epi-α-cedrenal
43.112
1662
1641
–
–
0.57
–
53
Dihydro-eudesmol
43.912
1688
1662
–
–
1.71
1.5
54
Elemol acetate
44.407
1703
1680
0.22
–
1.22
0.54
55
8- Cedren-13-ol
44.654
1713
1689
–
–
–
2.39
56
(Z)-γ-Atlantone
44.724
1715
1694
0.05
0.09
–
–
57
11αH-Himachal-4-en-1β-ol
44.817
1718
1699
–
–
9.42
1.31
58
Cedrenol acetate
46.210
1763
1742
–
–
0.48
0.38
Non-oxygenated hydrocarbons
59
3-methylene cyclohexane
5.165
802
789
0.25
0.61
–
–
60
4-Octene (E)
7.230
827
802
–
0.08
–
–
61
Methyl-1,4 cyclohexadiene
7.392
829
806
9.06
13.56
0.27
0.12
62
2-Octene (E)
8.247
839
821
–
0.26
–
–
63
Cyclohexene, 3,3,5-trimethyl
8.594
843
831
3.34
5.48
–
–
Oxygenated Hydrocarbons
64
2-hexanol
6.241
815
797
0.60
0.99
–
–
65
(Z)-3-hexenal
6.636
820
798
0.27
0.51
–
–
66
Hexanal
6.873
823
801
1.89
2.83
0.06
–
67
3-hexen-1-ol,(E)
10.119
861
853
1.51
4.29
–
–
68
(2E)-hexen-1-ol
11.549
879
862
0.76
1.46
–
–
69
2-hexen-1-ol,(Z)
11.946
883
867
3.69
5.29
–
–
70
hexen-2-one, 5-methyl- (3Z)
12.945
895
876
0.68
0.10
–
–
71
4-hexen-1-ol, (4Z)
13.050
896
877
0.52
0.02
–
–
72
4-heptanol
13.612
906
889
0.18
0.06
–
–
Number of identified compounds
47
44
37
30
Total % of identified compounds
95.52
94.20
89.52
95.75
3.3 Heatmap for the major components corresponding to different sawdust and tar essential oils extracted.
All major components of tar and sawdust essential oils from the two locations demonstrated variations in the identifying compounds in each essential oil using the heatmap with dendrogram, which is summarized in Fig. 2. The accentuated element is represented by a light orange color in the profile of the heatmap. Accordingly, β-himachelene, α-himachelene, and trans-cadina-1(6),4-diene peaked at the sawdust EO from Senoual. Furthermore, cedryl acetate and 11αH-himachal-4-en-1β-ol reached its highest percentage at the sawdust EO from Itzer. Methyl-1,4-cyclohexadiene, 6-camphenol, and cis-sabinene hydrate peaked at the tar EO from Senoual forest.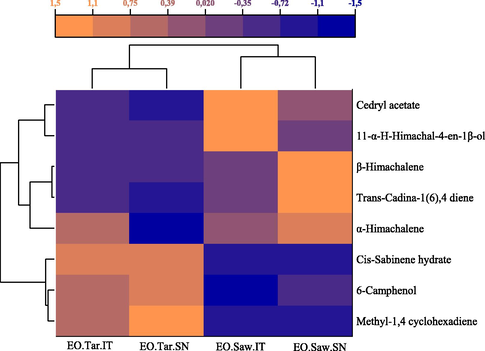
Heatmap analysis for the major EOs components.
3.4 Principal components analysis (PCA) and hierarchical clustering analysis (HCA) for the major components of the four essential oils
PCA and HCA were applied as statistical tools to reveal the chemical variability and the interrelationships between the essential oils (Kalleli et al., 2019). PCA analysis showed the correlation between the compositions of all four-cedar wood EOs studied. The first, second, and third principal components (PC1, PC2, and PC3) explained 71.3%, 22.6%, and 6.1% of the total variance, respectively (Fig. 3b), thus representing 100% of the cumulative variance. The three-dimensional axial system generated by the PCA of the essential oils showed that there are two main groups. Thus α-himachalene, β-himachalene, trans-cadina-1 (6),4-diene, 11αH-himachalene-4-en-1β-ol and cedryl acetate were the principal components that contributed to the clustering of the samples obtained from sawdust EOs. 6-camphenol, cis-sabinene hydrate, and methyl-1,4-cyclohexadiene were the primary components that contributed to the clustering of the samples obtained from tar EOs. The most important difference in the chemical composition of essential oils were found after the thermal decomposition of the wood. This is not surprising because the proportions and composition of the four major pyrolysis products (coal, oils, tars, and gases) vary according to the reaction conditions. Some parameters modify notably, the proportion and the composition of the pyrolysis process of wood, such as the nature of the wood (species), the moisture content of the wood, the size of the species of wood, the heating rate, and the final reaction temperature (Efika et al., 2018; Varma et al., 2019).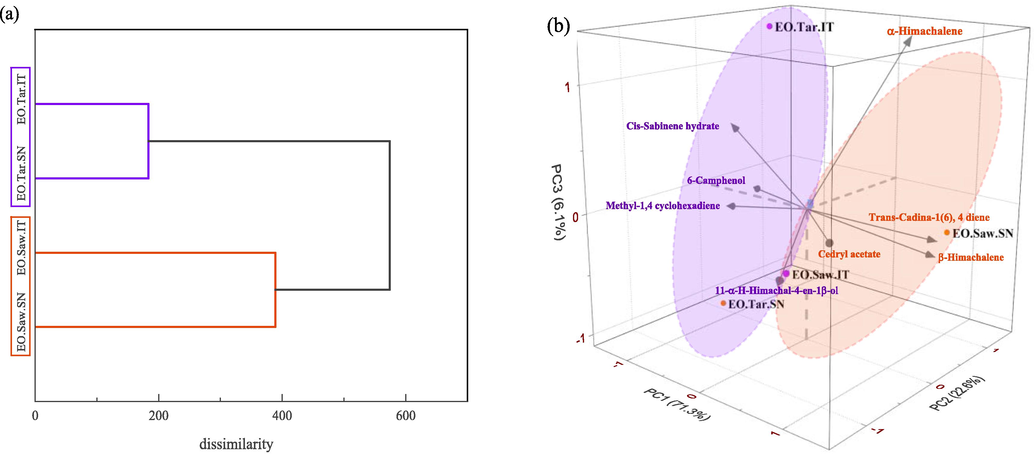
Multivariate analysis for essential oils: (a) HCA dendrogram; (b) PCA score plot across dimensions of the first three principal components.
The results obtained by PCA are confirmed by the application of HCA as an unsupervised form recognition method. The dendrogram obtained by HCA, using the group average algorithm (Square Euclidean distance) displayed in Fig. 3a, allowed classifying the studied populations into two main clusters. The first group includes the two EOs from cedar tars, while the populations of cedar sawdust represent the second group.
3.5 The antioxidant capacity
The stable DPPH radical scavenging model is a widely used method for measuring the free radical scavenging property of various samples (Li et al., 2020). The essay is considered when the purple-colored free radical DPPH is reduced to a stable yellow colored diamagnetic molecule due to a reaction with the hydrogen-donating scavenger (Arika et al., 2019). Antioxidant activities are given in Table 3. In all four experiments, with increases in concentration of EO, the scavenging of free radicals of these compounds increased. From the inhibition rate curves, we have graphically deduced the IC50 values of EOs shown in Table 4. The capacity of EO from wood tar (IC50 (EO.Tar.IT) = 0.126 mg/mL, IC50 (EO.Tar.SN) = 0.143 mg/mL) was stronger than that from sawdust (IC50 (EO.Saw.IT) = 16.264 mg/mL, IC50 (EO.Saw.SN) = 15.559 mg/mL). However, the IC50 value for ascorbic acid (standard antioxidant) was 0.084 mg/mL. EO: Essential oil. Data are expressed as the mean of triplicate ± SD (standard deviation).
Essential oil
Scavenging activity
DPPH assay (inhibition efficiency)
FRAP assay (absorbance)
Conc.(mg/mL)
Inhibition efficiency (%)
Conc.(mg/mL)
Absorbance
EO.Tar.IT
0.02
20.03 ± 2.2269
0.05
0.164 ± 0.0035
0.06
34.25 ± 0.8484
0.10
0.177 ± 0.0025
0.10
41.78 ± 2.7572
0.50
0.262 ± 0.0045
0.40
88.81 ± 0.1607
1.00
0.628 ± 0.0085
0.60
90.40 ± 0.4772
3.00
0.840 ± 0.0310
1.00
90.72 ± 0.3711
5.00
1.216 ± 0.0025
EO.Tar.SN
0.02
08.44 ± 1.8134
0.05
0.209 ± 0.0020
0.06
14.50 ± 1.1399
0.10
0.278 ± 0.0050
0.10
31.81 ± 2.3834
0.50
0.582 ± 0.0060
0.40
84.19 ± 0.0518
1.00
1.022 ± 0.0030
0.60
84.50 ± 0.2590
3.00
1.643 ± 0.0105
1.00
86.37 ± 0.0518
5.00
1.990 ± 0.0200
EO.Saw.IT
5.0
12.58 ± 4.2628
1.00
0.322 ± 0.0021
9.0
22.91 ± 0.2508
3.00
0.607 ± 0.0049
15
45.13 ± 0.4012
5.00
0.806 ± 0.0042
20
54.11 ± 1.5547
8.00
1.150 ± 0.0070
30
76.52 ± 0.6018
10.00
1.168 ± 0.0035
45
82.99 ± 0.9529
12.00
1.270 ± 0.0198
EO.Saw.SN
5.0
17.10 ± 1.0532
1.00
0.318 ± 0.0025
9.0
28.13 ± 0.8526
3.00
0.644 ± 0.0220
15
48.74 ± 1.6049
5.00
0.696 ± 0.0045
20
55.21 ± 0.3510
8.00
0.701 ± 0.0005
30
59.73 ± 0.5517
10.00
0.793 ± 0.0015
45
70.87 ± 2.0561
12.00
0.826 ± 0.0035
Ascorbic acid
0.006
24.52 ± 0.0170
0.05
1.204 ± 0.0030
0.040
85.44 ± 0.0020
0.10
1.764 ± 0.0065
0.080
87.67 ± 0.0015
0.50
1.961 ± 0.0045
0.200
91.82 ± 0.0010
1.00
2.141 ± 0.0021
0.400
91.92 ± 0.0010
3.00
2.183 ± 0.0021
0.600
92.03 ± 0.0010
5.00
2.198 ± 0.0085
Samples
DPPH (IC50; mg/mL)
FRAP (EC50; mg/mL)
Wood Tar EO, Itzer Forest
0.126 ± 0.013
0.832 ± 0.002
Wood Tar EO, Senoual Forest
Sawdust EO, Itzer Forest
0.143 ± 0.014
15.559 ± 0.7150.410 ± 0.002
2.219 ± 0.001
Sawdust EO, Senoual Forest
16.264 ± 0.285
1.996 ± 0.013
Ascorbic acid
0.084 ± 0.063
0.007 ± 0.003
In the Ferric ion Reducing Antioxidant Power (FRAP) assay the antioxidant is able to give an electron to the free radicals, which produces the neutralization of the radical. The reducing capacity of the EO was assessed when Fe3+ is converted to Fe2+. In this experiment, the intensity of Perl’s Prussian blue color was measured at 700 nm, and the higher increase in Prussian blue color intensity revealed a strong antioxidant activity (Ashraf et al., 2020). It was found that the reducing power of the EO increased with increasing concentration (Table 3). EO isolated from wood tar had the highest reducing activity (Lower EC50) (EC50 (EO.Tar.SN) = 0.410 mg/mL; EC50 (EO.Tar.IT) = 0.830 mg/mL), followed by those from sawdust (EC50 (EO.Saw.SN) = 1.99 mg/mL; EC50 (EO.Saw.IT) = 2.219 mg/mL). Ascorbic acid was used as standard (EC50 (Ascorbic acid) = 0.007 mg/mL). This result was also confirmed by the result of the DPPH assay.
To our knowledge, antioxidant activity of C. atlantica EO from tar and sawdust has not been reported previously. However, some researchers have already studied the antioxidant capacity of extracts, EOs and wood tar from aerial parts of C. atlantica Manetti. Belkacem et al. (2021) and Fadel et al. (2016), reported that EO and organic extract of aerial parts of C. atlantica growing in Algeria possess good ferric ion reducing power (EC50 = 0.325 mg/mL), and DPPH radical scavenging activity (IC50 = 0.0013 mg/mL). These values are significantly lower than the IC50 value (15.559 mg/mL) observed in this study, and slightly lower than that reported by Naimi et al. (2015), which investigated the antioxidant activity of the flavonoid extract of C. atlantica with an IC50 value of 0.400 mg/mL. The antioxidant activity of C. atlantica wood tar EO still not evaluated in previous studies, however, a study reported by Skanderi and Chouitah (2020) investigated the antioxidant activity of Atlas cedar tar growing in Algeria, and reported an EC50 value of 0.075 mg/mL.
The observed antioxidant properties in this study could be mainly attributed to phenolic compounds, which enhance the rate of hydrogen transfer to free radicals and the inhibitory strength detected in essential oils (Rezgui et al., 2020). The high antioxidant activity in the tars EOs could be related to the presence of methyl-1, 4-cyclohexadiene of which, the C-H reaction mechanism can be described in part as a process where the C-H hydrogen is transported as a proton to the radical DPPH with its accompanying electron from the π-electron diene system (Foti et al., 2008). The oxygenated monoterpene (6-camphenol) and the monoterpene (cis-sabinene-hydrate) could also be taken into account for the antioxidant activity of EO from wood tar. Studies have recently shown that monoterpenes constitute a large group of antioxidant molecules due to their functional groups (alcohols), and to the conjugated double bonds of the terpene structure. The minor components may also contribute to the activity of EO individually and/or synergistically (Karolina et al., 2019; Zielinska-baljet and Joanna, 2020).
In order to better understand the correlation between the IC50/EC50 and chemical composition of EOs obtained, PCA analysis was carried out using a correlation matrix of all of the major phytochemical compounds and presented in Fig. 4. The two principal components (PC1 and PC2) explaining 93.9% of the total data variance. The points with greater IC50 values (poor antioxidant activity) were observed on the right side of Fig. 4 and associated with α-himachalene, β-himachalene, trans-cadina-1 (6),4-diene, 11αH-himachalene-4-en-1β-ol and cedryl acetate, it can be seen that the antioxidant capacity and these components showed significantly positive correlations with PC1. Points with lower IC50 values (strong antioxidant activity) were observed on the left side of Fig. 4, and were associated with 6-camphenol, cis-sabinene hydrate, and methyl-1,4-cyclohexadiene, and showed significantly negative correlation with PC1.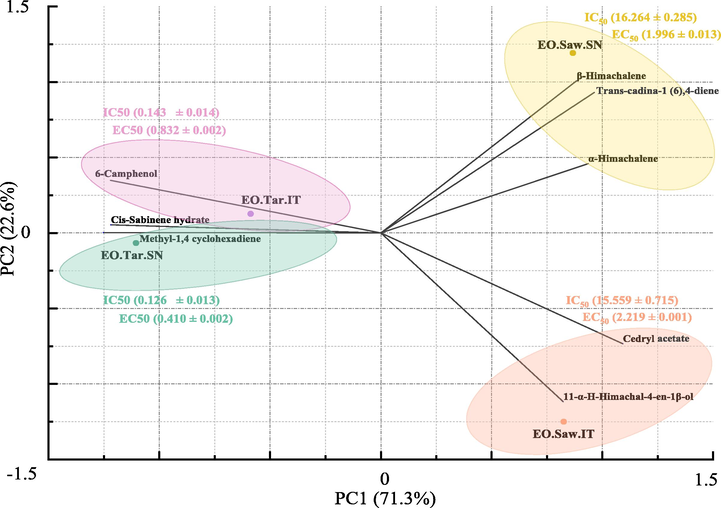
Biplot of first and second principal components from PCA of C. atlantica EOs components in association with the IC50 values.
4 Conclusion
The study on composition and antioxidant activity of the wood essential oils from C. atlantica from two geographical regions before and after the pyrolysis process are reported for the first time. The phytochemical profiling of EO showed that the bicyclic sesquiterpene hydrocarbons (α-himachalene and β-himachalene) represent the major class of EO components. The results of this study showed that there was a significant variation in the constituents between the essential oil from sawdust and those from tar. Based on the data obtained from the different in vitro tests, the essential oils have been found to possess good antioxidant activity; the two EO of wood tar from the same species in different geographical regions exhibited pronounced antioxidant activity. This activity was significantly affected by the thermal transformation process of the wood and the adaptation of the tree to abiotic factors. A further research should be carried out to establish the in vivo efficacy of these compounds in the field of human health and phytopathology.
Acknowledgments
We would like to thank the members of the forest research center of Morocco, the Laboratory of Organic Chemistry, Catalysis and Environment, and all the volunteers for their participation in this work.
Declaration of Competing Interest
The authors declare that they have no known competing financial interests or personal relationships that could have appeared to influence the work reported in this paper.


