

Translate this page into:
Degradation of chemical warfare agents by nickel doped titanium dioxide powders: Enhanced surface activity
⁎Corresponding authors at: State Key Laboratory of NBC Protection for Civilian, Beijing, 102205, P. R. China. The State Key Laboratory of Refractories and Metallurgy, the Institute of Advanced Materials and Nanotechnology, College of Materials and Metallurgy, Wuhan University of Science and Technology, Wuhan, Hubei, 430081, China mjsun@wust.edu.cn (Ming-Jun Su), tracypiscescy@163.com (Yan Cui)
-
Received: ,
Accepted: ,
This article was originally published by Elsevier and was migrated to Scientific Scholar after the change of Publisher.
Abstract
Here, Nickel doped anatase TiO2 samples were prepared and characterized by X-ray diffraction, transmission electron microscope, X-ray photoelectron spectroscopy, specific surface area (BET), porosity determination (BJH) and CO2-TPD experiments. DFT calculation was conducted to investigate the oxygen vacancy formation energies and hydroxyl groups activity. The as-prepared Ni2+ doped TiO2 samples were used for heterogeneous degradation of chemical warfare agents (CWAs) and a high degradation rate, 92.2% and > 99.5% for sulfur mustard (HD) within 1 h and 12 h, > 99.5% for soman (GD) in less than 30 min, and > 99.5% for VX in less than 5 min was achieved, which were significantly enhanced compared with commercial P25 and anatase TiO2 nanoparticles under identical conditions. The formation of non-toxic hydrolysis products confirmed the nucleophilic hydrolysis pathway via surface reaction. Integration of experimental and computational methods could well illustrate that surface structure changes of TiO2 after Ni2+ doping was the main reason for the superior stoichiometric activity towards CWAs.
Keywords
Anatase titania
Nickel
Heterogeneous reaction
Chemical warfare agents degradation
Surface hydroxyl groups

1 Introduction
Due to the risk of residual stockpiles of chemical weapons and the increasing possible threats of chemical attack from terrorist organization, decontamination of chemical warfare agents (CWAs) has always been an important research subject in public safety as well as in national defense areas (Jang et al., 2015; Szinicz, 2005; Stone, 2018). Among various types of decontamination agents, solid sorbents, as a class of non-aggressive reagents, have great potential for disposing of contaminated sensitive materials and electron devices (Stengl et al., 2016; Jung et al., 2020; Hou et al., 2019). Earlier study of sorbents (e.g., bleaching powder (Qi et al., 2012), modified clay (Placha et al., 2014) and activated carbon (Osovsky et al., 2014) mostly concentrated on removing the CWAs via physical adsorption which was not able to detoxify the agents effectively. Then further researches aimed at reactive sorbents to achieve chemical decomposition via surface reaction, which is very essential to meet the sustained demands of sensitive equipment decontamination (Talmage et al., 2007; Capoun and Krykorkova, 2019).
Nanocrystalline metal oxides, such as Al2O3 (Wagner et al., 2001), MnO2 (Štengl et al., 2012b), CeO2 (Janos et al., 2016), TiO2 (Štengl et al., 2005) and their nanocomposites (Chen et al., 2015; Štengl et al., 2011b), are the most extensively studied solid decontamination agents (Denet et al., 2020). They can adsorb CWAs rapidly and make the catalytic degradation by hydrolysis, elimination or oxidation reaction with chemical functionalities (e.g., hydroxyl groups, defects, acid/base sites) (Tang et al., 2008; Thompson et al., 2004). Nanocrystalline TiO2 was extensively reported as photocatalytic or stoichiometric materials toward CWAs (Komano et al., 2013; Ramacharyulu et al., 2012). Motivated by the application prospect, a great deal of effort was performed to enhance its catalytic properties based on the preparation and structure control of nanocrystalline TiO2. Transition metal ion-doping is a commonly method to add or change certain properties of TiO2 such as decreasing the band gap and extending the absorption into the visible region, which is commonly believed to improve the photocatalytic activity for CWAs degradation (Sengele et al., 2016; Giannakoudakis et al., 2018; Henych et al., 2019). Actually, on the other hand, metal ion-doping of nanocrystalline metal oxide is also regarded as a common strategy for the improvement of comprehensive stoichiometric performance toward H-, G-, V- types of CWAs under ambient condition. Therefore, several foreign atoms (e.g., Zr, Ge, In, Mn) doped anatase TiO2 were prepared for more efficient and faster stoichiometric degradation of CWAs against pristine TiO2 (Štengl et al., 2012a, 2008, 2011c). The structural change, such as increased surface area, change in defects of crystal lattice, is part of the reasons for the enhancement of activity (Prasad et al., 2009; Štengl et al., 2011a). However, the broad-spectrum and high-effect degradation towards three types of CWAs (HD, VX and GD) achieved by nanocrystalline TiO2 is concerned with many factors. As surface reaction is the main mechanism of TiO2 for the degradation of CWAs, the more efficient surface activation caused by the regulation of the surface charge distribution is also likely to be responsible for the enhancement of reactivity. It is important to investigate the variation of oxygen vacancy formation energies and hydroxyl group activity to reveal the effect of foreign atoms doping. Up to now, the research on reaction mechanism of CWAs degradation involving the surface structure change of metal-doped TiO2 is not enough.
In this work, nickel (Ni2+) was used as dopant due to its similar ionic radius (0.069 nm) to Ti4+ (0.0605 nm) in the crystal lattice of TiO2 nanoparticles (Kaur et al., 2018; Unal et al., 2020). Previous study showed that modification of titania catalysts by Ni could positively influence the crystallite size, oxygen vacancy or surface active sites (e.g., hydroxyl groups), which made Ni-doped TiO2 catalyst widely used in photocatalytic water splitting and organic pollutants degradation (Kumar et al., 2017; Dong et al., 2018; Hou et al., 2007; Kumar et al., 2015). There is scarce study on the stoichiometric application of Ni-doped TiO2 towards CWAs. Herein, we develop a modified one-pot method based on homogeneous hydrolysis of titanium oxo-sulfate and nickel nitrate to prepare Ni-doped anatase TiO2. The degradation performance of the Ni-doped TiO2 towards HD was significantly enhanced compared with commercial titanium(Ⅳ) oxide (P25) and anatase TiO2 nanoparticles under identical conditions. Meanwhile, GD or VX could be completely degraded rapidly within 30 min or 5 min by as-prepared TiO2 samples. The formation of non-toxic hydrolysis products during the decomposition of HD, GD and VX directly confirmed the hydrolysis reaction pathway. Experimental and theoretical evidences indicate that the superior stoichiometric activity is attributed to the surface structure changes after Ni2+ doping.
2 Experiment section
2.1 Preparation of samples
HD (sulfur mustard, bis(2-chloroethyl) sulphide), purity 98.5%, GD (soman; 1,2,2-trimethylpropyl methylphosphonofluoridate), purity 98.3% and VX (O-ethyl S-[2-(diisopropylamino) ethyl] methyl phosphonothioate), purity 95.4%, were obtained from an approved laboratory of Research Institute of Chemical Defense. Titanium(Ⅳ) oxide (P25, 20 nm) and TiOSO4 (AR) was purchased from Shanghai Macklin Biochemical Co., Ltd. Acetonitrile (HPLC) was purchased from Sigma-Aldrich. Ni (NO3)2·6H2O (AR) was purchased from Xilong Chemical Co., Ltd. H2SO4 (98%, AR), ethanol (AR) and urea (AR) were purchased from Beijing Chemical Works. All chemical reagents were used without further purification.
Nickel doped anatase TiO2 and undoped TiO2 nanoparticles were prepared by a homogeneous precipitation method using urea as a precipitate agent. 16 g of TiOSO4 was dissolved in 500 mL distilled water, then 1.3 mL H2SO4 (98%) was added to the above solution drop by drop with stirring. Different amounts of Ni (NO3)2·6H2O (0, 1.45, 1.93, 3.87 g) and 50 g urea were added. The mixture was heated to 98 °C with vigorous stirring and maintained at this temperature for 8 h. The products were filtered, washed with distilled water and ethanol, dried for 8 h in an oven under 150 °C and calcined in a muffle furnace under 300 °C. By this method, one undoped and three doped samples were prepared and denoted as TN0, TN1, TN2 and TN3 respectively.
2.2 Characterization
Powder X-ray diffraction (XRD) was carried out with Bruker D8 focus powder diffractometer with Cu Kα X-ray radiation. Morphology and structure were characterized by transmission electron microscope (TEM, HT7700 and JEM-2100F). X-ray photoelectron spectroscopy (XPS) was recorded on Thermo-Fisher Scientific ESCALAB 250Xi X-ray photoelectron spectrometer. Low-pressure gas sorption measurements were performed by using Quantachrome Instruments Autosorb-iQ (Boynton Beach, Florida USA) with the extra-high pure gases. The Brunauer-Emmett-Teller (BET) method was used for surface area calculation the pore size distribution was determined by the Barrett-Joyner-Halenda (BJH) method. GC/MS was performed on Agilent 7890A GC & Agilent 5975C MSD. Temperature programmed carbon dioxide desorption (CO2-TPD) experiments were performed on a Micromeritics Auto Chem II 2920 instrument (Micromeritics Co., USA) with thermal conductivity detector. The EPR spectra were obtained on a Bruker ESP-300E spectrometer at 9.75 GHz, X-band with 100 Hz field modulation.
2.3 Method of CWAs degradation test
Caution! Experiments should be performed by trained personnel using appropriate safety procedures.
2.3.1 Degradation activity test
The degradation activities of the samples to CWAs (HD, VX and GD) in different reaction times were tested. 5 μL of certain kind of chemical warfare agent was uniformly distributed in the bottom of a conical flask, and 250 mg of certain TiO2 sample was added on the CWAs drops. The flask was sealed with a cap and placed into the thermostat of 25 °C, and each run was repeated three times. At the end of the reaction, 5 mL of acetonitrile was added to the flask and vibrated on a vortex mixer for 30 s to extract the residual agent. The extracts were analyzed with gas chromatography with a detection limit of 1.8 × 10⁻¹¹ g/s.
The degradation rate of CWAs was calculated by the following equation:
Where C0 and C were the amount of CWAs before and after reacting with as-prepared samples for a certain time, respectively.
2.3.2 Determination of degradation products
The same method as Section 2.3.1 was adopted to obtain the extract of reaction mixture which was then derivatized using N,O-bis(trimethylsilyl) trifluoroacetamide (BSTFA) and filtrated by ultrafiltrate membrane, and the treated solution was used for GC/MS analysis, thus giving the evidences of the degradation products. Agilent 7890A GC equipped with Agilent DB-5MS column (the flow rate of carrier gas was 15 mL min−1 and oven temperature were programmed as follows: isothermal at 40 °C for 1 min, from 40 to 280 °C at 10 °C min−1 and isothermal at 280 °C for 5 min) and Agilent 5975C MSD (solvent delay time is 3.5 min for solution sample and 0.1 min for gas sample) were used for a wide range (33–550 m/z) of degradation products analysis.
2.3.3 Degradation kinetics test
According to the test methods of Section 2.3.1, the degradation rate of the samples to HD and GD in different reaction times were tested to obtain the kinetic curves. The kinetic data of CWAs degradation were analyzed according to equation (Štengl et al., 2011b, 2012a, 2011a): where qt represents residual amount of the toxic agent in a time t, q1 and q2 are the function of more and less active parts of the surface nano-material, respectively, k1 and k2 are rate constants of corresponding stages, q∞ is the residual amount of CWAs at the end of the reaction, if the degradation capacity of the powdery samples was not sufficient to degrade CWAs completely
2.3.4 Stability test
The first cycle of the stability test method was same as Section 2.3.1. The second cycle of test was almost the same with the first one except that the TiO2 sample was the one after first cycle of reaction, and the third cycle adopted the TiO2 sample after the second cycle of reaction, and so on. The reaction time of each cycle is 1 h, 30 min and 5 min for HD, GD and VX, respectively.
2.4 DFT calculation
The full geometry optimization and the relevant properties were performed by using density functional theory (DFT) and the projector augmented wave (PAW) (Kresse and Furthmüller, 1996) method implemented in the Vienna ab initio simulation package (VASP) (Kresse and Furthmüller, 1996). The generalized gradient approximation (GGA) with Perdew-Burke-Ernzerhof (PBE) functional was adopted to calculate the exchange-correlation energy (Perdew et al., 1996). The ion-electron interactions are treated by the projector augmented wave technique with a kinetic cutoff energy of 500 eV. A Monkhorst pack mesh of k-points (7 × 7 × 13) was used for sampling the 3D Brillouin zone during the structural optimization of bulk materials, and the k-points (10 × 3 × 1) was used for the optimization of 2D slab structures. The whole configuration is allowed to relax until the maximum force is smaller than 0.02 eV Å−1 (Chadi, 1977). The Van der Waals interaction was included in all the calculations. For the slab, a large vacuum region of 15 Å was used between two neighbor slabs to keep the negligible interactions between periodic slabs. The molecular structures and charge density graphics were generated by the VESTA software (Momma and Izumi, 2011).
3 Result and discussion
3.1 Preparation and characterization
Four samples labeled as TN0, TN1, TN2 and TN3 were prepared using the modified one-pot method (See synthetic details in Section 2). The as-prepared samples were elaborately characterized by a combination of XRD, TEM, XPS, N2 sorption and CO2-TPD, etc. XRD patterns of the obtained samples were shown in Fig. 1a. The characteristic diffraction peaks of the four samples in XRD analysis were well consistent with the standard pattern of anatase TiO2 (JCPDS card No. 65-5714), which could be ascribed to the (1 0 1), (0 0 4), (2 0 0), (1 0 5), (2 1 1), (2 0 4), (1 1 6), (2 2 0) and (2 1 5) facet, respectively. Obviously, the doping of Ni2+ has little effect on the crystal structure. Meanwhile, there was no significant difference in the lattice size calculated by the Scherrer equation between doped and undoped samples (Table 1). As the ionic radius of Ni2+ (0.069 nm) is similar to Ti4+ (0.0605 nm), Ni2+ is likely to substitute Ti4+ of TiO2 surface. Elemental composition of the as-synthesized samples was further analyzed by XPS. The XPS survey spectrum of TN1 ∼ TN3 with apparent characteristic peaks of O 1 s, Ti 2p and Ni 2p confirmed the coexistence of O, Ti and Ni elements in the synthesized sample (Fig. 1b). Meanwhile, according to the curve fitting results, the peak at 531.8 eV in O 1 s XPS spectrum indicated the existence of surface chemisorbed oxygen species, which could be assigned to hydroxyl group binding to the Ti or Ni site (Fig. S1). The Ni2+ doping amounts increased gradually from TN1 to TN3 according to the element content analysis (Table 1), which was in line with the preparation process.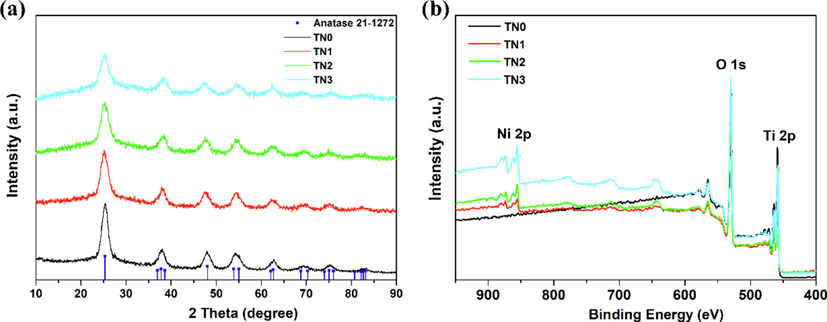
(a) XRD patterns and (b) XPS survey spectrum of as-prepared undoped and Ni2+ doped anatase TiO2 samples.
Sample
Mol ratio of reactantsa
EDS Ni (wt.%)
Specific surface areab (m2g−1)
Pore volumec (cm3g−1)
Pore Diameterc(nm)
Crystallite sized (nm)
TN0
–
0
242
0.347
5.06
4.51
TN1
20: 1
2.83
263
0.349
4.74
4.33
TN2
15: 1
3.02
269
0.337
4.45
4.39
TN3
7.5: 1
4.14
297
0.313
3.72
4.12
The morphology of the synthesized samples were investigated by TEM and HTEM measurements. Energy-dispersive X-ray (EDX) analysis of Ni doped TiO2 indicated the presence of Ti, O and Ni elements, which was highly consistent with XPS results (Fig. 2 & Fig. S2). As shown in Fig. 2c, enlarged TEM image showed the lattice spacing of ∼ 3.5 Å corresponding to the (1 0 1) plane of anatase, in good agreement with the XRD analysis. The TEM images of TN2 confirmed the unchanged crystal structure after Ni2+ doping (Fig. 2f).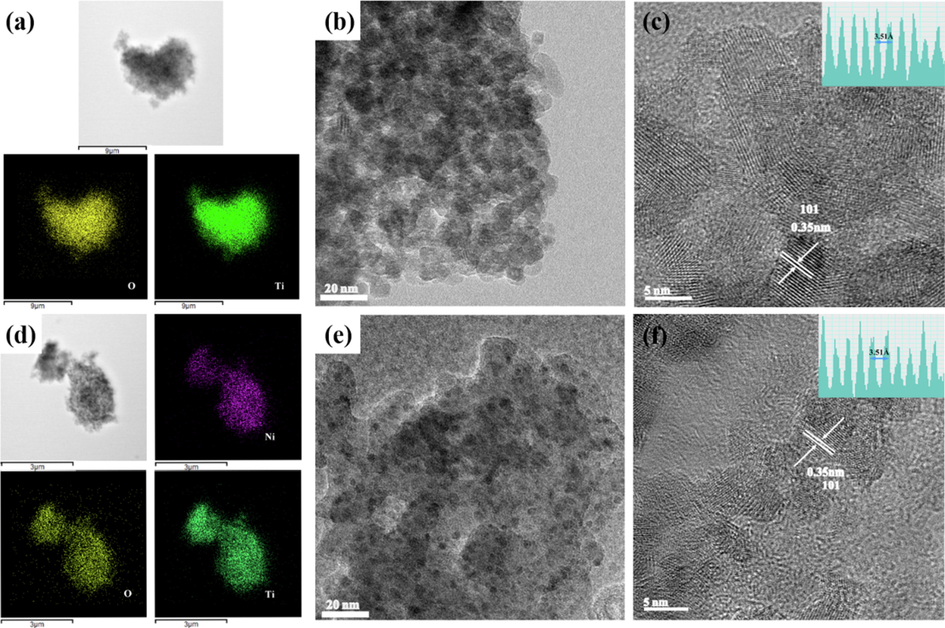
Elemental mapping of TN0 (a) and TN2(d). Low-resolution TEM images of TN0 (b) and TN2(e). High-resolution TEM images of TN0 (c) and TN2 (f). The inset on the upper right corner is the corresponding lattice distance of anatase TiO2 (1 0 1) facet.
Additionally, N2 sorption at 77 K was performed to reveal the surface area and porosity. As shown in (Fig. 3a & 3b, a typical type IV isotherm with a sharp type H2 hysteresis was observed, indicative of a mesoporous feature. Also, the narrow pore volume distribution confirmed the mesoporous (>2 nm) structure of prepared undoped titania and doped titania with different content of Ni. The specific surface area, pore volume and the average pore diameter of the as-synthesized samples were listed in Table 1. Although the samples with the presence of dopants exhibited the decrease in the average pore diameter, the maintaining mesoporous structure still enabled the CWA molecules (0.5–1.0 nm) to reach active site easily. Meanwhile, the developed surface area increased the surface active sites for the interaction or reaction with CWAs molecules (Smith, 2008; Bashiri et al., 2016) which highlighted the promising potential applications for stoichiometric degradation of CWAs under ambient condition.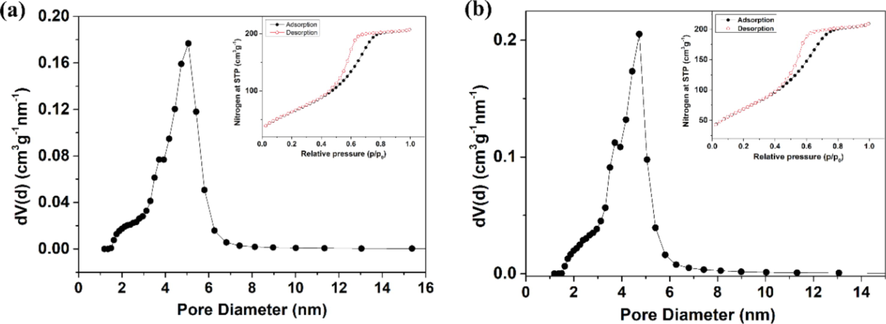
The pore size distribution curves of (a) TN0 and (b) TN2 calculated from desorption branch of the nitrogen isotherm. The inset on the upper right corner is the nitrogen adsorption-desorption isotherms.
3.2 Degradation of warfare agents
The degradation capabilities of as-prepared samples were assessed through heterogeneous catalytic reaction without any secondary solvents. As nucleophilic attack is the main pathway for the hydrolytic degradation of nerve agents, nanocrystalline TiO2 always showed high activity against GD and VX (Štengl et al., 2005, 2012a). Even so, the as-prepared Ni2+ doped anatase TiO2 exhibited enhanced degradation rate for GD and VX. For instance, sample TN2 showed excellent activity for VX and GD which make them degraded completely within 5 min and 30 min respectively (Table 2). Obviously, the activity of TN2 was better than undoped TN0 (GD: 98.3% in 30 min) and P25 (GD: 42.3% in 30 min, VX:46.3% in 5 min). As the degradation of HD is always relatively slow because nucleophilic reaction is more difficult to occur and low mass transferring efficiency, the improvement of activity for HD is essential for the nanocrystalline TiO2 as a broad-spectrum decontamination agent for blister and nerve agents. To our delight, TN1 ∼ TN3 could degrade HD more effectively and TN2 give a degradation rate of 92.2% within 1 h (Table 2). Extending the reaction time to 8 h, HD was degraded 99.2% and degraded completely within 12 h. By contrast, the degradation rates of HD by TN0 (66.6%) and P25 (12.8%) within 1 h were significantly lower than that of TN2 under identical conditions. It is important to note that the surface area of TiO2 nanoparticles increased while the pore volume decreased upon the doping of Ni2+ (Table 1). The best performance of CWAs degradation is reached by TN2, which indicated that the relationship between nanocomposites' properties and the activity is not unique correlation, but a synergistic effect of several factors.
Sample
HD
GD
VX
Degradation rate after 1 h/12 h (%)
k1 (h−1)
k2 (h−1)
Degradation rate after 30 min (%)
k1 (min−1)
k2 (min−1)
Degradation rate after 5 min (%)
P25
12.8 ± 0.12/24.35 ± 0.13
1.68E-01
4.29
74.6 ± 0.32
8.20
1.30E-02
46.3 ± 0.21
TN0
66.6 ± 0.52/88.70 ± 0.47
2.45 E-01
7.45
96.2 ± 0.65
9.60E-01
1.29E-01
>99.5
TN1
78.4 ± 0.68/-
–
–
>99.5
–
–
>99.5
TN2
92.2 ± 0.70/>99.5 a
4.45 E-01
9.08
>99.5
1.24
2.06 E-01
>99.5
TN3
83.5 ± 0.58/-
–
–
>99.5
–
–
>99.5
The detailed reaction kinetics of HD and GD degradation on TN0, TN2 and P25 were further investigated. As shown in Fig. 4a and 4b, the kinetic curves followed the generally accepted pattern which showed a faster reaction caused by the quick diffusion of HD/GD towards the reactive sites at outer surface and a slower reaction limited by the much slower diffusion of the agents into the active sites inside the pores of the samples (Štengl et al., 2011b, 2011a). Although the heterogeneous reaction by nanocrystalline TiO2 without any secondary solvent is actually more difficult for the degradation of CWAs, the reaction rate of TN2 was faster than TN0 and P25 (Table 2). The above results have clearly demonstrated that Ni2+ doping is favorable for the enhancement of the activity of anatase TiO2 for the degradation of CWAs.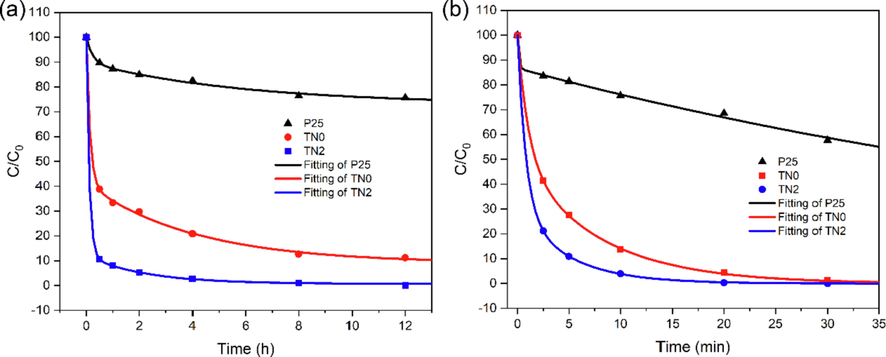
Degradation kinetic curves of (a) HD and (b) GD by P25, as-prepared undoped (TN0) and Ni2+ doped anatase TiO2 (TN2).
Furthermore, the stability and recyclability experiments clearly demonstrated the stoichiometric degradation of CWAs on TN2 (Fig. S4). The stoichiometric activity decreased rapidly due to the quickly consumption (occupation) of reactive surface sites and the slower diffusion of the agents into the depth of nano-dispersed nanoparticle (Štengl et al., 2012a). In addition, the degradation rate of HD increased with the expansion of mass ratio of TN2 to HD, which could attribute to the increase of the exposed reactive surface sites (Fig. S5). The results indicate that the surface reactivity of TiO2 nanoparticles is also important for the stoichiometric activity towards CWAs.
3.3 Analysis of degradation products
A further degradation products detection was performed by GC/MS analysis to investigate the possible degradation pathway of HD, GD and VX by Ni doped TiO2. The reacted mixed solid was dispersed in acetonitrile and the extract was derivatized by BSTFA. The obtained solution was injected into GC/MS system for the primary products detection (see details of the products characterization in Supplementary Fig. S6-S11). As might be expected, only hydrolysis products, separated as silylation derivatives, were observed for three kinds of CWAs. Nucleophilic substitution of hydroxyl groups is the major reaction pathway to induce P-F, P-S and C-Cl cleavage. It’s important to note that no representative oxidation products of HD (e.g., sulfoxides or sulfones) or VX (e.g., sulfonic acid) were detected in our system (Fig. 5). Interestingly, P-O bonds in GD molecule was also partially hydrolyzed to give the formation of methylphosphonic acid which suggested the efficient nucleophilic attack.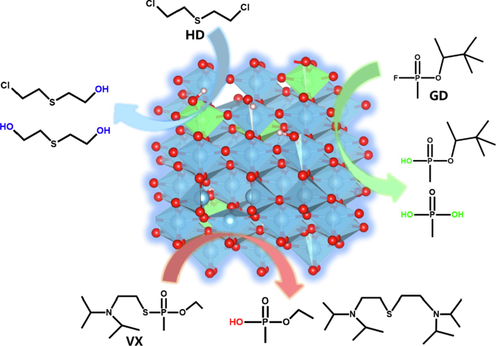
Primary degradation products of sulphur mustard, soman and VX on Ni2+ doped anatase TiO2.
As all of the as-prepared TiO2 samples were calcined in a muffle furnace under 300 °C to remove the site-coordinated water and physisorbed water, the degradation followed a manner analogous to that of the hydrolysis reaction by water indicating the key role of surface active sites and hydroxyl groups for the nucleophilic substitution of CWAs and the formation of hydrolysis products (Giannakoudakis et al., 2015; Xia et al., 2021). It is worth to mention the products obtained by stoichiometric degradation on our doped titania samples were non-toxic and less complicated than photocatalytic degradation (Vorontsov et al., 2003; Sharma et al., 2019).
3.4 Enhanced mechanism of stoichiometric activity
The above experimental results have demonstrated that the as-synthesized Ni2+ doped anatase TiO2 exhibited higher stoichiometric activity than undoped samples. Aside from the changes of porosity (in Section 3.1), the enhanced surface activity is also essential for the stoichiometric degradation of CWAs. As the surface basic sites and hydroxyls of metal oxides are generally accepted as the main active sites for CWAs degradation, the CO2-TPD profile of the samples was performed to reveal the surface basicity changes of TiO2 caused by Ni2+ doping. As shown in Fig. 6a, the undoped TN0 exhibited obvious peaks at approximately 300 and 450 °C, which were due to CO2 desorption at the surface basic sites and the completion of dehydroxylation. The higher desorption temperature of Ni2+ doped TN2 demonstrated the enhancement of the surface basicity and would be beneficial for the surface hydroxylation (Kumar et al., 2015). Furthermore, the intensity of oxygen vacancies was further investigated by electron spin resonance (ESR) due to the oxygen vacancies in TiO2 were typical binding site to form the P---O---Ti bonds to facilitate the nucleophilic substitution (Wagner et al., 2000; Bandosz et al., 2012). As shown in Fig. 6b, the intensity of oxygen vacancies at about g = 2.009 significantly increased from TN0 to TN2 (Wei et al., 2021). The above results demonstrated the higher surface basicity and richer oxygen vacancies of Ni2+ doped TiO2 would contribute to the higher nucleophilic attack activity for hydrolytic degradation of CWAs.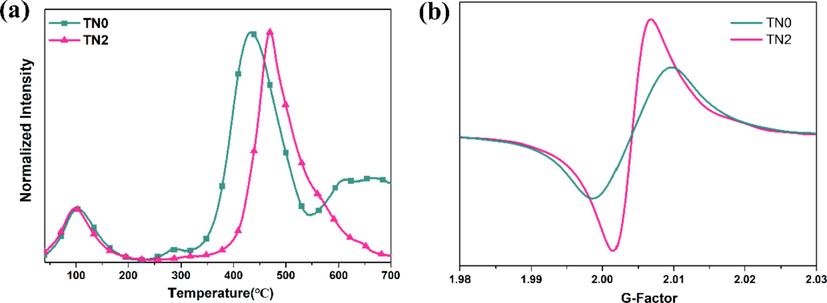
(a) The CO2-TPD profile and (b) ESR spectra of oxygen vacancies of TN0 and TN2.
In order to confirm the above conclusion, we optimized the surface structures and calculated charge distributions using DFT calculations. At first, the XRD spectra of NiO crystal, anatase TiO2, without and with different doping amount of Ni2+ (TiO2-Ni) were simulated and the relevant theoretical curves were compared with the experimental data (Fig. S12). The results displayed that the experimental curves were fully consistent with those calculated from DFT method, and also indicated that Ni2+ doping does not change the bulk crystal structures.
Then, the corresponding anatase TiO2 (1 0 1) surfaces including surface hydroxyl group with different Ni2+ doping ratio were constructed and optimized to investigate the surface structural changes. As shown in Fig. 7a-d, the increase of Ni2+ doping ratio could change the Ti-O and O-H bond lengths rarely, while the O-H bond length decreases rapidly when the hydroxyl group binds directly to Nickel atom. The further Bader charges analysis of important surface atoms were calculated to explore the charge transfer of surface hydroxyl groups. Comparing the Bader charge of the surfaces of TiO2-OH and TiO2-OH-Ni-1, Ni2+ doping made the Bader charges of O atom increase significantly to form the rich electrical location, and the Bader charge of H atom decrease distinctly to form the rich hole location. The increased electron and hole in the surface structures is in accordance with the enhancement of the surface basicity which would exhibit higher activity for CWAs degradation. Moreover, Ni2+ doped TiO2 (1 0 1) surface also shows stronger adsorption energy and corresponding shorter distance with HD and GD molecules which could promote the chemical surface adsorption and reaction with molecules (Fig. S13) (Lanfredi et al., 2020). However, when the surface Ti atom was surrounded by nickel atoms, shown in the TiO2-OH-Ni-2 and TiO2-OH-Ni-3 structures, the charge transfer was weakened in the hydroxyl group, resulting in the Bader charge decreased of O atom which went against the nucleophilic reaction. The results indicated the existence of optimal doping ratio of Ni2+ for stoichiometric degradation of CWAs, which was in line with the experimental results.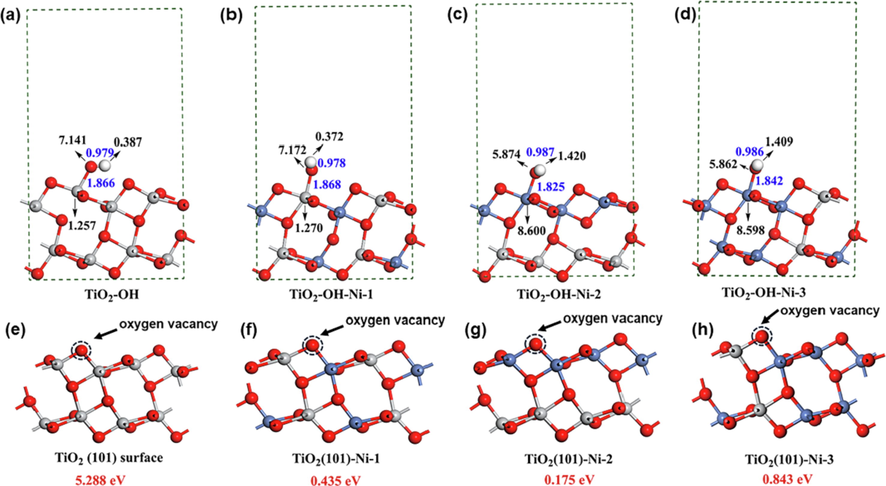
(a-d) The values of Bader charge (black numbers) and the bond lengths (blue numbers) and (e-h) The calculated oxygen vacancy formation energies (red characters) of the optimized anatase TiO2 (1 0 1) surface with increased doping ratio of Ni2+ from left to right. The titanium, oxygen, nickel and hydrogen atoms are shown in gray, red, blue and white, respectively.
On the other hand, considering the important role of oxygen vacancy for binding CWAs molecules and activating the reaction, the oxygen vacancy formation energies of the structural surfaces with different Ni2+ doping ratio were calculated. As shown in Fig. 7e-h, in accordance with the ESR results, the doping of Ni2+ on TiO2 (1 0 1) surface can significantly reduce the oxygen vacancy formation energy (from 5.288 to 0.175 eV) which would facilitate the nucleophilic substitution via the formation of P---O---Ti bonds. However, the increased doping of the Ni2+ in the bulk position will increase the oxygen vacancy formation energy slightly. Hence, Ni2+ doping in a certain range can enhance the the stoichiometric activity of TiO2 nanoparticles.
4 Conclusion
In summary, nickel doped anatase TiO2 was prepared as reactive sorbents for heterogeneous degradation of chemical warfare agents. Ni2+ doping had little influence on the crystal structure but had noticeable effect on the porosity and surface charge distribution of anatase TiO2. Combination of experimental and computational results demonstrated that the doping of Ni2+ into TiO2 would contribute to the higher nucleophilic attack activity towards CWAs. The best degree of conversion, >99.5% of GD within 30 min and VX within 5 min, 99.2% and > 99.5% of HD with 1 h and 12 h was achieved by the as-prepared Ni2+ doping anatase TiO2 which was significantly higher than commercial P25 and undoped TiO2. Products analysis by GC/MS showed that HD, GD and VX were decomposed to non-toxic hydrolysis products, which indicated the indispensable role of surface hydroxyl groups for the hydrolysis degradation of CWAs. The present work provides significant evidence of the enhanced surface activity of anatase TiO2 after transition metal ion-doping towards CWAs.
Acknowledgements
We are grateful for financial support from the National Natural Science of China (21906182) and the National Defense Basic Scientific Enhancement Program of China (2019-JCJQ-JJ-161).
Declaration of Competing Interest
The authors declare that they have no known competing financial interests or personal relationships that could have appeared to influence the work reported in this paper.
References
- J. Phys. Chem. C. 2012;116:11606-11614.
- Proc. Eng.. 2016;148:151-157.
- Toxics. 2019;7:63.
- Phys. Rev. B. 1977;16:1746-1747.
- J. Mater. Sci.. 2015;50:6268-6276.
- Int. J. Pharm. 2020:583.
- Appl. Surf. Sci.. 2018;443:321-328.
- Appl. Catal., B. 2015;174–175:96-104.
- J. Colloid Interface Sci.. 2018;531:233-244.
- Catal. Sci. Technol.. 2019;9:1816-1824.
- Catal. Sci. Technol.. 2019;9:2445-2455.
- Phys. Lett. A. 2007;364:318-322.
- Chem. Rev.. 2015;115:1-76.
- J. Hazard. Mater.. 2016;304:259-268.
- Chem. Mater.. 2020;32:9299-9306.
- Int. J. Environ. Sci. Technol.. 2018;15:2359-2368.
- Appl. Catal., B. 2013;134–135:19-25.
- Comput. Mater. Sci.. 1996;6:15-50.
- Phys. Rev. B. 1996;54:11169-11186.
- Appl. Catal., A. 2015;505:217-223.
- Appl. Catal., A. 2017;531:169-176.
- Appl. Catal., B. 2020;272:118968
- J. Appl. Crystallogr.. 2011;44:1272-1276.
- Environ. Sci. Technol.. 2014;48:10912-10918.
- Phys. Rev. Lett.. 1996;77:3865-3868.
- J. Hazard. Mater.. 2014;271:65-72.
- J. Hazard. Mater.. 2009;167:1192-1197.
- Water Sci. Technol.. 2012;66:1377-1383.
- J. Mol. Catal. A: Chem.. 2012;353:132-137.
- J. Catal.. 2016;334:129-141.
- Environ. Pollut.. 2019;246:491-500.
- Chem. Soc. Rev.. 2008;37:470-478.
- Open Process Chem. J.. 2008;1:1-7.
- J. Chem. Technol. Biotechnol.. 2005;80:754-758.
- Mater. Res. Bull.. 2011;46:2050-2056.
- J. Hazard. Mater.. 2011;192:1491-1504.
- J. Hazard. Mater.. 2012;227–228:62-67.
- Mater. Res. Bull.. 2012;47:4291-4299.
- Photochem. Photobiol.. 2011;88:265-276.
- Stengl, V., Henych, J., Janos, P., Skoumal, M., 2016. In: DeVoogt, P. (Ed.), Reviews of Environmental Contamination and Toxicology, vol. 236, pp. 239–258.
- Science. 2018;359 23–23
- Toxicology. 2005;214:167-181.
- Curr. Org. Chem.. 2007;11:285-298.
- Appl. Catal., B. 2008;79:323-333.
- J. Phys. Chem. B. 2004;108:16825-16833.
- J. Mol. Liq.. 2020;299:112177
- J. Catal.. 2003;220:414-423.
- J. Phys. Chem. B. 2000;104:5118-5123.
- J. Am. Chem. Soc.. 2001;123:1636-1644.
- Angew. Chem., Int. Ed.. 2021;60:16622-16627.
- Appl. Catal., B. 2021;284:119703
Appendix A
Supplementary data
Supplementary data to this article can be found online at https://doi.org/10.1016/j.arabjc.2021.103678.
Appendix A
Supplementary data
The following are the Supplementary data to this article:Supplementary data 1
Supplementary data 1


