

Translate this page into:
Aromatic free Fenton process for rapid removal of phenol from refinery wastewater in an oscillatory baffled reactor
-
Received: ,
Accepted: ,
This article was originally published by Elsevier and was migrated to Scientific Scholar after the change of Publisher.
Peer review under responsibility of King Saud University.
Abstract
The need for clean, safe, and unpolluted water has recently become an important issue. Industrial processes such as petrochemical, pharmaceutical, pulp, and paper industries emit organic products in water, such as phenols, which are extremely toxic to aquatic life. The severe operating conditions, such as high pressure and temperature, of the conventional chemical oxidation processes of phenols cost a lot and limited the extensive application of the process. The present work depicts the development of a highly efficient and rapid oxidation process in an oscillating baffled reactor (OBR) to allow continuous and safe phenol removal under moderate operating conditions. Phenol conversion was studied as a function of initial concentration (300–500 ppm), pH (3–5), residence time (1–5 min), at constant amplitude (A = 4 mm), and frequency (f = 4 Hz) of oscillation and room temperature to achieve up to 94.6%. At 70 °C, 300 ppm starting concentration, pH = 3, 4 Hz frequency, and 4 mm amplitude, an exceptional removal of 99.858% phenol was achieved without additional extraction in just 3 min by optimizing the working parameters. This is a significant improvement over comparable processes at this temperature, and it was done in a reactor that scales up reliably, so this performance can likely be replicated on a large scale. Also, the present process was safe as it produced a nil concentration of the hazardous Fenton intermediate compounds.
Keywords
Phenol
Fenton process
Oscillatory baffled reactor (OBR)
Safe treatment
Hydrogen peroxide

1 Introduction
Because of rapid industrialization and the growing global population, the need for new, safe, and uncontaminated water has recently become a major concern, as many supplies have been drained and some are likely to be polluted (Luan et al., 2017). Toxic wastes are being introduced into the atmosphere, resulting in massive soil pollution and permanent damage to much of our natural water supplies (Dehmani et al., 2020). Scientists and engineers have been looking for improved technology, such as innovative oxidation treatments for the elimination of hazardous chemicals from wastes, as a result of increasing environmental issues and stringent rules to manage pollution from factories. Petrochemical, petroleum processing, chemical, and medicinal sectors manufacture wastewater containing organic compounds such as phenols, which are harmful to marine organisms (Bustillo-Lecompte et al., 2018; Raza et al., 2019). Phenolic compounds, which are particularly toxic to marine organisms, are present in wastewaters from factories and a number of other sources. As a result, phenolic wastewaters must be treated differently before being disposed of. The procedure, however, cannot be carried out in traditional sewage plants since phenol has a potent bactericidal impact on microorganisms even at very low concentrations (Herney-Ramirez et al., 2010; Fortuny et al., 1998; Que et al., 2018). The US Environmental Protection Agency (EPA) has designated phenol as a priority pollutant, requiring that the phenol concentration in a contaminated stream be reduced to less than 1 mg L-1 (ppm) before it can be released (Raza et al., 2019; Yuan et al., 2015; Sacco et al., 2018). Incineration is the most common method for removing phenol (Dickson and Karasek, 1987; Mandal and Das, 2019; Romero et al., 2011), ozonation (Li et al., 2020; Priac et al., 2017), wet air oxidation (Zhou et al., 2018; Yang et al., 2008; Yang et al., 2014; Quintanilla et al., 2006; Gheni et al., 2018; Mohammed et al., 2016), photocatalytic oxidation (Mandal and Das, 2019; Sun et al., 2003; Davis and Huang, 1988; Shukla et al., 2010), supercritical wet oxidation (Thornton and Savage, 1992; Guan et al., 2011; Zhang et al., 2020), aerobic coupling (Matsushita et al., 2005; Hussain et al., 2015; Esguerra et al., 2017) or electrochemical oxidation (Asaithambi and Matheswaran, 2016; Ghoreishi et al., 2016). However, due to the harsh operating conditions and the significant investment required in most processes, they have not been widely adopted (Lacasa et al., 2019). The nature of the pollutant, the concentration of the pollutant, the desired removal efficiency, effectiveness, ability to form secondary toxic products, and cost are all factors that influence which method is used (Masende, 2004). Because of their high potential to oxidize numerous organic compounds, partially or completely, advanced oxidation processes (AOPs) are an interesting treatment option for refinery and petrochemical wastewaters (Coha et al., 2021). The use of Fenton's reagent, a mixture of H2O2 and Fe+2, is one of the most effective AOPs·H2O2 decomposes catalytically with the aid of Fe+2 at an acid pH, releasing hydroxyl radicals (Zazo et al., 2005):
Hydroxyl radicals can oxidize organics (RH) by eliminating protons, resulting in organic radicals (R•) that are potentially reactive that can be oxidized further (Wang and Wang, 2020)
Walling et al. (C.J.A.o.c.r. Walling, 1975) simplified the overall Fenton chemistry by accounting for the dissociation water:
This equation means that H+ is needed for the decomposition of H2O2, meaning that an acidic condition is required to achieve the full amount of hydroxyl radicals. Hydroxyl radicals can be added to aromatic or heterocyclic rings in the presence of organic substrates (RH), excess ferrous ions, and at low pH (as well as to the unsaturated bonds of alkenes or alkynes). In theory, using Fenton's reagent as an oxidant for wastewater treatment is appealing since Fe is a readily available and non-toxic ingredient, and hydrogen peroxide is simple to handle and decomposes into environmentally friendly items (Zazo et al., 2006). The flexibility of the equipment and the mild operating conditions are two of the advantages of Fenton's process over other oxidation techniques; for these reasons, Fenton's process has been regarded as the most cost-effective choice (Matavos-Aramyan and Moussavi, 2017). However, the process demands more sensitivity to the consistency of treated water and the time taken to complete the oxidation, necessitating thorough study into a more sophisticated oxidation reactor design. The mass transfer rate obtained in Oscillatory Baffled Reactor (OBR) is around 75% higher than the stirred tank reactor, primarily due to the increased time of gas hold-up but also the decreased diameter of the gas bubble (Abbott et al., 2015; Hu et al., 2020). Vortex contacts with gas bubbles result in disintegration generating a larger gas transfer surface area. These features permit OBRs to hold enough oxygen transfer with strong mixing. High efficiency mixing in Oscillatory Baffled Reactor (OBR) can remove the mass and heat gradients which can reduce the overall reaction time compared to the conventional flow reactors (Yang et al., 2021; Nasir, 2016). Vilardi et al. (Vilardi et al., 2020) proposed a mass-transfer model and scale-up procedure of the Fenton process of organic pollutants present in sludge produced in a municipal wastewater treatment plant. They found that 24 h are needed to achieve TOC and COD removal efficiencies of about 52 and 72%, respectively. Vuppala et al. (Vuppala et al., 2019) reported the use of high dosages of coagulant for 60 min process of reduction of turbidity, TOC, and COD at 99%, 16.76%, and 57.16%. The biological oxidation process led to a further decrease of COD, TOC and phenols levels by 82.5%, 71.9%, and 99.6%, respectively. Also, Vilardi (Vilardi, 2020) investigated the use of olive stones in fixed bed reactor and reported that elimination of these carcinogenic compounds is crucial. The process was firstly studied in a batch system to estimate kinetic and. Al-Abduly et al. (Al-Abduly et al., 2014) showed that 92% of the input ozone can be transferred to water in a semi-batch mode using the OBR. For the removal of phenol in wastewater, a novel continuous homogeneous Fenton process was developed using a laboratory OBR. To establish proof-of-concept for a more economically feasible method for producing phenol-free refinery and petrochemical effluent, the OBR was investigated for a short time on stream and mild phenol removal process.
2 Experimental
2.1 Materials and chemicals
The feedstock used in this work is a mimic wastewater made by adding the desired concentration of phenol to demineralized water. Phenol was dissolved in the demineralized water at the desired concentration. Phenol was supplied from Alpha Chemika company, India. Hydrogen peroxide (H2O2) was used as an oxidizing agent in the present work. It was supplied from Merck Millipore Company, Germany. Ferrous sulfate (FeSO4·7H2O, May and Baker Ltd. Company, England) was used as a homogenous catalyst to oxidize phenol to unharmful organic compounds. To analyze the product stream for the reaction aromatic intermediates, a mixture of 0.01 mol L-1 potassium monohydrogenphosphate solution (Sigma Aldrich, 98%), methanol (Sigma Aldrich, 98%), and tetra-hydrofurane (Perkinelmer, 99.5%) in a volumetric proportion of 90:5:5 respectively was used as a mobile phase for determining catechol, hydroquinone, and resorcinol in a High-Performance Liquid Chromatography (HPLC) (LC-40 HPLC system, Shimadzu, Japan). The potassium monohydrogenphosphate and phosphoric acid were obtained from Merck Company, USA at 99.5% purity.
2.2 Experimental setup
Continuous phenol oxidation was carried out in an OBR unit. A schematic diagram of the unit is presented in Fig. 1.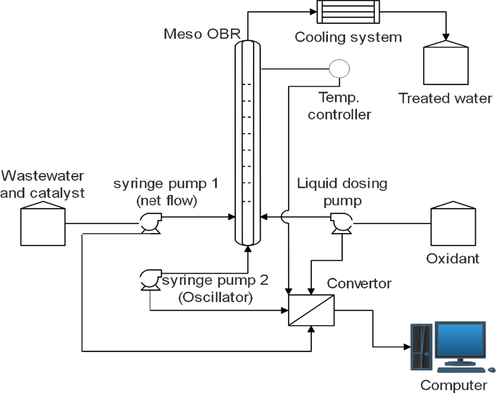
Schematic diagram for the experimental setup of the OBR unit.
The tubular reactor was designed as a metal tube jacketed by an efficient heater. The feedstock (the mimic wastewater) and the catalyst were fed from a feed tank. Two syringe pumps were used in this unit; one was connected to the feed tank and the other was used to generate oscillation inside the tubular reactor. The homogeneous oxidant (H2O2 solution) flowed via a dosing pump connected to a suitable storage container. The experimental OBR rig consists of the following parts:
2.2.1 Reactor
The OBR unit was manufactured from a 316 L modified stainless steel tube. The dimensions of the OBR tube and fitting were shown in the tubular reactor were cited in Table (S1). The inlet and outlet ports were created for flowing the feed, creating the oscillation, and the outlet for exiting the products at the end of each processing time. Also, the reactor was provided with a jacket wrapping the tubular reactor, this heater can provide temperatures from 0 °C to 400 °C. To provide an intensive mixing inside the OBR, it was equipped with a specific design of baffles. The design was based on a helical shape with a concentric rode. Table (S2) shows the dimensions of the baffled rode. To generalize the operation in the OBR in the present study, a specific range of dimensionless groups was employed in the present study. Table (S3) shows these groups.
2.2.2 Syringe pumps (oscillatory pumps)
The tubular reactor was attached through a Polytetrafluoroethylene (PTFE) tube and a custom Swagelok union to two Confluent PVM syringe pumps. The first syringe pump was used for feeding the wastewater to the OBR. Also, the catalyst was mixed with the feed in the tank before flowing into the unit of reaction. The OBR was connected to the two syringe pumps via a union tube made of Polytetrafluoroethylene (PTFE). These syringe pumps were fabricated from 316 L stainless steel and supplied by Eurodyne, Ltd., UK. To tune and regulate the oscillatory condition of the present study, Sapphire commander software was used. Table (S4) summarizes the working range of the syringe pump used in the present study.
2.2.3 Liquid dosing pump
The liquid dosing pump was made by CoMetro Technology, Ltd, USA, of the 316 stainless steel form. The pump was used to accurately deliver a precise quantity of the oxidant, the hydrogen peroxide at a controlled interval. Table (S5) summarizes the working range of the dosing pump used in the present study.
2.2.4 Control system
The OBR unit is regulated by an efficient control system consisting of the following parts:
-
Temperature control system: The intelligent industrial temperature controller of the REX-C series used in this work was devoted to multifunction microprocessor control tools. The system was used to monitor the reactor temperature. It was supplied by Finglai Electric, Ltd., China. The temperature controller range of operation was 0 °C −400 °C and ± 0.5 °C.
-
Syringe pump control system: Each pump was attached to the same interface adapter, pump USB converter, and personal computer (PC) with a C-series cable. The software (Sapphire Commander) manages and controls these pumps. There are several methods and commands included in this software. The flow rates, oscillation frequency, and oscillation amplitude can be modified by the monitoring system.
-
Control system of liquid dosing pump: The pump was controlled by a hybrid microprocessor.
2.2.5 Product cooling system
To cool the treated wastewater, it was flown through an ice bath. The bath was used to bring the water to room temperature and facilitate sampling and analysis of the product.
2.2.6 The storage system
The storage system includes:
-
Wastewater tank: The feedstock was mixed with the catalyst and kept in a feed tank.
-
Oxidant container: The hydrogen peroxide was stored in a container and pumped to the reactor.
-
Receiving container: A plastic container is used to collect the treated wastewater. Fig. 2 shows a picture of the experimental rig. In the feed tank, the wastewater (containing phenol at the desired pollutant concentration) and liquid catalyst streams were mixed thoroughly, then flowed to the reactor. The Sapphire software was used for the setup and operation of the two syringe pumps. The oxidant flow rate was varied by the liquid dosing pump's control system. Inside the reactor, the degree of oscillation was also varied and regulated by the Sapphire software. The product stream was passed from the reactor to the ice bath then to the receiving container. For each run, a sample was withdrawn upon approaching steady-state conditions.
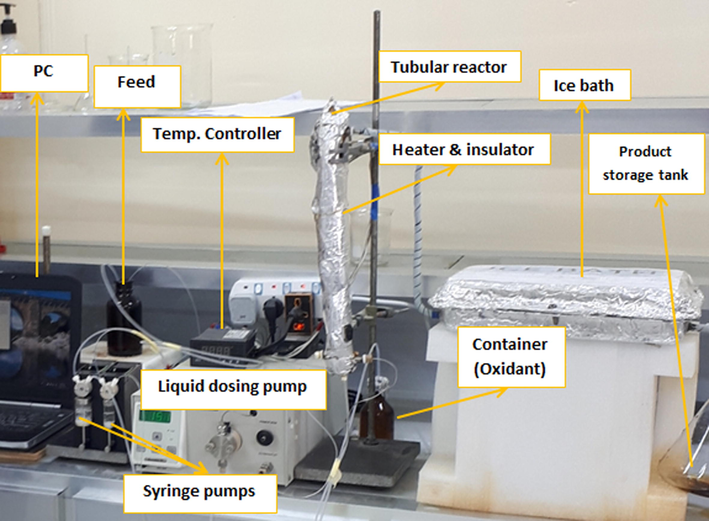
- Experimental setup of the OBR experimental rig.
2.3 Running of the experiments
2.3.1 Preparation of the OBR unit
The OBR unit was prepared to conduct the experiments shown in Table 1. The steps of preparation are described as follow:
-
For accurate flow rate, the two syringe pumps and the dosing pump were calibrated before use.
-
Connection of the pumps to the main parts of the unit.
-
To get rid of any remaining material left after completion of an experiment, the OBR was purged with ethanol to dissolve these remnants.
| Parameter | Level | Value |
|---|---|---|
| Initial concentration | 3 | 300, 400, 500 ppm |
| Residence Time | 3 | 1, 2, 3 min |
| pH | 3 | 3, 4, 5 |
Table 1 specifies all variables and conditions employed in the present work.
-
d)
All possible leaks were checked before flowing the feedstock and the oxidant by operation of the pump with water at the highest rates of flow and oscillation conditions for at least 30 min.
-
e)
Preparation of the feedstock by adding phenol to the demineralized water with the desired initial concentrations of phenol (300 ppm, 400 ppm, and 500 ppm) with pH adjustment for each concentration, the value of pH was 3, 4, and 5. The pH of the feed solution was adjusted by adding drops of sulphuric acid (1 N). To measure the pH, a pH meter Eutech (pH 700 m, Thailand) was used.
2.3.2 Kinetic study of the Fenton process in the OBR
The first part of the present study focuses on the mechanism of phenol removal through studying the kinetics of the reaction. The conditions were: 50 °C-70 °C oxidation temperature, initial concentration of phenol = 300 ppm, pH = 3, residence time = 0.75 °C −3 min, and 4 Hz and 4 mm frequency and amplitude of oscillation. Table (S6) shows the experimental runs of the kinetic study in this study.
2.3.3 Evaluation of Fenton process in the OBR
The second part of this work focused on studying the performance of the OBR in phenol removal from wastewater via the Fenton process. The oxidation of phenol was conducted using hydrogen peroxide as an oxidant and ferrous sulfate solution (FeSO4·7H2O) as catalyst under different operating conditions (initial concentration of phenol = 300 ppm, 400 ppm, and 500 ppm, residence time = 1 min, 2 min, and 3 min, pH = 3, 4, and 5). The volumetric ratio of the oxidant (H2O2 (to wastewater and the ratio of the liquid catalyst to wastewater were (10 mL/1000 mL) and (300 mg/1000 mL), respectively according to Yavuz et al. (Yavuz et al., 2007). The procedure of running the experiments is described as follow:
-
The liquid catalyst was mixed with the mimic wastewater. The mixture was flown to the OBR at the desired feed rate and monitored via the software commander. The oxidant was pumped to the OBR via the liquid dosing pump at the desired ratio. To provide the desired oscillation conditions within the OBR, syringe pump 2 has functioned.
-
The feedstock (the mimic wastewater) with the catalyst was pumped to the reactor by the syringe pump 1.
-
The optimal oscillation conditions (frequency of oscillation and amplitude of oscillation) were set at 4 Hz and 4 mm for each experiment to obtain the high mass transfer rate at this condition according to Oliveira et al. (Oliveira and Ni, 2004).
-
To approach the steady-state, each set of experimental conditions was maintained.
-
Upon approaching the steady-state and after residing for the specific residence time, a sample of the treated wastewater was taken, labeled, and analyzed.
-
The system was kept running at a continuous mode of operation. All operation variables were monitored and regulated using the control devices for each.
-
After completion of each experiment, the pumps were brought to off mode and the valves and opening were shut off.
2.3.4 Experiments of the Fenton process without mixing
In this part of the experimental work, the efficiency of the phenol removal from the wastewater via a batch reactor was studied using H2O2 as oxidant and ferrous sulfate heptahydrate as catalyst under various operating conditions (T = 50 °C, 60 °C, 70 °C, t = 1 min, 2 min, 3 min) without mixing. The aim of conducting this part of the study is to compare the efficiency of phenol removal in a batch process with the OBR process. The following steps were implemented to prepare and run the experiments:
-
Pouring of 100 mL of the wastewater with a specified initial phenol concentration (300 ppm) and pH = 3 into a three-necked 250 mL flask.
-
Placing the flask on the magnetic heating stirrer. This stirrer was manufactured by JISICO, Korea. The specifications of the stirrer were illustrated in Table (S7).
-
The funnel was placed on the central opening of the flask to add the catalyst with ensuring that the other openings are tightly closed to prevent any vaporization of wastewater. Also, a thermometer was inserted to measure the reaction temperature.
-
For each run, the magnetic heating stirrer was set at the desired temperature.
-
When the desired temperature was approached, the oxidant was added to the reactor at the same ratio used in the OBR (wastewater/catalyst ratio = 3.33 and wastewater/oxidant = 100) and the time was recorded up to the desired time of each run.
-
When the desired time was approached, the sample was withdrawn and labeled. The sample was then analyzed for phenol content against the fresh sample.
-
The same procedure of the experimental run was applied at three different temperatures (50 °C, 60 °C, and 70 °C).
-
At the end of each run, the heating magnetic stirrer was stopped and cleaned.
-
The reactor was cleaned by washing and drying to prepare for the next run.
Table (S8) shows the experimental runs of the Fenton process conducted without mixing in the batch reactor.
2.4 Analysis of the products
The concentrations of phenol were measured using a UV spectrophotometer (JASCO ultraviolet/visible (UV–VIS/530, Japan), the absorbance wavelength of phenol was taken as 269 nm). The concentration of the oxidation reaction intermediate components was measured in a Shimadzu HPLC system consisting of a SIL – 10AF auto-injector, an SPD – 10A UV detector operated at 254 nm, an SCL – 10A control system, and an LC – 10AT pump. For all compounds, the flow rate of the mobile phase was 1 mL/min. The analytical column (4.6 mm diameter and 150 mm length) used was packed with C18 nucleoside silica (5 mm, 100 Å; Macherey-Nagel, Germany). Detection of the aromatic intermediates (catechol, hydroquinone, and resorcinol) compounds was conducted using retention times 10.9 min, 5.5 min, and 9.5 min respectively. The range detection limit was 100 ppm −50 ppb.
3 Results and discussion
3.1 Kinetics of phenol oxidation by Fenton process in the OBR
For estimation of the reaction kinetics parameters of phenol oxidation in the wastewater, a set of kinetic experiments were conducted at different reaction temperatures (50 °C, 60 °C, and 70 °C), initial phenol concentration = 300 ppm, pH = 3, and LHSV = 0.3 min−1 in the mesoscale OBR. The reaction was catalyzed by the ferrous sulfate heptahydrate, and hydrogen peroxide was used as an oxidant. In general, phenol was considered as a limiting reactant in the reaction shown in equation 1:
Thus, the reaction rate law is given by Eq. (2):
A pseudo-first-order rate equation (n = 1) was guessed and tested:
rph = rate of phenol oxidation rate, (mol/L.s)
Cpho = Phenol inlet concentration, (mol/L)
Cph = Phenol outlet concentration, (mol/L)
t = reaction time, (s)
n = reaction order
Fig. 3 showed that the experimental results fit pseudo-first-order kinetics at the reaction conditions examined. Reyes et al. (Reyes et al., 2013) reported that the rate of phenol oxidation by the Fenton process obeyed pseudo-first-order kinetics. The influence of temperature on phenol oxidation kinetics has been investigated and the values of specific reaction rates were estimated at 50, 60, and 70 °C. The obtained rate constants were found to be increased from 0.0156 s−1-0.0287 s−1 as the temperature increased from 50 °C to 70 °C.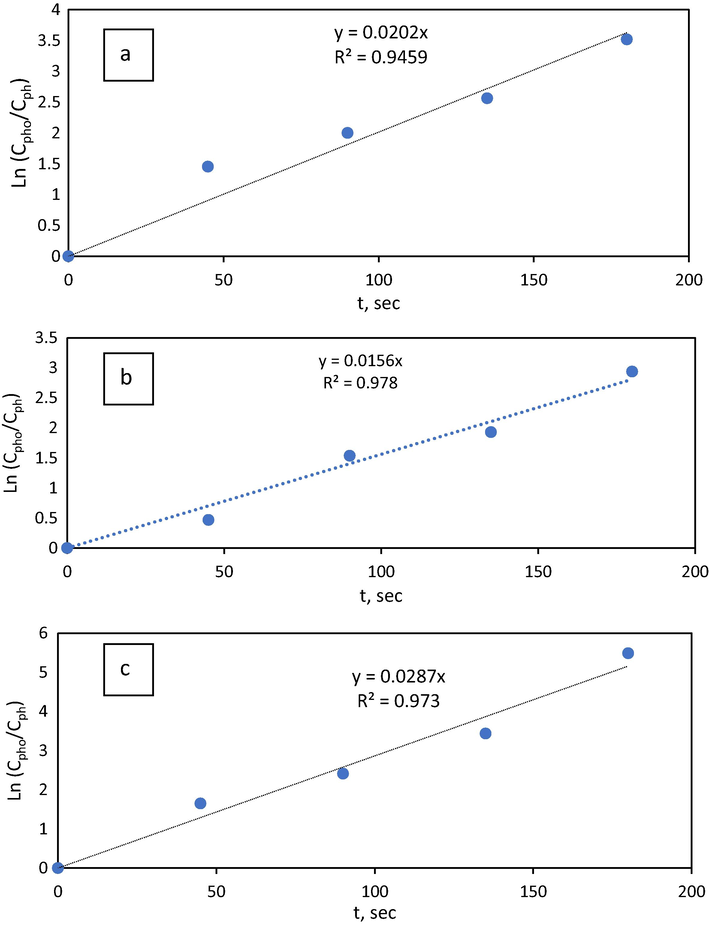
Pseudo first-order representation of kinetic data at a) 50 °C, b) 60 °C, c) 70 °C.
According to the apparent kinetic rate constants at various temperatures, the apparent activation energy Eapp for phenol oxidation by Fenton process in the OBR was estimated with Arrhenius equation;
The activation energy (Eapp) obtained from the Arrhenius equation was 28.05 kJ mol−1 and this activation energy is much lower than the dissociation energy for H2O2 (213.8 kJ mol−1) (Chen et al., 2017).
Table 2 shows the activation energy of phenol oxidation by the Fenton process achieved in previous works. The activation energy of phenol oxidation by the Fenton process for this study and previous studies. It can be seen that the activation energy of ferrous sulfate catalyzed phenol oxidation in the OBR is lower than that achieved in previous studies.
Catalyst/Oxidant system
Activation Energy (kJ/mol)
Type of reactor
Reference
Fe+2/H2O2
28.05
OBR
Present study
Fe+2/H2O2
30.294
Microwave reactor
(Wei and Qi-bin, 2005)
Fe+2/H2O2
30–50
Btach reactor
(Zazo et al., 2011)
3.2 Effect of the operating conditions
The degree of phenol removal from wastewater in the OBR was investigated at different process variables (phenol initial concentration, residence time, and pH) and atmospheric pressure to elucidate the effect of experimental parameters on the Fenton process in the OBR.
3.2.1 Effect of the phenol initial concentration on phenol conversion
The effect of different phenol initial concentrations in wastewater feed on phenol removal efficiency in OBR was investigated at 300 ppm, 400 ppm, and 500 ppm at room temperature. Fig. 4 shows the effect of phenol initial concentration in wastewater on the conversion of phenol. The Figure revealed a decrease in the conversion of phenol as the initial concentration increases from 300 ppm to 500 ppm. It can be observed from Fig. 4(a) that as the initial concentration increases from 300 to 400 ppm at low flow conditions
with a pH of 3, phenol removal decreased from 78% to 75% which was a marginal decrease. Further increase in initial concentration to 500 ppm led to a decrease in the removal of phenol from 75% to 67%.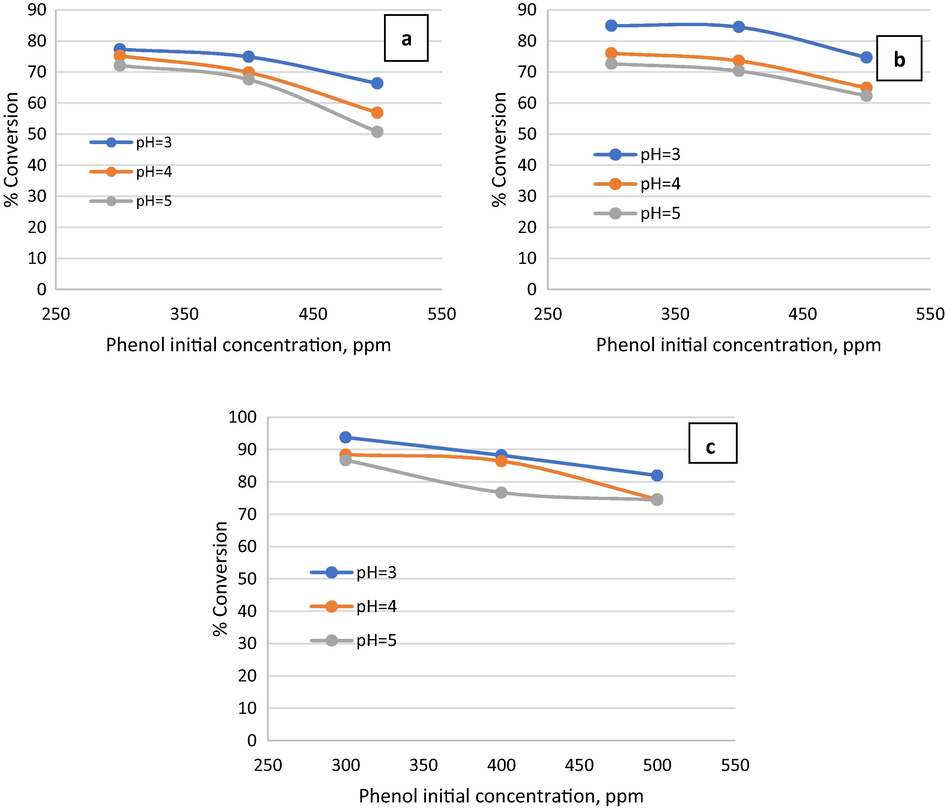
Effect of phenol initial concentration on phenol conversion at
at different residence times a)
At moderate flow conditions (t = 2 min) with pH = 3, increasing the initial concentration of phenol in wastewater from 300 ppm to 500 ppm led to a decrease in phenol removal from 85% to 75% as shown in Fig. 4(b). Increasing the residence time to 3 min at pH = 3 and the increase of phenol initial concentration in wastewater from 300 ppm to 500 ppm led to a decrease in phenol removal from 93% to 82% as shown in Fig. 4(c). In general, the experimental results indicated that at phenol initial concentration of 300 ppm the conversion by Fenton process of phenol was higher than the conversion at initial concentrations 400 ppm and 500 ppm. Thus, the decrease in the initial concentration of phenol promoted phenol removal. This may be due to the increase in phenol load and also the amount of hydroxyl radicals produced from hydrogen peroxide dissociation may not be sufficient to destruct the phenol completely. The results of the present study agreed with Gümüş and Akbal (Gümüş and Akbal, 2016) as they proved that the phenol conversion decreased from 98.92% to 68.63% as phenol initial concentration increased from 50 ppm to 500 ppm by using H2O2 as oxidant and ferrous ions as a catalyst by electrochemical Fenton reactor. As anticipated, the conversion of phenol was inversely proportional to the initial concentration of phenol in wastewater. This may attribute to the availability of a constant concentration of hydroxyl radicals regardless of the change in phenol concentration and as a result, the conversion was decreased (Babuponnusami and Muthukumar, 2012) and is consistent with the findings of Pletcher (Pletcher, 1999) that treatment of wastewater by Fenton oxidative process is limited by organic compounds concentration less than 1000 ppm.
3.2.2 Effect of the residence time on phenol conversion
To investigate the effect of residence time on the efficiency of the phenol oxidation process, several experiments were examined at different residence times (1–5 min), room temperature, different phenol initial concentration (300 ppm, 400 ppm, and 500 ppm), and different pH values (3, 4, and 5). Fig. 5 shows the effect of residence time on the efficiency of the phenol oxidation process. It can be observed that the efficiency of phenol oxidation in the OBR was remarkably promoted by extending the residence-time as the conversion of phenol increased from 77.3% to 84.5% when residence time increased from 1 min to 2 min at phenol initial concentration of 300 ppm and pH = 3. Extending of residence time to 3 min led to an increase in phenol conversion to 94.6% as shown in Fig. 5(a).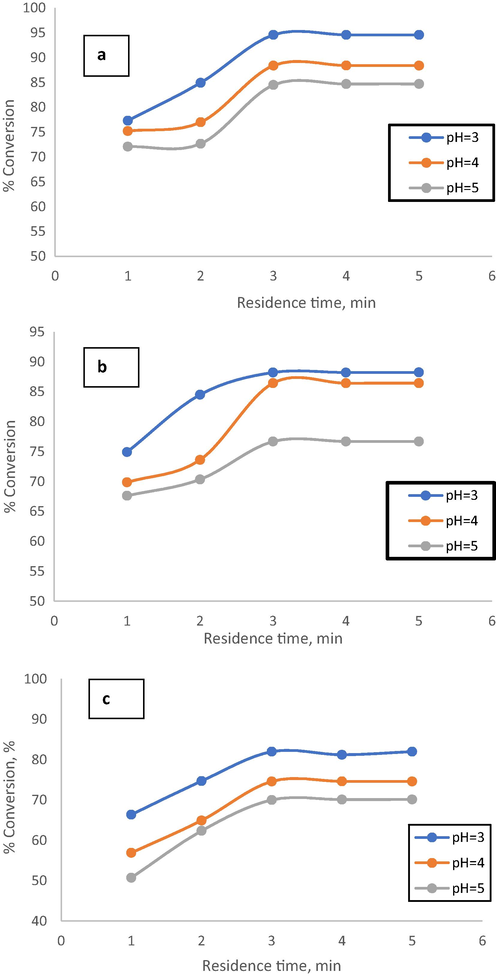
Effect of residence time on phenol conversion at different pH and initial phenol concentration a) 300 ppm.
Increasing residence time from 1 to 3 with phenol initial concentration of 400 ppm and pH = 3 led to an increase in phenol conversion from 66.4% to 88% as shown in Fig. 5(b). When the residence time was increased from 1 to 3 with phenol initial concentration of 500 ppm and pH = 3, the phenol removal efficiency increased from 67% to 82% as shown in Fig. 5(c). At the time of experimentation, the reaction was left to continue for more time (longer than 3 min), However, because the reaction was expected to approach equilibrium, no greater conversion was obtained. As the reaction period progressed, the contact time between the reactants (oxidizing agent and phenol) grew longer. Increased residence time reduced the undesired flow variation caused by hydrogen peroxide and ferrous sulfate interacting with the phenol to create hydroxyl radicals. The fact that increasing the contact time between reactants (oxidant and phenol) allows more time for the interaction between phenol and hydroxyl radicals to be achieved can be ascribed to the increased efficiency of phenol elimination with increasing residence time. Like any other reaction, phenol oxidation via the Fenton process by using H2O2 as oxidant and FeSO4·7H2O as catalyst needs enough time to complete and is enhanced as time proceeds. The results of the present study agree with Esteves et al. (Esteves et al., 2018). Their experiments were conducted by a CSTR by using H2O2 as an oxidant and Fe+2 as a catalyst. They found that the oxidation of organic compounds in olive mill wastewater (OMW) was enhanced with the increasing residence time of reactants. Also, they found that organic compound removal efficiency was 30% after 40 min and 50% when the residence time increases to 180 min. In comparison to CSTR, the results obtained by OBR in the present study within 3 min residence time is a substantial rapid increase in phenol removal i.e., a more efficient, and much faster process was implemented in the OBR. Reaction time to eliminate organic compounds (phenol) in the OBR was minimized due to the efficient mixing conditions that approach plug flow reactor (PFR) behavior. The oscillatory pattern of motion enhances the mass transfer, reaction rate, reduction in residence time, and increase conversion by uniform and efficient mixing (Kefas et al., 2019; Syam et al., 2012). Because the reactant trapped in the inter baffles zones which led to enhancement in the contacting time between the reactants and the short residence time was enough for providing high removal efficiency of phenol from wastewater. The results of the present study agree with Zazo et. al (Zazo et al., 2009). Their experiments were conducted in a semi-continuous reactor by using H2O2 as an oxidant and Fe+2 as a catalyst. They found that phenol concentration decreased from 80 ppm at 25 min to 10 ppm at 150 min which equivalent to 90% of removal efficiency. In comparison to semi-continuous reactor, the results obtained by OBR in the present study within 3 min space–time is higher than those obtained by that semi-continuous reactor within 150 min giving a substantial enhancement of the Fenton process.
3.2.3 Effect of pH of reaction solution on phenol conversion
To investigate the effect of pH on the efficiency of the phenol oxidation process, several experiments were examined at different pH values (3, 4, and 5), room temperature, different phenol initial concentration (300, 400, and 500 ppm), and different residence times (1 min, 2 min, and 3 min). Fig. 6 shows the effect of pH on the efficiency of the phenol oxidation process. It can be observed that the efficiency of phenol oxidation in the OBR was decreased by increasing pH as the conversion of phenol decreased from 78% to 75% when pH was increased from 3 to 4 at phenol initial concentration of 300 ppm and residence time = 1 min. Further increase in pH to 5 led to a decrease in phenol conversion to 72% as shown in Fig. 6(a). Increasing pH from 3 to 5 with phenol initial concentration of 400 ppm and residence time = 1 led to a decrease in phenol conversion from 75% to 68% as shown in Fig. 6(b). When pH was increased from 3 to 5 with phenol initial concentration of 500 ppm and residence time = 1, the phenol removal efficiency decreased from 67% to 51% as shown in Fig. 6(c). Generally, the phenol removal efficiency was inversely proportional to the pH values at the range of 3–5 (Zazo et al., 2007).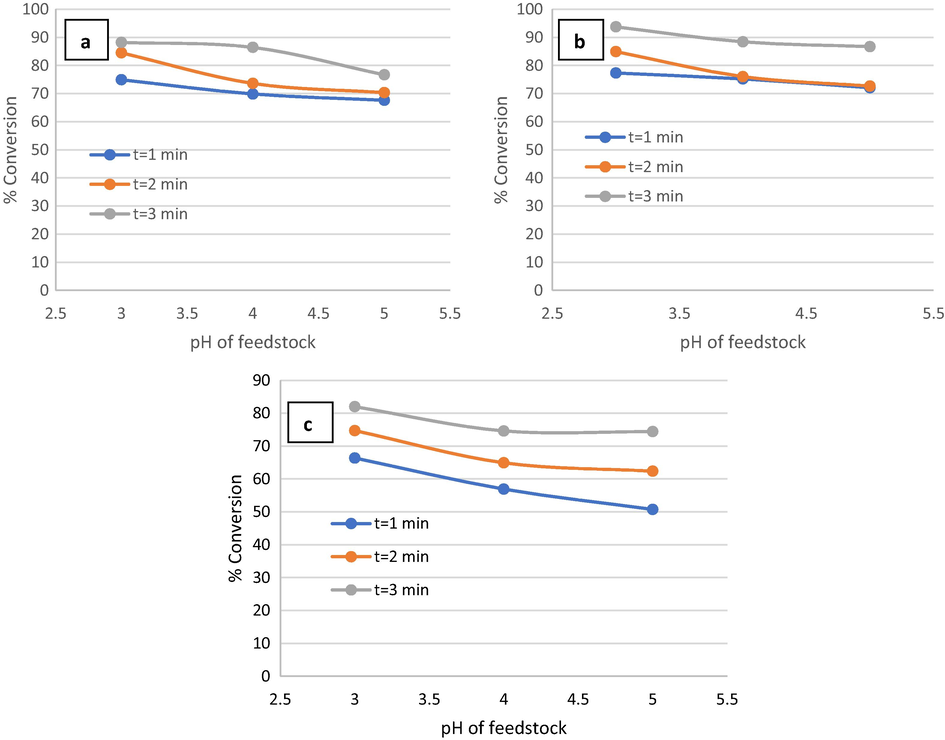
Effect of pH of feedstock on phenol conversion at phenol initial concentration of a) 300 ppm, b) 400 ppm, c) 500 ppm, and
.
The higher efficiency of phenol removal in this present study was obtained at pH = 3 and this agrees with the previous studies (Ghoneim et al., 2011; Wang et al., 2008; Zhou et al., 2007). The results of the present study agreed with Gümüş and Akbal (Gümüş and Akbal, 2016) as they proved that the phenol conversion decreased from 93.32% to 65% as pH increased from 3 to 7 by using H2O2 as an oxidant and ferrous ions as a catalyst by electrochemical Fenton reactor. The maximum phenol removal for the Fenton process was obtained in the pH range of 2–3, which decrease with any increase or reduction beyond this range (Gümüş and Akbal, 2016). In another relevant study, Babuponnusami and MuthukumarIt (Babuponnusami and Muthukumar, 2011) showed that the sono-photo-Fenton process was more efficient in the pH range from 2 to 10. However, the decrease in phenol removal due to pH increase became less significant in the OBR in a residence time of 3 min. This effect of pH can be attributed to several factors such as:
-
Significant generation of hydroxyl radicals at acidic medium (Ma et al., 2009).
-
When pH increases above 3, ferrous ions start to precipitate as Fe(OH)3 due to reaction with hydroxyl radicals and decomposition of the H2O2 into O2 and H2O (Esteves et al., 2018).
-
An increase in pH leads to the generation of Fe(II) complexes which consume Fe2+ and reduce its concentration (Bautista et al., 2008).
-
Instead of hydroxyl radicals, weaker oxidants were formed at pH values above 5 such as ferryl ions (Xu and Wang, 2011).
3.3 Effect of the dimensionless group of the OBR on Fenton performance
3.3.1 Effect of the net Reynolds number (Ren) on phenol conversion
Net flow Reynolds number is a measure of the effect of the flow rate on phenol removal. The Fenton process was carried out in the OBR at different Ren (19, 28, and 57) to reveal the impact of Ren on phenol conversion. Initial concentration, pH, and pressure were kept constant. Fig. 7(a) shows that decreasing Ren enhances the phenol conversion in OBR. The conversion of phenol was increased from 78% to 85% when Ren was reduced from 57 to 28 at pH = 3 and an initial concentration of phenol of 300 ppm. Phenol conversion increased from 85% to 93% with a further decrease in Ren from 28 to 19 at the same initial phenol concentration and pH. An enhancement in phenol conversion from 75% to 88% occurred when the Ren was reduced from 57 to 19 at pH = 3 and initial concentration of phenol of 400 ppm as illustrated in Fig. 7(b). At initial phenol concentration of 500 ppm and pH = 3, decreasing Ren from 57 to 19 led to an increase in the phenol conversion from 67% to 82% as shown in Fig. 7(c).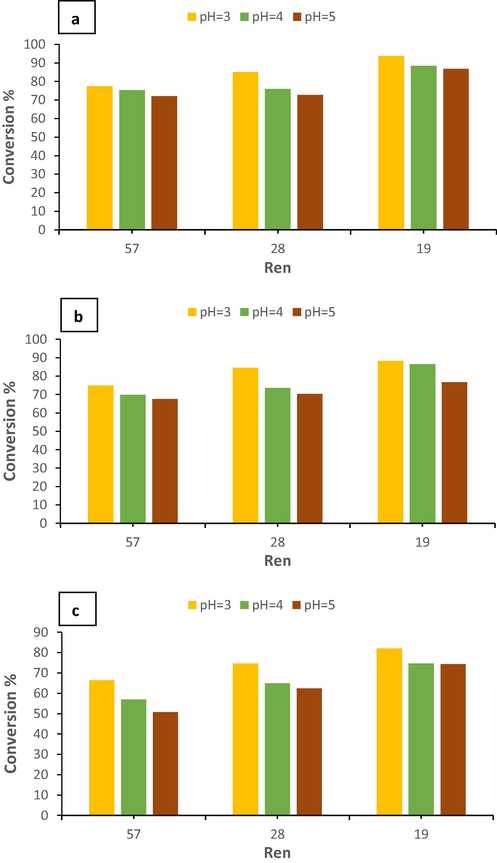
Effect of Ren on phenol conversion at a different initial concentration of phenol a) 300 ppm, b) 400 ppm, c) 500 ppm.
The net flow Reynolds number (Ren) is directly proportional to reactor diameter and liquid average velocity. In the present study, Ren was ≤ 57 which suggests that the flow was laminar under the present study conditions. Phenol conversions tend to decrease as Ren increases due to the following reasons:
-
The residence time of reactants is inversely proportional to the Ren inside the OBR as shown in equations 8–10. Hence phenol removal efficiency decreased with increasing Ren.
Thus:
Vo: Wastewater flow rate (m3/min)
Ac = Cross-sectional area of the reactor.
V: Volume of the reactor (m3).
-
2-
The oscillatory flow component is less than the net forward flow, i.e., in OBR the value of axial mixing is more dominant than radial mixing due to vortex formation occurring in front of each baffle. Hence, this mixing pattern leads to lower levels of heat transfer (Ahmed et al., 2018), consequently, a reduction of the phenol removal efficiency.
-
3-
At low net flow and oscillation conditions, most OBRs approach plug flow conditions (McDonough et al., 2015). Hence a high-intensity mixing pattern is achieved under laminar flow conditions (Reis et al., 2006).
Thus, the best Ren in this present study for the Fenton process of phenol oxidation in the OBR was 19.
3.3.2 Effect of the velocity ratio ( ) on phenol conversion
The velocity ratio (
) is defined as the degree of plug flow behavior in an OBR (Stonestreet and Van Der Veeken, 1999). In the present study, the Fenton process for phenol oxidation was carried out at different
values, in the range of 16 to 48 using a ferrous sulfate heptahydrate/hydrogen peroxide system. Fig. 8 shows the influence of velocity ratio on phenol removal from wastewater. Phenol conversion increases from 74% to 93% as the velocity ratio increases from 16 to 45 due to decreasing Ren at the initial concentration of 300 ppm and pH = 3 as shown in Fig. 8(a). Phenol conversion was increased from 75% to 89% when the velocity ratio increased from 16 to 48 due to decreasing Ren at the initial concentration of 400 ppm and pH = 3 as shown in Fig. 8(b). At phenol initial concentration of 500 ppm and pH = 3, phenol conversion was increased from 67% to 82% as velocity ratio increased from 16 to 48 due to decreasing Ren as shown in Fig. 8(c).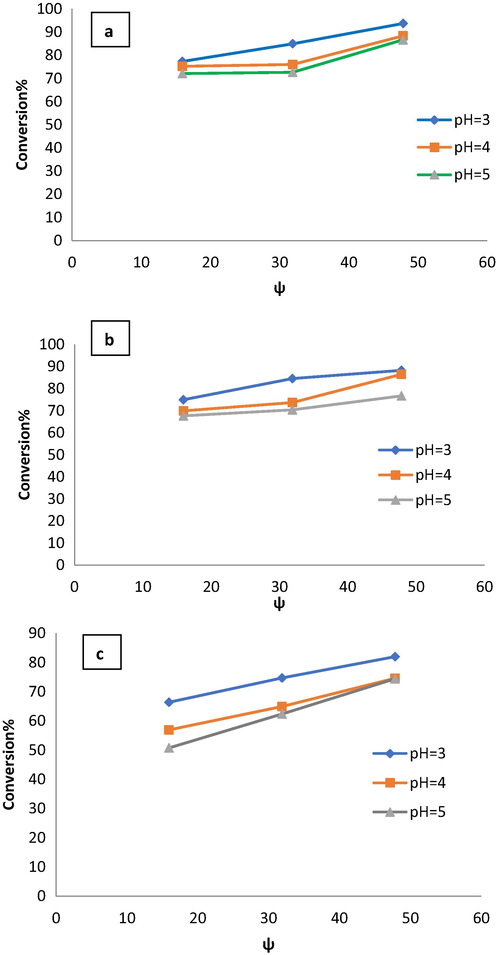
Effect of velocity ratio on phenol conversion at different pH and phenol initial concentrations a) 300 ppm, b) 400 ppm, and c) 500 ppm.
The velocity ratio can be described as shown in Eq. (12):
Increasing velocity ratio enhances mixing performance and consequently increased phenol removal efficiency in the OBR (Avila et al., 2020). The velocity ratio should be greater than 1 to make sure that oscillations control the mixing regime by fully reversed flow (Stonestreet and Harvey, 2002). For mesoscale OBR, Phan et al. (Phan and Harvey, 2012) showed that the plug flow behavior can be achieved for a velocity ratio higher than 10. The highest phenol removal percentage was achieved at Ren = 19, Reo = 904, and velocity ratio = 48.
3.4 Reaction intermediates
The anticipated main intermediates for phenol oxidation are catechol, resorcinol, and para-hydroquinone, these intermediates cause serious environmental pollution (Lv et al., 2016). To examine the possible formation of these aromatic intermediates, the product solution of the OBR reaction experiments was analyzed for these intermediates. No analyzed intermediates were detected in most of the experimental runs except for the conditions shown in Table 3 with the corresponding concentrations of catechol, hydroquinone, and resorcinol. The intermediates formed in trace quantities at pH = 4 and less were obtained at pH = 5. The results proved that OH radicals contributed to the degradation of the harmful intermediates (Serpone et al., 1993). It can be seen that all the detected concentrations were less than limit of quantification (LOQ) and close to nil. Thus, the oxidation of phenol in the OBR is a benign treatment process.
Phenol conc. (ppm)
Residence time (min)
pH
Intermediates
Catechol (ppb)
Hydroquinone (ppb)
Resorcinol (ppb)
300
1
5
<LOQ*
106
<LOQ
300
1
5
<LOQ
94
<LOQ
300
3
4
<LOQ
377
<LOQ
300
2
4
<LOQ
410
<LOQ
300
2
5
<LOQ
183
<LOQ
400
1
3
54
716
52
As can be seen from the results, phenol oxidation by Fenton’s reagent proceeds initially through hydroxylation of the aromatic ring to yield dihydroxybenzene compounds, mainly catechol, hydroquinone, and resorcinol, which are in redox equilibrium with benzoquinones (Nasr et al., 2005). Ring-opening of catechol and hydroquinone produce organic acids (Sobczyński et al., 2004). According to previous relevant studies, all of the intermediates are finally oxidized to formic acid and oxalic acid when high Fe2+ and H2O2 doses are used. Under these conditions, organic acids are also oxidized to CO2 and H2O (Zazo et al., 2005). Also, Pontes et al. (Pontes et al., 2010) showed that most influential in the final phenol, catechol, and hydroquinone concentrations. As expected, the most influential parameters are the ones that regulate the oxidation by hydroxyl radical reactions involving these three studied compounds. Parameter estimation was performed to best fit the experimental data and the overall correlation coefficient obtained was 0.93.
3.5 Effect of mixing intensity
The effect of mixing intensity in the Fenton process on the conversion of phenol was studied. Several phenol oxidation experiments were in a batch reactor to compare the degree of removal with the OBR part. The phenol removal from wastewater by the Fenton process in the batch reactor was investigated using ferrous sulfate heptahydrate as catalyst and hydrogen peroxide as oxidant at various reaction temperatures (50, 60, 70 °C), and different reaction times (1, 2, and 3 min) at the constant phenol initial concentration of 300 ppm and pH = 3. Fenton process of the phenol removal from wastewater using ferrous sulfate heptahydrate as catalyst and hydrogen peroxide as oxidant was conducted at various residence times of 1, 2, and 3 min. Fig. 9(a) shows that phenol conversion increased with increasing residence time due to increased reaction time which in turn increases the contact time between the reactants. Phenol conversion increased from 6% to 12% when the reaction time increased from 1 to 3 min at a reaction temperature of 50 °C. An enhancement in phenol removal efficiency from 16% to 23% at reaction temperature 60 °C when reaction time increased from 1 to 3 min. At reaction temperature 70 °C, the phenol removal efficiency increased from 26% to 37% when reaction time increased from 1 to 3 min. The highest conversions were obtained at 3 min at all reaction temperatures in agreement with the results observed in the OBR. Fig. 9(b) shows the effect of reaction temperature observed in the range of 50 °C to 70 °C and at constant reaction time in the batch reactor. Increasing reaction temperature from 50 °C to 70 °C, phenol conversion increased from 6% to 26% at 1 min reaction time and increased from 8% to 28% at a reaction time of 2 min. Further increase in reaction time to 3 min with increasing temperature from 50 °C to 70 °C leads to increase phenol conversion from 11% to 36%.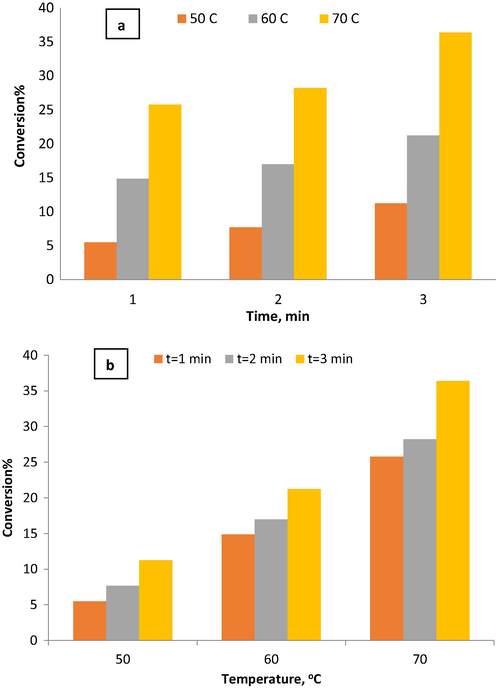
The effect of reaction temperature on phenol conversion in the batch reactor without mixing at initial phenol concentration = 300 ppm and pH = 3.
Fig. 10 shows a comparison between phenol removal in batch reactor and the OBR at different reaction temperatures 50 °C, 60 °C, and 70 °C, reaction times 1 min, 2 min, and 3 min and 300 ppm initial phenol concentration. The OBR was more efficient than the batch reactor and much higher phenol conversion is observed. It was noticed that a complete phenol removal was achieved at 70 °C. The removal was enhanced from 95%, 97% then to 99.85% as temperature increased from 50 °C to 60 °C then to 70 °C. This is a little phenol removal difference compared to the significant temperature difference between these experiments. This finding reflects that the effect of operating temperature on phenol removal using the OBR is marginal. Also, compared to the batch reactor the mixing intensity in the OBR was more efficient, consequently, the contact area between reactants in the OBR is greater than the contact area for the batch reactor. As a result, a higher mass transfer rate was obtained in the OBR and the phenol oxidation rate was accelerated (Huang et al., 2006). In a previous study, Esteves et al. (Esteves et al., 2018) obtained a total phenol removal of 96.9% at 30 °C in a CSTR within 120 min. Herby, substantial removal of phenol in the continuous OBR of the present study was achieved compared to the CSTR that required a much longer time to achieve a satisfactory phenol removal.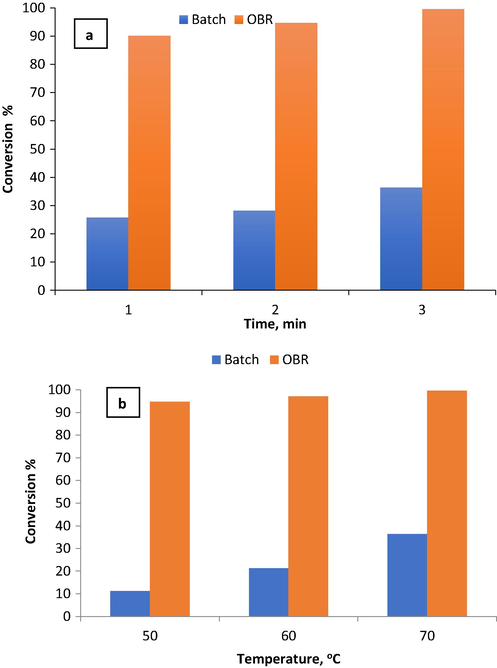
The comparison of phenol conversion in the OBR and the batch reactor at initial phenol concentration = 300 ppm and pH = 3. a) Different reaction times and 70 °C b) different reaction temperatures and 3 min.
4 Conclusions
At a laboratory scale, oxidative Fenton catalytic removal of phenol from wastewater was performed in a mesoscale oscillatory baffled reactor (meso-OBR) at different temperatures (60 °C, 70 °C, 80 °C), residence times (1 min, 2 min, 3 min), initial phenol concentration (300 ppm, 400 ppm, 500 ppm) and frequency and amplitude of 4 Hz and 6 mm respectively. The process was evaluated at atmospheric pressure and temperature with Ferrous sulfate as a catalyst and hydrogen peroxide (H2O2) as an oxidant aiming a maximum possible phenol conversion in a short residence time and safe wastewater. Higher conversions of phenol were achieved in just one pass than in various comparable studies conducted using the same oxidant and catalyst and required extraction step to obtain high phenol conversion. In addition, the combination of the oscillatory motion and the helical baffle design provided sufficient mixing of the reactants to accelerate the reaction to the necessary extent and to eliminate the carcinogenic aromatic intermediates to nil concentration. Within this parameter range, increasing the temperature and decreasing the initial phenol concentration improved phenol conversion. With 3 min residence time, an oscillation frequency of 4 Hz, and an oscillation amplitude of 6 mm at room temperature, maximum phenol elimination of 94.6% was obtained, which were the best levels of each in this parametric investigation. It was also found that raising the temperature above room temperature, up to 70 °C, resulted in even greater conversion. However, the highest elimination obtained was up to 99.85%, and additional temperature increases are severely limited by hydrogen peroxide breakdown, which would result in undesired and hazardous H2O2 decomposition. Because of the high surface area to volume ratio and the radial movement of reactant throughout the reactor, temperature control in the OBR was improved. This mesoscale oscillatory baffle design, as well as perhaps related plug flow reactor designs, can operate a homogenous Fenton process contentiously. The helical baffle with center rod design offered enough mixing to generate a homogenous mixture even at low net flow rates, resulting in high conversions in short residence durations of 3 min, as opposed to residence lengths of an hour or longer in batch and other traditional types of reactors. Thus, it offers an economically advantageous process of refinery wastewater treatment. Moreover, the process resulted in insignificant traces of the hazardous phenol oxidation reaction intermediates.
Declaration of Competing Interest
The authors declare that they have no known competing financial interests or personal relationships that could have appeared to influence the work reported in this paper.
References
- Liquid culture of microalgae in a photobioreactor (PBR) based on oscillatory baffled reactor (OBR) technology–A feasibility study. Chem. Eng. Sci.. 2015;138:315-323.
- [Google Scholar]
- Thermal performance of meso-scale oscillatory baffled reactors. Chem. Eng. Processing-Process Intensification. 2018;132:25-33.
- [Google Scholar]
- Characterization and optimization of an oscillatory baffled reactor (OBR) for ozone-water mass transfer. Chem. Eng. Process. Process Intensif.. 2014;84:82-89.
- [Google Scholar]
- Electrochemical treatment of simulated sugar industrial effluent: optimization and modeling using a response surface methodology. Arabian J. Chem.. 2016;9:S981-S987.
- [Google Scholar]
- Mixing performance in continuous oscillatory baffled reactors. Chem. Eng. Sci.. 2020;115600
- [Google Scholar]
- Degradation of phenol in aqueous solution by fenton, sono-fenton and sono-photo-fenton methods. Clean-Soil, Air, Water. 2011;39(2):142-147.
- [Google Scholar]
- Advanced oxidation of phenol: a comparison between Fenton, electro-Fenton, sono-electro-Fenton and photo-electro-Fenton processes. Chem. Eng. J.. 2012;183:1-9.
- [Google Scholar]
- An overview of the application of Fenton oxidation to industrial wastewaters treatment. J. Chem. Technol. Biotechnol.: International Research in Process, Environmental & Clean Technology. 2008;83(10):1323-1338.
- [Google Scholar]
- Photochemical treatment of benzene, toluene, ethylbenzene, and xylenes (BTEX) in aqueous solutions using advanced oxidation processes: towards a cleaner production in the petroleum refining and petrochemical industries. J. Cleaner Prod.. 2018;186:609-617.
- [Google Scholar]
- C.J.A.o.c.r. Walling, Fenton's reagent revisited, 8(4) (1975) 125-131.
- Ionothermal synthesis of Fe3O4 magnetic nanoparticles as efficient heterogeneous Fenton-like catalysts for degradation of organic pollutants with H2O2. J. Hazard. Mater.. 2017;322:152-162.
- [Google Scholar]
- Advanced oxidation processes in the removal of organic substances from produced water: potential, configurations, and research needs. Chem. Eng. J.. 2021;128668
- [Google Scholar]
- Removal of phenols from water by a photocatalytic oxidation process, Water Pollution Research and Control Brighton. Elsevier; 1988. p. :455-464.
- Removal of phenol from aqueous solution by adsorption onto hematite (α-Fe2O3): mechanism exploration from both experimental and theoretical studies. Arabian J. Chem.. 2020;13(5):5474-5486.
- [Google Scholar]
- Mechanism of formation of polychlorinated dibenzo-p-dioxins produced on municipal incinerator flyash from reactions of chlorinated phenols. J. Chromatogr. A. 1987;389:127-137.
- [Google Scholar]
- Unified synthesis of 1, 2-oxy-aminoarenes via a bio-inspired phenol-amine coupling. Chem. 2017;2(4):533-549.
- [Google Scholar]
- Synthetic olive mill wastewater treatment by Fenton’s process in batch and continuous reactors operation. Environ. Sci. Pollut. Res.. 2018;25(35):34826-34838.
- [Google Scholar]
- Wet air oxidation of phenol using active carbon as catalyst. Appl. Catal. B. 1998;19(3–4):165-173.
- [Google Scholar]
- Catalytic wet air oxidation and neural network modeling of high concentration of phenol compounds in wastewater. Environ. Processes. 2018;5(3):593-610.
- [Google Scholar]
- Electro-Fenton oxidation of Sunset Yellow FCF azo-dye in aqueous solutions. Desalination. 2011;274(1–3):22-30.
- [Google Scholar]
- Voltammetric determination of resorcinol on the surface of a glassy carbon electrode modified with multi-walled carbon nanotube. Arabian J. Chem.. 2016;9:S1563-S1568.
- [Google Scholar]
- Pathways and kinetics of partial oxidation of phenol in supercritical water. Chem. Eng. J.. 2011;175:201-206.
- [Google Scholar]
- Comparison of Fenton and electro-Fenton processes for oxidation of phenol. Process Saf. Environ. Prot.. 2016;103:252-258.
- [Google Scholar]
- Heterogeneous photo-Fenton oxidation with pillared clay-based catalysts for wastewater treatment: a review. Appl. Catal. B. 2010;98(1–2):10-26.
- [Google Scholar]
- Performance of chemical catalytic biofilm technology for decentralized sewage treatment. Environ. Eng. Sci.. 2020;37(11):757-768.
- [Google Scholar]
- Chemical oxidation of dibenzothiophene with a directly combined amphiphilic catalyst for deep desulfurization. Ind. Eng. Chem. Res.. 2006;45(6):1880-1885.
- [Google Scholar]
- Kinetic study for aerobic treatment of phenolic wastewater. Water Resour. Ind.. 2015;11:81-90.
- [Google Scholar]
- Enhanced biodiesel synthesis from palm fatty acid distillate and modified sulfonated glucose catalyst via an oscillation flow reactor system. J. Environ. Chem. Eng.. 2019;7(2):102993.
- [Google Scholar]
- Environmental applications of electrochemical technology. What is needed to enable full-scale applications? Curr. Opinion Electrochem.. 2019;16:149-156.
- [Google Scholar]
- Preparation of the Mn-Fe-Ce/γ-Al2O3 ternary catalyst and its catalytic performance in ozone treatment of dairy farming wastewater. Arabian J. Chem.. 2020;13(2):3724-3734.
- [Google Scholar]
- Treatment of refractory organic pollutants in industrial wastewater by wet air oxidation. Arabian J. Chem.. 2017;10:S769-S776.
- [Google Scholar]
- Photocatalytic selective oxidation of phenol to produce dihydroxybenzenes in a TiO2/UV system: hydroxyl radical versus hole. Appl. Catal. B. 2016;199:405-411.
- [Google Scholar]
- Electrochemical catalytic treatment of phenol wastewater. J. Hazard. Mater.. 2009;165(1–3):475-480.
- [Google Scholar]
- Phenol adsorption from wastewater using clarified sludge from basic oxygen furnace. J. Environ. Chem. Eng.. 2019;7(4):103259.
- [Google Scholar]
- Advances in Fenton and Fenton based oxidation processes for industrial effluent contaminants control-a review. Int. J. Environ. Sci. Nat. Resour. 2017;2(4):1-18.
- [Google Scholar]
- Heterogeneously catalyzed aerobic oxidative biaryl coupling of 2-naphthols and substituted phenols in water. J. Am. Chem. Soc.. 2005;127(18):6632-6640.
- [Google Scholar]
- Rapid process development using oscillatory baffled mesoreactors–a state-of-the-art review. Chem. Eng. J.. 2015;265:110-121.
- [Google Scholar]
- Optimal design and operation of an industrial three phase reactor for the oxidation of phenol. Comput. Chem. Eng.. 2016;94:257-271.
- [Google Scholar]
- Anaerobic Digestion for Cattle Manure Treatment and its Kinetic Modelling in an Oscillatory Flow Biogas Reactor, Universiti Putra Malaysia (UPM) Thesis. Malaysia 2016
- [Google Scholar]
- Electrochemical oxidation of hydroquinone, resorcinol, and catechol on boron-doped diamond anodes. Environ. Sci. Technol.. 2005;39(18):7234-7239.
- [Google Scholar]
- Effect of hydrodynamics on mass transfer in a gas–liquid oscillatory baffled column. Chem. Eng. J.. 2004;99(1):59-68.
- [Google Scholar]
- Characterisation of mesoscale oscillatory helical baffled reactor—Experimental approach. Chem. Eng. J.. 2012;180:229-236.
- [Google Scholar]
- Indirect oxidations using electrogenerated hydrogen peroxide. Acta Chemica Scandinavica. 1999;53:745-750.
- [Google Scholar]
- A mechanistic kinetic model for phenol degradation by the Fenton process. J. Hazard. Mater.. 2010;176(1–3):402-413.
- [Google Scholar]
- Alkylphenol and alkylphenol polyethoxylates in water and wastewater: a review of options for their elimination. Arabian J. Chem.. 2017;10:S3749-S3773.
- [Google Scholar]
- Que, Z.G., Torres, J.G.T., Vidal, H.P., Rocha, M.A.L., Pérez, J.C.A., López, I.C., Romero, D.D.L.C., De Los Monteros, A.E.E., Reyna, J.G., Pavón, A.A.S., 2018. Application of silver nanoparticles for water treatment, IntechOpen2018.
- Wet air oxidation of phenol at mild conditions with a Fe/activated carbon catalyst. Appl. Catal. B. 2006;62(1–2):115-120.
- [Google Scholar]
- Removal of phenolic compounds from industrial waste water based on membrane-based technologies. J. Ind. Eng. Chem.. 2019;71:1-18.
- [Google Scholar]
- Application of a novel oscillatory flow micro-bioreactor to the production of γ-decalactone in a two immiscible liquid phase medium. Biotechnol. Lett.. 2006;28(7):485-490.
- [Google Scholar]
- Use of ligand-based iron complexes for phenol degradation by fenton modified process. J. Mex. Chem. Soc.. 2013;57(2):96-104.
- [Google Scholar]
- Soil remediation by Fenton-like process: phenol removal and soil organic matter modification. Chem. Eng. J.. 2011;170(1):36-43.
- [Google Scholar]
- Removal of phenol in aqueous media by N-doped TiO2 based photocatalytic aerogels. Mater. Sci. Semicond. Process.. 2018;80:104-110.
- [Google Scholar]
- Sonochemical oxidation of phenol and three of its intermediate products in aqueous media: catechol, hydroquinone, and benzoquinone. Kinetic and mechanistic aspects. Res. Chem. Intermediates. 1993;18(2):183-202.
- [Google Scholar]
- Photocatalytic oxidation of phenolic compounds using zinc oxide and sulphate radicals under artificial solar light. Sep. Purif. Technol.. 2010;70(3):338-344.
- [Google Scholar]
- Phenol destruction by photocatalysis on TiO2: an attempt to solve the reaction mechanism. J. Mol. Catal. A: Chem.. 2004;213(2):225-230.
- [Google Scholar]
- A mixing-based design methodology for continuous oscillatory flow reactors. Chem. Eng. Res. Des.. 2002;80(1):31-44.
- [Google Scholar]
- The effects of oscillatory flow and bulk flow components on residence time distribution in baffled tube reactors. Chem. Eng. Res. Des.. 1999;77(8):671-684.
- [Google Scholar]
- Role of platinum deposited on TiO2 in phenol photocatalytic oxidation. Langmuir. 2003;19(8):3151-3156.
- [Google Scholar]
- Synthesis of Jatropha curcas oil-based biodiesel in a pulsed loop reactor. Ind. Crops Prod.. 2012;37(1):514-519.
- [Google Scholar]
- Kinetics of phenol oxidation in supercritical water. AIChE Journal. 1992;38(3):321-327.
- [Google Scholar]
- P-aminophenol catalysed production on supported nano-magnetite particles in fixed-bed reactor: Kinetic modelling and scale-up. Chemosphere. 2020;250:126237.
- [Google Scholar]
- Fenton oxidation of primary municipal wastewater treatment plant sludge: process modelling and reactor scale-up. Process Saf. Environ. Prot.. 2020;140:46-59.
- [Google Scholar]
- Olive mill wastewater integrated purification through pre-treatments using coagulants and biological methods: Experimental, modelling and scale-up. J. Cleaner Prod.. 2019;236:117622.
- [Google Scholar]
- Removal of color from real dyeing wastewater by Electro-Fenton technology using a three-dimensional graphite cathode. J. Hazard. Mater.. 2008;152(2):601-606.
- [Google Scholar]
- Reactive species in advanced oxidation processes: formation, identification and reaction A. Chem. Eng. J.. 2020;126158
- [Google Scholar]
- Wei, X.K.-f.L.Z., Qi-bin, S.X., 2005. Effect of Microwave on Reaction Activation Energy of Phenol Degradation by Fenton Reagent [J], Journal of South China University of Technology (Natural Science Edition) 12.
- A heterogeneous Fenton-like system with nanoparticulate zero-valent iron for removal of 4-chloro-3-methyl phenol. J. Hazard. Mater.. 2011;186(1):256-264.
- [Google Scholar]
- Catalytic activity, stability and structure of multi-walled carbon nanotubes in the wet air oxidation of phenol. Carbon. 2008;46(3):445-452.
- [Google Scholar]
- Graphene oxide as an effective catalyst for wet air oxidation of phenol. J. Hazard. Mater.. 2014;280:55-62.
- [Google Scholar]
- An intensified ozonation system in a tank reactor with foam block stirrer: synthetic textile wastewater treatment and mass transfer modeling. Sep. Purif. Technol.. 2021;257:117909.
- [Google Scholar]
- Phenol removal through chemical oxidation using Fenton reagent. Chemical Engineering & Technology: Industrial Chemistry-Plant Equipment-Process Engineering-Biotechnology. 2007;30(5):583-586.
- [Google Scholar]
- Purification of phenol-contaminated water by adsorption with quaternized poly (dimethylaminopropyl methacrylamide)-grafted PVBC microspheres. J. Mater. Chem. A. 2015;3(8):4620-4636.
- [Google Scholar]
- Chemical pathway and kinetics of phenol oxidation by Fenton's reagent. Environ. Sci. Technol.. 2005;39(23):9295-9302.
- [Google Scholar]
- Catalytic wet peroxide oxidation of phenol with a Fe/active carbon catalyst. Appl. Catal. B. 2006;65(3–4):261-268.
- [Google Scholar]
- Evolution of ecotoxicity upon Fenton's oxidation of phenol in water. Environ. Sci. Technol.. 2007;41(20):7164-7170.
- [Google Scholar]
- Semicontinuous Fenton oxidation of phenol in aqueous solution.A kinetic study. Water Res.. 2009;43(16):4063-4069.
- [Google Scholar]
- Intensification of the Fenton process by increasing the temperature. Ind. Eng. Chem. Res.. 2011;50(2):866-870.
- [Google Scholar]
- Partial oxidation of phenol in supercritical water with NaOH and H2O2: Hydrogen production and polymer formation. Sci. Total Environ.. 2020;722:137985.
- [Google Scholar]
- Phenolic compounds removal by wet air oxidation based processes. Front. Environ. Sci. Eng.. 2018;12(1):1-20.
- [Google Scholar]
- Electro-Fenton method for the removal of methyl red in an efficient electrochemical system. Sep. Purif. Technol.. 2007;57(2):380-387.
- [Google Scholar]
Appendix A
Supplementary data
Supplementary data to this article can be found online at https://doi.org/10.1016/j.arabjc.2021.103635.
Appendix A
Supplementary data
The following are the Supplementary data to this article:Supplementary data 1
Supplementary data 1


