

Translate this page into:
Ferroelectric and photoelectrochemical studies of lead-free Ba0.925Bi0.05 □0.025(Ti0.65Zr0.30Sn0.05)O3 ceramic and its application to Rhodamine B oxidation under solar light
⁎Corresponding authors. rekhilagharib@gmail.com (G. Rekhila), mtrari@usthb.dz (M. Trari)
-
Received: ,
Accepted: ,
This article was originally published by Elsevier and was migrated to Scientific Scholar after the change of Publisher.
Peer review under responsibility of King Saud University.
Abstract
New materials with general formula Ba0.925Bi0.05□0.025(Ti0.65Zr0.30Sn0.05)O3 (symbolized BBiTZS) were prepared by high-temperature solid-state reaction. The room X-ray diffraction pattern suggests a cubic perovskite structure. The thermal variation of the permittivity at different frequencies showed a relaxor ferroelectric behavior. The Raman spectroscopy was in accordance of the dielectric measurements. The diffuse phase transition parameters were determined from the modified Curie–Weiss law, while the relaxor behavior was highlighted by a good fit to the Vogel–Filcher relationship. The capacitance-potential (Csc−2 − E) graph at pH ∼ 7 is characteristic of n-type behavior with a flat band potential (Efb) of −0.52 VSCE and an electron density (NA) of 2.7 × 1018 cm−3. The Electrochemical Impedance Spectroscopy, measured in the region (1 mHz - 105 Hz), showed a semicircle, assigned with the bulk property (27 kΩ cm2); a constant phase element (CPE) is responsible for the depletion angle (−9°). With an optical of 2.00 eV, the ferroelectric BBiTZS possesses appealing photocatalytic capability and was successfully experimented for the oxidation of Rhodamine B (Rh B) exposed to solar light. According to the band diagram, electrons from the conduction band of BBiTZS are injected into dissolved oxygen, resulting in O2• radicals, which are employed in the Rh B oxidation. UV–Visible spectrophotometry was used to follow the Rh B discoloration. On a solar irradiation of 97 mW cm−2, a conversion of 50% is achieved in Rh B solution (10 mg L−1) within 100 min., and the degradation follows a first order kinetic model with a half photocatalytic-life of 90 min.
Keywords
Lead-free perovskite
Relaxor behavior
Dielectric properties
Photocatalysis
Solar light

1 Introduction
Ferroelectric materials of perovskite structure (ABO3) have been intensively investigated due mainly to their high-performance properties. These materials are of paramount utility in various applications; one can cite the capacitors, actuators, transducers etc … (Kenji uchino, 1994; Park et al., 1999; Alexe et al., 1999). Nevertheless, the majority of them are lead-based ceramics, which has resulted in environmental problems due to the volatility of the hazardous lead oxide. The toxicity of various species has led to the adoption of a universal law restricting the utilization of harmful compounds (metals, pesticides, dyes etc…) (Directive 2011/65/EU, 2011). This is the case of lead-based compounds whose use is currently prohibited. Therefore, contemporary research is now focused on the discovery of new environmentally friendly materials that could be as efficient as the lead compounds used in the manufacture of electronic devices. In this view, specific interest has been devoted to the ferroelectric materials with highly polarized network. This is the case of ferroelectric compounds containing the lone pair cation Bi3+ ions, which are distinguished by the presence of lone paire electron. Indeed, in these ferroelectric materials, the internal dipole field can cause a separation of the electron/hole (e−/h+) pairs the reduction and the reduction / oxidation reactions, thus improving the separation of the charge carriers. In fact, the intrinsic spontaneous polarization induces macroscopic charges on the material surface, which are composed by free carriers and defects in the bulk ferroelectric (internal screening) and/or by charged molecules adsorbed by the environment (external screening) (Yang et al., 2005). Such behavior is desirable for photo-electrochemical applications (Burbure et al., 2010a,b; Giocondi and Rohrer, 2001). In addition, the recent literature indicates that the combined ferroelectric / photoelectrochemical properties could strongly improve the photocatalytic performance (Lin et al., 2007). Besides, the separation of charge carriers is due to the influence of the ferroelectric nature on the bending of the bands, which helps to inhibit the recombination of (e−/h+) pairs, almost similar to the p-n junction of a typical photovoltaic or diode structure. Indeed, ferroelectric materials mask the surface depolarization field by developing strong Stern layers with chemisorbed molecules (Cui et al., 2013).
BaTiO3 (BT) has deserved a particular attention in this field and a tetragonal / cubic transition occurs at a critical particle size of 0.12 µm at room temperature (RT), and the Curie temperature (TC) drops below room temperature at the critical particle size. Therefore, both the non-ferroelectric-cubic and the tetragonal-ferroelectric phases coexist at RT. Thus, BT acts only as a traditional wide band gap semiconductor under UV light excitation (Uchino et al., 1989). Several works have been conducted in order to improve the photocatalytic properties of BT, where the tetragonal phase has better catalytic activity than cubic one (Kappadan, 2016). Further, the photocatalytic performance is improved through the development of a nanostructured metallic coating of Ag on its surface. Alternatively, BT-based ferroelectric relaxers endorse interesting photoelectrochemical characteristics combined with ferroelectric ones (Boutal et al., 2014; Kerfah et al., 2011; Bensemma et al., 2018; Haddadou et al., 2018a) and Qi et al. reported 15% degradation of Rhodamine B (Rh B) solution onto the relaxer BaBi4Ti4O5 under UV–Vis irradiation (Qi et al., 2019). Owing to its electropositive character, Bismuth in the relaxor Ba0.785Bi0.127Y0.017TiO3 leads to a weaker covalency of Ti–O bond and therefore a destabilization of the conduction band (CB) (π*Ti-O) (Kerfah et al., 2011). It is interesting to mention that the BT based materials showed a photocatalytic efficacy upon ultraviolet light (Tang et al., 2004; Reddy et al., 2016) and the statistical fluctuations of ions in A and/or B sites improve the ferroelectric and photoelectric properties. In this work, we emphasis the investigations of photoelectrochemical properties of lead-free ferroelectric composition Ba0.925Bi0.05□0.025(Ti0.65Zr0.30Sn0.05)O3 (abbreviated BBiTZS).
The present composition is distinguished by the dual substitution in the A-site (Ba-Bi) and B-site (Ti-Zr-Sn) which improves the relaxor effect and stimulates the phase transition diffuse character. In addition, the presence of Bi3+ with 6 s2 lone pair contributes favorably to the photocatalytic activity (Wang and Wang, 2012; Ai et al., 2014). In addition, the ferroelectric materials with a relaxor behavior has an extended depletion width, an attractive property for the photo-electrochemical applications (Li et al., 2009; Yang et al., 2006). In this paper, we present a selected relaxor ferroelectric composition (x = 0.05 and y = 0.30) to appreciate its photoelectrochemical behavior. This composition belongs respectively to the solubility domain of Bi in BBiTZS and to the relaxor ferroelectric domain.
The Rhodamine B (Rh B), employed as tracer in water, was selected to evaluate the photoactivity of BBiTZS. It is also used as a staining fluorescent dye tunable at 610 nm. It is suspected to be carcinogenic and its elimination is of high priority. In this regard, the advanced oxidation processes (AOPs) are well known for the dyes degradation under soft conditions, yielding to a high mineralization. In this regard, wide band gap ferroelectrics were successfully used for the generation of (e−/h+) pairs, involved in the reactive radicals O2• and/or OH• respectively in the conduction band (CB) and valence band (VB) with a high oxidative power.
2 Experimental procedure
2.1 Materials preparation
Pure powders of BaCO3, Bi2O3, TiO2, ZrO2, and SnO2 (all Sigma Aldrich) were used as starting materials; they were previously dried at 200 °C (3 h) to eliminate the adsorbed water. The ceramic of composition Ba0.925Bi0.05□0.025(Ti0.65Zr0.30Sn0.05)O3 have been prepared by solid-state reaction, as described below:
0.925 BaCO3 + 0.025 Bi2O3 + 0.65 TiO2 + 0.30 ZrO2 + 0.05 SnO2 →
2.2 Characterization
However, the identification of the phase, the related symmetry and the unit-cell parameters were achieved using a D8 Advance X-ray diffractometer (Vantack detector). The data were collected at room temperature using CuKα1+2 radiation in the 2θ range (10–80°). Scanning electron microscopy (SEM) of the ceramic was obtained with a Philips XL30 microscope. The Raman spectrum was plotted with an Yvon Jobin T64000 spectrometer using Ar excitation laser line (514.5 nm).
The thermal dependence of the dielectric properties was performed in the temperature (100–450 K) and frequencies (102–06 Hz) ranges thanks to a Solartron Impedance Analyzer SI 1200.
The photo electrochemistry was studied in a conventional cell with Pt as auxiliary electrode and SCE as reference in neutral medium (Na2SO4, 0.1 M); the intensity-potential J(E) were plotted at a scan rate of 10 mV s−1 while the capacitance was measured against the potential at a constant frequency of 10 kHz. The photocatalytic experiments were carried out in a batch mode in an open Pyrex reactor, exposed to direct sunlight. The solubility of Rh B in water is relatively high (∼15 g/L). The powder catalyst (50 mg) was suspended in 100 mL of Rh B solution at a concentration of 50 mg/L at pH 7, with a dark adsorption duration of 30 min. The powder was centrifuged (3000 rpm, 15 min.) after each test to separate the powder from the electrolyte for the chemical analysis. The greatest sensitivity detection limit improves both the selectivity and resolution between the investigated compounds and degradation products. UV–Visible spectrophotometry (λmax = 554 nm) was used to measure the remaining Rh B concentration (Ct).
3 Results and discussion
3.1 Microstructural study
Fig. 1 (a Inset) shows the microstructure of BBiTZS. The grains appear in square shape arranged with each other leading to few vacant spaces, giving rise to a high microstructural density. The histogram of grain distribution reveals small sizes within this ceramic (0.3–0.8 μm). Tang et al. (2004) reported the grain size influence on the Ba (Ti1−yZry)O3 system. They showed that the coarse-grained sample undergoes a structural phase transition, instead to a relaxor-like behavior for the fine-grained sample. As BBiTZS is distinguished by small grain sizes, we expected that it would behave as a relaxor ferroelectric as confirmed by the dielectric measurements (see below).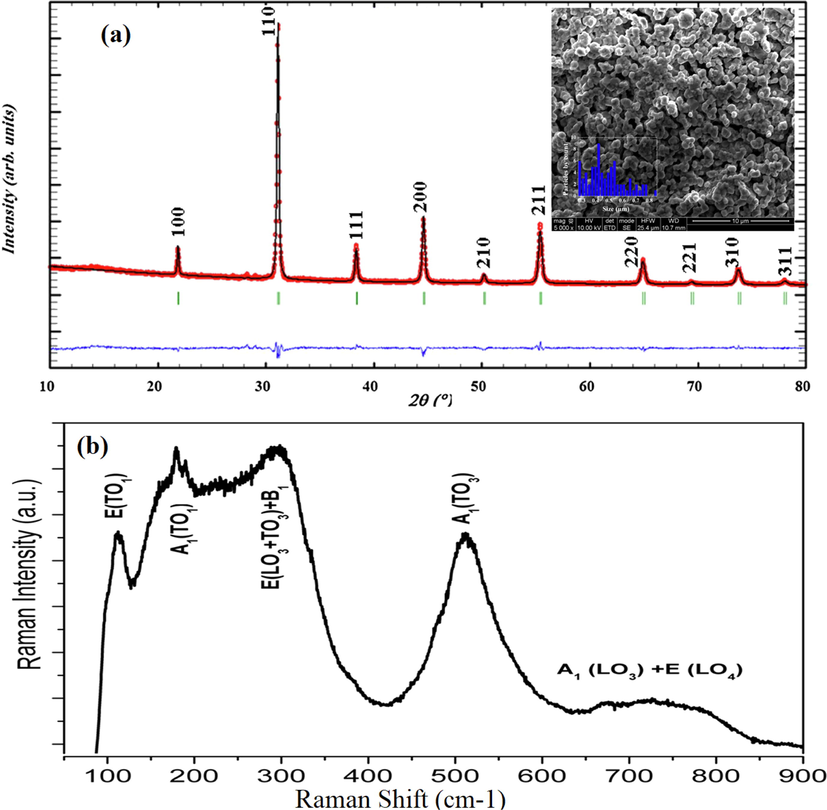
Rietveld refinement and microstructure (Inset a) and Raman spectrum (b) for BBiTZS room temperature.
3.2 Room-temperature X-ray diffraction
The single phase formation of the BBiTZS sample was confirmed by XRD analysis at room temperature. The Rietveld refinement and calculation reliability factors were determined in the cubic symmetry (Pm
m, JCPDS N°75-0461) using the Fullprof software (Boultif and Loueer, 1991) integrated in the Win PLOTR program (Rodríguez-Carvajal, 2002) where all the reflection peaks are indexed. A perfect agreement is observed between the observed XRD patterns and fitted data (Table 1). Moreover, the agreement between the observed and calculated inter-planer spacing suggests a cubic symmetry at room temperature.
2θobs[°]
2θcal[°]
hkl
dcal[Å]
Iobs/I0[%]
Ical/I0[%]
21.853
21.868
100
4.0609
6
9
31.110
31.12
110
2.8715
100
100
38.359
38.36
111
2.3446
16
15
44.587
44.59
200
2.0305
33
35
50.185
50.19
210
1.8161
5
5
55.375
55.37
211
1.6579
36
34
64.896
64.89
220
1.4358
17
18
69.370
69.37
221
1.3536
2
2
73.719
73.71
310
1.2842
15
14
77.980
77.97
311
1.2244
3
4
Table 2 gathers the lattice parameters and refinement reliability factors obtained by the Rietveld refinement in comparison with those of BT. The fitting parameters (RB, RF, Rwp and χ2) indicate good agreement between refined and observed XRD and confirm the cubic symmetry.
Compounds
a = b = c (Å)
V(Å3)
Space group
RB
RF
Rp
Rwp
χ2
BBiZTS
4.0627 (1)
67.06
Pm
m
0.0540
0.756
9.19
7.81
1.37
BaTiO3 (T)
3.9945
64.36
Pm
m
–
–
–
–
Table 3 assembles the refined atomic positions, occupancy and isotropic atomic shift parameters of BBiZTS composition. As it can be seen, Ba2+ and Bi3+ are located in the same A-site with a fractional percentage. In addition, Ti4+/Zr4+/Sn4+cations located in the B-sites are connected with the oxygen atoms to form (Ti4+/Zr4+/Sn4+)O6 octahedra sharing corners. In addition, relatively good reliability factors (compared to standard values) are in the range of disordered perovskites with a tolerance factor below unity (Cross, 1994).
Atom
Site
x
y
Z
B(Å)
Occupancy
Ba/Bi
1a
0
0
0
0.69 (4)
0.8921/0.0478
Ti/Zr/Sn
1b
½
½
½
0.75 (4)
0.6505/0.300/0.05
O
3c
½
½
0
0.98 (6)
3.064
3.3 Raman analysis
The Raman spectrum of BBiTZS (Fig. 1b) confirms the observed active modes in the cubic symmetry, in agreement with the relaxor ferroelectric compositions. The assignment of the Raman modes is carried out by analogy with the Ba1−xBi xTi1−xYbx/2Fex/2O3 and BaZrxTi1-xO3 (Schileo et al., 2013; Dobal et al., 2001). The spectrum consists of six distinguished modes 110, 186, 256, 301, 518 and 720 cm−1 according respectively to the following modes: E(TO1), A1(TO1), A1(TO2), E(TO2), A1(TO3) and A1(LO3) + E(LO). The A1TO2 mode tends to disappear while the modes A1(LO3) + E(LO) become wider. These observations are related to the fact that BBiZTS is in its paraelectric (cubic) phase at RT. We recall that the cubic -paraelectric phase allows 12 optical modes (3F1u + F2u) that are not Raman active However, for BBiTZS, the activation modes are caused by a considerable structural disorder characterizing the ferroelectric relaxor (Dobal et al., 2001). The RT Raman study about the influence on the structural transition has been reported in detail in our previous work (Haddadou et al., 2018b; Smail, 2020).
3.4 Dielectric studies
3.4.1 Thermal variation of dielectric permittivity
The thermal variation relative permittivity (ε′r) and dielectric losses (tg δ) of BBiTZS at various frequencies exhibit a single broad peak with a frequency dispersion compatible with a relaxor ferroelectric behavior (Fig. 2). Indeed, ε′r increases gradually to a maximum value ε′rmax with increasing temperature and then decreases smoothly indicating a phase transition. ε′rmax and the corresponding temperature maximum (Tm) depend upon the measurement frequency. Indeed, BBiTZS exhibits a broad peak with a maximum ε′rmax that decreases with increasing frequency. In addition, the temperature related to this maximum (Tm) shifts toward higher values as the frequency increases. All these dielectric characteristics agree with the ferroelectric relaxor behavior. Generally, the broadening of the dielectric peaks is attributed to some structural disorder generated by the compositional fluctuation in the crystalline network as can be considered for the present sample.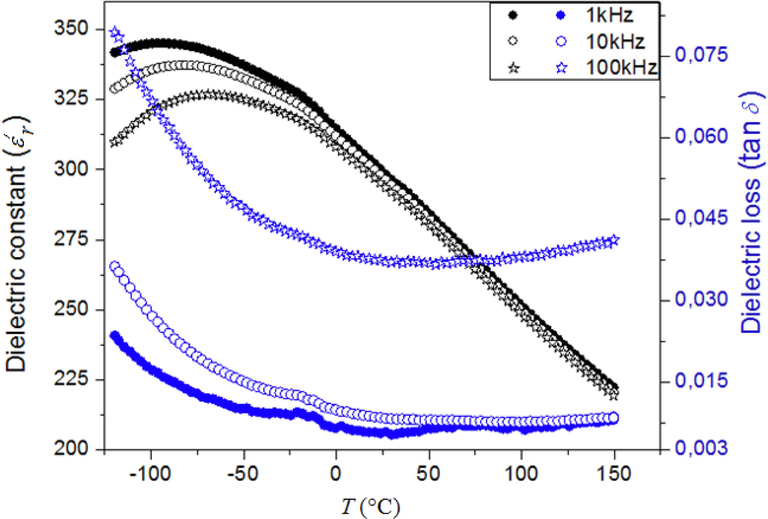
Thermal evolution of the dielectric constant and dielectric losses at various frequencies for BBiTZS.
3.4.2 Ba2+/Bi3+substitution effect on the dielectric properties
BBiTZS may show a variety of defects imputed to different mechanisms. For instance, it could be related to apparent oxygen vacancies due to Bi2O3 volatility. Indeed, the order–disorder behavior in the complex perovskites (AA′)(BB′)O3 has been largely studied. The statistical fluctuations of ions in the A and/or B sites produce a local heterogeneity leading to ferroelectric compounds with a large variation of the temperature TC (Schileo et al., 2013). Concerning BBiZTS, Bi3+ behaves as donor level. Thence, charge disproportionality may arise while replacing Ba2+ by Bi3+ according the following equation (in Kroger-Vink notation):
3.4.3 Deviation from Curie-Weiss law in BBiTZS
The dielectric constant of a normal ferroelectric obeys the Curie Weiss (C-W) law in the paraelectric phase. The following relation expresses this:
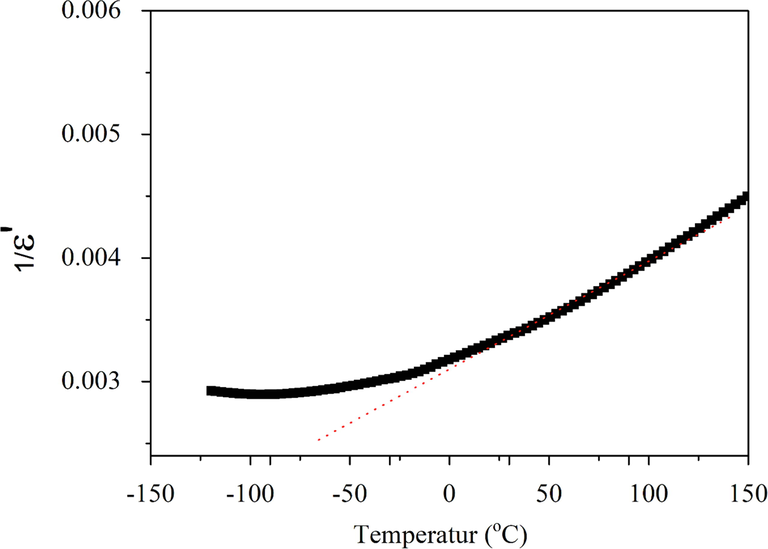
Thermal variation of the inverse of the real part of the relative permittivity (ε′−1) at 1 kHz for BBiTZS ceramic.
parameters
Tm (°C)
T0(°C)
Tdev (°C)
C.10−5(°C)
ΔTm (°C)
ΔTmf (°C)
Δε′r/ε′r
tg (δ)
γ
BBiTZS
−88
−261
83
1.09
171
16
0.045
345
0.016
1.80
It should be noted the low values of Tm and ε′rmax are certainly related to the dual association of Zr4+ and Sn4+ in the B site of BBiTZS. Indeed, it is well-known that the addition of Zr to BaTiO3 leads to a relaxor effect and the temperature Tm decrease as the content of Zr increases (Ciomaga et al., 2007). The same behavior occurs when Sn substitutes Ti in BaTiO3 (Jiwei et al., 2005; Xiaoyong et al., 2003). As the amount of Sn increases, the temperature of the ferroelectric-paraelectric transition decreases and the phase transition becomes more diffuse over a broad temperature range. Consequently, the combination of Zr and Sn to replace partially Ti leads to a synergistic phenomenon causing a large decrease in Tm. We observe for BBiTZS where the high quantity of Zr (0.30) gives rise to a very low temperature (Tm = − 88 °C), far from room temperature.
3.4.4 Diffuse phase transition parameters of BBiTZS
Likewise, in order to quantify the diffuse phase transition nature within BBiTZS, we determined the diffusivity coefficient (γ) from the following relation (Uchino and Nomura, 1982):
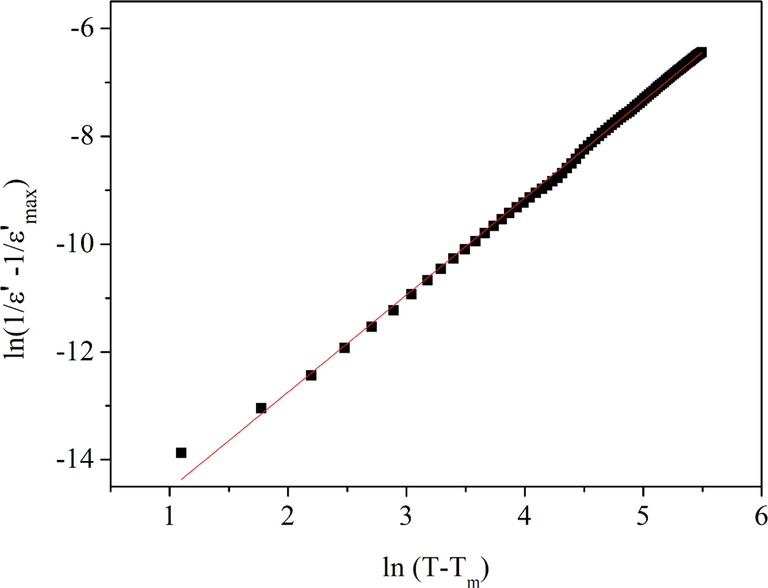
Curves ln(1/εr − 1/εmax) versus ln(T-Tmax) at 1 kHz for BBiTZS composition.
3.4.5 Relaxor characteristics of BBiTZS
The relaxor ferroelectric behavior is marked by the frequency dependence of Tm and ε′r. This typical comportment is evaluated from ΔTmf and Δε′r/ε′r:
The frequency dispersion is more significant as ΔTmf and Δε′r/ε′r are higher. Δε'r/ε'r (=0.045) indicates a weak relaxor behavior for the BBiTZS while the absence of frequency dispersion corresponds to Δε'r/ε'r = 0.
3.4.6 The Vogel-Fülcher (V-F) analysis
The strong frequency dependence of Tm is supported by the curve ln f vs. Tm (Fig. 5). The nonlinear behavior indicates that the data cannot be adjusted with the Debye equation. To analyze the principal relaxation features of this composition, the curve was fitted by the Vogel–Fülcher (V-F) equation (Viehland et al., 1991)
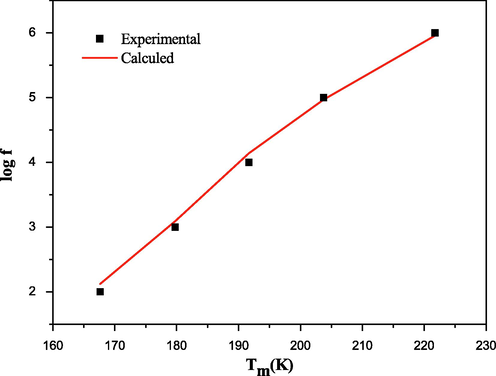
Plot of ln(f) as a function of Tm for BBiTZS composition (the symbols: experimental data; the solid curve: fitting to the Vogel– Fulcher relation).
The V-F equation models the shift of Tm toward low values of frequencies. The close agreement of the data for BBiTZS with the V-F relationship suggests a relaxor behavior. The modeling parameters by the V-F relation confirm this assertion and attribute this effect to the presence of polar nano regions in the crystal lattice. These adjusted parameters are: Ea = 0.112 eV, Tg = 195 K and fo = 1.26 × 10⁷ Hz.
It is helpful to outline that the compounds BBiTZS have a similar behavior to that of Ba(Ti1-yZry)O3 solid solutions (0.26 ≤ y ≤ 0.40) (Laulhé, 2007). For these latter, it has been evidenced that the ZrO6 and TiO6 octahedra were deformed with a particular impact on the direction of local dipole moments carried by Ti4+ cations. A random distribution of the cations leads to a local polarization that would be at the origin of the frequency dispersion observed experimentally. All the ferroelectric features mentioned above are promising for photocatalytic applications.
3.5 Impedance spectroscopy
The impedance spectroscopy is performed to study the relationship between the microstructure and electrical properties in the temperature range (RT − 100 °C). Fig. 6 presents the frequency dependent real and imaginary part of the impedance at various temperature (22–80 °C) for Ba0.925Bi0.05(Ti0.65Zr0.30Sn0.05)O3. From the figure, we can observe the occurrence of the relaxation frequency for BBiTZS between 104 and 105 Hz. In the view to extract information on the resistive properties of the ceramic, we plotted the Cole-Cole plot of the impedance formalism at different temperatures (Fig. 6). We can observe from the plot, well-resolved semi-circles for the studied temperatures. Besides, the radius of the semi-circles decreases as the temperature increases, which demonstrates the semiconducting nature of our sample (Wang et al., 2017). By the use of a model (Fig. 6c), we could fit the collected data. Our proposed model includes a serie resistance (R1), in addition to the bulk contribution (R2, C2). Besides, a departure from the ideal Debye behaviour was observed and better fitting results were obtained by introducing constant phase element (CPE) in the circuit (Benyoussef et al., 2020) and Table 5 regroups the electrical parameters. We can observe that the bulk resistance decreases as the temperature increases, which demonstrates the Negative Temperature Coefficient of Resistivity of our studied ceramic. Fig. 6d shows the logarithmic scale of the dc conductivity versus 1000/T for our sample. The plot is observed to be linear and follows an Arrhenius equation
(Lanfredi et al., 2000). The activation energy of the system was found to be 0.016 eV.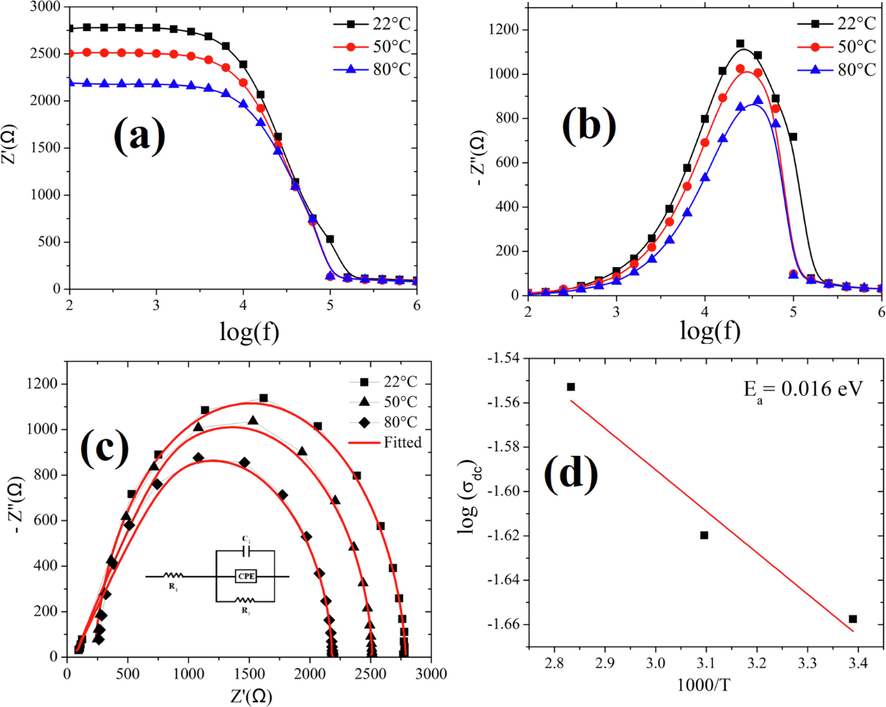
(a) Real impedance Zʹ(f) curves, (b) Imaginary impedance Z″(f) curves of BBiTZS system at different temperatures, (c) Fitted Cole-Cole plots at different temperatures. The inset presents the model used to fit the BBiTZS system, (d) The Arrhenius plots of BBiTZS system. The activation energy extracted from the dc conductivity (at 10 kHz).
T (°C)
R1 (ohm)
R2 (ohm)
C2 (F)
22
223
2566
1.17 10−9
50
240
2272
1.12 10−10
80
252
1936
1.03 10−10
3.6 Electrochemical and photocatalytic properties
The optical characterization of BBiTZS is elucidated from the diffuse reflectance. The photon energy (hν,) absorption coefficient (α) and gap (Eg) are related by the equation (Rekhila et al., 2018):
The exponent m = 2 and 0.5 are respectively for indirect and direct transitions. The intersection of the line (αhv)0.5 with the abscissa axis yields the Eg value of the perovskite (2.00 eV) (Fig. 7). The defect states and grains boundaries have no influence on the thermo-power (S) unlike the conductivity (SM 1); the negative value implies that the free carriers are electrons. The non-dependence of S with temperature indicates thermal activation of the electronic concentration with a constant mobility (=360 µV K−1), the S-value is compatible with an order of magnitude of the electrons density (ND) of ∼1019 cm3 (see below).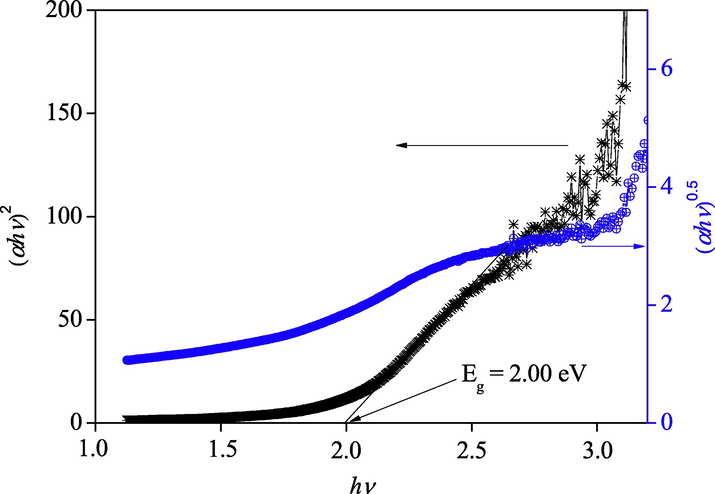
The indirect (αhν)0.5 and direct (αhν)2 optical transitions of BBiTZS.
The electrochemistry is of high importance for predicting the electrochemical reactions; the profile of the intensity-potential J(E) profile of BBiTZS (Fig. 8) shows a little hysteresis with a decomposition voltage greater than 3 V, characteristic of high over voltages. The reduction peak at −0.5 V on the reverse scan indicates an irreversible process. Below ∼−1.2 V, the current increases continuously with no plateau region, due to hydrogen liberation. The small exchange current Jo (0.2 μA cm−2) and the polarization resistance (=10.7 kΩ cm2) indicate a long-lived material (Fig. 8 Inset). For zero potential, the current density (Jo) is similar to an electron transfer rate constant.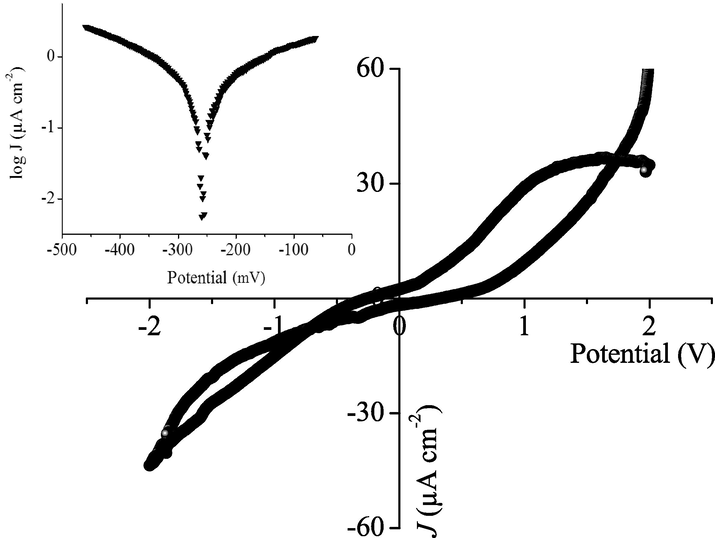
The intensity–potential characteristic of BBiTZS in Na2SO4 electrolyte. Inset: the semi-logarithmic plot.
The flat band potential (Efb) is a key parameter in photoelectrochemistry, and it can be determined from the capacitance plot; its value (−0.56 V) is calculated by extrapolating the line (CSC−2 − E) to infinite capacitance (CSC−2 = 0). (Fig. 9). The energy diagram of the junction BBiTZS/solution, plotted from the photoelectrochemical characterization, predicts from a thermodynamic point of view the degradation of Rh B upon solar irradiation. The Rh B mineralization occurs by the reactive radicals OH• and O2•− respectively in the valence band (VB = 2.04 V) and conduction band (CB = -0.49 V); both the levels OH•/H2O and O2/O2•− are inside of the band gap (Roumila et al., 2016).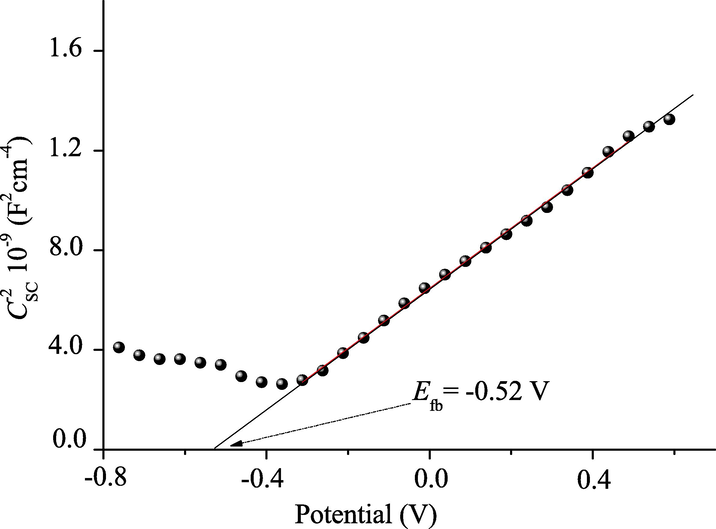
The Mott–Schottky plot of n-type BBiTZS in neutral solution.
The EIS spectrum of the interface BBiTZS/Na2SO4 electrolyte was plotted once the free potential stabilized; it shows a semicircle at high frequencies ascribed to the charge transfer (SM 2). The impedance of the system is governed by the extension of the space charge region and the wide diameter is equal to the bulk resistance of the material R (27 kΩ cm2) and the center positioned at −9° below the real axis, suggests an electron hopping by overcoming a low potential barrier. CP) is inserted to account for the non-ideality of the capacity (Aroutiounian et al., 2007; Aroutiounian et al., 2006):
As noted in the introduction, Rh B is a hazardous dye and its elimination is strongly motivated. The perovskite BBiTZS is promising in such a case owing to its attractive features i.e electronic bands appropriate localized and a gap Eg sensitive to the UVA of the solar irradiance. The following sequences can be used to involve Rh-B mineralization via a photo-catalytic process:
Rh B is attacked by oxidative species (O2•−, •OH), resulting in a partial mineralization to CO2 and H2O (Bagtache et al., 2016). Fig. 10a illustrates the degradation mechanism on BBiTZS, which does not produce intermediate products, indicating that their concentrations are below the detection threshold of the spectrophotometer. Fig. 10b gives the photocatalytic evolution of Rh B conversion (10 mg L−1) at various catalyst quantities. The decay in absorbance at 554 nm (λmax) over the illumination time indicates a first order kinetic with a half-life of 90 min and a conversion yield of 50%.![(a) The UV–Visible spectra of RhB solutions on BBiTZS over illumination time. (b) The kinetic plot ln Co/C vs. time. Experimental conditions: catalyst dose: 1 g/L; [RhB]o = 10 mg/L; V(solution) = 100 mL.](/content/184/2022/15/5/img/10.1016_j.arabjc.2022.103744-fig10.png)
(a) The UV–Visible spectra of RhB solutions on BBiTZS over illumination time. (b) The kinetic plot ln Co/C vs. time. Experimental conditions: catalyst dose: 1 g/L; [RhB]o = 10 mg/L; V(solution) = 100 mL.
A comparison of the dye degradation with other relevant studies is reported in SM 3. One can conclude that the photoactivity of acceptable, compared with some previous studies, and BBiTZS could be used in photocatalysis.
4 Conclusion
In the summary, Ba0.925Bi0.05(Ti0.65Zr0.30Sn0.05)O3 (BBiTZS) has been synthesized by solid state reaction and characterized by XRD, dielectric measurements and Raman spectroscopy. The Rietveld structural refinement at room temperature revealed a cubic perovskite structure. The dielectric properties showed a diffuse phase transition and ferroelectric relaxor behavior. This result was confirmed to the presence of a local structural disorder in the paraelectric phase due to the simultaneous incorporation of Bi3+ in the A-site and (Zr-Sn)4+ in the B site, corroborated by the Raman spectroscopy. The energy diagram showed the potentiality of the lead-free ceramic BBiTZS for the photocatalytic applications because of the extended space charge region and environmentally friendly characteristic. The material showed a good Rh B photodegradation, and the conversion was followed by UV–Visible spectroscopy. On solar light, a conversion of 50% was determined in Rh B solution (10 mg L−1) within 90 min., and the kinetic followed a first order model.
Declaration of Competing Interest
The authors declare that they have no known competing financial interests or personal relationships that could have appeared to influence the work reported in this paper.
References
- Efficient photocatalytic removal of nitric oxide with hydrothermal synthesized Na0.5Bi0.5TiO3 nanotubes. J. Alloy. Compd.. 2014;613:260-266.
- [Google Scholar]
- Switching properties of self-assembled ferroelectric memory cells. Appl. Phys. Lett.. 1999;75(8):1158-1160.
- [Google Scholar]
- Photoelectrochemistry of semiconductor electrodes made of solid solutions in the system Fe2O3–Nb2O5. Sol. Energy. 2006;80(9):1098-1111. Available from:
- [Google Scholar]
- Photoelectrochemistry of tin-doped iron oxide electrodes. Sol. Energy. 2007;81:1369-1376.
- [Google Scholar]
- Synthesis and semiconducting properties of Na2MnPO4F. Application to degradation of Rhodamine B under UV-light. Mater. Sci. Semicond. Process.. 2016;51:1-7.
- [CrossRef] [Google Scholar]
- Photoelectrochemical properties of lead-free ferroelectric ceramic Ba(Ti0.96Mg0.013Nb0.026)O3: application to solar conversion of eosin. J. Mater. Sci: Mater. Electron. 2018
- [CrossRef] [Google Scholar]
- Complex impedance and Raman spectroscopy of Na0.5(Bi1-xDyx)0.5TiO3 ceramics. Ceram. Int.. 2020;46:10979-10991.
- [CrossRef] [Google Scholar]
- Indexing of powder diffraction patterns for low-symmetry lattices by the successive dichotomy method. J. Appl. Crystallogr.. 1991;24(pt 6):987-993.
- [Google Scholar]
- Relaxor ferroelectric and photo-electrochemical properties of lead-free Ba1-xEu2x/3(Ti0.75Zr0.25)O3ceramics. Application to chromate reduction. Sol. Energy. 2014;99:291-298.
- [Google Scholar]
- Photochemical reactivity of titania films on BaTiO3 substrates: Influence of titania phase and orientation. Chem. Mater.. 2010;22(21):5831-5837.
- [Google Scholar]
- Photochemical reactivity of titania films on BaTiO3 substrates: Origin of spatial selectivity. Chem. Mater.. 2010;22(21):5823-5830.
- [Google Scholar]
- Preparation and characterization of the Ba(Zr, Ti)O3 ceramics with relaxor properties. J. Eur. Ceram. Soc.. 2007;27:4061-4064.
- [CrossRef] [Google Scholar]
- Effect of Ferroelectricity on Solar-Light-Driven Photocatalytic Activity of BaTiO3: Influence on the Carrier Separation and Stern Layer Formation. Chem. Mater.. 2013;25:4215-4223.
- [Google Scholar]
- Directive 2011/65/EU of the European Parliament and of the Council of 8 June 2011 on the Restriction of the Use of Certain Hazardous Substances in Electrical and Electronic Equipment Text with EEA Relevance, 2011. http://data.europa.eu/eli/dir/2011/65/oj/eng.
- Micro-Raman scattering and dielectric investigations of phase transition behavior in the BaTiO3–BaZrO3 system. J. Appl. Phys.. 2001;89:8085-8091.
- [CrossRef] [Google Scholar]
- Spatial Separation of Photochemical Oxidation and Reduction Reactions on the Surface of Ferroelectric BaTiO3. J. Phys. Chem. B.. 2001;105(35):8275-8277.
- [Google Scholar]
- Photoelectrochemical properties of the relaxor Ba(Ti0.90Sc0.05Nb0.05)O3: application to the degradation of amoxicillin under solar light. J. Mater. Sci.: Mater. Electron. Springer, US. 2018;29(6):5042-5048.
- [CrossRef] [Google Scholar]
- Structural, vibrational and dielectric investigations of Ba0.925Bi0.05(Ti0.95−xZrx)Sn0.05O3 ceramics. J. Mater. Sci.: Mater. Electron. 2018
- [CrossRef] [Google Scholar]
- Tetragonal BaTiO3 nanoparticles: An efficient photocatalyst for the degradation of organic pollutants. Mater. Sci. Semicond. Process.. 2016;51:42-47.
- [Google Scholar]
- Relaxor ferroelectric and photocatalytic behaviour of Ba0.785Bi0.127Y0.017TiO3composition. Sol. Energy. 2011;85(3):443-449.
- [Google Scholar]
- Electric and dielectric properties of Bi12TiO20 single crystals. J. Appl. Phys.. 2000;88:283.
- [CrossRef] [Google Scholar]
- Laulhé, C., 2007. Zr B. Structure locale dans un ferroélectrique relaxeur : BaTi1-x Zr xO3 To cite this version : HAL Id : tel-00196922.
- Photocatalytic hydrogen production from aqueous methanol solutions under visible light over Na(BixTa1-x)O3. Int. J. Hydrogen Energy. 2009;34:147-152.
- [Google Scholar]
- Photocatalytic activities of heterojunction semiconductors Bi2O3/BaTiO3: A strategy for the design of efficient combined photocatalysts. J. Phys. Chem. C. 2007;111(49):18288-18293.
- [Google Scholar]
- Influence of Eu doping on the structural, electrical and optical behavior of Barium Zirconium Titanate ceramic. Ceram. Int.. 2018;44:1817-1825.
- [CrossRef] [Google Scholar]
- Lanthanum substituted bismuth titanate for use in non-volatile memories. Nature. 1999;40:682.
- [Google Scholar]
- Relaxor ferroelectric and photocatalytic properties of BaBi4Ti4O15. Adv. Appl. Ceram. 2019:1-7.
- [CrossRef] [Google Scholar]
- ScienceDirect highly efficient hydrogen production using Bi2O3/TiO2 nanostructured photocatalysts under led light irradiation. Materials Today: Proc.. 2016;3(6):1351-1358.
- [Google Scholar]
- Hydrogen production under visible illumination on the spinel NiMn2O4 prepared by sol gel. Solar Energy. 2018;166:220-225.
- [CrossRef] [Google Scholar]
- Rodríguez-Carvajal, J., 2002. An Introduction ToThe PROGRAM (2001), 1–139.
- Semiconducting properties of hydrothermally synthesized libethenite application to orange G photodegradation. Mater. Sci. Semicond. Process.. 2016;41:470-479.
- [CrossRef] [Google Scholar]
- Structure – property relationships in BaTiO3–BiFeO3–BiYbO3. Ceramics. 2013;33:1457-1468.
- [Google Scholar]
- Structural, dielectric, electrocaloric and energy storage properties of lead free Ba0.975La0.017(ZrxTi0.95-x)Sn0.05O3 (x = 0.05; 0.20) ceramics. Mater. Chem. Phys.. 2020;252:123462.
- [Google Scholar]
- Effects of grain size on the dielectric properties and tunabilities of sol-gel derived Ba(Zr0.2Ti0.8)O3 ceramics. Solid State Commun.. 2004;131(3–4):163-168.
- [Google Scholar]
- Relaxor behavior of (Ba, Sr)(Zr, Ti)O3 ferroelectric ceramics. Solid State Commun.. 2005;136(2):89-93.
- [Google Scholar]
- Critical exponents of the dielectric constant in diffusedphase-transition crystals. Ferroelectr. Lett.. 1982;44:55e61.
- [Google Scholar]
- J. Am. Ceram. Soc.. 1989;72:1555-1558.
- Dielectric relaxation and Maxwell-Wagner interface polarization in Nb2O5 doped 0.65BiFeO3–0.35BaTiO3 ceramics. J. Appl. Phys.. 2017;121:084103.
- [CrossRef] [Google Scholar]
- Evolution of the structure, dielectric and ferroelectric properties of Na0.5Bi0.5TiO3-added BaTiO3–Bi(Mg2/3Nb1/3)O3 ceramics. Ceramics International. 2020;46:25392-25398.
- [CrossRef] [Google Scholar]
- Photocatalytic hydrogen production from aqueous solutions over novel Bi0.5Na0.5TiO3 microspheres. Int. J. Hydrogen Energy. 2012;37(4):3041-3047.
- [Google Scholar]
- A-site compositional modulation in barium titanate based relaxor ceramics to achieve simultaneously high energy density and efficiency. J. Eur. Ceramic Soc.. 2021;41:6474-6481.
- [Google Scholar]
- Dielectric relaxation behavior in barium stannate titanate ferroelectric ceramics with diffused phase transition. Appl. Phys. Lett.. 2003;83(10):2031-2033.
- [Google Scholar]
- Photo electron emission microscopy of polarity-patterned materials. J. Phys.: Condens. Matter. 2005;17 S1415
- [Google Scholar]
- Structure and photocatalytic property of perovskite and perovskite-related compounds. Mater. Chem. Phys.. 2006;96(2–3):234-239.
- [Google Scholar]
Appendix A
Supplementary material
Supplementary data to this article can be found online at https://doi.org/10.1016/j.arabjc.2022.103744.
Appendix A
Supplementary material
The following are the Supplementary data to this article:Supplementary data 1
Supplementary data 1


