

Translate this page into:
Remediation of Cd2+ in aqueous systems by alkali-modified (Ca) biochar and quantitative analysis of its mechanism
⁎Corresponding author at: Institute of Resources, Ecosystem and Environment of Agriculture and Center of Biochar and Green Agriculture, Nanjing Agricultural University, 1 Weigang, Nanjing 210095, China. lqli@njau.edu.cn (Lianqing Li)
-
Received: ,
Accepted: ,
This article was originally published by Elsevier and was migrated to Scientific Scholar after the change of Publisher.
Abstract
Co-pyrolysis of straw and Ca(OH)2 is a feasible modification method to improve the adsorption capacity of biochar for Cd. However, few studies have quantitatively analyzed the contribution of different adsorption mechanisms of alkali-modified biochar. In this study, the alkali-modified (Ca) biochar were prepared by co-pyrolyzing lime (Ca(OH)2) and soybean straw (SBB) or rape straw (RSB) at 450 °C. The adsorption mechanism was investigated by a series of experiments and was provided by quantitative analysis. The maximum adsorption capacities of Cd2+ by Ca-SBB and Ca-RSB were calculated to be 78.49 mg g−1 and 49.96 mg g−1, which were 1.56 and 1.48 times higher than SBB (50.40 mg g−1) and RSB (33.79 mg g−1), respectively. Compared with the original biochar (SBB, RSB), alkali-modified biochar (Ca-SBB and Ca-RSB) were found to have faster adsorption kinetics and lower desorption efficiencies. The mechanism study indicated that Ca(OH)2 modification effectively enhanced the contribution of ion exchange and decreased the contribution of functional groups complexation. After Ca(OH)2 modification, precipitation and ion exchange mechanisms dominated Cd2 + absorption on Ca-SBB, accounting for 49.85% and 34.94% of the total adsorption, respectively. Similarily ion exchange and precipitation were the main adsorption mechanism on Ca-RSB, accounting however for 61.91% and 18.47% of total adsorption, respectively. These results suggested that alkali-modified biochar has great potential to adsorp cadmium in wastewater.
Keywords
Biochar
Cadmium
Alkali modification
Adsorption mechanism

1 Introduction
Cadmium (Cd) is one of the most toxic inorganic pollutants in wastewater and soil because of its strong migration and enrichment ability, which causes severe damage to human health (Patar et al., 2016). Several technologies have been used to remove Cd from wastewater and soil solution such as precipitation, complexation and adsorption (Bolan et al., 2014; Fu and Wang 2011). Considering the removal efficiency, easy operation and secondary pollution, the best method was considered to adsorption (Burakov et al., 2018).
Biochar, a solid product prepared by biomasses pyrolysis under oxygen-limited conditions (Lehmann 2007), has been reported to sequestrate carbon, improve soil quality and increase crop yield (Lehmann 2007; Woods et al., 2006; Zhang et al., 2010). The deepening of biochar research revealed its great potential in the treatment of heavy metal pollution in water and soil, due to its well-developed pore structure, generally high pH, abundant oxygen-containing functional groups and mineral components (Ahmad et al., 2014; Bian et al., 2014; Li et al., 2017). Cd absorption capacity of biochar estimated to be 0.3–39.1 mg g−1 (Inyang et al., 2016). Biochar soil amendment was found consistently and significantly to increase soil pH and decrease soil extractable Cd over a 3-year period experiment (Bian et al., 2014). Based on the current research, the Cd2+ adsorption mechanisms on biochar included metal ion exchange, mineral precipitation, functional groups complexation and Cd2+-π coordination (Trakal et al., 2014; Wang et al., 2018; Yu et al., 2018; Zhang et al., 2015).
Though biochar is an environmentally friendly adsorbent for Cd removal from water, the Cd2+ absorption capacity of biochar is generally lower compared with other bio sorbents such as activated carbon (Inyang et al., 2016; Wilson et al., 2006). In order to improve its adsorption performance, it is necessary to modify it through loading with minerals, organic functional groups, nano-particles and activation with alkali solutions (Ahmed et al., 2016). In all modification methods, loading minerals on the surface of biochar is the most promising one, combining the advantages of biochar and minerals (Tan et al., 2016). Lime (Ca(OH)2) is the most common amendment used to remove Cd2+ from wastewater and soil solution, due to its affordable price and availability (Fu and Wang 2011). Therefore, in order to reduce the cost and improve the Cd adsorption performance, co-pyrolysis of straw and Ca(OH)2 is a feasible and easy-to-operate method. Biochar prepared by co-pyrolysis of Ca(OH)2 and sludge improved the surface area, DOC content and alkalinity (Ren et al., 2018). However, there is still a lack of quantitative research on the relative distribution of Cd2+ adsorption mechanisms in alkali-modified biochar.
In this study, the alkali-modified biochar were prepared by co-pyrolyzing lime (Ca(OH)2) and straw (rape straw or soybean straw), and were then used to quantify Cd2+ adsorption and reveal its binding mechanism. The purposes of the study are 1) to investigate the Cd adsorption performance and the contribution of different binding mechanisms of alkali-modified biochar produced from rape straw and soybean straw, respectively; and 2) to compare the different response to Cd2+ adsorption by two kinds of alkali-modified biochar.
2 Materials and methods
2.1 Materials
Rape straw and soybean straw were collected from an agricultural market in Nanjing. All chemicals were of analytical grade and all solutions were made with deionized water (DI). Cadmium nitrate (Cd(NO3)2·4H2O) and sodium nitrate (NaNO3) were purchased from Aladdin Biochemical Technology Co., Ltd, Shanghai, China. Lime (Ca(OH)2) was purchased from Xilong Scientific Co., Ltd, Guangdong, China.
2.2 Biochar preparation
The dried rape and soybean straw were placed in a stainless steel reactor and heated in a muffle furnace under oxygen-limited condition at 450℃ for 2 h. The biochar originated from rape straw and soybean straw were referred to as RSB and SBB, respectively. The alkali-modified biochar were prepared by heating rape straw or soybean straw together with lime (Ca(OH)2) at 450 °C for 2 h. Specifically, alkali-modified biochar were originated from rape straw or soybean straw mixed with Ca(OH)2 in a ratio of 1:0.028 (straw/Ca, w/w). The alkali-modified biochar derived from rape straw and soybean straw were referred to as Ca-RSB and Ca-SBB, respectively. The tested biochar were ground and passed through 0.5-mm sieve for later testing. The biochar samples were demineralized by rinsing with 1 M HCl followed by washing with DI until the pH became constant (Wang et al., 2015).
2.3 Characterization of biochar
Biochar pH values were measured using a digital pH meter with a water-biochar ratio of 20:1 (v: m), and the solutions were subsequently analyzed for electrical conductivity (EC) using a conductivity meter (DDS-307A, Rex Shanghai). Cation exchange capacity (CEC) was analyzed using ammonium acetate exchange method by flame spectrophotometer (Gaskin et al., 2008), and dissolved organic carbon (DOC) was measured by total organic carbon analyzer (TOC) (Jena Multi N/C 2100) at a ratio of 1.0 g biochar in 20 mL DI water after 24 h equilibrium. Total C, H and N contents of biochar were determined by an elemental analyzer (Vario EL cube). The content of K, Ca, Na, Mg, P and S was determined after digesting 0.2 g biochar with Nitric acid (HNO3) and perchloric acid (HClO4) (85v: 15v) by inductively coupled plasma-optical emission spectroscopy (ICP-OES) (Agilent 710). Specific surface area and pore properties of biochar were measured by N2 adsorption isotherms at 77 K with the Brunauer-Emmett-Teller (BET) method using a surface area and porosity analyzer (Micromeritics Tristar II 3020, USA). The characteristics of biochar are given in more details in Table S1.
The surface structure and morphology of all biochar samples were observed with a Scanning Electron Microscope (SEM, ZEISS GeminiSEM 500). Surface element analysis was conducted simultaneously with the SEM at the same surface locations using energy dispersive X-ray spectroscopy (EDS, AZtec X-Max 50). X-ray diffraction (XRD) patterns were collected using a powder X-ray diffractometer (XRD, X ‘Pert MPD) to determine possible mineral formation within the biochar. Fourier-transform infrared (FTIR) spectra (Nicolet 8700) were also collected in the 400–4000 cm−1 range to identify the organic functional groups present in the biochars’ surface.
2.4 Sorption experiments
Cadmium stock solution (1000 mg L−1) was prepared by dissolving cadmium nitrate (Cd(NO3)2·4H2O) in 0.01 mol L−1 NaNO3 solution. Adsorption kinetics experiments were carried out by adding 0.1 g biochar samples to 25 mL solutions containing 100 mg L-1 Cd2+ agitated at a speed of 180 rpm. Each sample was extracted at different time intervals (5, 15, 30, 60, 120, 240, 480 and 720 min). Sorption kinetics were evaluated at room temperature (25 °C) and the initial pH value was adjusted to 5.0 ± 0.05 by adding 0.1 M HNO3 or 0.1 M NaOH. Adsorption isotherm experiments were studied with initial Cd2+ concentrations in the range of 10–300 mg L−1 at pH 5.0 for 12 h. Previously Cd-loaded biochar were shaken with 25 mL of 0.1 mol L−1 NaNO3 solution as desorbing agent at 25 °C for 12 h. The final suspensions were filtered by 0.45 µm filter papers and the supernatant solution was separated for analysis of Cd2+ using flame atomic absorption spectrophotometer (FAAS, Persee A3, Beijing). Finally, the equilibrium sorption capacity Qe (mg g−1), the equilibrium desorption capacity Qd (mg g−1) and the desorption rate (% desorption) were calculated according to the following equations:
where C0 and Ce are the initial and equilibrium concentration (mg L−1) during adsorption, and Cd0 and Cde are the initial and equilibrium concentration (mg L−1) during desorption, respectively. V is the volume (L) of the metal ion solution, and m is the mass (g) of biochar.
The adsorption kinetic was modeled by pseudo-first-order (Eq. (4)), pseudo-second-order (Eq. (5)) and particle diffusion kinetic equations (Eq. (6)), and the adsorption isotherm was simulated using Langmuir (Eq. (7)) and Freundlich (Eq. (8)) isotherm models:
where Qe and Qt are the adsorption capacity (mg g−1) at equilibrium and time t, respectively. k1 (h−1), k2 (mg g-1h−1) and Kp (mg g-1h−0.5) indicate the rate constants corresponding to the respective kinetic model. Ce is the residual Cd2+ concentration (mg L-1) at equilibrium. Qmax is the maximum adsorption capacity (mg g−1); B (L mg−1) and K (L g−1) are the rate constants corresponding to the respective isotherm model, and n represents the degree of nonlinearity between solution concentration and adsorption.
2.5 The contribution of different adsorption mechanisms
As described in Section 2.4, 0.05 g untreated-biochar and demineralized biochar were mixed with 25 mL solutions containing 250 mg L-1 Cd2+, respectively. After adsorption, the concentrations of K+, Ca2+, Na+, Mg2+ and Cd2+ in the filtrate were measured by fire photometer and FAAS. The biochar loaded with and without Cd2+ were prepared for a series of analysis such as SEM-EDS, XRD and FTIR. The adsorption capacity due to mineral precipitation (Qcmp), cation exchange (Qcme), functional groups complexation (Qco), Cd2+-π coordination (Qcπ) and the total Cd adsorption capacity (Qct) were calculated according to Wang et al., (2015) and Cui et al., (2016). In more details:
-
Most of minerals in biochar were removed by using 1 M HCl solution. The adsorption capacity due to minerals Qcm (mg g−1) was calculated as the difference in adsorption capacity of Cd2+ between untreated and demineralized biochar (Eq. (9)).
where Qcm(mg g−1) is the amount of Cd2+ sorption attributed to the interaction with minerals, Qct (mg g−1) is the total sorption of Cd2+ on untreated biochar, Qca (mg g−1) is the amount of sorbed Cd2+ on demineralized biochar, Y is the yield of demineralized biochar from original biochar.
-
Qcme was estimated by the net release of cations (K+, Ca2+, Na+, Mg2+) in solution before and after adsorption (Eq. (10)).
where QK, QCa, QNa, QMg are the adsorption capacity by net release amount of K+, Ca2+, Na+ and Mg2+ during the Cd adsorption process, respectively (mg g−1).
-
Cd2+ sorption on minerals was the result of ion exchange and mineral precipitation together, thereby Qcmp could be calculated by the difference between Qcm and Qcme value:
-
Qco was calculated by the difference in the pH value of demineralized biochar before and after the adsorption:
where Qco1 is the Cd2+ adsorption capacity by complexation with functional groups on demineralized biochar (mg g−1).
Cd2+ absorption on demineralized biochar was the result of interaction between Cd2+-π interaction and functional group complexation, so Qcπ could be obtained by the Qca value deducted the Qco value:
In addition, the contribution percentage of different mechanisms to the Cd2+ sorption was calculated using the Qcme/Qt, Qcmp/Qt, Qco/Qt and Qcπ/Qt ratio.
2.6 Statistical analysis
All the experiments were conducted in triplicates. Test data are expressed as mean ± standard deviation and use Origin 2020b software to draw graphics. The significant difference was compared with the least square mean student’s t (P < 0.05) by JMP 11.0 (two-tailed).
3 Results
3.1 Cd2+ absorption on biochar
3.1.1 Kinetics of Cd2+ absorption on biochar
The Cd adsorption kinetics were presented in Fig. 1 and Table 1. SBB reached the maximum adsorption capacity within 8 h. Compared with SBB, Ca-SBB had a faster adsorption rate for Cd and reached equilibrium within a few minutes (Fig. 1a). Similarly, the Cd2+ absorption on Ca-RSB raised rapidly in the first 30 min and reached adsorption equilibrium faster than RSB (Fig. 1b). Note: Qe are the calculated data (mg g−1); k1, k2, kp is the rate constant for pseudo-first-order model (h−1), pseudo-second-order model (g mg-1h−1) and particle diffusion equation (mg g-1h−0.5).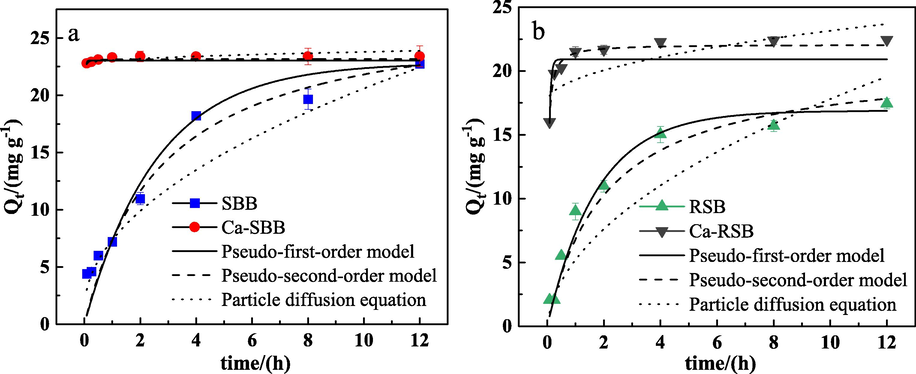
Sorption kinetic of Cd2+ on SBB, Ca-SBB (a) and RSB, Ca-RSB (b), respectively. Qt (mg g−1) is the amount of metal adsorbed per unit weight of adsorbent.
Biochars
Pseudo-first-order model
Pseudo-second-order model
Particle diffusion equation
Qe
k1
R2
Qe
k2
R2
kp
R2
mg g−1
h−1
mg g−1
g mg-1h−1
mg g-1h−0.5
SBB
24.07
0.356
0.986
26.98
0.016
0.997
6.86
0.983
RSB
16.33
0.509
0.965
18.51
0.040
0.974
5.24
0.927
Ca-SBB
23.31
38.50
0.445
23.34
17.87
0.999
0.824
0.561
Ca-RSB
21.58
15.60
0.831
22.28
1.343
0.981
1.40
0.548
The pseudo second order kinetic model matched the kinetic adsorption process of the tested biochar better with the highest R2 value (0.974 ≤ R2 ≤ 0.999) (Table 1). The pseudo second order rate constant (k2) for Ca-SBB and Ca-RSB were 1117 times and 34 times higher than that for SBB and RSB, respectively.
3.1.2 Isotherms of Cd2+ sorption on biochar
The adsorption isotherms of Cd2+ were illustrated in Fig. 2. At low Cd2+ concentrations, a sharp slope appeared. After that, the biochar became saturated reaching steady state conditions.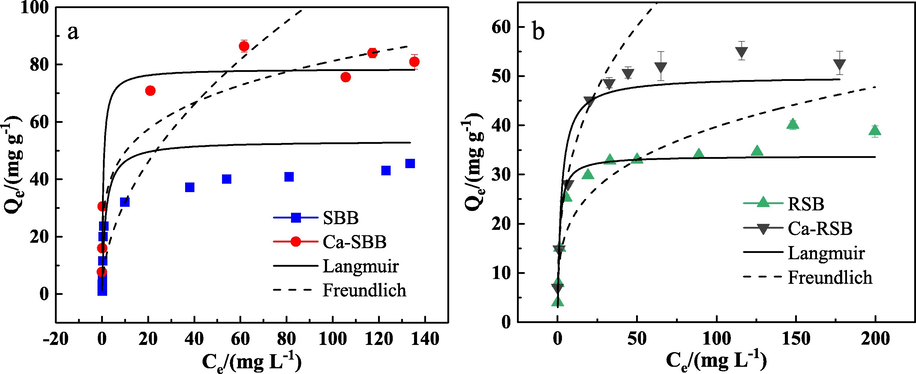
Sorption isotherm of Cd2+ on SBB, Ca-SBB (a) and RSB, Ca-RSB (b), respectively. Qe (mg g−1) is the absorption capacity at equilibrium; Ce (mg L-1) is the equilibrium solution concentration.
The fitted parameters reported in Table 2 indicated that, the equilibrium sorption data of SBB and Ca-SBB well fitted to the Langmuir model with R2 values than the Freundlich model. In particular, the Qmax value for Ca-SBB was 1.56 times larger than that for SBB. However, in the cases of the biochar samples RSB and Ca-RSB, both the Langmuir and Freundlich models display high R2 (>0.98) values. The Langmuir maximum sorption quantity (Qmax) of Cd2+ for Ca-RSB was about 1.48 times greater than that for RSB. Note: Qmax is the maximum adsorption capacity (mg g−1); B is the Langmuir constant concerned with the Cd absorption energy (L mg−1); N is the Freundlich constant concerned with surface heterogeneity; K is the Freundlich constant concerned with the Cd absorption capacity.
Biochars
Langmuir parameters
Freundlich parameters
Qmax
mg g−1
B
L mg−1
R2
1/n
K
R2
SBB
50.40
0.641
0.959
0.52
9.59
0.601
RSB
33.79
0.845
0.996
0.27
11.63
0.994
Ca-SBB
78.49
1.70
0.983
0.22
30.09
0.941
Ca-RSB
49.96
0.435
0.990
0.34
15.86
0.983
3.1.3 Desorption
The distribution of desorption rates of Cd2+ was illustrated in Fig. 3. Compared to SBB and RSB, the average desorption efficiencies for Ca-SBB and Ca-RSB obtained with 0.1 mol L−1 NaNO3 solution specifically decreased by 97.4% and 98.2%, respectively.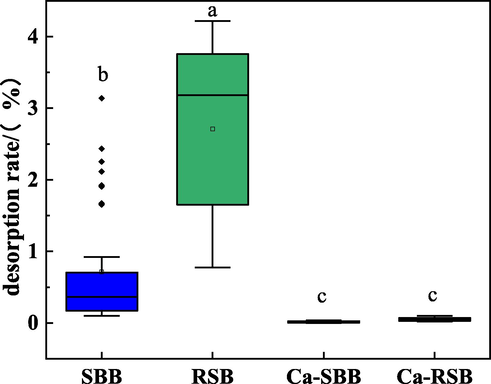
The distribution of desorption rates of Cd2+ onto biochar.
3.2 Relative distribution of adsorption mechanisms
As shown in Fig. 4 and Table S2, Qcmp formed the biggest fraction in SBB, followed by Qco and Qcme, with 43.24%, 25.93% and 21.14% compared to the total adsorption, respectively. Conversely, Qcme accounted for the largest part in RSB, followed by Qcmp , with 43.00% and 31.69% in comparison with the total adsorption, respectively. After Ca(OH)2 modification, the Qcme value of Ca-SBB and Ca-RSB specifically increased by 162.0% and 217.4% compared to SBB and RSB, respectively. The contribution of Qcme to the total absorption of Ca-SBB and Ca-RSB increased from 21.14% and 43.00% to 34.93% and 61.91%, respectively. Moreover, Qcmp of Ca-SBB was the dominant value, since it increased by 82.73% compared to SBB. However, Qcmp value of Ca-RSB decreased by 23.50% compared to RSB. Furthermore, Qco value of Ca-SBB and Ca-RSB decreased by 13.14% and 15.74% compared to SBB and RSB, respectively. Still and all, the Qcπ value of Ca-SBB decreased significantly compared to that of SBB, while the Qcπ value of Ca-RSB increased significantly compared to that of RSB.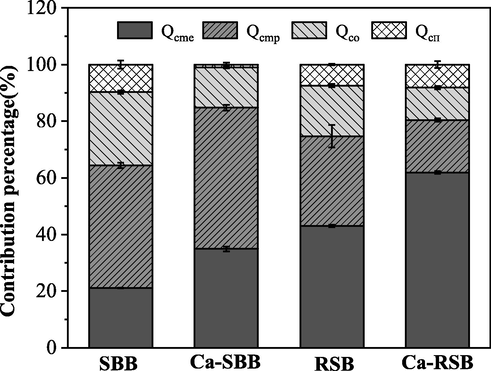
The contribution percentage of different mechanisms to Cd2+ sorption on biochar.
4 Discussion
The isotherm results indicated that SBB had greater adsorption capacity and lower desorption efficiency than RSB. The isotherm adsorption data of SBB conformed to Langmuir model, while that of RSB fitted both Langmuir and Freundlich model. It indicated that the Cd2+ adsorption on SBB followed a monolayer absorption mechanism, while on RSB it was not just monolayer, but it followed a multilayer absorption (Li et al., 2017). The Freundlich constant 1/n is concerned with the surface inhomogeneity of the adsorbent. When 1/n is less than one, it is good for chemical adsorption, otherwise it is good for physical adsorption(Lin et al., 2017). Because the 1/n value of RSB was 0.27, chemisorption was dominant in RSB.
In SBB, Qcmp accounts for the largest proportion, followed by Qco and Qcme. Qcme contributed the most to the total adsorption of Cd2+ in RSB, followed by Qcmp. The tested biochar were scanned by XRD, SEM-EDS and FTIR before and after Cd2+ adsorption. Peaks of CdCO3 were found in XRD after Cd2+ adsorption both in SBB and RSB, indicating that the major precipitate was CdCO3 (Fig. 5). Likewise, compared with SBB and RSB, white granular crystals were found in the SEM image of SBB + Cd and RSB + Cd, and elements detected by EDS spectrum mainly included Cd, C, O and Ca (Fig. S1).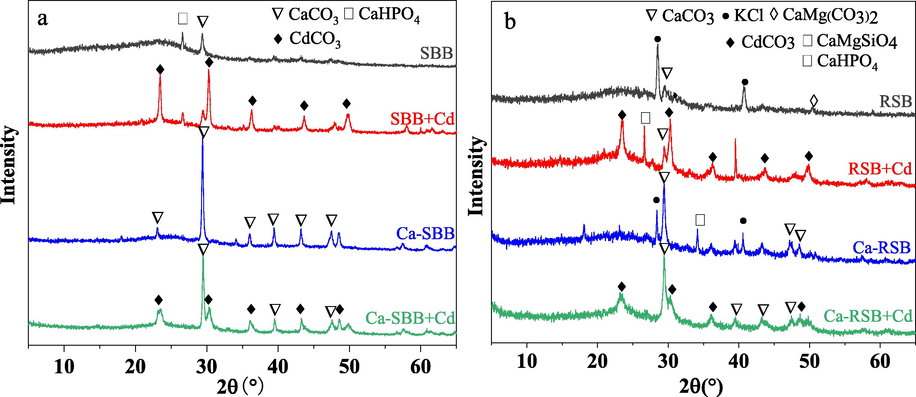
XRD spectra of SBB, Ca-SBB (a) and RSB, Ca-RSB (b) before and after Cd2+ adsorption, respectively.
Metal ions on the surface of the biochar can be directly electrostatically adsorbed, or form complexes with oxygen-containing functional groups (e.g., –COOM+, –OM+, –COOMOOC–, –OMO–), or form precipitates with anions (e.g., CaCO3) (Yang et al., 2019). These ions could be exchanged with Cd2+ during the sorption process. In RSB, the dominance of K+ were released, since the proportion of K+ contribution was 87.0% to Qcme in RSB. The total amount of K in RSB was 3.06 times larger than that in SBB (Table S1). Both XRD (Fig. 5) and SEM-EDS results (Fig. S1) also demonstrated that RSB was rich in K. Similar findings have been reported, suggesting the significance of ions exchange in Cd2+ adsorption (Huang et al., 2020; Zhang et al., 2015). Remarkably, ion-exchange has been reported to contribute up to 79.5% of Cd sorption by hyacinth biochar (Zhang et al., 2015) and up to 44.49% by rice-husk biochar (Huang et al., 2020).
In addition, the oxygen-containing functional groups on the surface of biochar can adsorb cadmium through complexation (Xia et al., 2019). FTIR was adopted to study the changes of functional groups before and after Cd2+ adsorption (Fig. S2). In general, the large peak at 3400 cm−1 was H-bonded OH and the intense peak at 1600 cm−1 was esters C = O or aromatic C = C. The peak of 1090 cm−1 was most probably concerned with lignin derivative C-O. In addition, the peak of 1270 cm−1 was most probably concerned with carboxyl O-H, while the peak at 1385 cm−1 was related to phenolic O-H (Drosos et al., 2014). The carboxyl O-H and phenolic O-H of SBB and RSB decreased after Cd adsorption. Besides, the Cd2+ coordination with π-bonds such as –CH and C = C was also the reason for Cd2+ adsorption on biochar (Wu et al., 2019). The peak of 1450 cm−1 was related to aliphatic C-H and the one of 1350 cm−1 was possibly attributed to methyl C-H (R-O-CH3) (Drosos et al., 2009; Drosos et al., 2014; Sui et al., 2020). The contribution of Qcπ to total absorption of SBB and RSB were 9.69% and 7.44%, respectively (Fig. 4), indicating that Cd2+-π coordination influenced the Cd2+ adsorption mechanisms.
The isotherm results also indicated that compared with the original biochar (SBB, RSB), alkali-modified biochar (Ca-SBB and Ca-RSB) had greater adsorption capacities, faster adsorption kinetics and lower desorption efficiencies. Cai et al. (2021) mixed oiltea camellia shells and Na2SiO3·9H2O solids with a mass ratio of 3:1 to prepare the silicate-modified biochar and found adsorption capacity for Cd increased by 1.93 times. Compared with our study, Ca(OH)2 modification could improve the adsorption capacity of original biochars with smaller mineral additions. Ding et al. (2016) indicated that alkali-modified (NaOH) biochar exhibited more extensive (2.6–5.8 times) metal adsorption capacities than the pristine hickory chip biochar. Bashir et al. (2018) found that the sorption of Cd on KOH-modified biochar roughly doubled as opposed to pristine rice straw biochar. However, although NaOH and KOH modification could significantly improve the adsorption capacity of biochar, Ca (OH)2 modification has a lower cost. In addition, excessive Na+ is harmful to soil structure. Biochar modification with Ca(OH)2 is more friendly to the environment.
It was interesting that the response mechanism of the two kinds of straw biochar to alkali modification was different. Ca(OH)2 modification both effectively enhanced the adsorption capacity resulted from ion exchange mechanism on SBB and RSB (Fig. 4 and Table S2). Cation exchange capacity (CEC) is a major indicator of Cd2+ adsorption when ion exchange is the predominant mechanism(Yang et al., 2019) . Higher CEC was obtained in alkali-modified biochar than the original biochar (Table S1). Consistently, good correlation was observed between Qcme and CEC (Fig. S3). The dominance of Ca2+ was found in Ca-SBB and Ca-RSB, since the contribution proportions of Ca2+ in Ca-SBB and Ca-RSB were 37.9%, 70.7% to Qcme, respectively, higher than that in SBB and RSB (Table S3). Alkali-modified biochar also contained more Ca than the original biochar (Table S1). Moreover, metal ion exchange formed the biggest fraction in RSB and Ca-RSB. The Ca(OH)2 modification improved the ion exchange of biochar and the mineral precipitation of Ca-SBB, which may be the reason for the extremely low desorption rate of Ca-SBB and Ca-RSB (Fig. 3).
After Cd2+ adsorption, peaks of CdCO3 were found in Ca-SBB and Ca-RSB (Fig. 5). CdCO3 precipitation was also reported by Cui et al. (2016). Likewise, compared with the original biochar, white granular crystals were observed in the SEM image of Cd-loaded biochar, especially SBB + Cd, Ca-SBB + Cd and Ca-RSB + Cd. Elements detected by EDS spectrum mainly included Cd, C, O and Ca (Fig. S1). In addition, minerals precipitation formed the biggest fraction in SBB and Ca-SBB (Fig. 4 and Table S2). Ca(OH)2 modification effectively enhanced the Qcmp value of SBB. However, the Qcmp value of Ca-SBB decreased significantly compared to that of SBB. Differences of Qcmp between SBB and RSB after modification were related to the elemental and mineral composition differences of RSB and SBB. For example, SBB contained more Ca and soluble CO32– than RSB, while RSB had more K than SBB (Table S1). The XRD patterns indicated that CaCO3 and CaHPO4 were the main crystals in SBB, while KCl and CaCO3 were the main crystals in RSB. After Ca(OH)2 modification, the main compound for Ca-SBB was CaCO3, while for Ca-RSB the main compounds were both CaCO3 and KCl (Fig. 5). SBB had higher pH than RSB. Ca(OH)2 modification effectively enhanced the pH value of SBB, but had no significant effect on RSB (Table S1). The pH value is an important indicator of Qcmp . Consistently, good correlation was observed between Qcmp and pH (Fig. S4).
Ca(OH)2 modification remarkably decreased Qco because of the changes of functional groups such as –OH, and –COOH (Fig. S2). Ca-SBB had less carboxylic OH than SBB, since Ca would bind carboxyl groups. However, it had more phenolic OH than SBB, which revealed structural differences due to the alkali modification. Ca-RSB had less carboxylic OH and phenolic OH than RSB, which showed a difference in structure from SBB and different mechanism of the biochar formation due to the Ca(OH)2 modification. After the Cd2+ interaction, the band intensities of carboxylic OH as well as phenolic OH were decreased for SBB, Ca-SBB and RSB. Therefore, functional groups such as –OH, and –COOH, seem to be mainly responsible for Cd2+ complexation. However, following Cd absorption in Ca-RSB, only the band intensity of phenolic OH was decreased, while carboxylic OH was not reduced further. This finding suggested that Cd application may result in Ca desorption and Cd adsorption in the material but the overall carboxylate binding balance remained unchanged. This result was in line with the adsorption mechanism presented in Table S2, which showed that cation exchange was the main mechanism of Cd binding in Ca-RSB (36.66 mg g−1). The contribution of Qcπ to the total absorption of the tested biochar was in the range of 1.02% to 9.06% (Fig. 4), indicating that Cd2+-π coordination influenced the Cd2+ adsorption. In fact, Qcπ value of Ca-SBB was much lower than that of Ca-RSB (Table S2). The reason for this change was the chemical alteration of RSB after modification as revealed by the C/N ratio differences between RSB and Ca-RSB (Table S1). Actually the C/N ratio for Ca-RSB was almost 2.6 times higher than that of RSB (Table S1). High C/N ratio is the result of a hydrophobic material, not accessible to microbial decay (Brust 2019).
5 Conclusions
Compared with the original biochar (SBB, RSB), alkali-modified biochar (Ca-SBB and Ca-RSB) had greater adsorption capacities, faster adsorption rates and lower desorption efficiencies. The Cd2 + absorption mechanism of the tested biochar mainly included mineral co-precipitation, ion exchange, complexation with functional groups and Cd2+-π coordination. Ion exchange and precipitation mechanisms dominated Cd2 + sorption on RSB, while precipitation and functional groups complexation mechanisms dominated Cd2 + sorption on SBB. After Ca(OH)2 modification, the interaction between Cd2 + and minerals (precipitation and ion exchange) was the main Cd2+ adsorption mechanism on alkali-modified biochar (Ca-SBB, Ca-RSB). In addition, the response mechanism of the two kinds of straw biochar to alkali modification was different. These findings suggest that alkali-modified biochar exhibit a great potential for heavy metal remediation.
CRediT authorship contribution statement
Jingbo Wang: Formal analysis, Writing – review & editing. Yaxin Kang: Formal analysis, Writing – original draft. Huatai Duan: Investigation, Resources. Yi Zhou: Investigation, Resources. Hao Li: Investigation. Shanguo Chen: Investigation. Fenghua Tian: Investigation. Lianqing Li: Methodology, Validation, Writing – review & editing, Funding acquisition, Project administration. Marios Drosos: Writing – review & editing, Formal analysis. Changxun Dong: Formal analysis. Stephen Joseph: Formal analysis. Genxing Pan: Supervision.
Acknowledgements
This study was financially supported by National Natural Science Foundation of China (NSFC) (42077148), National Key Research and Development Program of China (2016YFD0800306) , and Science and Technology Program of Jiangsu (BE2018679).
Declaration of Competing Interest
The authors declare that they have no known competing financial interests or personal relationships that could have appeared to influence the work reported in this paper.
References
- Biochar as a sorbent for contaminant management in soil and water: A review. Chemosphere. 2014;99:19-33.
- [CrossRef] [Google Scholar]
- Progress in the preparation and application of modified biochar for improved contaminant removal from water and wastewater. Bioresour. Technol.. 2016;214:836-851.
- [CrossRef] [Google Scholar]
- Comparing the adsorption mechanism of Cd by rice straw pristine and KOH-modified biochar. Environ. Sci. Pollut. Res.. 2018;25:11875-11883.
- [CrossRef] [Google Scholar]
- A three-year experiment confirms continuous immobilization of cadmium and lead in contaminated paddy field with biochar amendment. J. Hazard. Mater.. 2014;272:121-128.
- [CrossRef] [Google Scholar]
- Remediation of heavy metal(loid)s contaminated soils - To mobilize or to immobilize? J. Hazard. Mater.. 2014;266:141-166.
- [CrossRef] [Google Scholar]
- Management Strategies for Organic Vegetable Fertility. In: Biswas D., Micallef S.A., eds. Safety and Practice for Organic Food. Academic Press; 2019. p. :193-212.
- [CrossRef] [Google Scholar]
- Adsorption of heavy metals on conventional and nanostructured materials for wastewater treatment purposes: A review. Ecotox. Environ. Safe.. 2018;148:702-712.
- [CrossRef] [Google Scholar]
- Silicate-modified oiltea camellia shell-derived biochar: A novel and cost-effective sorbent for cadmium removal. J. Clean Prod.. 2021;281
- [CrossRef] [Google Scholar]
- Potential mechanisms of cadmium removal from aqueous solution by Canna indica derived biochar. Sci. Total Environ.. 2016;562:517-525.
- [CrossRef] [Google Scholar]
- Removal of lead, copper, cadmium, zinc, and nickel from aqueous solutions by alkali-modified biochar: Batch and column tests. J. Ind Eng Chem.. 2016;33:239-245.
- [CrossRef] [Google Scholar]
- H-binding groups in lignite vs. soil humic acids: NICA-Donnan and spectroscopic parameters. J. Colloid Interface Sci.. 2009;332(1):78-84.
- [CrossRef] [Google Scholar]
- H-binding of size- and polarity-fractionated soil and lignite humic acids after removal of metal and ash components. Environ. Sci. Pollut. Res.. 2014;21(5):3963-3971.
- [CrossRef] [Google Scholar]
- Removal of heavy metal ions from wastewaters: A review. J. Environ. Manage.. 2011;92(3):407-418.
- [CrossRef] [Google Scholar]
- Effect of Low-Temperature Pyrolysis Conditions on Biochar for Agricultural Use. Transactions of the Asabe. 2008;51(6):2061-2069.
- [Google Scholar]
- Qualitative and quantitative characterization of adsorption mechanisms for Cd2+ by silicon-rich biochar. Sci. Total Environ.. 2020;731
- [CrossRef] [Google Scholar]
- A review of biochar as a low-cost adsorbent for aqueous heavy metal removal. Crit. Rev. Environ. Sci. Technol.. 2016;46(4):406-433.
- [CrossRef] [Google Scholar]
- Adsorption of Cd(II) from aqueous solutions by rape straw biochar derived from different modification processes. Chemosphere. 2017;175:332-340.
- [CrossRef] [Google Scholar]
- Mechanisms of metal sorption by biochars: Biochar characteristics and modifications. Chemosphere. 2017;178:466-478.
- [CrossRef] [Google Scholar]
- Arsenic removal in aqueous solution by a novel Fe-Mn modified biochar composite: Characterization and mechanism. Ecotox. Environ. Safe.. 2017;144:514-521.
- [CrossRef] [Google Scholar]
- Cadmium pollution and amphibians - Studies in tadpoles of Rana limnocharis. Chemosphere. 2016;144:1043-1049.
- [CrossRef] [Google Scholar]
- Mineral additive enhanced carbon retention and stabilization in sewage sludge-derived biochar. Process Saf. Environ. Prot.. 2018;115:70-78.
- [CrossRef] [Google Scholar]
- Effect of amendment of biochar supplemented with Si on Cd mobility and rice uptake over three rice growing seasons in an acidic Cd-tainted paddy from central South China. Sci. Total Environ.. 2020;709
- [CrossRef] [Google Scholar]
- Biochar-based nano-composites for the decontamination of wastewater: A review. Bioresour. Technol.. 2016;212:318-333.
- [CrossRef] [Google Scholar]
- Geochemical and spectroscopic investigations of Cd and Pb sorption mechanisms on contrasting biochars: Engineering implications. Bioresour. Technol.. 2014;171:442-451.
- [CrossRef] [Google Scholar]
- Investigating the adsorption behavior and the relative distribution of Cd2+ sorption mechanisms on biochars by different feedstock. Bioresour. Technol.. 2018;261:265-271.
- [CrossRef] [Google Scholar]
- Investigating the mechanisms of biochar's removal of lead from solution. Bioresour. Technol.. 2015;177:308-317.
- [CrossRef] [Google Scholar]
- Select metal adsorption by activated carbon made from peanut shells. Bioresour. Technol.. 2006;97(18):2266-2270.
- [CrossRef] [Google Scholar]
- Biochar trials aim to enrich soil for smallholders. Nature. 2006;443(7108):144.
- [CrossRef] [Google Scholar]
- The distribution of Pb(II)/Cd(II) adsorption mechanisms on biochars from aqueous solution: Considering the increased oxygen functional groups by HCl treatment. Bioresour. Technol.. 2019;291:7.
- [CrossRef] [Google Scholar]
- Enhanced adsorption of Pb(II) onto modified hydrochar: Modeling and mechanism analysis. Bioresour. Technol.. 2019;288
- [CrossRef] [Google Scholar]
- Surface functional groups of carbon-based adsorbents and their roles in the removal of heavy metals from aqueous solutions: A critical review. Chem. Eng. J.. 2019;366:608-621.
- [CrossRef] [Google Scholar]
- N-doping effectively enhances the adsorption capacity of biochar for heavy metal ions from aqueous solution. Chemosphere. 2018;193:8-16.
- [CrossRef] [Google Scholar]
- Effect of biochar amendment on yield and methane and nitrous oxide emissions from a rice paddy from Tai Lake plain. China. Agric. Ecosyst. Environ.. 2010;139(4):469-475.
- [CrossRef] [Google Scholar]
- Efficiency and mechanisms of Cd removal from aqueous solution by biochar derived from water hyacinth (Eichornia crassipes) J. Environ. Manage.. 2015;153:68-73.
- [CrossRef] [Google Scholar]
Appendix A
Supplementary material
Supplementary data to this article can be found online at https://doi.org/10.1016/j.arabjc.2022.103750.
Appendix A
Supplementary material
The following are the Supplementary data to this article:Supplementary data 1
Supplementary data 1


