

Translate this page into:
Catechin mediated green synthesis of Au nanoparticles: Experimental and theoretical approaches to the determination HOMO-LUMO energy gap and reactivity indexes for the (+)-epicatechin (2S, 3S)
⁎Corresponding authors. maryamkhaiiat@yahoo.com (Maryam Khayatkashani), salavati@kashanu.ac.ir (Masoud Salavati-Niasari)
-
Received: ,
Accepted: ,
This article was originally published by Elsevier and was migrated to Scientific Scholar after the change of Publisher.
Peer review under responsibility of King Saud University.
Abstract
This work suggests a green method for synthesizing Au nanoparticles (AuNPs) using the aqueous extract of Salix aegyptiaca extract. The mechanism of green synthesized AuNPs was examined by molecular electrostatic potential (MEP) calculations. AuNPs were characterized with different techniques such as Ultraviolet–visible spectroscopy (UV–vis), Fourier-transform infrared spectroscopy (FT-IR) spectroscopy, X-ray diffraction (XRD), and Transmission electron microscopy (TEM). Electrochemical investigation of modified glassy carbon electrode using AuNPs (AuNPs/GCE) shows that the electronic transmission rate between the modified electrode and [Fe (CN)6]3−/4− increased. Process of oxidation, energy gap, and chemical reactivity indexes of the (+)-epicatechin (2S,3S) were investigated using electrochemical techniques (cyclic voltammetry (CV) and differential pulse voltammetry (DPV) as well as UV–Visible spectroscopy and compared with quantum mechanical calculations. DPV and CV were used to obtain HOMO energies of the (+)-epicatechin (2S,3S), an optical energy gap was obtained from the UV–Vis spectroscopy. Frontier molecular orbitals analysis (FMO) and reactivity indexes such as chemical hardness (ŋ), electrophilicity (ώ), electronic chemical potential (μ), electron acceptor power (ώ+), electron donor power (ώ−) were determined with functional theory (DFT) calculations. In summary, the HOMO energy obtained from the experimental analyses (EHOMO (from DPV) = -5.24 eV, and EHOMO (from CV) = -5.28 eV) has a relative agreement with the HOMO energy calculated by B3LYP/6–31 g (d, p) including the solvent effect (water) (EHOMO (from B3LYP) = -5.75 eV). Also, UV–Vis spectroscopy gives the bandgap energy equal to 4.31 eV, while the 4.13 eV is calculated by TD-DFT-b3lyp/6–31 + g(d).
Keywords
Green synthesis
AuNPs
DFT and TD-DFT calculations
Catechin
Electrochemical properties
Salix aegyptiaca

1 Introduction
Green chemistry is a set of aims that decrease the usage production of hazardous material in the design, manufacture, and application of chemical products. Green processes with the usage of eco-friendly, economic, and efficient products are emphasized due to the advantages associated with their applications. Biological routes such as those involving microorganisms and plants are used to synthesize nanoparticles (Kadhem and Al-Nayili, 2021; Al-Nayili, et al., 2021; Ghoreishi et al., 2011; “Green Synthesis, Characterization and Applications of Nanoparticles,” 2019; Singhal et al., 2011). Alkaloids, glycosides, polyphenols, and flavonoids are secondary metabolites in plants, which, due to the influential functional groups and spatial structures, reduce the charged metal salts and synthesize various nanoparticles (Ebrahimian et al., 2020; “Green Synthesis, Characterization and Applications of Nanoparticles,” 2019; Vijayaraghavan et al., 2012; Yuan et al., 2017). Salix aegyptiaca (musk willow), a narrow, round shrub 8 m tall of the Salicaceae family has been widely used in traditional Iranian medicine since antique times. The plant is widespread worldwide, especially in Iran, Iraq, southeast of Turkey, and Azerbaijan (Argus, 2007; Asgarpanah, 2012; Maassoumi, 2009). The biological effects of Salix aegyptiaca extract have been investigated.
Phenolic compounds such as flavonoids and phenolic acid with antioxidant activities have been identified as the main compound in Salix aegyptiaca extract (Sonboli et al., 2010). The hydroalcoholic extract of Salix aegyptiaca was evaluated on anxiety disorders and neuropsychological disorders on the behavior of mice in plus‑maze and the results were comparable to low dose diazepam as a positive control drug. The anxiolytic effects are probably related to the antioxidants, polyphenolic compounds, and flavonoids in the extract (Komaki et al., 2015). In another study, its antioxidant and anti-inflammatory effects were related to the electron donation and antioxidation potential of critical biological compounds of the plant, including polyphenol compounds in the extract (Nauman et al., 2018).
Also, many of these compounds have shown intense anti-cancer properties and were investigated for their effects (Enayat et al., 2013; Enayat and Banerjee, 2014). The attendance of high values of polyphenols and flavonoids such as catechins, epicatechin, epigallocatechin gallate, gallic acid, caffeic acid, quercetin, rutin, and salicin in different parts of catkins, leaves, and bark of Salix aegyptiaca has caused this plant to have a high antioxidant capacity (Enayat and Banerjee, 2009). The main phenolic constituents of Salix aegyptiaca Catkins extract are catechins. Catechins have significant biological effects on the human body. These compounds have potent antioxidant activity and are effective in the biosynthesis of metal nanoparticles (Enayat et al., 2013; Tringali et al., 2001). Catechins protect human skin from the sun's rays by absorbing additional UV rays and reducing the risk of skin cancer. They also prevent pathological skin changes by regulating skin moisture. In addition, catechins affect reducing low-density lipoproteins such as LDL cholesterol.
Electrochemical measurements are necessary to determine parameters such as redox potential, number of electrons transferred, reaction rate constants, etc. Many of these parameters are studied to determine the mechanism of oxidation and reduction of compounds (Arunachalam et al., 2012; Singhal et al., 2011; Usha Rani and Rajasekharreddy, 2011; Wu et al., 2005; Al-Nayili and Albdiry (2021)).
Density functional theory (DFT) can be used to justify quantitative predictions about the behavior of bioactive compounds, such as their chemical reaction or physicochemical properties. So, with this theory, we can make a significant contribution to understanding the biological potencies associated with compounds. DFT method compared to other common methods; In calculating molecular and chemical properties such as geometry, harmonic frequencies, and energies, it shows the best compatibility and accuracy with experimental data (Al-Otaibi et al., 2020; Asadi et al., 2017; Hannah et al., 2000; Sheena Mary et al., 2019).
In this research, we report the synthesis of AuNPs by reducing Au ions using Salix aegyptiaca extract. The synthesis of AuNPs using herbal extracts is an example of a green process. These extracts contain both reducer and stabilizer reagents, which are responsible for the production of AuNPs. Furthermore, differential pulse voltammetry (DPV), cyclic voltammetry (CV), Ultraviolet–visible spectroscopy (UV–Vis), DFT, MP2, and TD-DFT calculations of the redox potentials and structural properties of the (+)-epicatechin (2S,3S) were investigated. We study various ways to obtain experimentally and theoretically the frontier orbitals and HOMO-LUMO bandgap energy and reactivity indexes of the (+)-epicatechin (2S, 3S).
2 Materials and methods
2.1 Materials
HAuCl4·3H2O, KCl, and (K4[Fe(CN)6]/K3[Fe(CN)6) were purchased from Merck. (+)-epicatechin (2S,3S) standard powder was obtained from Sigma Aldrich. Britton Robinson (B-R) buffer comprised H3PO4, CH3COOH, and H3BO3. The pH value was adjusted with NaOH. A stock solution of HAuCl4·3H2O 1 × 10⁻³ M was used all over the experiments.
2.2 Instrumentation
UV–Vis spectra were recorded by SQ-4802 Unico UV–Vis spectrophotometer. FT-IR analyses were carried out by a Perkin-Elmer FT-IR spectrophotometer. X-ray diffraction (XRD) experiments were performed using Rigaku D-max C III, X-ray diffractometer using Ni-filtered Cu Kα radiation (λ = 1.54 nm). The isolation of nanoparticles was carried out using Hettich Universal 320/320R Centrifuge. The nanofluids were sonicated using an ultrasonic homogenizer Sonicator (model Z659142 - Bandelin Sonoplus, SIGMA). A Philips EM208 transmission electron microscope with an accelerating voltage of 200 kV was used to measure the transmission electron microscope (TEM) and ten microliters of this solution were placed in a carbon-plated copper grid. Electrochemical measurements were carried out using a SAMA500, electro analyzer system, Iran. Glassy carbon electrode (GCE) was as the working electrode (0.0314 cm2, Azar Electrode Company, Iran), a platinum electrode as the auxiliary, and a saturated calomel electrode (SCE) as the reference electrode. All experiments used distilled water and were carried out at room temperature.
2.3 Preparation of extract and synthesis of AuNPs
Catkins of Salix aegyptiaca were accumulated from Ghamsar, Kashan, Iran. Morphology of plant materials was identified at the herbarium of the Medicinal Plants of Talae Sabz Tuba pharmaceutical. Then catkins were cleaned all over with sterile deionized water and dried at 37 °C. In a 150 ml Erlenmeyer flask, one gram of dried catkins was added to 100 ml distilled water, and the extraction process was performed at 80 °C by a magnetic heater stirrer for 30 min. The solution was filtered and stored at 4 °C for further experiments. Then the different volume of Salix aegyptiaca extract (8, 10, 12, 14, 16, 18, and 20 ml) was added to a vigorously stirred 30 ml of HAuCl4 (1 × 10⁻³ M) was sonicated with a 45 W 20 kHz ultrasonic pulse for 10 min. The samples were washed twice with distilled water to remove unwanted compounds and centrifuged at 15000 rpm for 15 min. For each experimental condition, at least three measurements were performed to estimate the accuracy and repeatability of the result.
2.4 Assembling of AuNPs/GCE electrode
To assemble GCE/AuNPs, the glassy carbon electrode was washed with distilled water and polished into an alumina suspension (0.5 μm and 0.05 μm) for 10 min. To remove alumina particles and other compounds physically absorbed on the electrode area, GCE was rinsed in water and ethanol for 5 min in the ultrasound bath. Finally, 6 μl of the AuNPs solution was placed at the electrode level and dried for 1 h.
2.5 Computational studies
The molecular structures of (+)-epicatechin (2S,3S) Provided from the Zink database ( https://zinc15.docking.org) (JJ and BK, 2005) and optimized by the semi-empirical PM3MM method. This optimized structure was used for later calculations. Density functional theory (B3LYP, CAM-B3LYP) (Parr, 1980), and Møller Plesset second-order perturbation theory (MP2) were accomplished under 6–311++g(d,p), and 6–31 + g(d) basis set (Becke, 1993), include solvation effect in water, etc (“Becke A.D., Density-functional exchange-energy approximat… - Google Scholar,” n.d.; Lee et al., 1988). Also, time-dependent density functional theory (TD-DFT) were performed by cam-b3lyp/6–311++g (d,p), and b3lyp/6–31 + g(d). All calculations were accomplished using Gaussian 09 W software (Ditchfield et al., 1971).
3 Results and discussion
3.1 Characterization of AuNPs
3.1.1 X-ray powder diffraction (XRD)
The X-ray diffraction pattern with Cu Kα radiation was obtained as a source of X-rays. The diffraction was recorded in interval 2θ = 10–80°. The XRD pattern of AuNPs synthesized with Salix aegyptiaca extract was shown in Fig. 1 According to the JCPDS card NO: 00–004-0784, the presence of reflection peaks appeared at 38.5°, 44.6°, 64.9°, and 77.7°, which correspond to (1 1 1), (2 0 0), (2 2 0), and (3 1 1), confirming the formation AuNPs. Furthermore, the Debye-Scherrer Equation was used to determine the crystal size of AuNPs (Patterson, 1939).
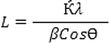 where L is the average of particle size in nm,
 is the Scherrer constant, λ is the wavelength in nm, β is the full width at half maximum of the peak in radian, and θ is half of Bragg angle. The average size of AuNPs by applying the Scherrer equation was 29.20 nm.
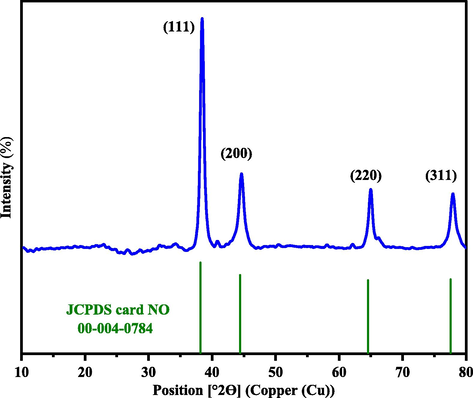
XRD pattern of AuNPs synthesized by salix aegyptiaca.
3.1.2 Transmission electron microscopy (TEM)
TEM image and size distribution of AuNPs synthesized by Salix aegyptiaca were shown in Fig. 2 (a) and Fig. 2 (b), respectively. Based on these analyses, AuNPs show a spherical shape with a mean crystal size equal to 53 nm.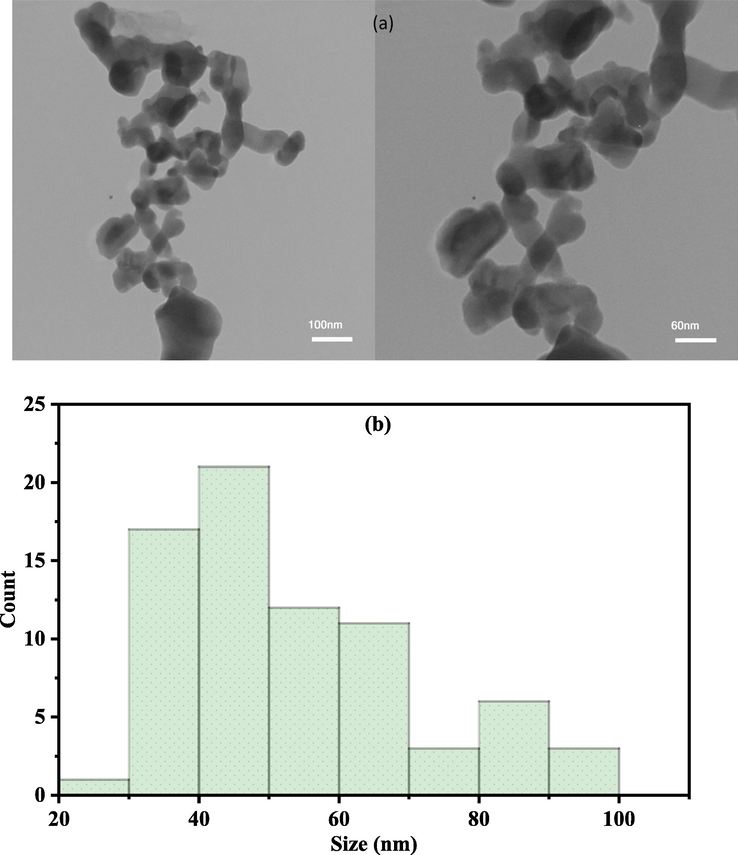
TEM image of AuNPs (a) and histogram of the size distribution (b).
3.1.3 Fourier-transform infrared spectroscopy (FT-IR)
FT-IR spectra of AuNPs synthesized with Salix aegyptiaca extract was recorded at a range of 4000–400 cm−1 and shown in Fig. 3 The absorption band at 3428 cm−1, 2910 cm−1, 2358 cm−1, 1621 cm−1, 1442 cm−1, 1346 cm−1, 1197 cm−1, 1029 cm−1, and 590 cm−1, are related to catechol, salicin, and catechin as the original constituents of the extract and AuNPs. The band at 3428 cm−1 cans tentatively be associated with the O—H stretching and H–bonded. The absorption bands observed in 2910 cm−1, 1621 cm−1 and 1442 cm−1 relate to the C—H, C⚌C double bonds, and C—C stretching in the aromatic ring. Also, the peak appeared at 1346 cm−1, 1197 cm−1, 1029 cm−1, and 590 cm−1 are due to N—O symmetric stretching, C—O stretching, C—N stretching, and Au—O, respectively (Chen et al., 2022; Nagalingam et al., 2018). These functional groups' potency plays the role of synthesizing and stabilizing AuNPs.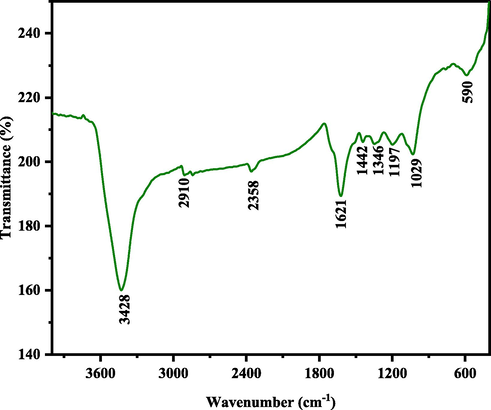
FT-IR spectrum of AuNPs.
3.1.4 Ultraviolet–Visible spectroscopy (UV–Vis)
UV–Vis spectroscopy is an essential method for detecting the formation and stability of AuNPs in an aqueous solution. AuNPs have an absorption peak in the range of 510–550 nm. Fig. S1 (a) shows the UV–Vis spectra of AuNPs at various concentrations of Salix aegyptiaca extract. As seen, for the formation of AuNPs, 30 ml of HAuCl4 1 × 10⁻³ M with different volumes of Salix aegyptiaca extract were used, and the highest absorbance was obtained for the 20 ml extract (Abdelghany et al., 2019; Asnag et al., 2019; Atta et al., 2021). Also, the stability of AuNPs was examined. Fig. S1 (b) shows the UV–Vis spectrum of AuNPs as a function of the time of reaction. As seen, AuNPs were formed after 10 and 15 min, and the colors of nanoparticles were made from violet to red for AuNPs. The stability of AuNPs was investigated for three months in laboratory conditions at 25C and away from sunlight. AuNPs are stable and maintainable.
3.2 Electrochemical study
3.2.1 Surfaces characteristics of modified AuNPs/GCE electrode
Electrochemical impedance spectroscopy (EIS) and cyclic voltammetry (CV) are sensitive and applicable methods for investigating the properties of nanoparticle-modified electrode surfaces. The EIS can investigate changes in the electrode surface that affect the surface resistance. Changes in the electrode surface will change the apparent resistance. Thus, with the information obtained from EIS, surface coating and other kinetic quantities such as charge transfer resistance (Rct) can be obtained. For this purpose, the EIS of the GCE and AuNPs/GCE was obtained in a 0.1 M solution of KCl and the attendance of 5 mM K4[Fe (CN)6]/K3[Fe (CN)6]. To record the spectrum, a potential of 5 mV amplitude was practicable and a wide range of frequencies ranging from 10 kHz to 100 MHz was scanned, then Z' and Z“ were charged and the spectrum (Z' and -Z”) was drawn. With the approximation of the data in the model, constant phase element (CPE), solution resistance (Rs), charge transfer resistance (Rct), and double-layer capacity (Cdl) were evaluated. EIS results obtained from a Nyquist plot showed a significant decrease in Rct at AuNPs/GCE (Fig. 4). As can be seen, AuNPs are adsorbed at the GCE level which is stable and the charge transfer rate is effectively increased and thus the charge transfer resistance (Rct) is reduced. By fitting the Nyquist diagram on equivalent circuit model as [Rs(Q[RctW])], the Rct value for CPE is about 65 Ώ cm2, and it is expected that this amount will be reduced by placing the AuNPs as a modifier on it (44 Ώ cm−2). This means that the enhancement surface of AuNPs/CPE facilitates the electron transfer on the electrode surface. As seen in Fig. 5, the anodic peak current for Fe (CN)63−/4− increased about 1.3 times compared to GCE, while the ΔEp decreased (0.14 V for AuNPs/GCE in comparison to 0.3 V for GCE). The comparison of the peak currents received for the AuNPs/GCE and GC indicates that the AuNPs caused faster charge transfer and electrocatalytic effect at the surface of GCE.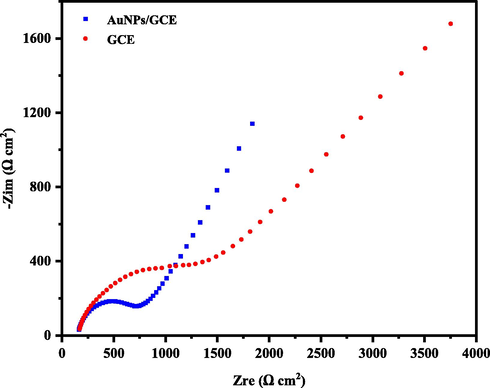
Nyquist plots for GCE and AuNPs/GCE in the presence of 5.0 mM of K4Fe(CN)6/K3Fe(CN)6 in 0.1 M KCl solution, AC amplitude:5.0 mV, DC potential: +250 mV and frequency range: 10 kHz–100 mHz.
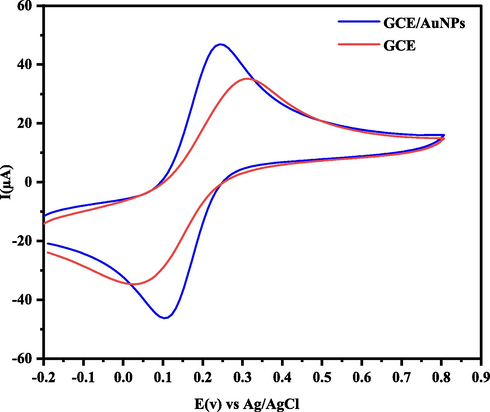
CVs of GCE and AuNPs/GCE in the presence of 5.0 mM of K4Fe(CN)6/K3Fe(CN)6 in 0.1 M of KCl solution and scan rate 0.1 V s−1.
3.2.2 DPV and CV voltammetry study of (+)-epicatechin (2S,3S)
Electrochemical studies were performed using DPV and CV voltammetry to determine the activity of the (+)-epicatechin (2S,3S) in oxidation and reduction reactions. The measurements were carried out on AuNPs/GCE as working electrode, Platin (Pt) as a counter electrode, and saturated calomel as reference electrodes (SCE). Differential pulse voltammetry (DPV) was used to investigate the redox properties of (+)-epicatechin (2S,3S) and to estimate values of the HOMO energy (Fig. 6). Differential pulse voltammograms (DPV) were recorded for the same potential range with a modulation of amplitude (V = 0.09), step potential (mV = 1155) and pulse width of 50 ms (scan rate 0.1 V s−1). Cyclic voltammograms (CV) of 1200 µl of 0.01 M (+)-epicatechin (2S,3S) solution in the buffer pH = 4 were recorded by potentials of 2.0 V in the scan rate of 0.1 V s−1 (Fig. 7).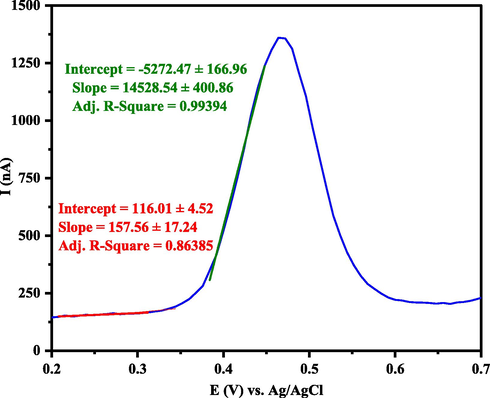
Differential pulse voltammograms (DPV) for (+)-epicatechin (2S,3S) solution that recorded with scan rate 0.1 V s−1 (The point of intersection of the two drawn lines is equal to the onset potential).
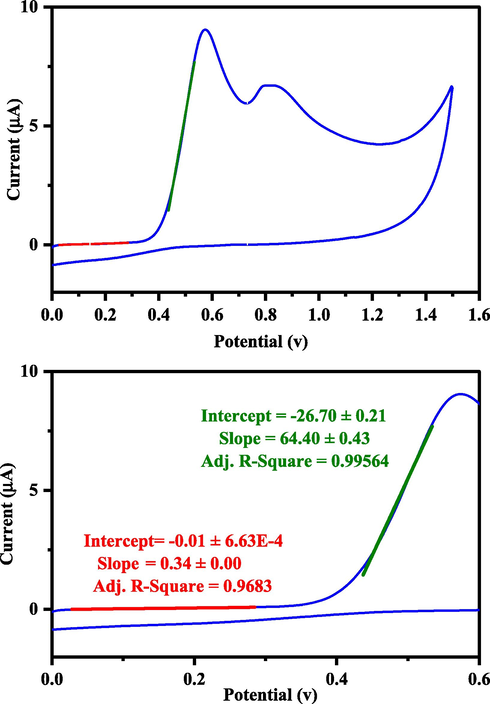
Cyclic voltammograms (CV) for (+)-epicatechin (2S,3S) solution (1200 µl, 0.01 M) that recorded with potentials of 2.0 V, pH = 4 and scan rates 0.1 V s−1 (The point of intersection of the two drawn lines is equal to the onset potential).
3.3 UV–Visible absorption studies
The energy taken by the UV–Visible radiation corresponds to the energy levels of the
 corresponds to the energy of the long-wavelength edge of the exciton absorption band. According to the Tauc and Davis-motif relation, the optical band gap can be calculated by the following:

This equation, α is absorption coefficient,
 is incident photon energy, K is energy independent constant, and
 is the optical bandgap energy. Also, the exponent
represents the nature of Transition, where n = 1/2 and 2 for direct allowed transitions and indirectly allowed transitions, respectively. By plotting (αhν)1/n versus (hν) and extrapolating the linear part of the curve to (αhν)1/n → 0, the quantitative evaluation of the optical bandgap energy
is the optical bandgap energy. Also, the exponent
represents the nature of Transition, where n = 1/2 and 2 for direct allowed transitions and indirectly allowed transitions, respectively. By plotting (αhν)1/n versus (hν) and extrapolating the linear part of the curve to (αhν)1/n → 0, the quantitative evaluation of the optical bandgap energy
 can be performed (see Fig. 8).
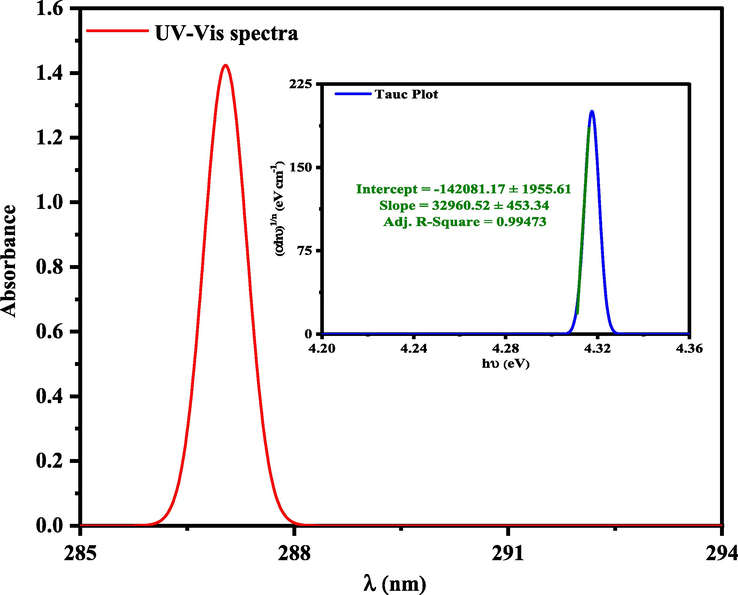
UV–Vis spectra of (+)-epicatechin (2S,3S) and Tauc plot for calculation band gap energy (Eg = 4.31 eV).
3.4 Experimental calculation of HOMO-LUMO energies and reactivity indexes of (+)-epicatechin (2S,3S)
HOMO energy corresponds to the energy required to extract electrons from a molecule in an oxidation process, and LUMO energy corresponds to the energy required to give an electron to a molecule in the reduction process. The frontier molecular orbital energy (FMO) in the ground state is calculated experimentally based on the Koopman theorem, using DPV, CV, and UV–Vis spectroscopy techniques (M Willems et al., 2019).

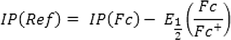
Herein,
 is the onset oxidation potential of the molecules and
 denotes the ionization potential of the Saturated calomel reference electrode. Since ionization potential of the reference electrode at the experimental condition is not directly available, IP (Ref) can be written in terms of the ionization potential of a known reference redox system, e.g., the (Fc/Fc + ) internal standard redox system, denoted by IP(Fc) and its potential reduction E1/2(Fc/Fc + ) as:
Therefore, Eq. (4) can be written as:
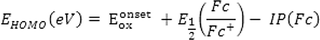
In this Equation,
 is the potential of ferrocene as a standard internal electrode versus Ag/Ag+ electrode and experimentally measured equal to 0.38 V. The ionization (offset) potential of the redox system is reported (Fc/Fc+) to be (Fc) = -4.8 eV (Lu et al., 2016).

The LUMO energy level can be calculated using
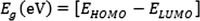

The
 is obtained via Eq. (3), and the
 is obtained from UV–Vis measurements. Using the linear regression by fitting the two lines to baseline and rising parts of the corresponding oxidation peak parts, the DPV and CV peak onset potentials can be calculated as shown in Fig. 7 and Fig. 8, respectively. The crossing point of these two lines is known as the onset potential. According to DFT-Koopmans' theorem, the electron affinity (
 ) and ionization potential (
 ) can be expressed in terms of its HOMO and LUMO orbital energies (Benabid et al., 2020; Curnow et al., 2005):


The Mulliken electronegativity and Mulliken chemical potential can be calculated by the mean of ionization potential (
 ) and electron affinity (
 )
)

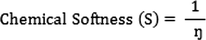
The energy gap (Eg) between the HOMO and LUMO is related to the chemical hardness and softness.

The electrophilicity index (ώ) is related to the electronic chemical potential (
 ) and chemical hardness (ɳ):

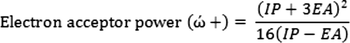
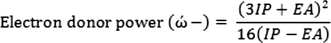
Also, electron acceptor power (ώ+) and electron donor power (
 ) can be determined by:
The orbital energies of both HOMO and LUMO, band gap energies (Eg), and reactivity indexes were calculated from the experimental analysis in Table 1. As a result, HOMO energy of (+)-epicatechin (2S,3S) obtained from DPV and CV were −5.28 and −5.24 eV, respectively. Also, the bandgap energy of (+)-epicatechin (2S,3S) obtained from UV–Vis spectra was 4.31 eV.
Method
EHOMO (eV)
ELUMO (From UV–Vis Spectra) (eV)
IP (eV)
EA (eV)
χ (eV)
μ (eV)
Eg (eV)
ɳ (eV)
S (eV)
ώ (eV)
 (eV)
(eV)
 (eV)
(eV)
DPV
−5.28
−0.97
5.28
0.97
3.13
−3.13
4.31
2.16
0.46
4.53
0.97
4.10
CV
−5.24
−0.93
5.24
0.93
3.09
−3.09
4.31
2.16
0.46
4.42
0.94
4.02
3.5 Computational study
3.5.1 Optimization of (+)-epicatechin (2S,3S) structure
The molecular structures of (+)-epicatechin (2S,3S) were optimized by semi-empirical calculation using the PM3 Hamiltonian, including the optional molecular mechanic's correction for HCON linkages (PM3MM) (Anders et al., 1993; Stewart, 1989a, 1989b). As a result, 28 conformers were obtained that the energy of the most stable conformer was equal to −9.45 eV. The structure of the most stable conformer, the optimization diagram, and the RMS Gradient Norm was shown in Fig. S2. This optimized structure was used for later calculations by DFT and MP2 methods.
3.5.2 Molecular electrostatic potential study
The efficient molecular electrostatic potential (MEP) technique can be used to detect the reactivity of compounds and to determine electrophilic and nucleophilic reactions and hydrogen bonding interactions. This method provides a visual understanding of the polarity of a molecule by mapping an electron density isosurface with an electrostatic potential surface, which shows the size, shape, charge density, and chemical reaction sites of the molecules. Here, nucleophilic and electrophilic sites are expressed with different color codes, with deep red indicating an electron-rich site and deep blue indicating an electron-deficient site. (“Molecular Electrostatic Potentials: Concepts and Applications - Google Books,” n.d.; Tasi and Pálinkó, 1995). MEP map by DFT-B3LYP/6–31 g (d, p) scrf = (iefpcm, solvent = water) for (+)-epicatechin (2S,3S) is shown in Fig. S3. Electronic density is concentrated in the oxygen of the —OH group at positions 3, 4 in the B-ring. According to MEP studies, the hydroxyl at positions 3, 4 in B-ring, are active sites in this molecule. The hydroxyl groups attached to the B-ring are important in electrochemical studies. On catechol (B-ring), hydroxyl groups are more oxidizable and easier to oxidize than resorcinol (A-ring). Electron transfer occurs in rings with less redox potential, such as the catechol (B-ring).
The oxidation of flavonoids is of great interest because flavonoids act as antioxidants scavenging free radicals through the electron transfer processes. The catechin oxidation reaction depends on the pH value and is performed in two consecutive steps for the catechol and resorcinol groups. The first step in the potential for deficient favorable oxidation of catechol electron donor groups is 3,4-dihydroxyl, a reversible reaction. The hydroxyl groups are oxidized from the catechol part and subjected to an irreversible oxidation reaction. Also, catechins are absorbed in the electrode surface and the final product is not electroactive and covers the electrode surface. The catechin oxidation mechanism is shown below. This mechanism is consistent with the information obtained from MEP studies. Hence the suggested mechanism of green synthesis AuNPs can be written as (Scheme 1):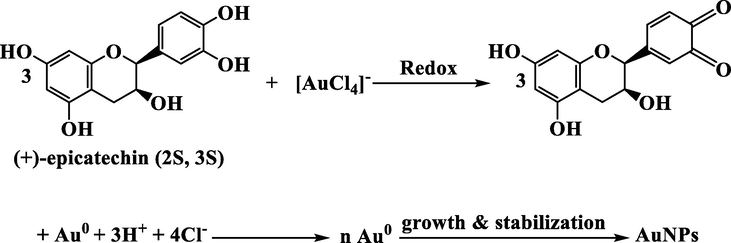
3.5.3 Frontier molecular orbital theory (FMO)
The distribution pattern of frontier molecular orbital of (+)-epicatechin (2S,3S) calculated by DFT-B3LYP/6–31 g (d, p) scrf= (iefpcm, solvent = water) is shown in Fig. S4. The Ώ-cloud in the HOMOs was distributed on the A-, B-, and C rings, but the Ώ-cloud in the LUMO was distributed on the B-ring. Reactivity indexes were determined with DFT calculations. These indices are excellent tools to describe the hardness, reactivity, and stability of (+)-epicatechin (2S,3S). Detailed HOMO and LUMO energies of (+)-epicatechin (2S,3S), along with their gaps and reactivity indexes, are listed in Table 2. Among all methods, B3LYP/6–31 + g(d) scrf = (solvent = water), showed the lowest energy gap (Eg) with a value (5.40 eV) while MP2/6–311++g (d, p) scrf = (solvent = water), showed the largest energy gap (9.50 eV). The highest electronic chemical potential (
 ) with value (-3.72 eV), and the lowest chemical potential value (-2.95 eV) has resulted from CAM-B3LYP/6–311++g (d, p) and B3LYP/6–31 g (d, p) scrf= (iefpcm, solvent = water), respectively. HOMO energy calculated by B3LYP/6–31 + g(d) including the solvent effect (water) shows the least difference with experimental analyses.
Method
EHOMO (eV)
ELUMO (eV)
IP (eV)
EA (eV)
χ (eV)
μ (eV)
Eg (eV)
 (eV)
(eV)S (eV)
ώ (eV)
 (eV)
(eV)
 (eV)
(eV)
cam-b3lyp/6–311++g (d, p) scrf= (iefpcm, solvent = water)
−7.53
0.32
7.53
−0.32
3.61
−3.61
7.85
3.93
0.25
3.32
0.34
3.95
cam-b3lyp/6–311++g (d, p) scrf=(solvent = water)
−7.53
0.32
7.53
−0.32
3.61
−3.61
7.85
3.93
0.25
3.32
0.34
3.95
cam-b3lyp/6–311++g (d, p)
−7.40
−0.04
7.40
0.04
3.72
−3.72
7.36
3.68
0.27
3.76
0.48
4.20
cam-b3lyp/6–311 + g(d)
−7.37
0.19
7.37
−0.19
3.59
−3.59
7.56
3.78
0.26
3.42
0.38
3.98
b3lyp/6–31 + g(d) scrf= (iefpcm, solvent = water)
−6.12
−0.61
6.12
0.61
3.36
−3.36
5.51
2.75
0.36
4.11
0.72
4.08
b3lyp/6–31 + g(d) scrf=(solvent = water)
−6.01
−0.61
6.01
0.61
3.31
−3.31
5.40
2.70
0.37
4.06
0.71
4.02
b3lyp/6–31 + g(d)
−6.04
−0.61
6.04
0.61
3.32
−3.32
5.43
2.71
0.37
4.07
0.71
4.04
b3lyp/6–31 g (d, p) scrf= (iefpcm, solvent = water)
−5.75
−0.15
5.75
0.15
2.95
−2.95
5.60
2.80
0.36
3.11
0.43
3.38
b3lyp/6–31++g scrf=(solvent = water)
−6.31
−0.71
6.31
0.71
3.51
−3.51
5.61
2.80
0.36
4.39
0.79
−6.31
b3lyp/6–311 g
−6.19
−0.54
6.19
0.54
3.37
−3.37
5.65
2.83
0.35
4.01
0.68
4.04
mp2/6–311++g (d, p) scrf=(solvent = water)
−8.42
1.08
8.42
−1.08
3.67
−3.67
9.50
4.75
0.21
2.83
0.18
3.84
opt b3lyp/6–311++g (d, p) scrf=(solvent = water)
−6.13
−0.63
6.13
0.63
3.38
−3.38
5.50
2.75
0.36
4.16
0.73
4.11
b3lyp/6–311++g (d, p) scrf= (iefpcm, solvent = water)
−6.18
−0.69
6.18
0.69
3.44
−3.44
5.48
2.74
0.36
4.30
0.78
4.21
3.5.4 Time-dependent density functional theory
The TD-DFT computational method was used for calculating the UV–Vis spectra and frontier molecular orbitals of (+)-epicatechin (2S,3S). The absorption spectra for (+)-epicatechin (2S,3S) was calculated from the TD-B3LYP/6–31 + g(d) approach was represented graphically in Fig. 9. Two peaks were observed at 200 and 355–400 nm. The occurrence of peaks may be attributed toward π to π* also n to π* transitions in the UV region. The bandgap energy of (+)-epicatechin (2S,3S) calculated by TD-DFT can be obtained from the following equation:
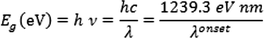
Obtained bandgap energy of (+)-epicatechin (2S,3S) from UV–Vis spectra calculated by TD-DFT-b3lyp/6–31 + g(d), and TD-DFT- cam-b3lyp/6–311++g (d, p).
Therefore
 value for (+)-epicatechin (2S,3S) was obtained 4.13 and 4.47 eV by TD-DFT-b3lyp/6–31 + g(d), and TD-DFT- cam-b3lyp/6–311++g (d, p), respectively.
4 Conclusion
In this report, AuNPs with spherical shape and medium-sized particles of 53 nm were synthesized using a Salix aegyptiaca extract. The results of the FT-IR spectroscopic, UV–vis, XRD, and TEM techniques confirmed the formation of AuNPs. Also, the application of synthesized AuNPs as a modifier in the manufacture of AuNPs/GCE for electrochemical studies of (+)-epicatechin (2S,3S) was investigated. The HOMO-LUMO energy gap and reactivity indexes of the (+)-epicatechin (2S,3S) was calculated using differential pulse voltammetry (DPV), cyclic voltammetry (CV), UV–Visible spectroscopy (UV–Vis) as well as density functional theory (DFT), and time-dependent density functional theory (TD-DFT). In summary, the HOMO energy obtained from the experimental analyses (EHOMO (from DPV) = -5.24 eV, and EHOMO (from CV) = -5.28 eV) has a relative agreement with the HOMO energy calculated by B3LYP/6–31 g (d, p) including the solvent effect (water) (EHOMO (from B3LYP) = -5.75 eV). Also, UV–Vis spectroscopy gives the bandgap energy equal to 4.31 eV, while the 4.13 eV is calculated by TD-DFT-b3lyp/6–31 + g(d).
CRediT authorship contribution statement
Javad Ebrahimian: Formal analysis, Investigation, Methodology. Maryam Khayatkashani: Writing – original draft, Writing – review & editing, Conceptualization, Supervision, Project administration, Visualization, Data curation, Validation, Resources. Nasrin Soltani: Formal analysis, Investigation, Methodology. Qahtan A. Yousif: Writing – review & editing, Formal analysis. Masoud Salavati-Niasari: Writing – review & editing, Conceptualization, Supervision, Visualization, Data curation, Validation, Resources.
Acknowledgment
We are very grateful to the Talae Sabz Pharmaceutical research council section, for its support during this research. Authors are grateful to the the University of Kashan for supporting this work by Grant No (159271/MB1).
Declaration of Competing Interest
The authors declare that they have no known competing financial interests or personal relationships that could have appeared to influence the work reported in this paper.
References
- Structural, thermal and electrical studies of polyethylene oxide/starch blend containing green synthesized gold nanoparticles. J. Mol. Struct.. 2019;1180:15-25.
- [CrossRef] [Google Scholar]
- Dealumination of Zeolite Frameworks and Lewis Acid Catalyst Activation for Transfer Hydrogenation. Arab. J. Sci. Eng.. 2021;46:5709-5716.
- [CrossRef] [Google Scholar]
- AuPd bimetallic nanoparticles supported on reduced graphene oxide nanosheets as catalysts for hydrogen generation from formic acid under ambient temperature. New J. Chem.. 2021;45:10040-10048.
- [CrossRef] [Google Scholar]
- Comprehensive quantum mechanical studies on three bioactive anastrozole based triazole analogues and their SERS active graphene complex. J. Mol. Struct.. 2020;128388
- [CrossRef] [Google Scholar]
- Optimization and application of lithium parameters for PM3. J. Comput. Chem.. 1993;14:1301-1312.
- [CrossRef] [Google Scholar]
- Salix (Salicaceae) Distribution Maps and a Synopsis of Their Classification in North America, North of Mexico. Harv. Pap. Bot.. 2007;12:335-368.
- [CrossRef] [Google Scholar]
- Phytosynthesis of silver nanoparticles using Coccinia grandis leaf extract and its application in the photocatalytic degradation. Colloids Surf., B. 2012;94:226-230.
- [CrossRef] [Google Scholar]
- Quantum mechanical/molecular mechanical and docking study of the novel analogues based on hybridization of common pharmacophores as potential anti-breast cancer agents. Res. Pharmaceut. Sci.. 2017;12:233-240.
- [CrossRef] [Google Scholar]
- Asgarpanah, J., 2012. Phytopharmacology and medicinal properties of Salix aegyptiaca L. undefined 11, 7313–7317. https://doi.org/10.4314/AJB.V11I28.
- Green synthesis of gold nanoparticles and its effect on the optical, thermal and electrical properties of carboxymethyl cellulose. Compos. B Eng.. 2019;172:436-446.
- [CrossRef] [Google Scholar]
- Enhanced optical, morphological, dielectric, and conductivity properties of gold nanoparticles doped with PVA/CMC blend as an application in organoelectronic devices. J. Mater. Sci.: Mater. Electron.. 2021;32(8):10443-10457.
- [CrossRef] [Google Scholar]
- Density-functional thermochemistry. III. The role of exact exchange. J. Chem. Phys.. 1993;98:5648-5652.
- [CrossRef] [Google Scholar]
- Becke A.D., Density-functional exchange-energy approximat - Google Scholar [WWW Document], n.d. URL https://scholar.google.com/scholar?q=Becke A.D.%2C Density-functional exchange-energy approximation with correct asymptotic behavior. Phys. Rev. A%2C 1988%2C 38%2C 3098-3100 (accessed 5.10.20).
- Crystal structure, spectroscopic studies, DFT calculations, cyclic voltammetry and biological activity of a copper (II) Schiff base complex. J. Mol. Struct.. 2020;1203:127313
- [CrossRef] [Google Scholar]
- Facile preparation of Au nanoparticles mediated by Foeniculum Vulgare aqueous extract and investigation of the anti-human breast carcinoma effects. Arabian J. Chem.. 2022;15:103479
- [CrossRef] [Google Scholar]
- Structure–molecular orbital energy correlations in Me3Si-substituted bis(indenyl)iron complexes evidenced with UV–vis spectroscopy and cyclic voltammetry. J. Electroanal. Chem.. 2005;585:167-171.
- [CrossRef] [Google Scholar]
- Self-consistent molecular-orbital methods. IX. An extended gaussian-type basis for molecular-orbital studies of organic molecules. J. Chem. Phys.. 1971;54:720-723.
- [CrossRef] [Google Scholar]
- Photocatalytic-degradation of organic dye and removal of heavy metal ions using synthesized SnO2 nanoparticles by Vitex agnus-castus fruit via a green route. Mater. Lett.. 2020;263:127255
- [CrossRef] [Google Scholar]
- The Ethanolic Extract of Bark from Salix Aegyptiaca L. Inhibits the Metastatic Potential and Epithelial to Mesenchymal Transition of Colon Cancer Cell Lines. Nutr. Cancer. 2014;66:999-1008.
- [CrossRef] [Google Scholar]
- Comparative antioxidant activity of extracts from leaves, bark and catkins of Salix aegyptiaca sp. Food Chem.. 2009;116:23-28.
- [CrossRef] [Google Scholar]
- Anticarcinogenic effects of the ethanolic extract of salix aegyptiaca in colon cancer cells: Involvement of Akt/PKB and MAPK pathways. Nutr. Cancer. 2013;65:1045-1058.
- [CrossRef] [Google Scholar]
- Green synthesis of silver and gold nanoparticles using Rosa damascena and its primary application in electrochemistry. Physica E. 2011;44:97-104.
- [CrossRef] [Google Scholar]
- Green Synthesis, Characterization and Applications of Nanoparticles, 2019. Green Synthesis, Characterization and Applications of Nanoparticles. https://doi.org/10.1016/C2017-0-02526-0.
- Structural studies on bioactive compounds. Part 29: Palladium catalysed arylations and alkynylations of sterically hindered immunomodulatory 2-amino- 5-halo-4,6-(disubstituted)pyrimidines. Bioorg. Med. Chem.. 2000;8:739-750.
- [CrossRef] [Google Scholar]
- ZINC–a free database of commercially available compounds for virtual screening. J. Chem. Inf. Model.. 2005;45
- [CrossRef] [Google Scholar]
- Dehydrogenation of Formic Acid in Liquid Phase over Pd Nanoparticles Supported on Reduced Graphene Oxide Sheets. Catal. Surv. Asia. 2021;25:324-333.
- [CrossRef] [Google Scholar]
- Investigating the effect of hydro-alcoholic extract of Salix aegyptiaca on anxiety in male rat. Adv. Biomed. Res.. 2015;4:258.
- [CrossRef] [Google Scholar]
- Development of the Colle-Salvetti correlation-energy formula into a functional of the electron density. Phys. Rev. B. 1988;37:785-789.
- [CrossRef] [Google Scholar]
- Synthesis of D-A low-bandgap polymer-based thieno[3,4-b]pyrazine and benzo[1,2-b:4,5-b′]dithiophene for polymer solar cells. Polym. Bull.. 2016;74(2):603-614.
- [CrossRef] [Google Scholar]
- Relating Frontier Orbital Energies from Voltammetry and Photoelectron Spectroscopy to the Open-Circuit Voltage of Organic Solar Cells. Adv. Energy Mater.. 2019;9:1803677.
- [CrossRef] [Google Scholar]
- Maassoumi, A., 2009. Experimental taxonomy of the genus Salix L. (Salicaceae) in Iran. undefined.
- Molecular Electrostatic Potentials: Concepts and Applications - Google Books [WWW Document], n.d. URL https://books.google.com/books?id=YPnmE1N-9i8C&pg=PA105&lpg=PA105&dq=applications+of+Molecular+electrostatic+potential+(MEP)&source=bl&ots=9jkQCYuxu0&sig=ACfU3U2uGYwcL2NFhvoaUHCIlz3zm2YFgw&hl=en&sa=X&ved=2ahUKEwjw6qSd4qjpAhVH4aQKHc5XDBYQ6AEwCXoECAoQAQ#v=onepage&q=applications of Molecular electrostatic potential (MEP)&f=false (accessed 5.10.20).
- Biosynthesis, characterization, and evaluation of bioactivities of leaf extract-mediated biocompatible gold nanoparticles from Alternanthera bettzickiana. Biotechnol. Rep,. 2018;19:e00268
- [CrossRef] [Google Scholar]
- Polyphenols of Salix aegyptiaca modulate the activities of drug metabolizing and antioxidant enzymes, and level of lipid peroxidation. BMC Compl. Alternat. Med.. 2018;18
- [CrossRef] [Google Scholar]
- Parr, R.G., 1980. Density Functional Theory of Atoms and Molecules, in: Horizons of Quantum Chemistry. Springer Netherlands, pp. 5–15. https://doi.org/10.1007/978-94-009-9027-2_2.
- The Scherrer Formula for X-Ray Particle Size Determination. Phys. Rev.. 1939;56:978.
- [CrossRef] [Google Scholar]
- Quantum Mechanical Studies of Three Aromatic Halogen-Substituted Bioactive Sulfonamidobenzoxazole Compounds with Potential Light Harvesting Properties. Polycyclic Aromat. Compd. 2019
- [CrossRef] [Google Scholar]
- Biosynthesis of silver nanoparticles using Ocimum sanctum (Tulsi) leaf extract and screening its antimicrobial activity. J. Nanopart. Res.. 2011;13:2981-2988.
- [CrossRef] [Google Scholar]
- Free Radical Scavenging Activity and Total Phenolic Content of Methanolic Extracts from Male Inflorescence of Salix aegyptiaca Grown in Iran. Iran. J. Pharmaceut. Res. IJPR. 2010;9:293-296.
- [Google Scholar]
- Optimization of parameters for semiempirical methods I. Method. J. Comput. Chem.. 1989;10:209-220.
- [CrossRef] [Google Scholar]
- Optimization of parameters for semiempirical methods II. Applications. J. Comput. Chem.. 1989;10:221-264.
- [CrossRef] [Google Scholar]
- Using molecular electrostatic potential maps for similarity studies. Berlin, Heidelberg: Springer; 1995. p. :45-71. https://doi.org/10.1007/3-540-58672-5_23
- Antifeedant constituents from Fagara macrophylla. Fitoterapia. 2001;72:538-543.
- [CrossRef] [Google Scholar]
- Green synthesis of silver-protein (core-shell) nanoparticles using Piper betle L. leaf extract and its ecotoxicological studies on Daphnia magna. Colloids Surf., A. 2011;389:188-194.
- [CrossRef] [Google Scholar]
- One step green synthesis of silver nano/microparticles using extracts of Trachyspermum ammi and Papaver somniferum. Colloids Surf., B. 2012;94:114-117.
- [CrossRef] [Google Scholar]
- Detection of catechin based on its electrochemical autoxidation. Talanta. 2005;65:511-517.
- [CrossRef] [Google Scholar]
- Biosynthesis of gold nanoparticles using Capsicum annuum var. grossum pulp extract and its catalytic activity. Physica E. 2017;85:19-26.
- [CrossRef] [Google Scholar]
Appendix A
Supplementary material
Supplementary data to this article can be found online at https://doi.org/10.1016/j.arabjc.2022.103758.
Appendix A
Supplementary material
The following are the Supplementary data to this article:Supplementary data 1
Supplementary data 1


