

Translate this page into:
Phytochemical analysis, UPLC-ESI-Orbitrap-MS analysis, biological activity, and toxicity of extracts from Tripleurospermum limosum (Maxim.) Pobed
⁎Corresponding authors at: Tonghua Normal University, School of Pharmacy and Medicine, Green Medicinal Chemistry Laboratory, Tonghua 134002, China. 15044586210@163.com (Li Li), qingguangx@163.com (Guangqing Xia), zanghao_1984@163.com (Hao Zang)
-
Received: ,
Accepted: ,
This article was originally published by Elsevier and was migrated to Scientific Scholar after the change of Publisher.
Abstract
Abstract
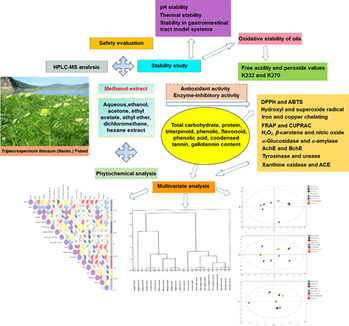
Phytochemical studies of Tripleurospermum limosum (Maxim.) Pobed (TL) indicated that TL contained 11 types of phytochemicals. Nineteen compounds were identified by ultra-performance liquid chromatography-electrospray ionization-orbitrap-mass spectrometry for the first time in this plant. The quantitative phytochemical analysis, antioxidant and enzyme inhibitory activities of the solvent extracts were measured. Safety evaluations were conducted and the pH stability, thermal stability, stability in gastrointestinal tract model systems, and oil stability of the methanol extract were investigated. TL may be useful as a source of active components for application in human nutrition and/or phytomedicine and methanol extract of TL could be used as a natural oil stabiliser.
Abstract
Tripleurospermum limosum (TL) has been used in folk medicine to treat gastritis. Toward the further development and use of TL, we report the phytochemical profiling, determination of active components, and antioxidant and enzyme inhibitory activities of TL. Nineteen compounds were identified by ultra-performance liquid chromatography-electrospray ionization-orbitrap-mass spectrometry for the first time in this plant. Phytochemical studies indicated that TL contained 11 types of phytochemicals. The active components [total carbohydrate content (TCC), total protein content (TProC), total triterpenoid content (TTC), total phenolic content (TPheC), total flavonoid content (TFC), total phenolic acid content (TPAC), condensed tannin content (CTC), and gallotannin content (GC)] of eight different solvent extracts were determined by ultraviolet–visible spectrophotometry. Aqueous extract had highest TProC, TPheC, and GC values. Methanol extract exhibited highest TCC and TFC values. Ethanol extract showed highest TPAC and CTC values and dichloromethane extract exhibited highest TTC value. Methanol extract showed strongest ability to scavenge 2,2-diphenyl-1-picrylhydrazyl radicals, 2,2′-azino-bis (3-ethylbenzothiazoline-6-sulphonic acid) diammonium salt cation radicals, and hydroxyl radicals, and also exhibited highest antioxidant activity in ferric-reducing antioxidant power and cupric ion-reducing antioxidant capacity assays. Best iron and copper chelating activity and H2O2 scavenging ability were shown by aqueous extract. Ethanol extract showed strongest ability to scavenge superoxide radicals and effectively prevent β-carotene bleaching. Acetone extract had highest inhibitory activity toward α-glucosidase, α-amylase, and xanthine oxidase. Ethyl ether extract had highest inhibitory activity towards urease and angiotensin converting enzyme. Aqueous and ethanol extracts had strongest inhibitory activity toward acetylcholinesterase. Methanol extract showed highest inhibitory activity toward tyrosinase. Methanol extract showed good stability and antioxidant capacity during heating, at different pH values, and after in vitro digestion and had low toxicity. The efficacy of methanol extract in stabilizing olive and sunflower oils was studied, the results suggested that methanol extract had a protective effect on the primary oxidation of the two oils. TL may be useful as a source of active components for application in human nutrition and/or phytomedicine and methanol extract of TL could be used as a natural oil stabiliser.
Keywords
Tripleurospermum limosum
Phytochemical analysis
UPLC-ESI-Orbitrap-MS
Antioxidant activity
Enzyme-inhibitory activity
Stability studies

1 Introduction
The genus Tripleurospermum belongs to the tribe Anthemideae of the family Asteraceae (Compositae). There are approximately 38 species of Tripleurospermum, mainly distributed in Europe and temperate Asia (Bremer and Humphries, 1993). Papatya (genus Tripleurospermum) is widely used as a food in Turkey. A decoction and infusion prepared from Tripleurospermum parviflorum and Tripleurospermum monticolum are used to treat cough, stomachache, and as an antipyretic. Tripleurospermum parviflorum has also been reported to be used to treat pharyngeal diseases and vaginitis (Cakilcioglu and Turkoglu, 2010). In Turkey, Tripleurospermum sevanense has been used for haircare (Altundag and Ozturk, 2011). In Iran, some species of Tripleurospermum are used in traditional medicine to soothe, calm, and relax and to combat tension, fatigue, and stress (Parvini et al., 2007). The flowers of Tripleurospermum are also used as a carminative, stimulant, and febrifuge (Hooper et al., 1937). Plants from the genus Tripleurospermum contain a variety of phytochemicals, including terpenoids, alkanes, steroids, organic acids, and aromatic compounds (Yasar et al., 2005; Servi et al., 2020), and have extensive biological activity, including anti-inflammatory, antioxidant, analgesic, and antifungal activity (Wichtl, 2004; Bakhtiarian et al., 2007; Amin et al., 2002).
Tripleurospermum limosum (Maxim.) Pobed (TL) belongs to the genus Tripleurospermum. TL is an annual or biennial herb with upright stems, which grows to be 10–35 cm high and does not branch. The flowering period of TL is from June to July and the fruiting period is from August to September. TL is distributed in the sandy land of rivers and lakes, meadows, and dry sandy slopes. TL is found in the three provinces of Northeast China and Hebei Province, as well as in Japan, North Korea, Mongolia, and the Russian Far East. The whole plant is harvested in summer and autumn and has been used in folk medicine for the treatment of gastritis (Flora of China Editorial Committee of Chinese Academy of Sciences., 1983; Yu et al., 2016). To date, there have been no reports on the isolation of components from TL or pharmacological studies of TL. In addition, the toxicology of TL in the human body has not been studied.
A high concentration of reactive oxygen species can destroy important macromolecules in the human body, and they play an important role in the pathogenesis of many serious diseases, such as diabetes, coronary heart disease, hypertensions, neurodegenerative disorders, and hepatotoxicity. Therefore, adequate intake of antioxidants is crucial to promote human health. As a result, the search for natural and safe antioxidants derived from plants has attracted increasing attention (Mollica et al., 2021; Xu et al., 2021a; Amri et al., 2012; Liu et al., 2022).
In recent years, different methods have been applied to evaluate the antioxidant capacity of foods and food components. The most common assays involve scavenging of 2,2-diphenyl-1-picryl hydrazyl (DPPH), 2,2′-azino-bis (3-ethylbenzothiazoline-6-sulphonic acid) diammonium salt cation radicals (ABTS•+), hydroxyl, or superoxide radicals; ferric-reducing antioxidant power (FRAP); cupric ion reducing antioxidant capacity (CUPRAC); iron and copper chelation; scavenging of hydrogen peroxide (H2O2) and nitric oxide (NO); and bleaching of β-carotene. The different methods to evaluate antioxidants make use of different antioxidant activity mechanisms.
The inhibitory potential of food substances against clinically important enzymes has also been evaluated and the most common assays involve α-glucosidase and α-amylase, acetylcholinesterase (AchE) and butyrylcholinesterase (BchE), tyrosinase and urease, xanthine oxidase (XO), and angiotensin converting enzyme (ACE). The enzyme inhibitory evaluations use different enzymes because different enzymes have been implicated in different diseases.
The aim of this study was to analyse the chemical constituents, and antioxidant and enzyme inhibitory activities of TL extracts. The results provide a basis for further in-depth research and development of TL.
2 Materials and methods
2.1 Materials
TL was collected (voucher specimen number: 2020–06-20–001) from wild-growing plants in Tonghua (latitude N 41°22′24.40′′, longitude E 125°36′22.27′′, altitude 302.8 m, Jilin Province, China) (Fig. S1) in June 2020. A plant taxonomist (Prof. Junlin Yu) confirmed identification of the specimen. A voucher specimen was deposited with the Herbarium of Tonghua Normal University (Tonghua, China).
2.2 Extraction procedures
2.2.1 Preparation of TL extracts for quantitative phytochemical analysis and ultra-performance liquid chromatography (UPLC)-mass spectroscopy (MS) analysis
Collected samples of TL were dried in a place that was dry, airy, and out of direct sunlight, and pulverised to powder. Twenty grams of this powder was added to a single-neck round-bottomed flask (glass, 500 mL), followed by addition of 200 mL of various solvents (water, methanol, ethanol, acetone, ethyl acetate, ethyl ether, dichloromethane or hexane) and refluxing using a hotplate magnetic stirrer employing methyl silicone oil as the heating medium for 6 h at the respective boiling points of the solvents. Extracts were filtered through a Whatman No.1 filter paper and evaporated under reduced pressure at < 50 °C until dry using a rotary evaporator. All dried extracts were weighed and stored at − 20 °C until use. Yield was calculated as % yield = (weight of dry extract/initial weight of dry sample) × 100.
2.2.2 Preparation of preliminary experimental solutions for qualitative phytochemical analysis
2.2.2.1 Aqueous extraction solutions
TL powder (5 g) was weighed and passed through a sieve (20 mesh). Distilled water (50 mL) was added and the mixture was allowed to stand overnight at room temperature. Next, 5 mL of filtrate was obtained by filtration, and this filtrate was analysed to check for amino acids and proteins. The remaining residue and leaching solution were heated at 60 °C for 10 min. After heating, the mixture was filtered immediately. This filtrate was used to check for carbohydrates, organic acids, saponins, glycosides, phenols, tannins and cyanogenic glycosides.
2.2.2.2 Methanol extraction solutions
TL powder (5 g) was weighed and passed through a sieve (20 mesh). Ethyl ether (50 mL) was added and the mixture was heated under reflux for 10 min. The filter residue was transferred back into the bottle after filtration. Next, 35 mL of methanol was added and the mixture was heated under reflux for 10 min. After heating, the mixture was filtered immediately. This filtrate was used to check for flavonoids, anthraquinones, cardiac glycosides, coumarins, lactones, volatile oils, terpenoids, steroids and lipids.
2.2.2.3 Ethanol extraction solutions
TL powder (5 g) was weighed and passed through a sieve (20 mesh). 0.5% HCl in ethanol (35 mL) was added and the mixture was heated under reflux for 10 min. After heating, the mixture was filtered immediately. This filtrate was used to check for alkaloids.
2.2.2.4 Petroleum ether extraction solutions
TL powder (3 g) was weighed and passed through a sieve (20 mesh). Petroleum ether (15 mL) was added and the mixture was allowed to stand at room temperature for 4 h. Next, 5 mL of filtrate was obtained by filtration, and this filtrate was analysed to check for volatile oils, lipids, steroids and triterpenoids.
2.3 Qualitative phytochemical analysis
2.3.1 Tests for proteins
2.3.1.1 Ninhydrin tests
1 mL of aqueous extraction solution was mixed with 1 mL of 0.2% ninhydrin solution. The mixture was boiled for 5 min. Development of a purple colour indicated the presence of amino acids or proteins.
2.3.1.2 Biuret tests
1 mL of aqueous extraction solution was mixed with 1 mL of solution A (0.1 g/mL NaOH), and then two drops of solution B (0.01 g/mL CuSO4) were added. This mixture was shaken, and a purple, red, or purplish-red colour indicated the presence of amino acids or proteins.
2.3.2 Tests for carbohydrates
2.3.2.1 Fehling’s tests
Equal volumes of solution A (34.66 g of CuSO4·5H2O dissolved in 500 mL of distilled water) and solution B (173 g of sodium potassium tartrate tetrahydrate and 50 g of NaOH dissolved in 500 mL of distilled water) were mixed together. A sample (1 mL) of this mixture was then mixed with 1 mL of aqueous extraction solution. The resulting mixture was boiled gently. Formation of a brick-red precipitate indicated the presence of reducing sugars.
2.3.2.2 Benedict’s tests
1 mL of aqueous extraction solution was mixed with 1 mL of Benedict’s reagent and the resulting mixture was boiled gently. Formation of a reddish-brown precipitate indicated the presence of carbohydrates.
2.3.2.3 Molisch’s tests
1 mL of aqueous extraction solution was mixed with 1 mL of Molisch’s solution (2 g of α-naphthol dissolved in 100 mL of 95% ethanol). The mixture was then poured carefully into another test tube containing 1 mL of H2SO4. A purple ring at the aqueous phase/organic phase interface indicated the presence of carbohydrates.
2.3.2.4 Iodine tests
1 mL of aqueous extraction solution was mixed with 1 mL of iodine solution (127 mg of iodine and 200 mg of KI dissolved in 10 mL of distilled water). Development of a dark blue or purple colour indicated the presence of carbohydrates.
2.3.3 Tests for phenols
2.3.3.1 FeCl3 tests
1 mL of aqueous extraction solution was mixed with 1 mL of 2% FeCl3 solution. Development of a blue-green or black colour indicated the presence of phenols.
2.3.3.2 FeCl3-K3[Fe(CN)6] tests
A few drops of aqueous extraction solution were added onto a thin-layer chromatography plate, and the chromogenic reagent (1 % K3[Fe(CN)6] solution was mixed with 2% FeCl3 solution in equal volumes) was sprayed onto the plate, thus generating a blue colour. Then, 2 M HCl was sprayed onto the plate, and a darker colour indicated the presence of phenols.
2.3.3.3 Diazotization tests
1 mL of aqueous extraction solution was mixed with 1 mL of 3% Na2CO3 solution. The resulting mixture was boiled for 3 min and then cooled in ice water. Two drops of newly prepared diazotization reagent were added. Development of a red colour indicated the presence of phenols.
2.3.4 Tests for organic acids
2.3.4.1 pH tests
The pH of aqueous extraction solution was measured with pH meter. A pH value below 7.0 indicated the presence of organic acids.
2.3.4.2 Blue litmus paper tests
A few drops of aqueous extraction solution were placed on a blue litmus paper. Development of a red colour indicated the presence of organic acids.
2.3.4.3 Bromocresol green tests
A few drops of aqueous extraction solution were added onto a thin-layer chromatography plate. Chromogenic reagent (0.1 g of bromocresol green dissolved in 500 mL of ethanol and mixed with 5 mL of 0.1 N NaOH) was sprayed onto the plate. Development of a yellow colour on a blue background indicated the presence of organic acids.
2.3.5 Tests for tannins
2.3.5.1 FeCl3 tests
The experimental procedure was the same as that described in Section 2.3.3.1. Development of a blue-green or black colour indicated the presence of tannins.
2.3.5.2 Bromine water tests
Bromine water (3%) was added to 1 mL of aqueous extraction solution. Formation of a precipitate indicated the presence of tannins.
2.3.5.3 Lead acetate tests
1 mL of lead acetate solution was added to 1 mL of aqueous extraction solution; a precipitate was considered evidence for the presence of tannins.
2.3.5.4 Lime water tests
Clear lime water (1 mL) was added to 1 mL of aqueous extraction solution. Formation of a precipitate indicated the presence of tannins.
2.3.5.5 Gelatin tests
1 mL of aqueous extraction solution was mixed with 1 mL of 0.5% gelatin dissolved in 10% NaCl solution. Turbidity indicated the presence of tannins.
2.3.6 Tests for flavonoids
2.3.6.1 Shinoda tests
An appropriate amount of magnesium powder was added to 1 mL of methanol extraction solution, followed by two drops of HCl. Development of a red to red–purple colour indicated the presence of flavonoids.
2.3.6.2 Alkaline reagent tests
1 mL of methanol extraction solution was mixed with 1 mL of 2% NaOH solution. Development of an intense yellow colour followed by a change to colourless on addition of a few drops of diluted HCl indicated the presence of flavonoids.
2.3.6.3 AlCl3 tests
A few drops of methanol extraction solution were added onto a thin-layer chromatography plate. A 1% AlCl3 methanol solution was sprayed onto the plate. Observation of yellow-green fluorescence under an ultraviolet lamp indicated the presence of flavonoids.
2.3.6.4 Lead acetate test
A few drops of lead acetate solution were added to 1 mL of methanol extraction solution.
Formation of a yellow precipitate indicated the presence of flavonoids.
2.3.7 Tests for saponins
2.3.7.1 Foam tests
1 mL of aqueous extraction solution was mixed with 5 mL of distilled water. This mixture was shaken and then left to stand for 10 min. Formation of a stable foam indicated the presence of saponins.
2.3.8 Tests for steroids and triterpenoids
2.3.8.1 Liebermann-Burchard tests
5 mL of the aqueous extraction solution was placed in an evaporating dish and then evaporated. The residue was dissolved in 1 mL of acetic anhydride. One drop of H2SO4 was added and development of a red or purple colour indicated the presence of triterpenoids. Development of a blue-green colour indicated the presence of steroids.
2.3.8.2 Salkowski tests
1 mL of methanol extraction solution was mixed with 1 mL of CHCl3. Then, 1 mL of H2SO4 was added carefully, and the mixture was shaken gently. A reddish-brown colour in the CHCl3 layer and green fluorescence in the H2SO4 layer indicated the presence of steroids or triterpenoids.
2.3.9 Tests for terpenoids
2.3.9.1 CHCl3-H2SO4 tests
1 mL of methanol extraction solution was mixed with 2 mL of CHCl3 and then evaporated. H2SO4 (2 mL) was added carefully, and the mixture was heated at 60 °C for 2 min. Development of a grey colour indicated the presence of terpenoids.
2.3.9.2 Vanillin-H2SO4 tests
A few drops of petroleum ether extraction solution were added onto a thin-layer chromatography plate. Chromogenic reagent was prepared by dissolving 5 g of vanillin in 100 mL of 10% H2SO4 ethanol solution, and then sprayed onto the plate. Development of a red, blue, or purple colour indicated the presence of volatile oils, terpenoids, and steroids.
2.3.10 Tests for alkaloids
2.3.10.1 Bertrad’s reagent tests
1 mL of ethanol extraction solution was mixed with 1 mL of tungstosilicic acid reagent. The reagent was prepared by dissolving 5 g of tungstosilicic acid hydrate in 100 mL of distilled water and adding a small amount of HCl to adjust the pH to 2.0. Formation of a pale yellow or off-white precipitate indicated the presence of alkaloids.
2.3.10.2 Dragendorff’s reagent tests
1 mL of ethanol extraction solution was mixed with 1 mL of Dragendorff ’s reagent. For the reagent, solution A (850 mg of bismuth subnitrate dissolved in 40 mL of distilled water and 10 mL of acetic acid) and solution B (8 g of KI dissolved in 20 mL of distilled water) were mixed in equal volumes to prepare a stock solution. A sample of this stock solution (10 mL) was then mixed with 20 mL of acetic acid and diluted to 100 mL with distilled water. Formation of a light yellow or reddish brown precipitate indicated the presence of alkaloids.
2.3.10.3 Mayer’s reagent tests
1 mL of ethanol extraction solution was mixed with 1 mL of Mayer’s reagent. For the reagent, solution A (1358 mg of HgCl2 dissolved in 60 mL of distilled water) and solution B (5 g of KI dissolved in 10 mL of distilled water) were mixed and then diluted to 100 mL with distilled water. Formation of a white or light yellow precipitate indicated the presence of alkaloids.
2.3.11 Tests for anthraquinones
2.3.11.1 Borntrager’s tests
1 mL of methanol extraction solution was mixed with 1 mL of 10% NaOH solution. A red colour developed. Next, a small volume of 30% H2O2 solution was added and the mixture was heated at 60 °C. HCl solution was then added and the red colour disappeared, finally, NaOH solution was added and development of a red colour indicated the presence of anthraquinones.
2.3.11.2 Magnesium acetate tests
Three drops of 1% magnesium acetate methanol solution were added to 1 mL of methanol extraction solution. Development of a red colour indicated the presence of anthraquinones.
2.3.12 Tests for coumarins and lactones
2.3.12.1 Hydroxamic acid iron tests
Three drops of 7% hydroxylamine hydrochloride methanol solution and 10% KOH methanol solution were added to 1 mL of methanol extraction solution. After heating at 60 °C, 5% HCl was added to adjust the pH to 3.0–4.0. Next, two drops of 1% FeCl3 ethanol solution were added. Development of a orange or purple colour indicated the presence of coumarins and lactones.
2.3.12.2 Diazotization tests
Methanol extraction solution was used. The experimental procedure was the same as that described in Section 2.3.3.3. Development of a red colour indicated the presence of coumarins and lactones.
2.3.12.3 Fluorescence tests
A few drops of methanol extraction solution were added onto a thin-layer chromatography plate and blue-green fluorescence was observed under ultraviolet lamp. 1% KOH solution was sprayed onto the plate. Generation of intense fluorescence indicated the presence of coumarins.
2.3.13 Tests for volatile oils and fats
2.3.13.1 Phosphomolybdic acid tests
A few drops of petroleum ether extraction solution were added onto a thin-layer chromatography plate and 25% phosphomolybdic acid solution (2.5 g of phosphomolybdic acid hydrate dissolved in 10 mL of absolute ethanol) was sprayed onto the plate. Development of a blue colour indicated the presence of lipids, triterpenoids, and steroids.
2.3.13.2 Vanillin-H2SO4 tests
Methanol extraction solution was used. The experimental procedure was the same as that described in Section 2.3.9.2. Development of a red, blue, or purple colour indicated the presence of volatile oils, terpenoids, and steroids.
2.3.13.3 Sudan tests
One drop of Sudan III solution (0.1 g of sudan III dissolved in 10 mL of 95% ethanol) was added to 1 mL of methanol extraction solution. Development of an orange colour indicated the presence of oils and fats. One drop of Sudan IV solution (0.01 g of Sudan IV dissolved in 5 mL of acetone, followed by addition of 5 mL of 70% ethanol) was added to 1 mL of methanol extraction solution. Development of a red colour indicated the presence of oils and fats.
2.3.14 Tests for cardiac glycosides
2.3.14.1 Kedde tests
A few drops of methanol extraction solution were added onto a thin-layer chromatography plate. Chromogenic reagent was prepared by mixing solution A (2% methanol solution of 3,5-dinitrobenzoic acid) and solution B (2 M KOH solution) in equal volumes. The reagent was sprayed onto the plate. Development of a purple-red colour followed by a change to colourless indicated the presence of cardiac glycosides.
2.3.14.2 Raymond tests
Methanol extract (1 mg) was dissolved in 50% ethanol. Both 2 % m-dinitrobenzene ethanol solution (0.1 mL) and 20% NaOH solution (0.2 mL) were added. Development of a blue-purple colour indicated the presence of cardiac glycosides.
2.3.14.3 Legal tests
Methanol extract (1 mg) was dissolved in two drops of pyridine. One drop of 3% sodium nitroprusside solution and one drop of 2 M NaOH solution were added. Development of a dark red colour followed by a change to colourless indicated the presence of cardiac glycosides.
2.3.15 Tests for cyanogenic glycosides
2.3.15.1 Prussian blue tests
1 g of TL powder was placed in a test tube, 2 mL of distilled water was added, and the test tube was immediately wrapped with filter paper. Then, one drop of 10% KOH solution was added onto the filter paper, and the system was heated at 60 °C for 30 min. Next, one drop each of 10% ferrous sulphate, 10% HCl, and 5% FeCl3 were sequentially added onto the filter paper. A blue colour on the filter paper indicated the presence of cyanogenic glycosides.
2.4 UPLC-MS
Eight solvent extracts of TL were analysed using a UPLC-electrospray ionization (ESI)-Q-Exactive Orbitrap/MS system. The UPLC was performed on an Ultimate 3000 system (Thermo Fisher Scientific, Dionex, Sunnyvale, CA, USA) coupled with Poroshell 120 EC-C18 column (150 × 4.6 mm, 2.7 μm; Agilent) maintained at 35 °C. The linear gradient of mobile phases between 0.1% formic acid in water (A)/100% acetonitrile (B) was used as follows; from A/B (95/5) to A/B (0/100) for 45 min and from A/B (0/100) to A/B (95/5) for 15 min. The run time was 60 min, the flow rate was 0.5 mL/min. We diluted each extract with methanol to give a concentration of 1 mg/mL, which was passed through a 0.22-μm filter. The injection volume was 5 μL.
Mass spectrometric detection was carried out on a Q-Exactive quadrupole electrostatic field orbitrap high resolution mass spectrometry (Thermo Fisher Scientific, USA). The electrospray ionization source in both positive (ESI + ) and negative (ESI − ) ion modes was used with scanning range of m/z 50–1000. The MS source parameters were set as follows: sheath gas flow of 35 arbitrary units, aux gas flow of 15 arbitrary units, and sweep gas flow of 1 arbitrary units. The capillary voltage was set to + 3.5 kV at the capillary temperature of 320 °C and aux gas heater temperature of 350 °C. The scan mode was Full MS/dd-MS2 (Top N, N = 8), of which the resolution was respectively 70,000 (Full MS) and 17,500 (dd-MS2). The collision energy was set to 10%, 20% and 40% NCE when it was MS/MS mode. Data are recorded and analysed using the Xcalibur software (Version 2.2.42, Thermo Fisher Scientific, USA).
2.5 Quantitative phytochemical analysis
2.5.1 Determination of total carbohydrate content (TCC)
The TCC was measured according to our previous method (Zhang et al. 2020). Briefly, 250 μL of TL extract in distilled water, 125 μL of phenol solution (5%), and 625 μL of H2SO4 were mixed in an Eppendorf tube and incubated for 30 min. Subsequently, 200 μL of the sample was pipetted from each Eppendorf tube onto a microplate. A calibration curve was produced based on glucose (0–200 mg/L) as a standard. The absorbance of the sample was recorded at 490 nm against a blank sample consisting of TL extract with distilled water. The mean of three readings was used and TCC was expressed in milligrams of glucose equivalents (GE)/g of TL extract.
2.5.2 Determination of total protein content (TProC)
The TProC was measured according to our previous method (Guo et al. 2022). Briefly, 200 μL of bicinchoninic acid (BCA) working solution and 20 μL of TL extract in distilled water were mixed in a microplate and incubated at 37 °C for 30 min. A calibration curve was produced based on bovine serum albumin (BSA) (0–500 mg/L) as a standard. The absorbance of the sample was recorded at 562 nm against a blank sample consisting of TL extract with distilled water. The mean of three readings was used and TProC was expressed in milligrams of BSA equivalents (BSAE)/g of TL extract.
2.5.3 Determination of total triterpenoid content (TTriC)
The TTriC was measured according to the method with slight modifications (Fiallos-Jurado et al. 2016). Briefly, 180 μL of TL extract in acetic anhydride and 20 μL of H2SO4 were mixed in a microplate and incubated at room temperature for 10 min. A calibration curve was produced based on ginsenoside Re (0–400 mg/L) as a standard. The absorbance of the sample was recorded at 350 nm against a blank sample consisting of TL extract with acetic anhydride. The mean of three readings was used and TTriC was expressed in milligrams of ginsenoside Re equivalents (GRE)/g of TL extract.
2.5.4 Determination of total phenolic content (TPheC)
The TPheC was measured according to our previous method (Zhang et al. 2020). Briefly, 100 μL of Folin & Ciocalteu’s phenol reagent (FC reagent) (1 M) and 200 μL of TL extract in distilled water were mixed in an Eppendorf tube and incubated for 5 min. Subsequently, 500 μL of Na2CO3 solution (20%) was added and allowed to stand at room temperature for 40 min in the dark (with mixing every 10 min). Subsequently, 200 μL of the sample was pipetted from each Eppendorf tube onto a microplate. A calibration curve was produced based on gallic acid (0–100 mg/L) as a standard. The absorbance of the sample was recorded at 750 nm against a blank sample consisting of TL extract with distilled water and Na2CO3. The mean of three readings was used and TPheC was expressed in milligrams of gallic acid equivalents (GAE)/g of TL extract.
2.5.5 Determination of total flavonoid content (TFC)
The TFC was measured according to our previous method (Zhang et al. 2020). Briefly, 100 μL of AlCl3 (2%) in methanol and 100 μL of TL extract in methanol were mixed in a microplate and incubated at room temperature for 10 min. A calibration curve was produced based on quercetin (0–100 mg/L) as a standard. The absorbance of the sample was recorded at 415 nm against a blank sample consisting of TL extract with methanol. The mean of three readings was used and TFC was expressed in milligrams of quercetin equivalents (QE)/g of TL extract.
2.5.6 Determination of total phenolic acid content (TPAC)
The TPAC was measured according to the method with slight modifications (Mihailović et al. 2015). Briefly, 20 μL of TL extract in distilled water, 20 µL of Arnow reagent, 20 µL of HCl solution (0.1 M), 120 µL of distilled water and 20 µL of NaOH solution (1 M) were mixed in a microplate and recorded immediately at 490 nm against a blank sample (Arnow reagent was replaced with distilled water). A calibration curve was produced based on caffeic acid (0–100 mg/L) as a standard. The mean of three readings was used and TPAC was expressed in milligrams of caffeic acid equivalents (CAE)/g of TL extract.
2.5.7 Determination of total tannin content (TTanC)
The TTanC was measured according to our previous method (Guo et al. 2022). Briefly, 200 μL of FC reagent (1 M) and 200 μL of TL extract in distilled water were mixed in an Eppendorf tube and incubated for 5 min. Subsequently, 100 μL of Na2CO3 solution (20%) and 1500 μL of distilled water were added and allowed to stand at room temperature for 30 min in the dark (with mixing every 10 min). Subsequently, 200 μL of the sample was pipetted from each Eppendorf tube onto a microplate. A calibration curve was produced based on tannic acid (0–200 mg/L) as a standard. The absorbance of the sample was recorded at 725 nm against a blank sample consisting of TL extract with distilled water and Na2CO3. The mean of three readings was used and TTanC was expressed in milligrams of tannic acid equivalents (TAE)/g of TL extract.
2.5.8 Determination of condensed tannin content (CTC)
The CTC was measured according to the method with slight modifications (Mihailović et al. 2015). Briefly, 4 mg of phloroglucinol was added to 2 mL of TL extract in distilled water. Subsequently, 1 mL of HCl solution and 1 mL of formaldehyde solution were added and mixed in an Eppendorf tube and incubated at room temperature overnight. The precipitate was separated by filtration, the unprecipitated phenols were measured in the filtrate according to Section 2.5.4.
2.5.9 Determination of gallotannin content (GC)
The GC was measured according to the method with slight modifications (Mihailović et al. 2015). Briefly, 875 µL of TL extract in methanol and 375 µL of saturated KIO3 solution were mixed in an Eppendorf tube and incubated at 15 °C for 120 min. A calibration curve was produced based on gallic acid (0–400 mg/L) as a standard. The absorbance of the sample was recorded at 550 nm against a blank sample (KIO3 was replaced with distilled water). The mean of three readings was used and GC was expressed in milligrams of gallic acid equivalents (GAE)/g of TL extract.
2.6 Antioxidant activity assay
2.6.1 DPPH assay
The DPPH scavenging activity was assayed according to our previous method (Zhang et al. 2020). Briefly, 100 µL of TL extract in methanol and 100 µL of DPPH in methanol (50 µM) were mixed in a microplate and allowed to stand at room temperature for 20 min in the dark. The absorbance of the sample was recorded at 515 nm. Butylated hydroxytoluene (BHT), L-ascorbic acid and 6-hydroxy-2,5,7,8-tetramethylchroman-2-carboxylic acid (trolox) were used as positive references. The Half-maximal inhibitory concentration (IC50) values were calculated and expressed as the mean ± standard deviation (SD) in μg/mL.
2.6.2 ABTS assay
The ABTS scavenging activity was assayed according to our previous method (Zhang et al. 2020). Briefly, 190 μL of diluted ABTS solution and 10 μL of TL extract in DMSO were mixed in a microplate and incubated for 20 min in the dark. The absorbance of the sample was recorded at 734 nm. BHT, L-ascorbic acid and trolox were used as positive references.The IC50 values were calculated and expressed as the mean ± SD in μg/mL.
2.6.3 Hydroxyl radical assay
The hydroxyl radical scavenging activity was assayed according to our previous method (Zhang et al. 2020). Briefly, 50 µL of TL extract in DMSO, 50 µL of FeSO4 solution (3 mM) and 50 µL of H2O2 solution (3 mM) were mixed in a microplate and incubated for 10 min. After then 50 µL of salicylic acid solution (6 mM) was added and incubated at room temperature for 30 min in the dark. The absorbance of the sample was recorded at 492 nm. BHT, L-ascorbic acid and trolox were used as positive references. The IC50 values were calculated and expressed as the mean ± SD in μg/mL.
2.6.4 Superoxide radical assay
The superoxide radical scavenging activity was assayed according to our previous method (Guo et al. 2022). Briefly, 45 µL of TL extract in DMSO (10 mg/mL), 15 µL of p-nitroblue tetrazolium chloride (NBT) in DMSO (1 mg/mL) and 150 µL of NaOH in DMSO (50 μM) were mixed in a microplate and the absorbance of the sample was recorded immediately at 560 nm against a blank sample (NBT was replaced with DMSO). Curcumin was used as a positive reference. The scavenging activity was expressed as % scavenging rate and was calculated as follows:
2.6.5 FRAP assay
The FRAP assay was assayed according to our previous method (Zhang et al. 2020). Briefly, 20 µL of TL extract in DMSO and 180 µL of FRAP reagent were mixed in a microplate and incubated at 37 °C for 30 min in the dark. A calibration curve was produced based on FeSO4 (0–600 mg/L) as a standard. The absorbance of the sample was recorded at 595 nm. BHT, L-ascorbic acid and trolox were used as positive references. The FRAP was expressed as the Trolox Equivalent Antioxidant Capacity (TEACFRAP).
2.6.6 CUPRAC assay
The CUPRAC assay was assayed according to our previous method (Zhang et al. 2020). Briefly, 20 µL of CuCl2 solution (100 mM), 50 µL of neocuproine in 96% ethanol (7.5 mM), 50 µL of NH4Ac solution, 20 µL of TL extract in DMSO, and 30 µL of distilled water were mixed in a microplate and incubated at 50 °C for 20 min. This mixture was allowed to stand at room temperature for 10 min. The absorbance of the sample was recorded at 450 nm. BHT, L-ascorbic acid and trolox were used as positive references. The CUPRAC was expressed as the Trolox Equivalent Antioxidant Capacity (TEACCUPRAC).
2.6.7 Iron chelating assay
The chelating activity for ferrous ions was assayed according to our previous method (Zhang et al. 2020). Briefly, 50 µL of TL extract in methanol, 110 µL of ultra-pure water, and 20 µL of FeCl2 solution (0.5 mM) were mixed in a microplate and incubated for 5 min. Subsequently, 20 µL of ferrozine solution (2.5 mM) was added and incubated for 10 min. The absorbance was recorded at 562 nm against a blank sample (ferrozine solution was replaced with water). Ethylenediaminetetraacetic acid disodium salt (EDTANa2) was used as a positive reference. The IC50 values were calculated and expressed as the mean ± SD in μg/mL.
2.6.8 Copper chelating assay
The chelating activity for copper ions was assayed according to our previous method (Guo et al. 2022). Briefly, 40 µL of TL extract in ultra-pure water, 140 µL of acetic acid-sodium acetate buffer solution (pH 6.0, 50 mM), and 10 µL of CuSO4 solution (5 mM) were mixed in a microplate and incubated for 30 min. Subsequently, 10 µL of pyrocatechol violet solution (4 mM) was added and incubated for 30 min. The absorbance was recorded at 632 nm against a blank sample (pyrocatechol violet was replaced with water). EDTANa2 was used as a positive reference. The IC50 values were calculated and expressed as the mean ± SD in μg/mL.
2.6.9 H2O2 assay
The H2O2 scavenging activity was assayed according to our previous method (Guo et al. 2022). Briefly, 70 µL of phenol solution (pH 7.0, 12 mM, in 84 mM phosphate buffer (PBS)), 20 µL of 4-aminoantipyrine solution (pH 7.0, 0.5 mM, in 84 mM PBS), 32 μL of H2O2 solution (pH 7.0, 0.7 mM, in 84 mM PBS), 8 µL of horseradish peroxidise (EC 1.11.1.7) solution (pH 7.0, 1 U/mL, in 84 mM PBS) and 70 µL of TL extract (pH 7.0, in 84 mM PBS) were mixed in a microplate and the absorbance of the sample was recorded immediately at 504 nm against a blank sample (phenol solution was replaced with PBS). Ferulic acid was used as a positive reference. The IC50 values were calculated and expressed as the mean ± SD in μg/mL.
2.6.10 β-Carotene bleaching assay
The β-carotene method was carried out according to our previous method (Zhang et al. 2020). Briefly, β-carotene solution was prepared by dissolving β-carotene (2 mg) in CHCl3 (10 mL). Then, 2 mL of the solution was pipetted into a flask and vortex-mixed with linoleic acid (40 mg) and Tween 40 (400 mg). After the removal of CHCl3, 100 mL of oxygenated ultrapure water was added, and the emulsion shaken vigorously. Aliquots (2.4 mL) of the emulsion were pipetted into different test tubes containing 0.1 mL of TL extract in methanol (5 mg/mL). BHT and butyl hydroxyanisole (BHA) were used as positive controls. In the control group, TL extract was replaced with water. When the sample was added to the emulsion, it was recorded as t = 0 min. The tubes were capped and placed in a water bath at 60 °C. The absorbance was recorded at 470 nm every 15 min until 120 min. Antioxidant activity coefficient (AAC) was calculated according to the following equation: where AA(120) is the absorbance of the antioxidant at 120 min, AC(120) is the absorbance of the control at 120 min, and AC(0) is the absorbance of the control at 0 min.
2.6.11 NO assay
The NO scavenging activity was assayed according to our previous method (Guo et al. 2022). Briefly, 3 mL of TL extract in methanol (1 mg/mL) and 3 mL of sodium nitroprusside solution (pH 7.4, 5 mM, in 0.1 M PBS) were mixed in an Eppendorf tube and incubated at 25 °C for 150 min. At intervals, 100 μL of the sample was pipetted from each Eppendorf tube onto a microplate containing 100 µL of Griess reagent. In the control group, TL extract was replaced with methanol. The absorbance was recorded at 546 nm against a blank sample (Griess reagent was replaced with distilled water). Curcumin (0.1 mg/mL) was used as a positive reference.
2.7 Enzyme inhibition assay
2.7.1 α-Glucosidase inhibition assay
The α-glucosidase inhibitory activity was assayed according to our previous method (Zhang et al., 2020). Briefly, 20 μL of TL extract in DMSO (10 mg/mL) and 100 µL of yeast α-glucosidase (EC 3.2.1.20) solution (pH 6.9, 0.1 U/mL, in 0.1 M PBS) were mixed in a microplate and incubated at 25 °C for 10 min. Subsequently, 50 μL of p-nitrophenyl-α- D-glucopyranoside solution (pH 6.9, 5 mM, in 0.1 M PBS) was added and incubated at 25 °C for 5 min. Before and after incubation, the absorbance was recorded at 405 nm. In the control group, TL extract was replaced with DMSO. Acarbose was used as a positive reference. The inhibitory activity was expressed as % inhibition and was calculated as follows:
2.7.2 α-Amylase inhibition assay
The α-amylase inhibitory activity was assayed according to our previous method (Zhang et al. 2020). Briefly, 20 μL of TL extract in DMSO, 80 µL of distilled water, and 100 µL of porcine pancreatic α-amylase (EC 3.2.1.1) solution (pH 6.9, 4 U/mL, in 20 mM PBS) were mixed in an Eppendorf tube and incubated at 25 °C for 5 min. Subsequently, 200 µL of 0.5% starch solution (pH 6.9, in 20 mM PBS) was added and incubated at 25 °C for 3 min. Then, 200 µL of the mixture was removed from the Eppendorf tube and added to a separate Eppendorf tube containing 100 µL of 3,5-dinitrosalicylic acid reagent solution and placed in a 85 °C water bath. After 15 min, the mixture was removed from the water bath and diluted with 900 µL of distilled water. The absorbance was recorded at 540 nm. In the control group, TL extract was replaced with DMSO. In the blank group, enzyme solution was replaced with PBS. Acarbose was used as a positive reference. The inhibitory activity was expressed as % inhibition and was calculated as follows:
2.7.3 AChE inhibition assay
The AChE inhibitory activity was assayed according to our previous method (Zhang et al. 2020). Briefly, 20 μL of TL extract in 10% DMSO (1 mg/mL), 120 µL of PBS (pH 8.0, 0.1 M) and 20 µL of AChE (EC 3.1.1.7) solution (pH 8.0, 0.8 U/mL, in 0.1 M PBS) were mixed in a microplate and incubated at 25 °C for 15 min. Subsequently, 20 μL of acetylthiocholine iodide (ATCI) solution (pH 8.0, 1.78 mM, in 0.1 M PBS) and 20 μL 5,5′-dithiobis-(2-nitrobenzoic acid) (DTNB) solution (pH 8.0, 1.25 mM, in 0.1 M PBS) were added and incubated at 25 °C for 5 min. Before and after incubation, the absorbance was recorded at 405 nm. In the control group, TL extract was replaced with 10% DMSO. Donepezil was used as a positive reference. The inhibitory activity was expressed as % inhibition and was calculated as follows:
2.7.4 BChE inhibition assay
The BChE inhibitory activity was assayed according to our previous method (Zhang et al. 2020). Briefly, 20 μL of TL extract in 10% DMSO (1 mg/mL), 120 µL of PBS (pH 8.0, 0.1 M), and 20 µL of BChE (EC 3.1.1.8) solution (pH 8.0, 0.8 U/mL, in 0.1 M PBS) were mixed in a microplate and incubated at 25 °C for 15 min. Subsequently, 20 μL of S-butyrylthiocholine chloride solution (pH 8.0, 0.4 mM, in 0.1 M PBS) and 20 μL of DTNB solution (pH 8.0, 1.25 mM, in 0.1 M PBS) were added and incubated at 25 °C for 5 min. Before and after incubation, the absorbance was recorded at 405 nm. In the control group, TL extract was replaced with 10% DMSO. Donepezil was used as a positive reference. The inhibitory activity was expressed as % inhibition and was calculated as follows:
2.7.5 Tyrosinase inhibition assay
The tyrosinase inhibitory activity was assayed according to the method with slight modifications (Liang et al. 2012). Briefly, 100 μL of L-tyrosine solution (pH 6.8, 5 mM, in 0.1 M PBS), 20 µL of PBS (pH 6.8, 0.1 M) and 40 µL of TL extract in 10% DMSO (5 mg/mL) were mixed in a microplate. Subsequently, 40 μL of mushroom tyrosinase (EC 1.14.18.1) solution (pH 6.8, 200 U/mL, in 0.1 M PBS) was added and incubated at 37 °C for 20 min. The absorbance was recorded at 450 nm. In the control group, TL extract was replaced with 10% DMSO. In the blank group, enzyme solution was replaced with PBS. Arbutin was used as a positive reference. The inhibitory activity was expressed as % inhibition and was calculated as follows:
2.7.6 Urease inhibition assay
The urease inhibitory activity was assayed according to the method with slight modifications (Aslam et al. 2011 & Sedaghati et al., 2021). Briefly, 60 μL of urea solution (pH 7.4, 100 mM, in 0.01 M PBS), 15 µL of jack bean urease (EC 3.5.1.5) solution (pH 7.4, 5 U/mL, in 0.01 M PBS) and 15 µL of TL extract in PBS (pH 7.4, 0.01 M) were mixed in a microplate and incubated at 37 °C for 30 min. Subsequently, 60 μL of phenol reagents and 60 μL of alkali reagent were added and incubated at 37 °C for 30 min. The absorbance was recorded at 625 nm. In the control group, TL extract was replaced with PBS. In the blank group, enzyme solution was replaced with PBS. Thiourea was used as a positive reference. The inhibitory activity was expressed as % inhibition and was calculated as follows:
2.7.7 XO inhibition assay
The XO inhibitory activity was assayed according to the method with slight modifications (Nguyen et al. 2004). Briefly, 50 μL of TL extract in PBS (pH 7.5, 5 mg/mL, 0.07 M), 35 µL of PBS (pH 7.5, 0.07 M) and 30 µL of XO (EC 1.17.3.2) solution (pH 7.5, 0.01 U/mL, in 0.07 M PBS) were mixed in a quartz microplate and incubated at 25 °C for 15 min. Subsequently, 60 μL of xanthine solution (pH 7.5, 150 μM, in 0.07 M PBS) was added and the solution was incubated at 25 °C for 30 min. The reaction was stopped by adding 25 µL of 1 M HCl. The absorbance was recorded at 290 nm. In the control group, TL extract was replaced with PBS. The enzyme solution was added to the microplate after adding HCl. In the blank group, enzyme solution was replaced with PBS. Allopurinol was used as a positive reference. The inhibitory activity was expressed as % inhibition and was calculated as follows:
2.7.8 ACE inhibition assay
The ACE inhibitory activity was assayed according to the method with slight modifications (Liu et al. 2020). Briefly, 50 μL of ACE (EC 3.4.15.1) solution (pH 8.2, 0.025 U/mL, in 0.08 M 2-[4-(2-Hydroxyethyl)-1-piperazinyl]ethanesulfonic acid (HEPES) buffer with 0.3 M NaCl), 100 µL of TL extract in HEPES (pH 8.2, 1 mg/mL, 0.08 M HEPES buffer with 0.3 M NaCl) and 50 µL of N-[3-(2-Furyl)acryloyl]-Phe-Gly-Gly solution (pH 8.2, 1 mM, in 0.08 M HEPES buffer with 0.3 M NaCl) were mixed in a microplate and incubated at 37 °C for 30 min in the dark. Before and after incubation, the absorbance was recorded at 340 nm. Captopril was used as a positive reference. In the control group, TL extract was replaced with HEPES. In the blank group, enzyme solution was replaced with HEPES. The inhibitory activity was expressed as % inhibition and was calculated as follows: where AS(0) is the absorbance of the sample at 0 min, AS(30) is the absorbance of the sample at 30 min, AC(0) is the absorbance of the control at 0 min, and AC(30) is the absorbance of the control at 30 min.
2.8 Stability studies of methanol extract
2.8.1 pH stability
pH and thermal stabilities of methanol extract were evaluated according to the method with slight modifications (Mihailović et al. 2015). The stability in acidic and basic environments was investigated using a methanol extract dissolved in deionised water with the pH adjusted to 1, 3, 5, 7, 9, or 11 using 1 M HCl or 1 M NaOH. The final concentration of methanol extract was 50 mg/mL. After incubation at room temperature for 1 h, the pH of the mixture was adjusted to 7 and the total peak area for thirteen peaks was calculated. Peaks 1, 8, 9, 12, and 18 were excluded from this calculation because the compounds either could not be identified (peaks 8, 9, and 12) or had no antioxidant activity (peaks 1 and 18). The pH stability was calculated for the total peak area of the thirteen peaks at pH 7. The TPheC and ABTS scavenging abilities were examined.
2.8.2 Thermal stability
To evaluate the thermal stability, methanol extract dissolved in deionised water (50 mg/mL, pH 7) was placed in test tubes with screw caps. The test tubes were placed in a boiling water bath (100 °C). Samples were removed after 0, 15, 30, 60, 120, 180, and 240 min and cooled in an ice-water bath. The thermal stability was calculated for the total peak area of the thirteen peaks. The TPheC and ABTS scavenging abilities were examined.
2.8.3 Modeling of the stability in the gastrointestinal tract
The digestion process of methanol extract was performed according to the method with slight modifications (Mihailović et al. 2015). 100 mL of methanol extract in distilled water (5 mg/mL) were mixed with 10 mL of PBS (pH 6.8, 10 mM) and incubated at 37 °C for 2 min (oral condition). Then 0.5 mL of 1 M HCl-KCl buffer (pH 1.5) and 5 mL of pepsin solution (pH 1.5, 32 U/mL in 1 M HCl-KCl buffer) were added to samples. The mixtures incubated at 37 °C for 60 min (stomach condition). Thereafter, in the mixture was added 1 mL of 1 M NaHCO3 together with 1 mL of mixture of bile and pancreatic juice (pH 8.2, 10 mg/mL of pancreatin, 14,600 U/mL of trypsin, 13.5 mg/mL of bile extract in 10 mM PBS) and the pH was adjusted to 6.8. The mixtures incubated at 37 °C for 3 h (duodenal condition). Samples for calculation of the total peak area of thirteen peaks were taken at 0, 0.5, 1, 2, 3, and 4 h. The results were used for determination of TPheC and ABTS scavenging abilities of methanol extract during simulated gastrointestinal (GI) digestion. The thermal and GI stabilities were calculated using the total peak area of the thirteen peaks at 0 h.
2.9 Oxidative stability of the oils
Extra virgin olive oil (EVOO) and cold-pressed sunflower oil (CPSO) were placed in separate flasks. Methanol extract was added to the EVOO and CPSO flasks at concentrations of 1000 and 250 μg/g. To compare with the stabilizing effect of methanol extract, EVOO and CPSO were supplemented with synthetic antioxidants BHT and tertiary butylhydroquinone (TBHQ) at 200 μg/g. A control group was prepared without antioxidants. The flasks were left open and placed in an oil bath at 160 °C to simulate frying. Two samples from each category were removed from the flasks every 4 h for duplicate analysis.
The oxidative stability of the oils was evaluated by measurement of the free acidity (percentage of oleic acid), peroxide values (milliequivalents of O2/kg oil), and ultraviolet absorption at 232 and 270 nm (K232 and K270) following the analytical methods of the European Communities (EEC, 1991).
2.10 Cell-viability assay
The cell viability was tested against a TM3 mouse leydig cell line using the 3-(4,5-dimethylthiazol-2-yl)-2,5-diphenyl-2H-tetrazolium bromide (MTT) assay as described (Guo et al., 2022). Briefly, 100 µL of a cell suspension (8 × 10⁴ cells/mL) was seeded onto a microplate and incubated at 37 °C for 24 h in an atmosphere of CO2 in a humidified incubator. After incubation, 100 μL of methanol extract was added. Five duplicate wells in each group were set up. Cell-free medium was employed as a blank group for zero adjustment during measurement. After incubation for 24 h and 48 h, respectively, 20 μL of MTT solution (5 mg/mL) was added and incubated at 37 °C for 4 h. The culture medium was removed, 200 μL of DMSO was added to solubilise the formazan formed. The absorbance was recorded at 570 nm.
2.11 Acute oral toxicity tests
We adopted all animal-related policies as described in the guidelines of Tonghua Normal University regarding the use of experimental animals. The acute oral toxicity was tested according to our previous method (Guo et al., 2022). The toxicity after a single oral administration of methanol extract was evaluated in female Kunming mice. Methanol extract was administered intragastrically at a dose of 500 mg/kg. Animals in the control group received canola oil (10 mL/kg). All the animals were monitored over 24 h. After this period, the survival rate of the mice was calculated, and any remaining live mice were euthanised with isoflurane.
2.12 Statistical analysis
One-way analysis of variance (ANOVA) with post-hoc LSD test was conducted to determine significant differences (in total active components, antioxidant and enzyme inhibitory assays) between the extracts (p < 0.05). Exploratory multivariate analysis (PCA and HCA) were performed to clustered the extracts and Pearson’s correlation was done to evaluate the relationship between evaluated biological activities and total active components content.
3 Results
3.1 Qualitative phytochemical analysis
Phytochemical studies of TL indicated the presence of proteins, carbohydrates, organic acids, phenols, tannins, saponins, flavonoids, coumarins, steroids, terpenoids, volatile oils, and fats, and only cardiac glycosides, alkaloids, anthraquinones, and cyanogenic glycosides were not detected in TL (Table 1, Figs. S2–S43). The phytochemical properties of the samples were closely related to their biological activities. Many studies have reported that these constituents can serve as antioxidants and enzyme inhibitors (Ahmad et al., 2021). (+) indicates presence; (–) indicates absence; (○) indicates no test.
Phytochemicals
Type of tests
Sample solution
Water
Methanol
Ethanol
Petroleum ether
Proteins/amino acids
1. Ninhydrin tests
+
○
○
○
2. Biuret tests
+
○
○
○
Carbohydrates
1. Fehling’s tests
+
○
○
○
2. Benedict’s tests
+
○
○
○
3. Molisch’s tests
+
○
○
○
4. Iodine tests
+
○
○
○
Phenols
1. FeCl3 tests
+
○
○
○
2. FeCl3-K3[Fe(CN)6] tests
+
○
○
○
3. Diazotization tests
+
○
○
○
Organic acids
1. pH tests
+
○
○
○
2. Blue litmus paper tests
+
○
○
○
3. Bromocresol green tests
+
○
○
○
Tannins
1. FeCl3 tests
+
○
○
○
2. Bromine water tests
+
○
○
○
3. Lead acetate tests
+
○
○
○
4. Lime water tests
+
○
○
○
5. Gelatin tests
+
○
○
○
Flavonoids
1. Shinoda tests
○
+
○
○
2. Alkaline reagent tests
○
+
○
○
3. AlCl3 tests
○
+
○
○
4. Lead acetate tests
○
+
○
○
Saponins
1. Foam tests
+
○
○
○
Steroids and triterpenoids
1. Liebermann-Burchard tests
+
○
○
○
2. Salkowski tests
○
+
○
○
Terpenoids
1. CHCl3-H2SO4 tests
○
+
○
○
2. Vanillin-H2SO4 tests
○
○
○
+
Alkaloids
1. Bertrad’s reagent tests
○
○
–
○
2. Dragendorff’s reagent tests
○
○
–
○
3. Mayer’s reagent tests
○
○
–
○
Anthraquinones
1. Borntrager’s tests
○
–
○
○
2. Magnesium acetate tests
○
–
○
○
Coumarins and lactones
1. Hydroxamic acid iron tests
○
+
○
○
2. Diazotization tests
+
○
○
○
3. Fluorescence tests
○
+
○
○
Volatile oils and fats
1. Phosphomolybdic acid tests
○
+
○
○
2. Vanillin-H2SO4 tests
○
+
○
○
3. Sudan tests
○
+
○
○
Cardiac glycosides
1. Kedde tests
○
–
○
○
2. Raymond tests
○
–
○
○
3. Legal tests
○
–
○
○
Cyanogenic glycosides
1. Prussian blue tests
–
○
○
○
3.2 Yield in various solvent extracts
We investigated the yield of TL extraction in different solvents. The yield of the hexane, dichloromethane, ethyl ether, ethyl acetate, acetone, ethanol, methanol, and aqueous extract was ranged from 2.1 ± 0.0% to 29.4 ± 0.1% (Table 2). The high yield for the aqueous extract may have been due to the high content of water-soluble components (e.g., polyphenols, carbohydrates, organic acids and proteins) in TL extract. a–g Columns with different superscripts indicate a significant difference (p < 0.05). Yield was calculated as % yield = (weight of dry extract/initial weight of dry sample) × 100. TCC: Total carbohydrate content. TProC: Total protein content. TTriC: Total triterpenoid content. GE: Glucose equivalent. BSAE: BSA equivalent. GRE: ginsenoside Re equivalent. Values are the mean ± standard deviation of three independent experiments.
Extracting solvents
Yields (%, w/w)
TCC (mg GE/g extract)
TProC (mg BSAE/g extract)
TTriC (mg GRE/g extract)
Water
29.4 ± 0.1a
217.8 ± 0.4c
244.9 ± 7.3a
0.3 ± 0.0e
Methanol
12.6 ± 0.2b
341.7 ± 4.1a
58.5 ± 1.2b
0.2 ± 0.0e
Ethanol
8.7 ± 0.1c
291.6 ± 3.1b
NONE
1.6 ± 0.1c
Acetone
6.3 ± 0.1d
19.8 ± 0.3f
NONE
1.9 ± 0.1b
Ethyl acetate
3.7 ± 0.0e
73.3 ± 1.3d
NONE
0.6 ± 0.0d
Ethyl ether
2.2 ± 0.1 g
58.2 ± 2.1e
NONE
1.5 ± 0.0c
Dichloromethane
2.7 ± 0.0f
19.9 ± 0.3f
NONE
3.4 ± 0.1a
Hexane
2.1 ± 0.0 g
16.7 ± 0.2f
NONE
0.5 ± 0.0d
3.3 UPLC-MS analysis
From the UPLC-MS data (Table 3), 18 chromatographic peaks were identified. Identification of the compounds was achieved by comparison to mass spectral data in the literature. The structures of the identified compounds are shown in Fig. 1. The UPLC results are shown in Fig. 2. The MS and MS/MS results are shown in Figs. S44–S75. Our experimental results showed that the accurate mass error values were below 5 ppm (Ismail et al.,2019).
Peak No.
RT (min)
Identification
Molecular formula
Actual m/z [M−H]-
Experimental m/z [M−H]-
Error (ppm)
MS/MS fragments m/z
1
2.91
Sucrose
C12H22O11
387.1139
387.1150a
−2.84
341.1095, 179.0556, 161.0448
2
11.02
Chlorogenic acid
C16H18O9
353.0873
353.0884
−3.12
191.0559, 161.0237
3
11.88
Caffeoyl hexoside
C15H18O9
341.0873
341.0883
−2.93
179.0346, 112.9846
4
12.70
4-O-p-Coumaroylquinic acid
C16H18O8
337.0923
337.0936
−3.86
191.0558, 173.0450, 163.0394
5
13.87
5-O-p-Coumaroylquinic acid
C16H18O8
337.0923
337.0936
−3.86
191.0558, 163.0394
6
14.70
Gossypitrin
C21H20O12
509.0932
509.0938a
−1.18
463.0890, 301.0359
7*
14.88
Luteoloside/Kaempferol 7-O-β-D-glucopyranoside
C21H20O11
493.0982
493.0992a
−2.03
447.0943, 285.0411
8
15.09
Unknown
343.1403
119.0856, 89.0232
9
15.57
Unknown
723.5034a
677.4981, 61.9871
10*
16.03
3,4-Dicaffeoylquinic acid/3,5-Dicaffeoylquinic acid/4,5-Dicaffeoylquinic acid
C25H24O12
515.1190
515.1198
−1.55
353.0885, 191.0558, 179.0345
11
16.31
Apigetrin
C21H20O10
431.0978
431.0987
−2.09
269.0459
12
16.58
Unknown
547.3129a
501.3080, 353.0885, 179.0345, 173.0450
13*
20.07
Luteolin/Kaempferol
C15H10O6
285.0399
285.0410
−3.86
—
14
20.28
Quercetin
C15H10O7
301.0348
301.0359
−3.65
—
15
22.36
Apigenin
C15H10O5
269.0450
269.0457
−2.60
—
16
22.90
Luteolin 7-methyl ether
C16H12O6
299.0556
299.0566
−3.34
284.0333
17
23.34
Isorhamnetin
C16H12O7
315.0505
315.0517
−3.81
300.0282, 112.9846
18
23.56
(9R*,10S*,7E)-6,9,10-trihydroxyoctadec −7-enoic acid
C18H34O5
329.2328
329.2338
−3.04
229.1446
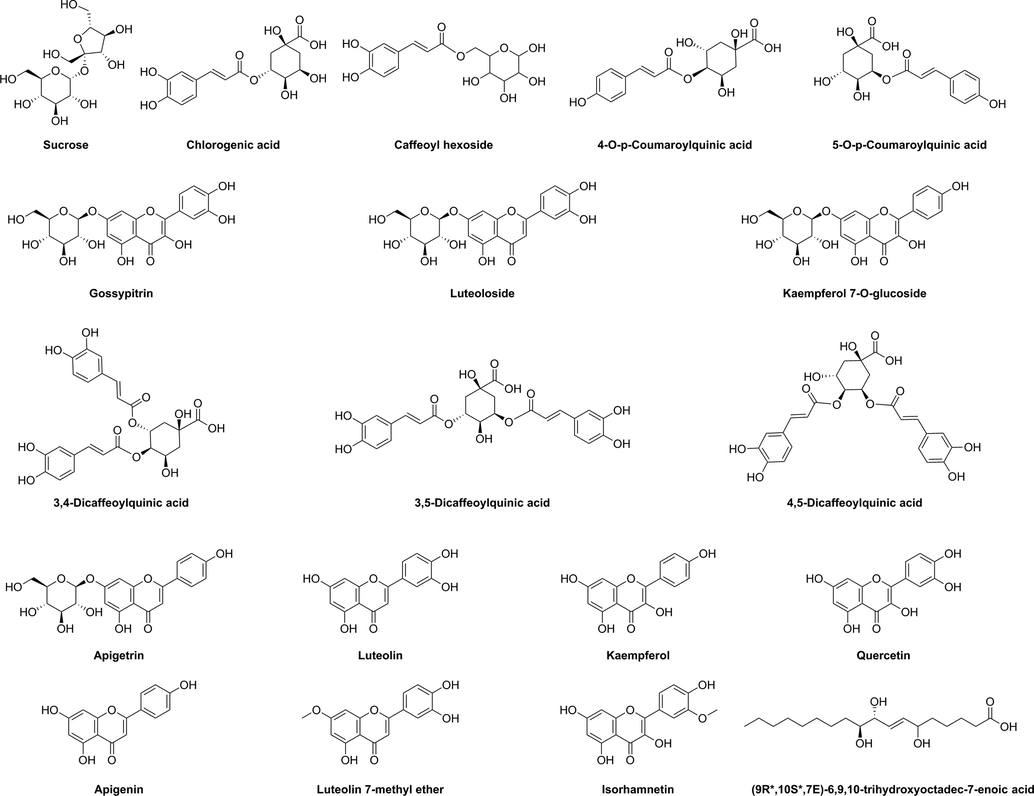
Chemical structures of compounds identified in the Tripleurospermum limosum extract.
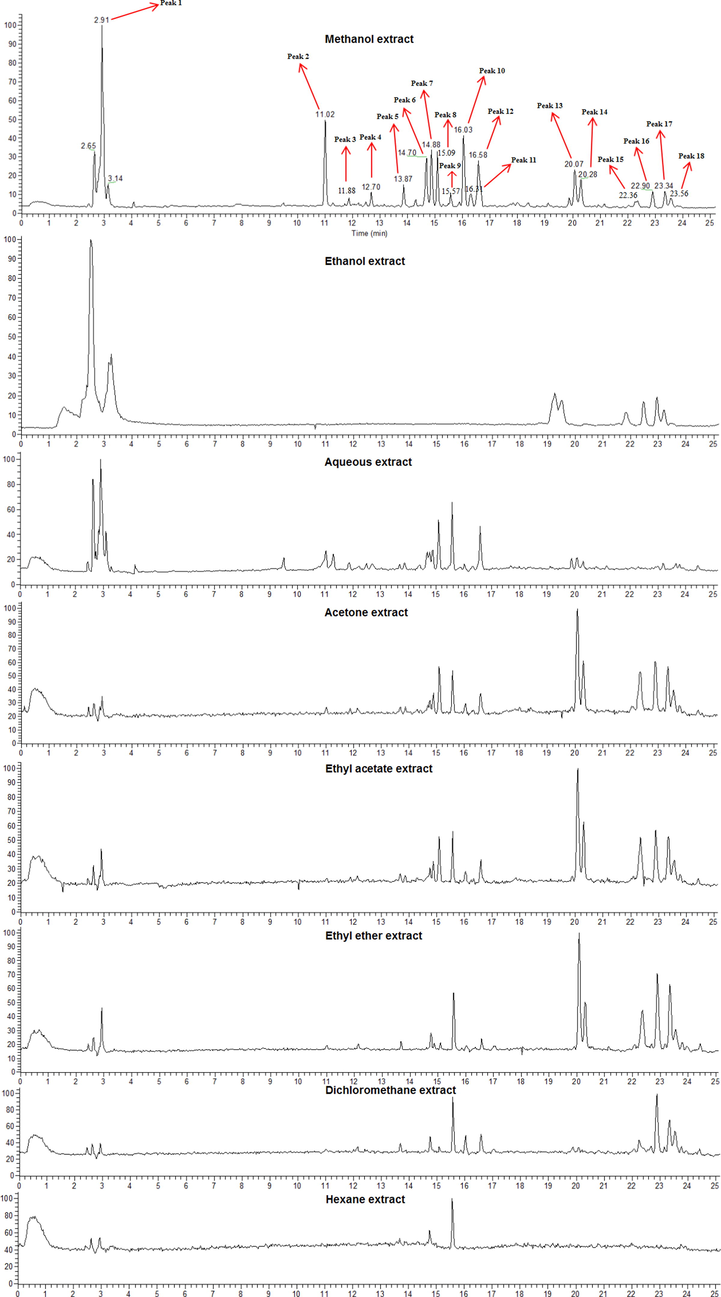
Ultra-performance liquid chromatography–mass spectra acquired in negative ion mode for different extracts of Tripleurospermum limosum.
The mass spectrum of peak 1 (retention time: 2.91 min) revealed an ion at m/z 387.1150 (Table 3). The MS/MS spectrum of this ion showed a fragment at m/z 341.1095, which was attributed to loss of formic acid (46 Da) from the deprotonated ion at m/z 387.1150. A fragment at m/z 179.0556 was obtained after loss of hexose (162 Da) from the deprotonated ion at m/z 341.1095. Using information from the literature, the fragmentation data, high-resolution accurate molecular weight (HRAMW), and secondary fragmentation law, peak 1 was identified as sucrose (Islam et al., 2020).
The mass spectrum of peak 2 (retention time: 11.02 min) revealed an ion at m/z 353.0884 (Table 3). The MS/MS spectrum of this ion showed a fragment at m/z 191.0559, which was attributed to loss of caffeoyl (162 Da) from the deprotonated ion at m/z 353.0884. A fragment at m/z 161.0237 was obtained after loss of quinic acid (192 Da) from the deprotonated ion at m/z 353.0884. Using information from the literature, the fragmentation data, HRAMW, and secondary fragmentation law, peak 2 was identified as chlorogenic acid (Mokrani et al., 2016).
The mass spectrum of peak 3 (retention time: 11.88 min) revealed an ion at m/z 341.0883 (Table 3). The MS/MS spectrum of this ion showed a fragment at m/z 179.0346, which was attributed to loss of hexose (162 Da) from the deprotonated ion at m/z 341.0883. Using information from the literature, the fragmentation data, HRAMW, and secondary fragmentation law, peak 3 was identified as caffeoyl hexoside (Monção et al., 2015).
The mass spectrum of peak 4 (retention time: 12.70 min) revealed an ion at m/z 337.0936 (Table 3). The MS/MS spectrum of this ion showed a fragment at m/z 191.0558, which was attributed to loss of coumaroyl (146 Da) from the deprotonated ion at m/z 337.0936. Using information from the literature, the fragmentation data, HRAMW, and secondary fragmentation law, peak 4 was identified as 4-O-p-coumaroylquinic acid (Krzyżanowska-Kowalczyk et al., 2018).
The mass spectrum of peak 5 (retention time: 13.87 min) revealed an ion at m/z 337.0936 (Table 3). The MS/MS spectrum of this ion showed a fragment at m/z 191.0558, which was attributed to loss of coumaroyl (146 Da) from the deprotonated ion at m/z 337.0936. Using information from the literature, the fragmentation data, HRAMW, and secondary fragmentation law, peak 5 was identified as 5-O-p-coumaroylquinic acid (Krzyżanowska-Kowalczyk et al., 2018).
The mass spectrum of peak 6 (retention time: 14.70 min) revealed an ion at m/z 509.0938 (Table 3). The MS/MS spectrum of this ion showed a fragment at m/z 463.0890, which was attributed to loss of formic acid (46 Da) from the deprotonated ion at m/z 509.0938. A fragment at m/z 301.0359 (aglycone form of quercetin) was obtained after loss of hexose (162 Da) from the deprotonated ion at m/z 463.0890. Using information from the literature, the fragmentation data, HRAMW, and secondary fragmentation law, peak 6 was identified as gossypitrin (Jiang et al.,2021).
The mass spectrum of peak 7 (retention time: 14.88 min) revealed an ion at m/z 493.0992 (Table 3). The MS/MS spectrum of this ion showed a fragment at m/z 447.0943, which was attributed to loss of formic acid (46 Da) from the deprotonated ion at m/z 493.0992. A fragment at m/z 285.0411 (aglycone form of luteolin or kaempferol) was obtained after loss of hexose (162 Da) from the deprotonated ion at m/z 447.0943. Using information from the literature, the fragmentation data, HRAMW, and secondary fragmentation law, peak 7 was identified as luteoloside (Mudrić et al., 2017) or kaempferol 7-O-β-D-glucopyranoside (Ferron et al., 2020).
The mass spectrum of peak 8 (retention time: 15.09 min) revealed an ion at m/z 343.1403 (Table 3). The MS/MS spectrum of this ion showed a fragment at m/z 119.0856 and 89.0232.
The mass spectrum of peak 9 (retention time: 15.57 min) revealed an ion at m/z 723.5034 (Table 3). The MS/MS spectrum of this ion showed a fragment at m/z 677.4981 and 61.9871.
The mass spectrum of peak 10 (retention time: 16.03 min) revealed an ion at m/z 515.1198 (Table 3). The MS/MS spectrum of this ion showed a fragment at m/z 353.0885, which was attributed to loss of caffeoyl (162 Da) from the deprotonated ion at m/z 515.1198. A fragment at m/z 191.0558 was obtained after loss of caffeoyl (162 Da) from the deprotonated ion at m/z 353.0885. Using information from the literature, the fragmentation data, HRAMW, and secondary fragmentation law, peak 10 was identified as 3,4-dicaffeoylquinic acid, 3,5-dicaffeoylquinic acid, or 4,5-dicaffeoylquinic acid (Turan Ayseli et al., 2021).
The mass spectrum of peak 11 (retention time: 16.31 min) revealed an ion at m/z 431.0987 (Table 3). The MS/MS spectrum of this ion showed a fragment at m/z 269.0459 (aglycone form of apigenin), which was attributed to loss of hexose (162 Da) from the deprotonated ion at m/z 431.0987. Using information from the literature, the fragmentation data, HRAMW, and secondary fragmentation law, peak 11 was identified as apigetrin (Xue et al., 2022).
The mass spectrum of peak 12 (retention time: 16.58 min) revealed an ion at m/z 547.3129 (Table 3). The MS/MS spectrum of this ion showed a fragment at m/z 501.3080, 353.0885, 179.0345, and 173.0450.
The mass spectrum of peak 13 (retention time: 20.07 min) revealed an ion at m/z 269.0457 (Table 3). Using information from the literature, the fragmentation data, HRAMW, and secondary fragmentation law, peak 13 was identified as luteolin (Seifzadeh et al., 2019) or kaempferol (Yin et al., 2019).
The mass spectrum of peak 14 (retention time: 20.28 min) revealed an ion at m/z 301.0359 (Table 3). Using information from the literature, the fragmentation data, HRAMW, and secondary fragmentation law, peak 14 was identified as quercetin (Yin et al., 2019).
The mass spectrum of peak 15 (retention time: 22.36 min) revealed an ion at m/z 269.0457 (Table 3). Using information from the literature, the fragmentation data, HRAMW, and secondary fragmentation law, peak 15 was identified as apigenin (Xue et al., 2022).
The mass spectrum of peak 16 (retention time: 22.90 min) revealed an ion at m/z 299.0566 (Table 3). The MS/MS spectrum of this ion showed a fragment at m/z 284.0333, which was attributed to loss of methyl (15 Da) from the deprotonated ion at m/z 299.0566. Using information from the literature, the fragmentation data, HRAMW, and secondary fragmentation law, peak 16 was identified as luteolin 7-methyl ether (Kuo et al., 2020).
The mass spectrum of peak 17 (retention time: 23.34 min) revealed an ion at m/z 315.0517 (Table 3). The MS/MS spectrum of this ion showed a fragment at m/z 300.0282, which was attributed to loss of methyl (15 Da) from the deprotonated ion at m/z 315.0517. Using information from the literature, the fragmentation data, HRAMW, and secondary fragmentation law, peak 17 was identified as isorhamnetin (Yin et al., 2019).
The mass spectrum of peak 18 (retention time: 23.56 min) revealed an ion at m/z 329.2338 (Table 3). Using information from the literature, the fragmentation data, HRAMW, and secondary fragmentation law, peak 18 was identified as (9R*,10S*,7E)-6,9,10-trihydroxyoctadec-7-enoic acid (Benavides et al., 2009).
3.4 Comparison of the chemical compositions of different extracts
UPLC-MS analysis of the eight solvent extracts showed that the peak areas varied for each of the eighteen peaks in the different extracts. The peak areas in methanol extract were relatively high, so we used it as a standard to calculate the relative contents in the other solvent extracts (Table 4).
Extracting solvents
Relative content (%)
Peak No.
Water
Methanol
Ethanol
Acetone
Ethyl acetate
Ethyl ether
Dichloromethane
Hexane
1
27.8
100.0
108.1
3.1
4.4
7.7
11.9
2.4
2
11.6
100.0
1.0
2.6
1.2
2.4
1.9
0.0
3
34.3
100.0
0.0
12.5
13.8
0.0
3.6
0.0
4
26.0
100.0
0.0
3.0
8.5
3.3
6.4
0.0
5
16.6
100.0
0.0
10.2
7.2
0.0
0.0
0.0
6
5.7
100.0
0.0
1.1
0.0
0.0
0.0
0.0
7
10.2
100.0
0.0
5.5
11.3
2.6
0.6
0.0
8
34.9
100.0
1.9
18.8
18.9
3.7
3.7
0.8
9
182.2
100.0
6.1
62.0
66.7
117.1
101.2
59.4
10
3.3
100.0
0.0
3.4
0.0
0.0
6.6
0.0
11
13.1
100.0
0.0
7.7
0.0
0.0
0.0
0.0
12
26.2
100.0
0.6
7.4
6.8
4.5
8.6
0.0
13
11.2
100.0
0.0
58.5
59.5
89.2
3.4
0.0
14
9.2
100.0
2.6
0.0
35.9
48.5
1.4
0.0
15
7.2
100.0
141.7
115. 9
140.9
155.7
0.0
0.0
16
9.5
100.0
109.3
60.8
66.6
142.7
106.9
0.0
17
2.1
100.0
139.4
58.7
60.6
117.7
59.7
0.0
18
16.5
100.0
118.1
49.0
44.2
51.3
64.0
0.0
3.5 Quantitative phytochemical analysis
The amounts of nine active components were measured (Table 2 and Table 5): Methanol extract yielded the highest TCC and TFC. Ethanol extract achieved the highest TPAC, TTanC, and CTC; aqueous extract had the highest TProC, TPheC, and GC; dichloromethane extract had the highest TTriC. The contents of some active components in aqueous extract were relatively low, but considering the yield, water was determined to be the most suitable solvent for extracting the greatest TCC, TPAC, CTC and TTanC from TL. The TCC of methanol extract and ethanol extract was high, possibly because TL contains phenolic glycosides and flavonoid glycosides. The TCC of aqueous extract was high because TL contains oligosaccharides and polysaccharides. a–h Columns with different superscripts indicate a significant difference (p < 0.05). TPheC: Total phenolic content. TFC: Total flavonoid content. TPAC: Total phenolic acid content. TTanC: Total tannin content. CTC: condensed tannin content. GC: gallotannin content. GAE: Gallic acid equivalent. QE: Quercetin equivalent. CAE: caffeic acid equivalent TAE: Tannic acid equivalent. Values are the mean ± standard deviation of three independent experiments.
Extracting solvents
TPheC (mg GAE/g extract)
TFC (mg QE/g extract)
TPAC (mg CAE/g extract)
TTanC (mg TAE/g extract)
CTC (mg GAE/g extract)
GC (mg GAE/g extract)
Water
42.2 ± 1.0a
5.4 ± 0.2 g
12.1 ± 0.5d
17.4 ± 0.0e
24.7 ± 0.1b
0.4 ± 0.0a
Methanol
27.7 ± 0.7b
65.6 ± 1.0a
23.3 ± 0.1b
47.8 ± 0.3b
23.5 ± 0.2c
0.1 ± 0.0b
Ethanol
22.5 ± 0.1c
59.6 ± 0.8b
34.0 ± 2.5a
54.5 ± 0.3a
25.3 ± 0.6a
NONE
Acetone
0.2 ± 0.0 g
29.4 ± 0.4d
22.8 ± 1.7b
33.7 ± 0.4c
8.7 ± 0.0d
0.1 ± 0.0b
Ethyl acetate
5.6 ± 0.0d
40.4 ± 0.5c
15.5 ± 0.8c
26.1 ± 0.0d
4.7 ± 0.1e
NONE
Ethyl ether
0.3 ± 0.0f
19.9 ± 0.4e
6.5 ± 0.4e
13.2 ± 0.2 g
1.3 ± 0.0f
NONE
Dichloromethane
0.9 ± 0.0e
18.8 ± 0.3e
5.0 ± 0.4e
14.9 ± 0.3f
1.4 ± 0.0f
NONE
Hexane
NONE
9.7 ± 0.4f
10.2 ± 0.6d
3.6 ± 0.1 h
1.7 ± 0.1f
NONE
3.6 DPPH, ABTS, hydroxyl and superoxide radical
Methanol extract (Table 6) exhibited the highest DPPH-, ABTS-,and hydroxyl radical-scavenging abilities, which was comparable to that of BHT. Table 6 shows that ethanol extract achieved the highest superoxide radical-scavenging rate. a-h Columns with different superscripts indicate a significant difference (p < 0.05). DPPH: 2,2-Diphenyl-1-picrylhydrazyl. ABTS: 2,2′-Azino-bis (3-ethylbenzothiazoline-6-sulphonic acid) diammonium salt. IC50: Concentration required to scavenge 50% of the radicals present in the test solution. Trolox: 6-Hydroxy-2,5,7,8-tetramethylchroman-2-carboxylic acid. BHT: Butylated hydroxytoluene. Values are the mean ± standard deviation of three independent experiments.
Extracting solvents
DPPH (IC50, μg/mL)
ABTS (IC50, μg/mL)
Hydroxyl radicals (IC50, μg/mL)
Superoxide radicals (%, 2143 μg/mL)
Water
257.7 ± 9.4f
354.3 ± 1.7 g
762.1 ± 28.9d
19.8 ± 1.3e
Methanol
30.4 ± 0.5c
76.3 ± 2.1c
182.7 ± 9.8b
45.2 ± 2.7c
Ethanol
33.3 ± 0.2d
108.5 ± 1.8e
907.3 ± 35.4e
48.8 ± 3.8b
Acetone
284.7 ± 4.3f
101.2 ± 1.5d
441.7 ± 0.1c
36.0 ± 0.7d
Ethyl acetate
148.2 ± 3.6e
252.2 ± 2.2f
1638.4 ± 25.3f
NONE
Ethyl ether
663.7 ± 27.1 g
>500 h
>2500 h
2.0 ± 0.1f
Dichloromethane
>5000 h
>500 h
2156.2 ± 30.3 g
NONE
Hexane
>5000 h
>500 h
>2500 h
NONE
L-ascorbic acid*
1.8 ± 0.0a
3.4 ± 0.1a
87.1 ± 0.3a
N.T.
Trolox*
2.0 ± 0.1a
3.8 ± 0.1a
97.5 ± 1.4a
N.T.
BHT*
9.3 ± 0.1b
4.7 ± 0.0b
208.0 ± 2.8b
N.T.
Curcumin*
N.T.
N.T.
N.T.
75.4 ± 0.3a
3.7 FRAP, CUPRAC and metal chelating capacity
Methanol extract showed the highest FRAP and CUPRAC (Table 7). Aqueous extract (Table 7) demonstrated the highest iron and copper chelating capacity, these results indicate that aqueous extract may be an effective copper chelating agent. a-h Columns with different superscripts indicate a significant difference (p < 0.05). FRAP: Ferric-reducing antioxidant power. CUPRAC: Cupric ion reducing antioxidant capacity. TEAC: Trolox equivalent antioxidant capacity. AAC: Antioxidant activity coefficient·H2O2: Hydrogen peroxide. BHT: Butylated hydroxytoluene. BHA: Butyl hydroxyanisole. EDTANa2: Ethylenediaminetetraacetic acid disodium salt. Trolox: 6-Hydroxy-2,5,7,8-tetramethylchroman-2-carboxylic acid. IC50: Concentration required to chelate 50% of the ferrous/copper ions present in the test solution. N.T. indicates not tested. Values are the mean ± standard deviation of three independent experiments.
Extracting solvents
TEACFRAP
TEACCUPRAC
Iron chelating IC50 (μg/mL)
Copper chelating IC50 (μg/mL)
H2O2 (IC50, μg/mL)
β-Carotene bleaching AAC
Water
0.09 ± 0.00f
0.05 ± 0.00 h
507.0 ± 16.7b
461.8 ± 18.0b
828.0 ± 65.3b
522.6 ± 0.3f
Methanol
0.17 ± 0.00c
0.40 ± 0.03c
1170.3 ± 49.3d
573.3 ± 17.9c
1250.1 ± 78.6d
583.3 ± 2.3e
Ethanol
0.15 ± 0.00d
0.39 ± 0.01c
1007.9 ± 35.8c
1215.6 ± 5.7 g
1239.9 ± 70.4c
732.4 ± 1.4c
Acetone
0.13 ± 0.00e
0.30 ± 0.02d
2966.6 ± 79.1f
>2000 h
2043.3 ± 97.5e
443.3 ± 1.3i
Ethyl acetate
0.10 ± 0.00f
0.24 ± 0.02e
>5000 g
793.1 ± 17.6d
>3500f
465.2 ± 2.1 h
Ethyl ether
0.08 ± 0.00f
0.10 ± 0.00 g
>5000 g
962.6 ± 12.4e
>3500f
597.6 ± 0.5d
Dichloromethane
0.10 ± 0.00f
0.13 ± 0.00f
>5000 g
1066.8 ± 32.1f
>3500f
253.6 ± 3.6j
Hexane
0.08 ± 0.00f
0.07 ± 0.00 h
1932.2 ± 72.1e
>2000 h
>3500f
513.3 ± 1.7 g
L-ascorbic acid*
0.98 ± 0.01a
1.40 ± 0.01a
N.T.
N.T.
N.T.
N.T.
Trolox*
1.00 ± 0.01a
1.00 ± 0.01b
N.T.
N.T.
N.T.
N.T.
BHT*
0.31 ± 0.00b
1.53 ± 0.01a
N.T.
N.T.
N.T.
935.3 ± 0.7a
BHA*
N.T.
N.T.
N.T.
N.T.
N.T.
914.4 ± 1.2b
Gallic acid*
N.T.
N.T.
N.T.
N.T.
20.1 ± 1.2a
N.T.
EDTANa2*
N.T.
N.T.
2.3 ± 0.1 a
41.6 ± 1.3 a
N.T.
N.T.
3.8 H2O2, β-carotene and NO
Ethanol extract demonstrated the highest H2O2-scavenging ability (Table 7). The absorbance of the β-carotene emulsion decreased with time (Fig. 3). Ethanol extract showed the best protection effect for β-carotene (Table 7) and almost reached that of BHA, and BHT. The experimental results indicated that TL extracts tested in this work can be used as antioxidants for oils. The absorbance of NO increased with time (Fig. 4), and methanol extract exhibited the best NO-scavenging ability.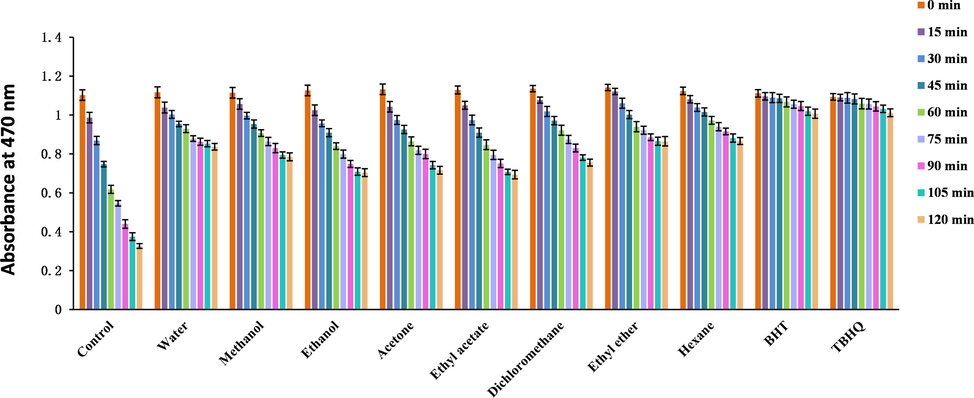
Absorbance changes with time in the β-carotene bleaching assay (BHT: Butylated hydroxytoluene; BHA: Butyl hydroxyanisole).
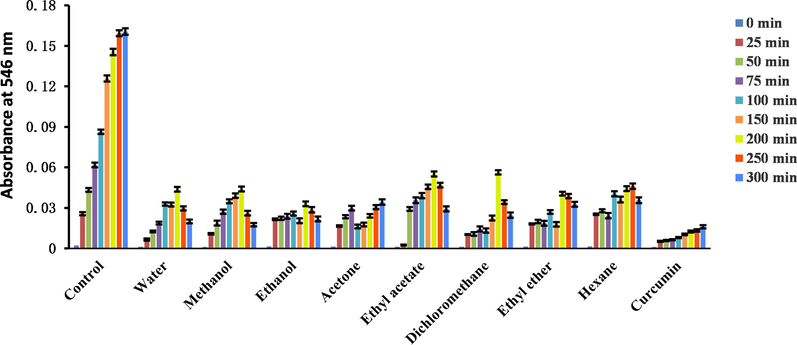
Absorbance changes with time in the nitric oxide scavenging assay.
3.9 α-Glucosidase, α-amylase, AchE and BchE
Acetone extract had the highest α-amylase and α-glucosidase inhibitory activity (Table 8). Aqueous extract and ethanol extract showed the highest, but still weak, inhibitory activities toward AchE and BchE, respectively (Table 8). a-h Columns with different superscripts indicate a significant difference (p < 0.05). AchE: Acetylcholinesterase. BchE: Butyrylcholinesterase. IC50: Concentration required to inhibit 50% of the enzyme present in the test solution. N.T. indicates not tested. Values are the mean ± standard deviation of three independent experiments.
Extracting solvents
α-Glucosidase (%, 800 μg/mL)
α-Amylase IC50 (μg/mL)
AchE (%, 100 μg/mL)
BchE (%, 100 μg/mL)
Water
16.0 ± 0.0 h
>50f
13.9 ± 0.3b
31.6 ± 0.3c
Methanol
28.9 ± 0.0 g
24.4 ± 0.5e
NONE
23.1 ± 0.8d
Ethanol
39.0 ± 0.0c
>50f
4.6 ± 0.2c
43.6 ± 1.0b
Acetone
46.1 ± 0.0b
8.7 ± 0.3b
4.2 ± 0.3d
41.8 ± 0.6b
Ethyl acetate
35.3 ± 0.0d
18.5 ± 0.7c
NONE
34.6 ± 1.3c
Ethyl ether
31.7 ± 0.1f
22.4 ± 0.5d
NONE
30.3 ± 0.9c
Dichloromethane
33.2 ± 0.0e
18.5 ± 0.0c
NONE
23.4 ± 0.3d
Hexane
33.1 ± 0.1e
>50f
NONE
32.4 ± 0.8c
Acarbose*
99.5 ± 0.1a
1.5 ± 0.0a
N.T.
N.T.
Donepezil*
N.T.
N.T.
99.8 ± 0.1a
97.2 ± 1.1a
3.10 Tyrosinase, urease, XO and ACE
Methanol extract had the highest tyrosinase inhibitory activity (Table 9). Ethyl ether, ethanol, dichloromethane, methanol, ethyl acetate, hexane, and acetone extracts exhibited better urease inhibitory activity than thiourea. Only aqueous extract exhibited weaker inhibitory activity than the positive control (Table 9). Acetone extract had the highest XO inhibitory activity, and ethyl ether extract had the highest ACE inhibitory activity. a-h Columns with different superscripts indicate a significant difference (p < 0.05). XO: Xanthine oxidase. ACE: Angiotensin converting enzyme. IC50: Concentration required to inhibit 50% of the enzyme present in the test solution. N.T. indicates not tested. Values are the mean ± standard deviation of three independent experiments.
Extracting solvents
Tyrosinase (%, 1000 μg/mL)
Urease IC50 (μg/mL)
XO (%, 1250 μg/mL)
ACE (%, 500 μg/mL)
Water
3.8 ± 0.3 g
3.2 ± 0.2 h
40.9 ± 0.9d
NONE
Methanol
53.5 ± 1.3b
1.1 ± 0.1d
58.5 ± 5.4c
13.6 ± 0.5f
Ethanol
40.1 ± 1.6c
0.6 ± 0.0b
32.3 ± 0.8e
20.5 ± 0.7e
Acetone
40.2 ± 2.0c
1.7 ± 0.1f
77.4 ± 1.7b
34.6 ± 0.2d
Ethyl acetate
25.7 ± 1.4d
1.1 ± 0.1d
62.0 ± 0.8c
59.4 ± 0.2c
Ethyl ether
20.3 ± 1.7e
0.1 ± 0.0a
27.5 ± 0.4f
93.4 ± 1.4b
Dichloromethane
21.2 ± 1.1e
0.9 ± 0.0c
NONE
NONE
Hexane
16.9 ± 1.1f
1.5 ± 0.1e
NONE
NONE
Thiourea*
N.T.
2.8 ± 0.1 g
N.T.
N.T.
Allopurinol*
N.T.
N.T.
94.7 ± 0.1a
N.T.
Arbutin*
91.1 ± 0.1a
N.T.
N.T.
N.T.
Captopril*
N.T.
N.T.
N.T.
97.8 ± 0.3a
3.11 Stability studies of methanol extract
The results of the stability studies of methanol extract are shown in Figs. 5–7 and Table 10. The pH stability results indicated that the TPheC value and ABTS scavenging ability of methanol extract were stable to changes in the pH, up to pH 9. Only at pH 11, was the TPheC value and ABTS scavenging ability decreased significantly (p < 0.05). The total peak area of the thirteen peaks also greatly decreased (p < 0.05). The thermal stability results showed that the TPheC value and ABTS scavenging ability were stable up to relatively high temperatures. Only with increased time, did the TPheC value and ABTS scavenging ability show a slight downward trend. The same trend was reflected in the total peak area of the thirteen peaks. In vitro digestive stability results indicated that the TPheC value was stable. The total peak area of the thirteen peaks did not vary much. However, a significant decrease (p < 0.05) in the ABTS scavenging ability under stomach conditions was observed but, this ability was somewhat restored under duodenal conditions. a–b Columns with different superscripts indicate a significant difference (p < 0.05).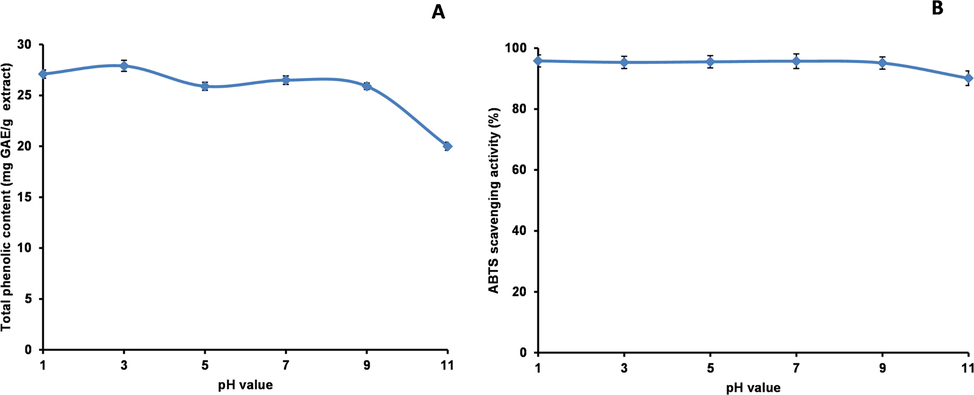
TPheC (A) and ABTS (B) assays to assess the stability of the methanol extract at different pH values (TPheC: Total phenolic content; ABTS: 2,2′-Azino-bis (3-ethylbenzothiazoline-6-sulphonic acid) diammonium salt).
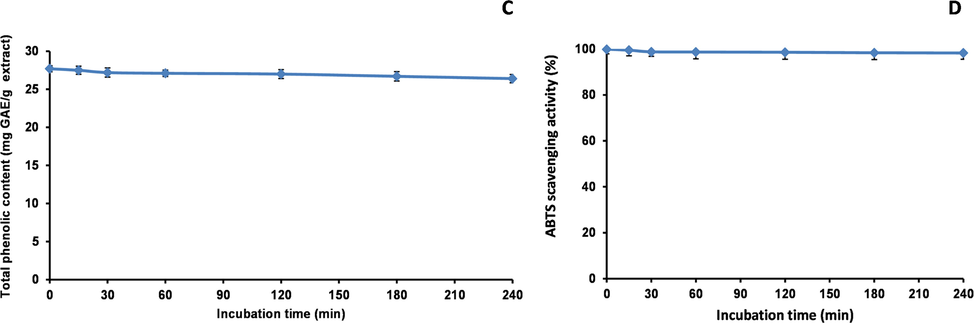
TPheC (C) and ABTS (D) assays to assess the thermal stability of the methanol extract (TPheC: Total phenolic content; ABTS: 2,2′-Azino-bis (3-ethylbenzothiazoline-6-sulphonic acid) diammonium salt).
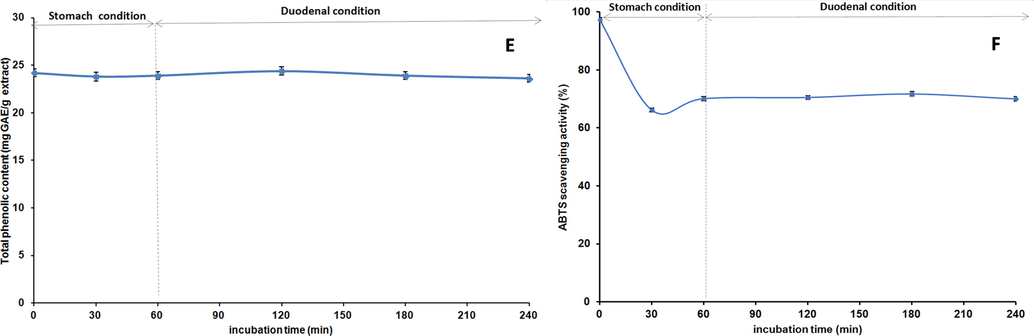
TPheC (E) and ABTS (F) assays to assess the in vitro digestive stability of the methanol extract (TPheC: Total phenolic content; ABTS: 2,2′-Azino-bis (3-ethylbenzothiazoline-6-sulphonic acid) diammonium salt).
Samples
Relative content (%)
Samples
Relative content (%)
Samples
Relative content (%)
pH = 1
1.03 ± 0.07a
Thermal-0 min
1.00 ± 0.05a
Gastrointestinal-0 min
1.00 ± 0.03a
pH = 3
1.07 ± 0.04a
Thermal-15 min
0.99 ± 0.07a
Gastrointestinal-30 min
0.98 ± 0.03a
pH = 5
0.98 ± 0.05a
Thermal-30 min
0.98 ± 0.06a
Gastrointestinal-60 min
0.98 ± 0.05a
pH = 7
1.00 ± 0.04a
Thermal-60 min
0.98 ± 0.05a
Gastrointestinal-120 min
1.02 ± 0.09a
pH = 9
1.01 ± 0.04a
Thermal-120 min
0.98 ± 0.08a
Gastrointestinal-180 min
0.99 ± 0.06a
pH = 11
0.84 ± 0.05b
Thermal-180 min
0.97 ± 0.04a
Gastrointestinal-240 min
0.99 ± 0.06a
Thermal-240 min
0.97 ± 0.08a
3.12 Oxidative stability studies of oils
Fig. 8 shows the K232 and K270 of EVOO (Fig. 8A, C) and CPSO (Fig. 8B, D) over 0–24 h. EVOO-250 showed lower K232 and K270 values compared with those of EVOO-Ctrl and the effect of EVOO-250 was higher than EVOO-BHT and equivalent to EVOO-TBHQ. The K232 and K270 values of CPSO-1000 were slightly higher than those of CPSO-Ctrl. Fig. 9 shows the variation in the acidity of EVOO (Fig. 9A) and CPSO (Fig. 9B) over 0–24 h. EVOO-1000 and CPSO-1000 had lower acidity values than EVOO-Ctrl and CPSO- Ctrl, respectively. Fig. 10 shows the variation in the peroxide values of EVOO (Fig. 10A) and CPSO (Fig. 10B) over 0–24 h. EVOO-250 and CPSO-1000 had lower peroxide values than EVOO-Ctrl and CPSO-Ctrl, respectively.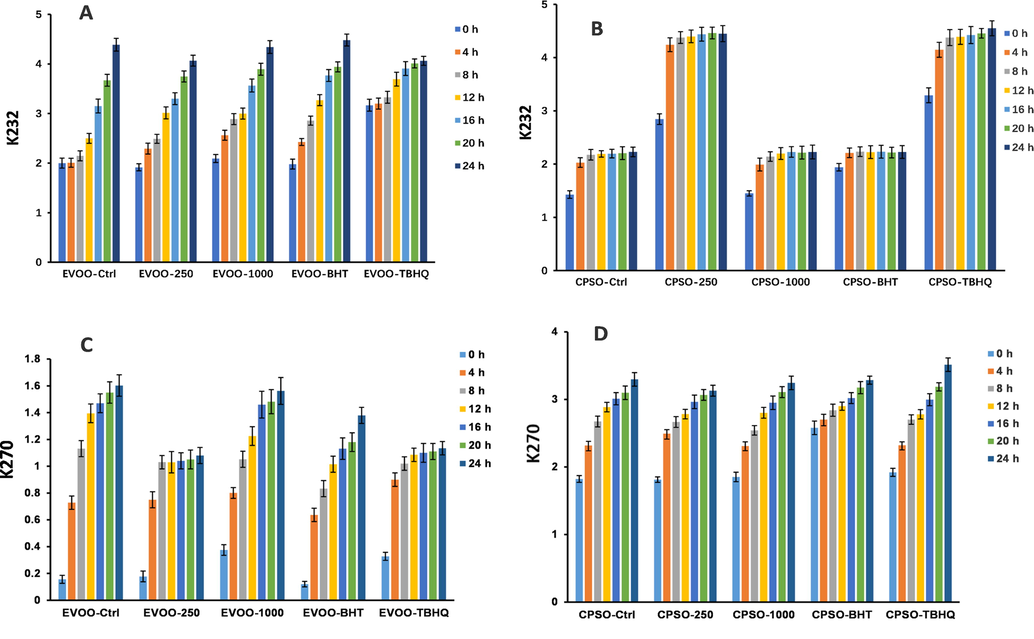
Variations in the levels of conjugated dienes (K232) and trienes (K270) in extra virgin olive oil (EVOO) (A, C) and cold-pressed sunflower oil (CPSO) (B, D) supplemented with the synthetic antioxidants, BHT and TBHQ, and different concentrations of the methanol extract, at 160 °C (BHT: Butylated hydroxytoluene; TBHQ: tertiary butylhydroquinone).
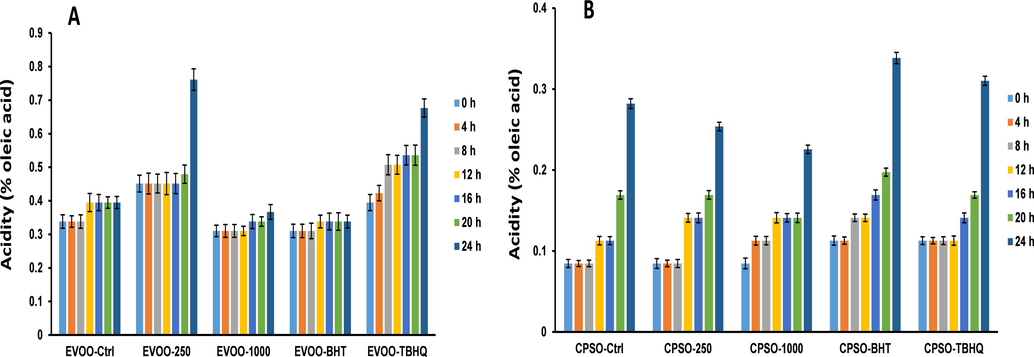
Variations in the levels of acidity values in extra virgin olive oil (EVOO) (A) and cold-pressed sunflower oil (CPSO) (B) supplemented with the synthetic antioxidants, BHT and TBHQ, and different concentrations of the methanol extract, at 160 °C (BHT: Butylated hydroxytoluene; TBHQ: tertiary butylhydroquinone).
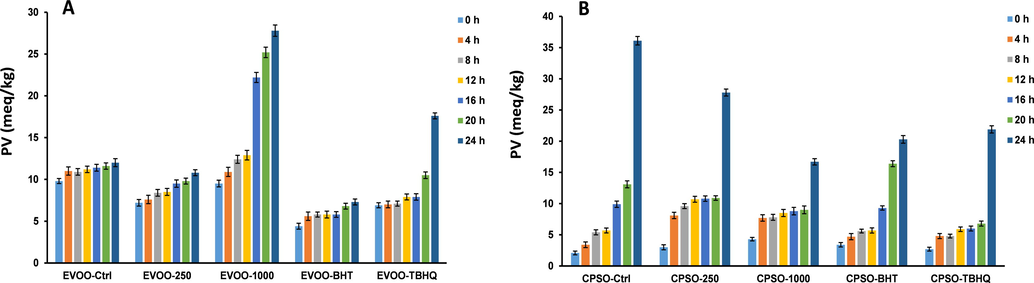
Variations in the levels of peroxide values in extra virgin olive oil (EVOO) (A) and cold-pressed sunflower oil (CPSO) (B) supplemented with the synthetic antioxidants, BHT and TBHQ, and different concentrations of the methanol extract, at 160 °C (BHT: Butylated hydroxytoluene; TBHQ: tertiary butylhydroquinone).
3.13 Cell viability
The cell morphology after cells were treated with methanol extract for 24 and 48 h is shown in Fig. 11. After culture for 24 h, methanol extract showed weak cytotoxicity at the lowest concentration and no cytotoxicity at the other three tested concentrations (Table 11). However, the cytotoxicity increased with increasing culture time. After culture for 48 h, methanol extract showed weak cytotoxicity at four tested concentrations. In conclusion, methanol extract had low cytotoxicity. Under long-term culture conditions, only high concentrations of the extract showed cytotoxicity (Table 11). Therefore, methanol extract of TL is relatively safe and could be considered for use as an antioxidant in oils. a-cColumns with different superscripts indicate a significant difference (p < 0.05). Values are the mean ± standard deviation of five independent experiments.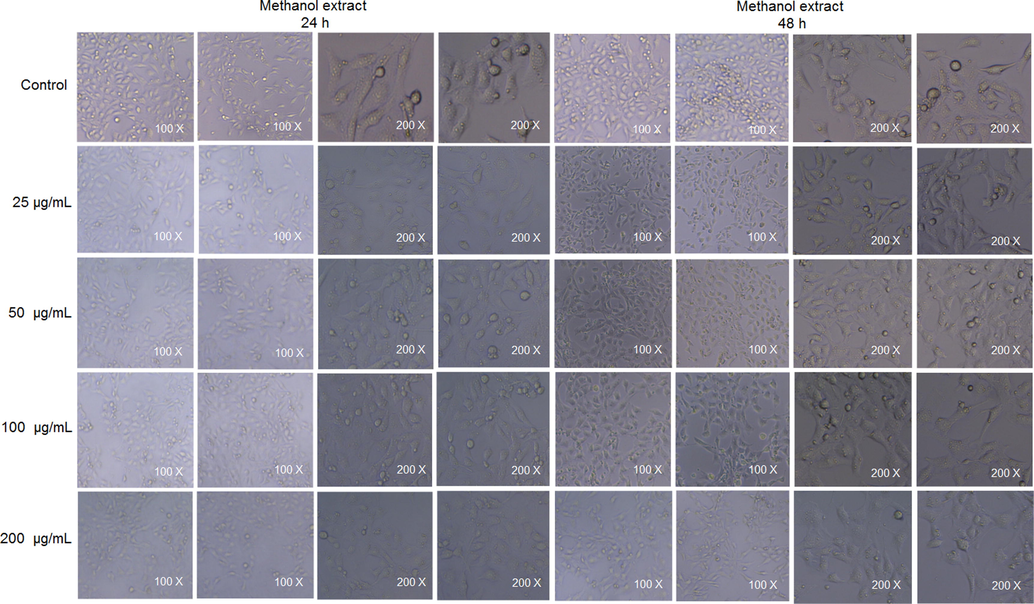
Cell morphology treated with methanol extract for 24 h and 48 h.
Methanol extract (μg/mL)
Cell survival rate of TM3 cells (%)
24 h
48 h
0
100.0 ± 0.7a
100.0 ± 0.6a
25
93.5 ± 1.5b
91.8 ± 0.5b
50
103.2 ± 2.7a
102.0 ± 2.6a
100
101.7 ± 2.4a
95.6 ± 0.9b
200
100.0 ± 1.2a
84.3 ± 1.5c
3.14 Acute oral toxicity
An acute oral toxicity test revealed that the survival rate of mice was 100%; therefore, the toxicity of methanol extract was very low. Methanol extract of Tripleurospermum disciforme and ethanol extract of Tripleurospermum auriculatum were also determined to be safe for cells and mice according to cytotoxicity and acute oral toxicity test results, respectively (Mandegary et al., 2014; Al-Saleem et al., 2018).
4 Discussion
TL is commonly used as folk medicine for the treatment of gastritis. To assess the chemical composition of TL extracts, a sensitive and reliable UPLC-ESI-orbitrap-MS method was used. Nineteen compounds (including isomers) were identified. The extracts contained 10 flavonoids and seven phenolics, sucrose, and one aliphatic hydroxy acid (Table 3). Most of these compounds are well-known antioxidants. Evaluation of the antioxidant capacities of eight solvent extracts showed that the antioxidant activities of different extracts were highly dependent on the contents of these antioxidants (Table 4).
Generally, the TCC value increases with increasing solvent polarity; our data were also largely in accordance with this finding. The TCC values of extracts of methanol, ethanol, and water were very high and different carbohydrates were found in different extracts. Oligo- and polysaccharides were present in aqueous extract. Sucrose was present in ethanol extract. Methanol extract contained mainly sucrose, flavonoid glycosides, and phenolic glycosides (Table 4). Flavonoid glycosides from the genus Tripleurospermum have been obtained using methanol as a solvent (Šibul et al., 2020; Tofighi et al., 2015). Correlations between the TCC value and the antioxidant activity were observed (Fig. 12) and this result indicated that the carbohydrates in methanol extract were flavonoid glycosides.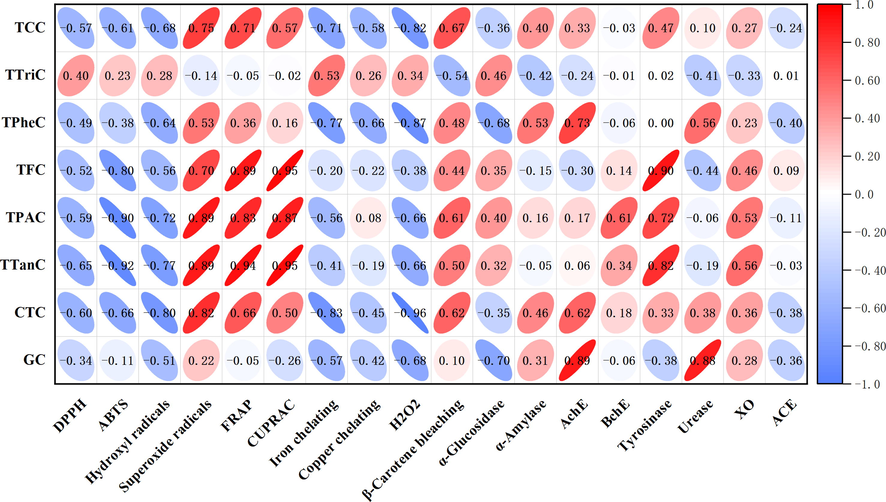
Pearson’s correlation between the total active components and the biological activities.
In general, only aqueous plant extracts contain proteins, because proteins are mainly only soluble in water. However, in addition to aqueous extract, methanol extract of TL also contained proteins. To explain this interesting phenomenon, we carefully investigated the principle of the BCA method. The experimental principle of the BCA method is as follows: under basic conditions, protein reduces Cu2+ to Cu+, and the Cu+ forms a purple-coloured complex with the BCA working solution, where two molecules of BCA chelate one molecule of Cu+. The absorption value of this complex at 562 nm is determined against a standard curve to calculate the protein concentration of a sample (Goldring, 2019). Detergents (such as sodium dodecyl sulfate) at commonly used concentrations do not affect the detection of the complex, but the results are affected by chelators (such as EDTA) and reducing agents (such as mercaptoethanol). Methanol extract was found to have the most antioxidant activity of all the extracts. The large amount of antioxidant/reducing agents in methanol extract affected the results of the BCA assay; thus, the data from the BCA assay, although inaccurate, also illustrated that methanol extract had the highest antioxidant capacity of the extracts. The TProC value of aqueous extract was also overestimated; this was because aqueous extract had the highest iron and copper chelating ability and the presence of chelators can also affect the results of this assay.
Triterpenoids and their glycosides have extensive biological activities and pharmacological effects, especially anti-tumor, anti-inflammatory, and immune regulatory effects (Hill and Connolly, 2020). The solvent has a great influence on the extraction of triterpenoids. Triterpenoids have been previously isolated from a dichloromethane extract of Tripleurospermum disciforme (Ghoran et al., 2020) and this result was in agreement with our experimental results.
Polyphenols found in medicinal plants and tea extracts have been shown to have health benefits. The selection of the extraction solvent is important for the extraction of phenolic compounds. Water and aqueous methanol are the most suitable solvents for extracting the TPheC from plants of the genus Tripleurospermum, such as Tripleurospermum insularum (Ćavar Zeljković et al., 2015) and Tripleurospermum disciforme (Abbasian et al., 2013). Our data were consistent with reference data. Good correlations between the TPheC value and the iron and copper chelating ability, the H2O2 scavenging ability, and the α-glucosidase and AchE inhibitory activities were observed (Fig. 12).
Flavonoids are a class of plant secondary metabolites with a wide range of biological activities. Flavonoids are present in various types of plants, participate in plant growth and reproduction processes, and are also the active components in many plant-based medicines (Zakaryan et al., 2017). Solvents have a great impact on the extraction of the total flavonoids. Extraction using 80% aqueous methanol is the most commonly reported method for extracting the TFC of the genus Tripleurospermum, such as Tripleurospermum insularum (Ćavar Zeljković et al., 2015), or isolating flavonoids from the genus Tripleurospermum, such as Tripleurospermum inodorum (Šibul et al., 2020) and Tripleurospermum disciforme (Tofighi et al., 2015). Using pure methanol as a solvent may lead to the isolation of more flavonoid compounds. In conclusion, our experimental results showed that methanol extract contained 10 flavonoids and had the highest TFC. Ethanol extract had the second highest TFC. This extract did not contain flavonoid glycosides but it did contain many flavonoid aglycones. Good correlations between the TFC value and the FRAP and CUPRAC values and the tyrosinase inhibition were observed (Fig. 12).
The TPAC and CTC values of the methanol, ethanol, and aqueous extracts were very high. This could be attributed to their content of quinic acid derivatives (Table 4). Phenolic acid and condensed tannins have good antioxidant activity (Hou et al., 2021; Jiang et al., 2020), which explains the high antioxidant activity of these three extracts. Good correlations between the TPAC value and ABTS, superoxide radical, FRAP, and CUPRAC inhibition were observed (Fig. 12). Good correlations between the TTanC and CTC values and the antioxidant activity were observed (Fig. 12).
Because of the complexity of the oxidation process, it is impossible to use a single method to evaluate it comprehensively and systematically. Therefore, we designed and performed a set of related experiments to determine the antioxidant capacity of the eight extracts of TL.
In the search for natural and safe free radical scavengers, the evaluation of DPPH and ABTS is considered to be a fast, effective, and inexpensive method. Hydroxyl radical and superoxide radical scavenging ability occurs because of the suppression of hydroxyl radicals and superoxide radicals generated by H2O2 and alkaline DMSO, respectively, in the assays. The assays that measure the scavenging capacity for hydroxyl and superoxide radicals are more relevant than other assays because hydroxyl and superoxide radicals are endogenous radicals. Ferric and cupric ion-reducing capacity and iron and copper chelating activity can reflect the antioxidant capacity. Assays that measure the scavenging capacity for H2O2 and the prevention of β-carotene bleaching can also reflect the antioxidant capacity.
Studies have shown that methanol extract of Tripleurospermum insularum had a good ability to scavenge DPPH (Ćavar Zeljković et al., 2015). Abbasian and colleagues showed, using the FRAP assay, that the aqueous extract of Tripleurospermum disciforme had the strongest scavenging ability of all the tested extracts (Abbasian et al., 2013), and the experimental results of the present study are consistent with these results. Methanol extract of TL showed the highest DPPH, ABTS, hydroxyl radical, and superoxide radical scavenging activities and exhibited the highest antioxidant activity in the FRAP and CUPRAC assays of all the tested extracts. This result is because of the high content of phenolic substances (flavonoids, and phenolic acids) in methanol extract. Ethanol extract of TL showed the best protective effect toward β-carotene which could be attributed to its high apigenin content (Hanfer et al., 2021) (Table 4). This result was also consistent with a previous report (Kumazawa et al., 2004).
A decrease in cholinergic transmission in the basal forebrain caused by low levels of choline has been shown to play a vital role in cognitive impairment associated with Alzheimer's disease (AD) (Pan et al., 2019). Increasing the choline level by inhibiting choline hydrolase can be as a useful therapeutic strategy to improve memory and cognitive ability in AD patients. Most clinically approved drugs to treat AD are cholinesterase inhibitors. The relationship between AD and redox metal imbalance has also been explored to develop possible treatments for AD (Liu et al., 2019) because high concentrations of polyvalent metal cations, such as ferrous and copper ions, have been found in senile plaques in the brains of patients with AD (Miller et al., 2006). Ethanol extract had the highest BchE inhibitory activity because of its high apigenin and isorhamnetin contents, and could be used to treat AD (Dourado et al., 2020, Ogidigo et al., 2021).
The iron chelating activity of the extracts was linked to the AchE inhibitory activity, and the copper chelating activity of the extracts was linked to the BchE inhibitory activity (Fig. 13). Aqueous extract of TL showed the best iron and copper chelating activity, and moderate AChE and BChE inhibitory activity. Therefore, Aqueous extract of TL warrants further study toward the development of a treatment for AD.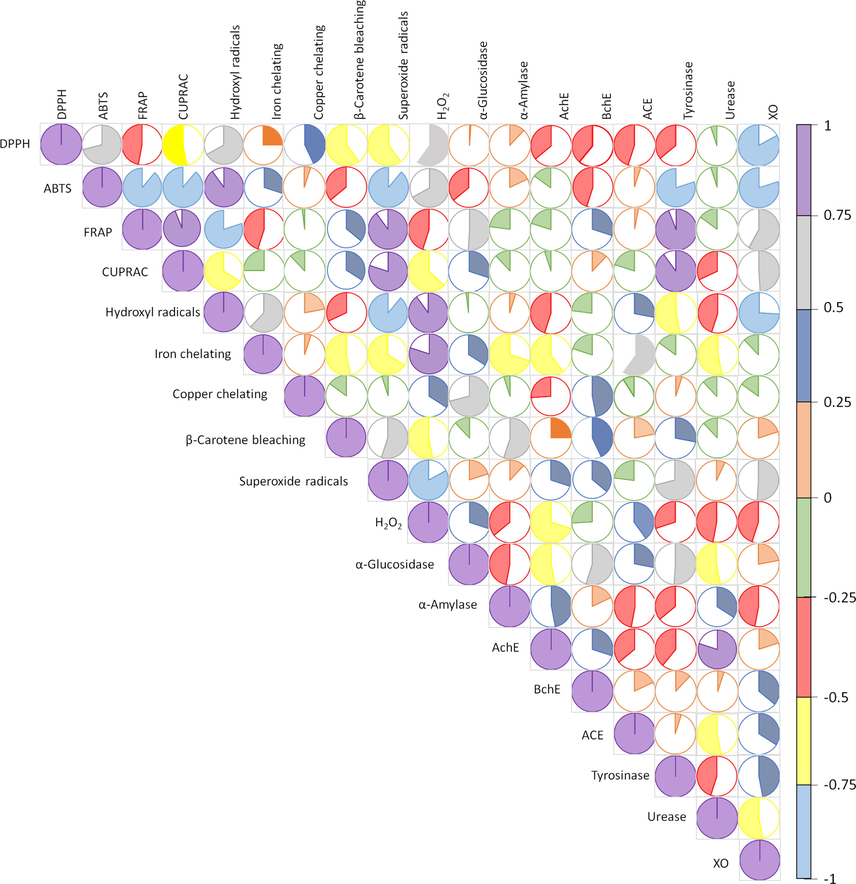
Pearson’s correlation between the biological activities.
The inhibition of the hydrolysis of polysaccharides by pancreatic α-amylase and the subsequent break down to simple glucose by intestinal α-glucosidase is a powerful strategy for the treatment of type II diabetes. However, recent studies have shown that effective inhibition of these two enzymes causes bacterial fermentation of undigested food, which leads to serious GI discomfort (Lakshmana Senthil et al., 2019). Acetone extract of TL had the highest α-amylase and α-glucosidase inhibitory activity, which may provide a basis for the development of new hypoglycemic agents.
Tyrosinase inhibition can be used to treat epidermal diseases associated with pigmentation. Tyrosinase converts L-tyrosine to 3,4-dihydroxyphenylalanine, which is then oxidised to dopamine, and finally converted to melanin (Zhao et al., 2019). Methanol extract of TL contained flavonoids, which have strong tyrosinase inhibitory activity (Şöhretoğlu et al., 2018). Both kaempferol and luteolin, identified by UPLC-MS as being present in methanol extract of TL, have potent tyrosinase inhibitory activity (Kubo et al., 2000). Chlorogenic acid also has high tyrosinase inhibitory activity (Oh et al., 2019).
Urease hydrolyses urea to produce carbon dioxide and ammonia, which results in an increase in the pH value that enables Helicobacter pylori (H. pylori) to effectively settle in the acidic environment of the gastric mucosa. Therefore, the virulence of H. pylori can be controlled by inhibiting urease activity (Stingl and De Reuse, 2005). Hydroxamic acid derivatives, phosphorodiamidates, and imidazoles are urease inhibitors (Amtul et al., 2002). However, although these compounds have good inhibitory activity, their pharmacokinetics, side effects, and toxicity limit their clinical application. In recent years, in the search for new therapies, attention has shifted from synthetic compounds to natural products. The identification of new urease inhibitors from natural sources is being investigated, because compounds from natural sources may have low or no toxicity and good activity and bioavailability (Abu-Izneid et al., 2020).
H. pylori was first isolated from the mucous layer and epithelial cells of the gastric antrum in patients with chronic gastritis. This result indicated that H. pylori is the main cause of gastritis. Therefore, inhibiting the activity of urease can inhibit H. pylori and effectively treat gastritis. All the solvent extracts of TL showed potent urease inhibitory activity. This activity may explain why TL has been used in folk medicine to treat gastritis (Yu et al., 2016). Ethyl ether extract showed the highest urease inhibitory activity because it was rich in the urease inhibitors apigenin (Kalkhorani et al., 2020) and isorhamnetin (Taşkın et al., 2018). In future work, we plan to conduct in-depth research on TL to develop new natural urease inhibitors.
XO oxidises xanthine and hypoxanthine to uric acid. Hyperactivity of XO leads to gout. Currently, gout is treated by decreasing the levels of uric acid with uric acid excretion promoters or uric acid inhibitors (Terkeltaub, 2010). The XO inhibitory activity of the TL extracts was linked to the antioxidant properties (Fig. 13). The extracts of acetone and ethyl acetate showed good XO inhibitory activity and may be useful for gout management.
Hypertension is linked with cardiovascular disease and is a global public health concern. Blood pressure is regulated by many mechanisms, including the ACE activity (Natesh et al., 2003). Therefore, inhibiting ACE is an effective method for the treatment of hypertension. Ethyl ether extract of TL showed excellent ACE inhibitory activity because it was rich in the ACE inhibitors apigenin (Hussain et al., 2018) and isorhamnetin (Tkacz et al., 2020).
The antioxidant activity of plant extracts has been the focus of much scientific research; however, there is little information regarding the effects of GI digestion, pH, and heat on the plant extracts. In the process of GI digestion, a variety of bioactive components will be released from the food matrix. A key factor determining the effectiveness of dietary antioxidants is their stability under GI conditions. In addition, changes in temperature and pH may cause changes in the structure and thus, the activity of antioxidants.
The content of various active components in methanol extract was very high and this extract had the highest antioxidant activity of the extracts. Thus, methanol extract was selected for further stability studies. Previous studies have shown the effect of acidic conditions on the hydrolysis of compounds (Mihailović et al. 2015), such as the cleavage of sugar moieties connected to phenolic compounds. In the experimental results, the peak areas of several flavonoid glycosides were greatly reduced, while the peak areas of several flavonoid aglycones were greatly increased, which may explain why methanol extract had high TPheC values and high antioxidant activity at pH 1 and 3. Strong alkaline conditions destroy phenolic components, including flavonoids, and oxidise compounds containing ortho-diphenol hydroxyl groups. These changes reduced the peak areas for these compounds, and this may explain the poor performance of methanol extract at pH 11. The results showed that 4 h at high temperature did not lead to the degradation of antioxidants in methanol extract. The in vitro digestive stability results indicated that the high TPheC values under stomach conditions were because the acidic environment is conducive to the dissolution of phenolic components, and this was consistent with literature reports (Mihailović et al. 2015) and our experimental results. However, excessive acidity under stomach conditions had a significant influence on the assay using ABTS.
Frying is one of the most popular cooking methods in the world. Fried food has particular sensory characteristics that are desired by consumers. In addition, frying can reduce the cooking time (Casal et al., 2010). The high temperatures used in the frying process can cause chemical changes in the oils used, mainly involving oxidation, polymerization, and hydrolysis (Marmesat, et al., 2012), which can shorten the shelf life and directly affect the quality of fried food. Adding antioxidants improves the stability of the oils, but there are risks and hazards with using synthetic antioxidants (Xu et al., 2021b). Therefore, the use of safe antioxidants from natural sources is desirable.
Evaluation of the peroxide and acidity values are widely used methods to track the primary oxidation state of oils. The K232 and K270 values are indicators of lipid primary and secondary oxidation (Malheiro et al., 2013). The higher the K232 and K270 values, the lower the oxidation stability of the oils (Sultana et al., 2007).
Combining the results of the four evaluation methods, we found that adding a small dose of methanol extract of TL to EVOO had a good antioxidant effect, and a greater effect was observed with EVOO-250 than with EVOO-1000. However, the opposite result was found for CPSO. EVOO is rich in the monounsaturated fatty acid, oleic acid, which is stable and not easily oxidised. EVOO also contains antioxidants, such as hydroxytyrosol, which is a powerful antioxidant that can treat many diseases (Pastor et al., 2021). CPSO is rich in the polyunsaturated fatty acid, linoleic acid, which is unstable and easily oxidised. The low antioxidant content of CPSO is another reason why methanol extract had a different effect in CPSO compared with EVOO.
Interestingly, the acidity of EVOO-TBHQ was higher than that of EVOO-Ctrl, the K232 value of CPSO-TBHQ was higher than that of CPSO-Ctrl, and the acidity of CPSO-BHT was higher than that of CPSO-Ctrl. The synthetic antioxidants showed the effect of promoting oxidation. Several reports have indicated that antioxidants show antioxidant activity at low doses but promote oxidation at high doses (Martin-Rubio et al., 2018; Giordano et al., 2020). High temperatures can also promote oxidation.
Using the univariate statistical method, there were statistically significant differences between the samples, p values < 0.05 were considered to be significant for all evaluated content determination and biological activities assessed separately. However, multiple comparison analysis using least significant difference (LSD) post hoc analysis showed that some samples exhibited equal content and activities against some content determination and biological activities. Thus, the samples were classified using their content determination and biological activities similarities and the dataset was submitted to principal component analysis (PCA). The results are reported in Fig. 14.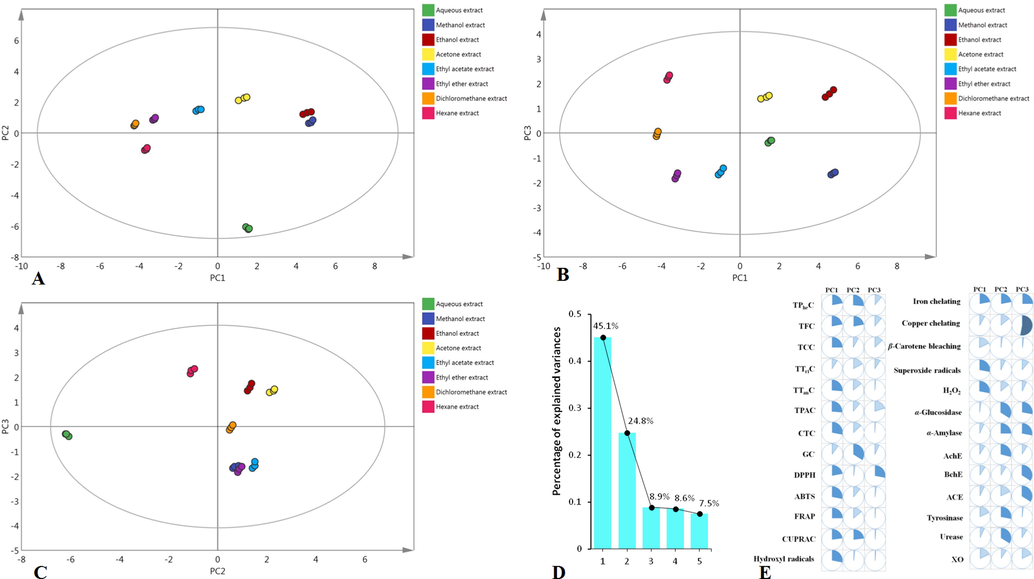
Exploratory multivariate analysis with principal component analysis. Projection of samples into the subspace: (A) PC1 vs. PC2; (B) PC1 vs, PC3; and (C) PC2 vs. PC3. Variance explained by each principal component (D). Contribution of biological activities to the principal component construction (E).
Three principal components (PCs) explaining 78.8% of the data variance were obtained (Fig. 14D). The contributions of the content determination and biological activities to the three selected PCs are shown in Fig. 14E.
PC1 summarised 45.1% of the data variance and distinguished samples according to content determination and antioxidant properties. The values for PC2 and PC3, representing other variability sources (enzyme inhibitory activity and metal chelating ability), were 24.8% and 8.9%, respectively. Analysis of the factorial maps (Fig. 14A, B, & C) indicated that methanol and ethanol extracts were discriminated from the other extracts. Combined with the data for the content of all active components and the biological activity results, methanol extract was determined as the key research object.
In addition, the separation between the other samples was not very good, so it was difficult to interpret the results. Therefore, the results of PCA were applied to hierarchical cluster analysis. The analysis performed on the first three PCs of PCA showed six clusters (Fig. 15).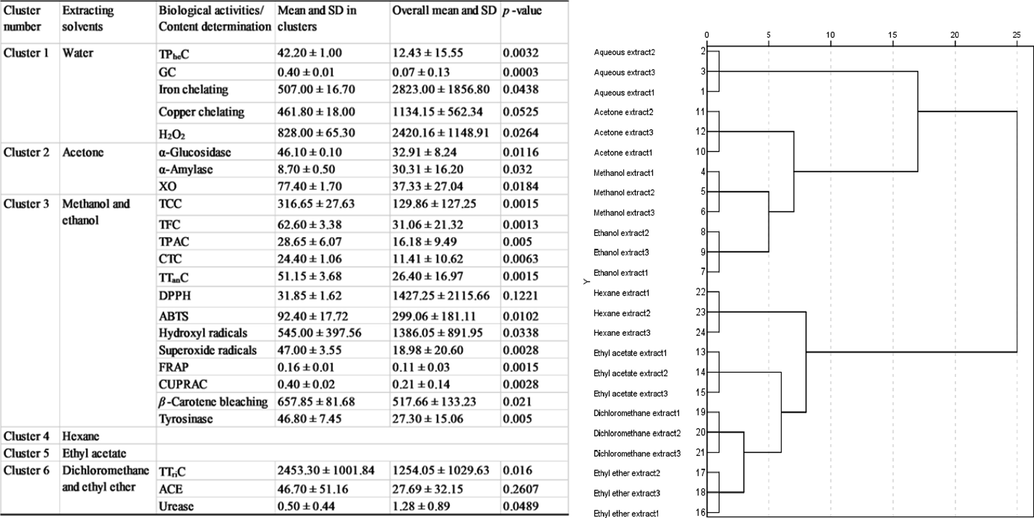
Hierarchical clustered analysis (Euclidean distance, Ward linkage) using the results of PCA, considering the first three principal components.
The first cluster, which was aqueous extract, displayed the highest TPheC and GC values and highest metal chelating, and H2O2 scavenging activity. The second cluster, which was acetone extract, displayed the best diabetes management and XO inhibition. The third cluster, composed of extracts of methanol and ethanol, displayed high TCC, TFC, TPAC, CTC, and TTanC values and high antioxidant activity and tyrosinase inhibition. The fourth cluster was represented by hexane extract. The fifth cluster was ethyl acetate extract. The sixth cluster, which contained extracts of dichloromethane and ethyl ether, displayed the highest TTriC value and highest ACE and urease inhibition.
5 Conclusion
Because TL has received little scientific attention, its chemical composition, antioxidant activity, enzyme inhibitory activity, and cytotoxicity are not known. The current work filled these knowledge gaps. The results of phytochemical analysis showed that TL contained 11 types of phytochemicals. Nineteen compounds were identified, including ten flavonoids, seven phenolics, sucrose, and one aliphatic hydroxy acid, for first time in this plant. Of the eight solvent extracts prepared, aqueous, methanol, and ethanol extracts had strong antioxidant activity because they had a high content of antioxidants. Acetone extract showed high hypoglycemic and anti-gout activity. Ethyl ether extract was a good urease and ACE inhibitor. Methanol extract showed good stability and low toxicity, and has the potential for use as a stabiliser for olive and sunflower seed oils.
Funding
This work was supported by Jilin Provincial Science and Technology Department [grant No. 202002019JC]; and Administration of Traditional Chinese Medicine of Jilin Province [grant No. 2021102].
CRediT authorship contribution statement
Meihua Chen: Methodology, Data curation, Investigation. Xu He: Methodology, Software, Investigation. Hui Sun: Methodology, Investigation. Yue Sun: Investigation. Li Li: Conceptualization, Animal experiment. Junyi Zhu: Supervision. Guangqing Xia: Conceptualization, Methodology, Supervision. Xin Guo: Writing – original draft, Supervision. Hao Zang: Conceptualization, Methodology, Software, Writing – review & editing.
Acknowledgment
We thank Victoria Muir, PhD, from Liwen Bianji, (Edanz) (www.liwenbianji.cn/), edited the English text of a draft of this manuscript. We thank Professor Junlin Yu from Tonghua Normal University for the collection and identification of the Tripleurospermum limosum.
Declaration of Competing Interest
The authors declare that they have no known competing financial interests or personal relationships that could have appeared to influence the work reported in this paper.
References
- Antioxidant properties of different black tea samples and some iranian native plants. Pharm. Globale.. 2013;4(2):1-5.
- [Google Scholar]
- Urease inhibitory potential of extracts and active phytochemicals of Hypochaeris radicata (Asteraceae) Nat. Prod. Res.. 2020;34(4):553-557.
- [CrossRef] [Google Scholar]
- Phenolic, flavonoid content and radical scavenging activity of Smilax china with its inhibitory potential against clinically important enzymes. Nat. Prod. Res.. 2021;35:2066-2071.
- [CrossRef] [Google Scholar]
- Phytochemical standardization and biological activities of certain desert plants growing in Saudi Arabia. Saudi Pharm. J.. 2018;26(2):198-204.
- [CrossRef] [Google Scholar]
- Ethnomedicinal studies on the plant resources of east Anatolia. Turkey. Procedia Soc. Behav. Sci.. 2011;19:756-777.
- [CrossRef] [Google Scholar]
- Screening of Iranian plants for antifungal activity, Part 1, Daru. J. Pharm. Sci.. 2002;10(1):9-16.
- [Google Scholar]
- Chemical composition and biological activities of the essential oils from three Melaleuca species grown in Tunisia. Int. J. Mol. Sci.. 2012;13(12):16580-16591.
- [CrossRef] [Google Scholar]
- Chemistry and mechanism of urease inhibition. Curr. Med. Chem.. 2002;9(14):1323-1348.
- [CrossRef] [Google Scholar]
- Synthesis, biological assay in vitro and molecular docking studies of new Schiff base derivatives as potential urease inhibitors. Eur. J. Med. Chem.. 2011;46:5473-5479.
- [CrossRef] [Google Scholar]
- Inhibition of carregeenan-induced edema by Tripleurospermum disciforme extracts in rats. Pak. J. Biol. Sci.. 2007;10(13):2237-2240.
- [CrossRef] [Google Scholar]
- Generic monograph of the Asteraceae-Anthemideae. Bulletin of the Natural History Museum. Botany series.. 1993;23:71-177.
- [Google Scholar]
- An ethnobotanical survey of medicinal plants in Sivrice (Elazığ-Turkey) J. Ethnopharmacol.. 2010;132:165-175.
- [CrossRef] [Google Scholar]
- Olive oil stability under deep-frying conditions. Food Chem. Toxicol.. 2010;48(10):2972-2979.
- [CrossRef] [Google Scholar]
- Evaluation of chemical profile and antioxidant activity of Tripleurospermum insularum, a new species from Turkey. Nat. Prod. Res.. 2015;29(3):293-296.
- [CrossRef] [Google Scholar]
- Neuroimmunomodulatory and Neuroprotective Effects of the Flavonoid Apigenin in in vitro Models of Neuroinflammation Associated With Alzheimer's Disease. Front. Aging Neurosci.. 2020;12:119.
- [CrossRef] [Google Scholar]
- European Union Commission Regulation EEC., 1991. On the characteristics of olive oil and olive-residue oil and on the relevant methods of analysis. Offic. J. Eur. Communities. L248, 1–89.
- A New Italian Purple Corn Variety (Moradyn) Byproduct Extract: Antiglycative and Hypoglycemic In Vitro Activities and Preliminary Bioaccessibility Studies. Molecules.. 2020;25(8):1958.
- [CrossRef] [Google Scholar]
- Saponin determination, expression analysis and functional characterization of saponin biosynthetic genes in Chenopodium quinoa leaves. Plant Sci.. 2016;250:188-197.
- [CrossRef] [Google Scholar]
- Flora of China Editorial Committee of Chinese Academy of Sciences., 1983. The flora of China. Volume 76, Beijing: Science Press, pp. 53–55.
- Cytotoxic constituents and molecular docking study of the active triterpenoids from Tripleurospermum disciforme (C. A. Mey.) Schultz-Bip. Jundishapur J. Nat. Pharm. Prod.. 2020;15(2):e65760.
- [CrossRef] [Google Scholar]
- Concentration dependence of the antioxidant and prooxidant activity of yrolox in HeLa cells: involvement in the induction of apoptotic volume decrease. Antioxidants.. 2020;9(11):1058.
- [CrossRef] [Google Scholar]
- Measuring protein concentration with absorbance, lowry, bradford coomassie blue, or the smith bicinchoninic acid assay before electrophoresis. Methods Mol. Biol.. 2019;1855:31-39.
- [CrossRef] [Google Scholar]
- Phytochemical profiling and antioxidant, enzyme-inhibitory, and toxic activities of extracts from Adonis ramosa Franch. Nat. Prod. Res. 2022
- [CrossRef] [Google Scholar]
- Chemical constituents, in vitro anti-inflammatory, antioxidant and hemostatic activities of the n-butanol extract of Hyacinthoides lingulata (Poir.) Rothm. Nat. Prod. Res.. 2021;14:1-5.
- [CrossRef] [Google Scholar]
- Hooper, D., Field, H., Dahlgrey, B.E., 1937. Useful plants and drugs of Iran and Iraq. Field Museum of Natural History. Vol. 9, no. 3. Chicago. pp. 84–180.
- Variations in phenolic acids and antioxidant activity of navel orange at different growth stages. Food Chem.. 2021;360:129980.
- [CrossRef] [Google Scholar]
- Identification of Hypotensive Biofunctional Compounds of Coriandrum sativum and Evaluation of Their Angiotensin-Converting Enzyme (ACE) Inhibition Potential. Oxid. Med. Cell. Longev.. 2018;2018:4643736.
- [CrossRef] [Google Scholar]
- Identification of secondary metabolites in Averrhoa carambola L. bark by high-resolution mass spectrometry and evaluation for α-glucosidase, tyrosinase, elastase, and antioxidant potential. Food Chem.. 2020;332:127377.
- [CrossRef] [Google Scholar]
- LC-MS/QTOF identification of phytochemicals and the effects of solvents on phenolic constituents and antioxidant activity of baobab (Adansonia digitata) fruit pulp. Food Chem.. 2019;277:279-288.
- [CrossRef] [Google Scholar]
- Identification of phenolic compounds in fruits of Ribes stenocarpum Maxim. By UHPLC-QTOF/MS and their hypoglycemic effects in vitro and in vivo. Food Chem.. 2021;344:128568.
- [CrossRef] [Google Scholar]
- Jiang, Y. R., Zhang, H, Qi., X. G., Wu, G. C., 2020. Structural characterization and antioxidant activity of condensed tannins fractionated from sorghum grain. J. Cereal Sci. 92, 102918.
- Kalkhorani, M., Hadjiakhoondi, A., Yassa, N., Amin, M., Damankash, S. B., Moradkhani, F., Vazirian, M., 2020. Bio-guided Fractionation of Centaurea bruguierana subsp. belangeriana Extract Based on Anti-Helicobacter pylori Activity. Res. J. Pharmacogn. 7, 1, 59–65. http://doi.org/10.22127/rjp.2019.206080.1529.
- Novel Phenolic Constituents of Pulmonaria officinalis L. LC-MS/MS Comparison of Spring and Autumn Metabolite Profiles. Molecules.. 2018;23(9):2277.
- [CrossRef] [Google Scholar]
- Flavonols from Heterotheca inuloides: tyrosinase inhibitory activity and structural criteria. Bioorg. Med. Chem.. 2000;8(7):1749-1755.
- [CrossRef] [Google Scholar]
- Antioxidant activity of propolis of various geographic origins. Food Chem.. 2004;84(3):329-339.
- [CrossRef] [Google Scholar]
- A feasible UHPLC-MS/MS method for concurrent quantification of 10 bioactive principles in Aquilaria leaf tea by the multiple reaction monitoring analytical mode. Phytochem. Anal.. 2020;31(5):583-593.
- [CrossRef] [Google Scholar]
- In vitro and in silico inhibition properties of fucoidan against α-amylase and α-D-glucosidase with relevance to type 2 diabetes mellitus. Carbohydr. Polym.. 2019;209:350-355.
- [CrossRef] [Google Scholar]
- Dioscin: a synergistic tyrosinase inhibitor from the roots of Smilax china. Food Chem.. 2012;134(2):1146-1148.
- [CrossRef] [Google Scholar]
- The necessity of walnut proteolysis based on evaluation after in vitro simulated digestion: ACE inhibition and DPPH radical-scavenging activities. Food Chem.. 2020;311:125960.
- [CrossRef] [Google Scholar]
- Comparative analysis of phytochemical profile, antioxidant and anti-inflammatory activity from Hibiscus manihot L. flower. Arabian J. Chem.. 2022;15:103503.
- [Google Scholar]
- Metal ions in Alzheimer's disease: a key role or not? Acc. Chem. Res.. 2019;52(7):2026-2035.
- [CrossRef] [Google Scholar]
- Effect of olive leaves addition during the extraction process of overmature fruits on olive oil quality. Food Bioprocess Technol.. 2013;6(2):509-521.
- [CrossRef] [Google Scholar]
- Anticholinesterase, antioxidant, and neuroprotective effects of Tripleurospermum disciforme and Dracocephalum multicaule. J. Ayurveda Integr. Med.. 2014;5(3):162-166.
- [CrossRef] [Google Scholar]
- Influence of fatty acid composition on chemical changes in blends of sunflower oils during thermoxidation and frying. Food Chem.. 2012;135(4):2333-2339.
- [CrossRef] [Google Scholar]
- Prooxidant effect of α-tocopherol on soybean oil. Global monitoring of its oxidation process under accelerated storage conditions by 1H nuclear magnetic resonance. Food Chem.. 2018;245:312-323.
- [CrossRef] [Google Scholar]
- Comparative phytochemical analysis of Gentiana cruciata L. roots and aerial parts, and their biological activities. Ind. Crops Prod.. 2015;73:49-62.
- [CrossRef] [Google Scholar]
- Synchrotron-based infrared and X-ray imaging shows focalized accumulation of Cu and Zn co-localized with β-amyloid deposits in Alzheimer’s disease. J. Struct. Biol.. 2006;155(1):30-37.
- [CrossRef] [Google Scholar]
- Phenolic contents and bioactive potential of peach fruit extracts. Food Chem.. 2016;202:212-220.
- [CrossRef] [Google Scholar]
- Phenolic Analysis and In Vitro Biological Activity of Red Wine, Pomace and Grape Seeds Oil Derived from Vitis vinifera L. cv Montepulciano d'Abruzzo. Antioxidants. 2021;10(11):1704.
- [CrossRef] [Google Scholar]
- Assessing chemical constituents of Mimosa caesalpiniifolia stem bark: possible bioactive components accountable for the cytotoxic effect of M. caesalpiniifolia on human tumour cell lines. Molecules. 2015;20(3):4204-4224.
- [CrossRef] [Google Scholar]
- The polyphenolics and carbohydrates as indicators of botanical and geographical origin of Serbian autochthonous clones of red spice paprika. Food Chem.. 2017;217:705-715.
- [CrossRef] [Google Scholar]
- Crystal structure of the human angiotensin-converting enzyme-lisinopril complex. Nature. 2003;421(6922):551-554.
- [Google Scholar]
- Xanthine oxidase inhibitory activity of Vietnamese medicinal plants. Biol. Pharm. Bull.. 2004;27(9):1414-1421.
- [CrossRef] [Google Scholar]
- UPLC-PDA-ESI-QTOF-MS/MS fingerprint of purified flavonoid enriched fraction of Bryophyllum pinnatum; antioxidant properties, anticholinesterase activity and in silico studies. Pharm. Biol.. 2021;59(1):444-456.
- [CrossRef] [Google Scholar]
- Tyrosinase Inhibition Antioxidant Effect and Cytotoxicity Studies of the Extracts of Cudrania tricuspidata Fruit Standardized in Chlorogenic Acid. Molecules. 2019;24(18):3266.
- [CrossRef] [Google Scholar]
- Dual functional cholinesterase and PDE4D inhibitors for the treatment of Alzheimer's disease: Design, synthesis and evaluation of tacrine-pyrazolo[3,4-b]pyridine hybrids. Bioorg. Med. Chem. Lett.. 2019;29(16):2150-2152.
- [CrossRef] [Google Scholar]
- The study of analgesic effects and acute toxicity of Tripleurospermum disciforme in tats by formalin test. Toxicol. Mech. Methods.. 2007;17(9):575-580.
- [CrossRef] [Google Scholar]
- Beneficial effects of dietary supplementation with olive oil, oleic acid, or hydroxytyrosol in metabolic syndrome: Systematic review and meta-analysis. Free Radical Biol. Med.. 2021;172:372-385.
- [CrossRef] [Google Scholar]
- Novel (thio) barbituric-phenoxy-N-phenylacetamide derivatives as potent urease inhibitors: synthesis, in vitro urease inhibition, and in silico evaluations. Struct. Chem.. 2021;32:37-48.
- [CrossRef] [Google Scholar]
- Evaluation of polyphenolic compounds in membrane concentrated pistachio hull extract. Food Chem.. 2019;277:398-406.
- [CrossRef] [Google Scholar]
- Chemical composition and biological activities of endemic Tripleurospermum conoclinium (Boiss. & Balansa) Hayek essential oils. Flavour. Fragrance J.. 2020;35(6):713-721.
- [CrossRef] [Google Scholar]
- Tyrosinase inhibition by some flavonoids: Inhibitory activity, mechanism by in vitro and in silico studies. Bioorg. Chem.. 2018;81:168-174.
- [CrossRef] [Google Scholar]
- Staying alive overdosed: how does Helicobacter pylori control urease activity? Int. J. Med. Microbiol.. 2005;295(5):307-315.
- [CrossRef] [Google Scholar]
- Sultana, B., Anwar, F., Przybylski, R., 2007. Antioxidant potential of corncob extracts for stabilization of corn oil subjected to microwave heating. Food Chem. 104, 3, 997–1005. http://doi.org/10.1016/j.foodchem.2006.12.061.
- Phenolic composition and biological properties of Achillea nobilis L. subsp neilreichii (Kerner) Formanek. Ind. Crops Prod.. 2018;111:555-562.
- [CrossRef] [Google Scholar]
- Update on gout: new therapeutic strategies and options. Nat. Rev. Rheumatol.. 2010;6(1):30-38.
- [CrossRef] [Google Scholar]
- UPLC-PDA-Q/TOF-MS profiling of phenolic and carotenoid compounds and their influence on anticholinergic potential for AChE and BuChE inhibition and on-line antioxidant activity of selected Hippophaë rhamnoides L. cultivars. Food Chem.. 2020;309:125766
- [CrossRef] [Google Scholar]
- Antimicrobial activities of three medicinal plants and investigation of flavonoids of Tripleurospermum disciforme. Iran. J. Pharm. Res.. 2015;14(1):225-231.
- [Google Scholar]
- Elucidation of aroma-active compounds and chlorogenic acids of Turkish coffee brewed from medium and dark roasted Coffea arabica beans. Food Chem.. 2021;338:127821.
- [CrossRef] [Google Scholar]
- Chemical composition and biological activities of an essential oil from the aerial parts of Artemisia Gmelinii weber ex Stechm. Nat. Prod. Res.. 2021;35(2):346-349.
- [CrossRef] [Google Scholar]
- Herbal Drugs and Phytopharmaceuticals. Stuttgart: Medpharm Scientific Publishers; 2004. p. :322. Third Edition.
- Synthetic phenolic antioxidants: Metabolism, hazards and mechanism of action. Food Chem.. 2021;353:129488.
- [CrossRef] [Google Scholar]
- Early detection of Huanglongbing with EESI-MS indicates a role of phenylpropanoid pathway in citrus. Anal. Biochem.. 2022;639:114511.
- [CrossRef] [Google Scholar]
- GC-MS analysis of chloroform extracts in flowers, stems and roots of Tripleurospermum callosum. Pharm. Biol.. 2005;43(2):108-112.
- [CrossRef] [Google Scholar]
- Identification and Characterization of Major Constituents in Different-Colored Rapeseed Petals by UPLC-HESI-MS/MS. J. Agric. Food Chem.. 2019;67(40):11053-11065.
- [CrossRef] [Google Scholar]
- Yu, J.L., Hu, Y.W., Zhang, L.Q, Sun, R.S., Xiao, J.L., Jia, A.L., 2016. Color atlas of medicinal plants in Jilin Province. Jilin: Jilin Science and Technology Press. Vol. 2, pp. 356–356.
- Flavonoids: promising natural compounds against viral infections. Arch. Virol.. 2017;162(9):2539-2551.
- [CrossRef] [Google Scholar]
- HPLC-MS/MS profiling of wild-growing scentless chamomile. Acta Chromatogr.. 2020;32(2):86-94.
- [CrossRef] [Google Scholar]
- Antioxidant and enzyme-inhibitory activity of extracts from Erigeron annuus flower. Ind. Crops Prod.. 2020;148:112283.
- [CrossRef] [Google Scholar]
- Synthesis and anti-tyrosinase mechanism of the substituted vanillyl cinnamate analogues. Bioorg. Chem.. 2019;93:103316.
- [CrossRef] [Google Scholar]
Appendix A
Supplementary data
Supplementary data to this article can be found online at https://doi.org/10.1016/j.arabjc.2022.103797.
Appendix A
Supplementary data
The following are the Supplementary data to this article:Supplementary data 1
Supplementary data 1


